Standard Deduction & Itemized Deductions Adjustments From AGI.

PUBLIC VERSION
0 ENERCON MTW Decommissioning Cost Estimate
Decommissioning Cost Estimate
Prepared for:
Honeywell Metropolis Works2768 North US State Route 45
Metropolis, IL 62960
Honeywell
Prepared by:
ENERCON4490 Old William Penn Highway
Murrysville, PA 15668
Rev. 0August 15, 2012
4 ~ c ~
Prepared by: Date: 8/15/2012
LJtv-Q,,,J Date: 8/15/2012Reviewed by:
Approved by: Date: 8/15/2012Approved by: Date: 8/15/2012

0j ENERCON MTW Decommissioning Cost Estimate
TABLE OF CONTENTS
1.0 INTRODUCTION ......................................................................................................................... 1
1. 1 P urp o se ................................................................................................................................... 1
1.2 S cop e ...................................................................................................................................... 2
1.3 Assumptions and Bases ..................................................................................................... 2
2.0 MTW LOCATION, HISTORY, AND CURRENT STATUS .............................................. 4
2.1 M TW Location and Description ...................................................................................... 4
2.2 M TW History ......................................................................................................................... 4
2.3 M TW Physical Description .............................................................................................. 4
2.3.1 M ain Production and Plant Operations Buildings ................................................ 5
2.3.2 M iscellaneous Production Buildings ......................................................................... 5
2.3.3 Drum Storage Pads and Ponds ............................................................................... 5
2.3.4 Outdoor Areas, Drains, and Sewers ...................................................................... 5
2.3.5 Calcium Fluoride Ponds ........................................................................................ 5
2.4 M TW Process Operations .................................................................................................. 5
2.4.1 UF6 Conversion Process Flow Diagram ................................................................. 6
2.4.2 Ore Preparation ....................................................................................................... 6
2.4.3 Uranium Reduction ................................................................................................ 7
2.4.4 Uranium Hydrofluorination .................................................................................... 7
2.4.5 Uranium Hexafluoride Distillation ........................................................................ 8
2.4.6 UF6 Cylinder Cleaning .......................................................................................... 8
2.4.6.1 Fluorine Production .............................................................................................. 9
2.4.7 Plant and Non-Plant Area Delineation .................................................................... 9
3.0 ASSESSMENT OF PLANT RADIOLOGICAL CONDITIONS ....................................... 11
3.1 Radiological Criteria for License Termination .................................................................... I 1
3.2 Prior Assessment of Plant Radiological Conditions ....................................................... 12
ii Rev. 0

E N E R C ON MTW Decommissioning Cost Estimate
3.3 Identification of Potential Radionuclides of Concern ..................................................... 13
3.4 Characterization Data for Prior Assessments of Radiological Conditions ...................... 14
3.4.1 Main Production Buildings .................................................................................. 14
3.4.2 Miscellaneous Production Buildings ................................................................... 15
3.4.3 Drum Storage Pads & Ponds ............................................................................... 15
3.4.4 Outdoor Areas, Drains & Sewers ........................................................................ 15
3.4.5 Administrative Areas ........................................................................................... 16
3.4.6 Calcium Fluoride Ponds B through E ................................................................. 16
4.0 2009 DECOMMISSIONING COST ESTIMATION METHODS ..................................... 20
4.1 Cost Modifying Factors ................................................................................................. 21
4.2 Radiological Waste Volume Estimates .......................................................................... 22
4.3 Radiological Waste Disposal Cost .................................................................................. 22
4.3.1 EnergySolutions of Utah Disposal Costs ............................................................ 22
4.3.2 Waste Processing/Burial Costs ............................................................................. 25
4.4 Remediation Methods .................................................................................................... 25
4.5 Radiological Waste Volume Reduction Costs ................................................................. 26
4.6 U nit C osts ............................................................................................................................. 28
4.7 Cost Escalation Factor .................................................................................................... 29
4.8 Final Surveys ............................................................................................................ . 29
5.0 DESCRIPTION OF THE DECOMMISSIONING PROCESS ......................................... 30
5.1 Characterization Survey .................................................................................................. 30
5.2 R em ediation ......................................................................................................................... 30
5.2.1 Main Production Buildings .................................................................................. 32
5.2.2 Miscellaneous Production Buildings ................................................................... 32
5.2.3 Drum Storage Pads and Uranium Settling Ponds ................................................ 32
5.2.4 Outdoor Areas, Drains and Sewers ...................................................................... 33
iii Rev. 0

E NENERCO N MTW Decommissioning Cost Estimate
5.2.5 A dm inistrative A reas ........................................................................................... 33
5.2.6 Calcium Fluoride Ponds ...................................................................................... 34
5.3 License Term ination Surveys ......................................................................................... 34
5.3.1 Survey Instrum entation ......................................................................................... 34
6.0 REFER EN CES ............................................................................................................................. 35
TABLES
Table 2-1: Listing of Plant and Non-Plant Areas .................................................................................... 9Table 3-1: Acceptable Surface Contamination Levels ........................................................................... 12Table 4-1: Decommissioning Cost Summary - Honeywell Facility ....................................................... 2Table 4-2: Personnel Protective Equipment Protection Summary ........................................................ 21Table 4-3: Hazardous and Toxic Waste Productivity Factors: Light Work .......................................... 23Table 4-4: Hazardous and Toxic Waste Productivity Factors: Heavy Work ......................................... 24Table 4-5: Honeywell Unprocessed Radioactive Waste Summary ....................................................... 25Table 4-6: Decontamination M ethodology Comparison ......................................................................... 26Table 4-7: Volume Reduction Methodology Cost Information ............................................................ 27Table 4-8: Decommissioning Estimate Selected Unit Cost Factors ..................................................... 28Table 5-1: 2006 Decommissioning Basis for Planned Remediation Activities ..................................... 30Table 5-2: Typical Final Survey Instrumentation ................................................................................. 34
FIGURES AND DRAWING(S)
Figure 1 - Honeywell FacilityFigure 2 - Plant AreasFigure 3 - Non-Plant AreasDrawing No. MTW-2800 (Rev. Y)
APPENDICES
Appendix A-I - Contaminated Waste Volume SummaryAppendix A-2 - Contaminated Waste Disposal CostAppendix A-3 - Container Cost and Unit Disposal Cost FactorsAppendix A-4 - Waste Disposal Labor EstimateAppendix A-5 - Contaminated Waste Disposal SummaryAppendix A-6 - Building Survey Labor SummaryAppendix A-7 - Outdoor Area Survey Labor SummaryAppendix A-8 - Instrument Lease ChargesAppendix A-9 - Equipment Lease ChargesAppendix A- 10 - Demolition EstimateAppendix A- 11 - Decontamination CostsAppendix A- 12 - Volume Reduction CostsAppendix A- 13 - Miscellaneous Item Inventory EstimateAppendix A- 14 - Cost Escalation Methodology FactorsAppendix A-15 - Photographs
iv Rev. 0

E NENERCO N MTW Decommissioning Cost Estimate
EXECUTIVE SUMMARY
ENERCON Services, Inc. (ENERCON) is providing this report to document the triennial update to the
independent decommissioning cost estimate required for financial assurance purposes for the Honeywell
Metropolis Works Plant (MTW) located in Metropolis, Illinois. The Decommissioning Cost Estimate for
Honeywell Metropolis Works, Revision 1 dated July 27, 2010 (2009 Report) used as its' basis the Site
Reclamation Cost Estimate for Plant Located in Metropolis, Illinois, Revision 0 dated May 2006 (2006
Report). The 2006 Report was issued to Honeywell by Duratek (now EnergySolutions), and the 2009
Report was prepared by ENERCON. This decommissioning cost estimate is an update to the 2009
Report.
This update provides for cost escalation due to inflation between 2009 and 2012. Additional
characterization performed since 2009 did not support revising the amount of surface and subsurface soil
material from the 2009 Report. However, improved waste management practices have resulted in a
reduction in the volume of impacted material on site requiring disposal which has reduced the long-term
liability. Since 2009, approximately 20 million pounds of material have been shipped off-site for
disposal.
This estimate includes itemized costs for manpower and equipment resources, radioactive waste volume
reduction, packaging, shipping and burial activities, and the performance of final status surveys for
buildings and structures. The estimated decommissioning cost is $197,354,356 in 2012 dollars. This
estimate is for budgetary purposes only.
A significant portion of the overall decommissioning costs is attributed to the processing or burial of
radioactive waste. The radioactive waste disposal rate used for most of the waste in this estimate was
based on shipping to EnergySolutions of Utah at a favorable rate based on a large waste volume and low
levels of activity.
V Rev. 0
EN ERCO N MTW Decommissioning Cost Estimate
1.0 INTRODUCTION
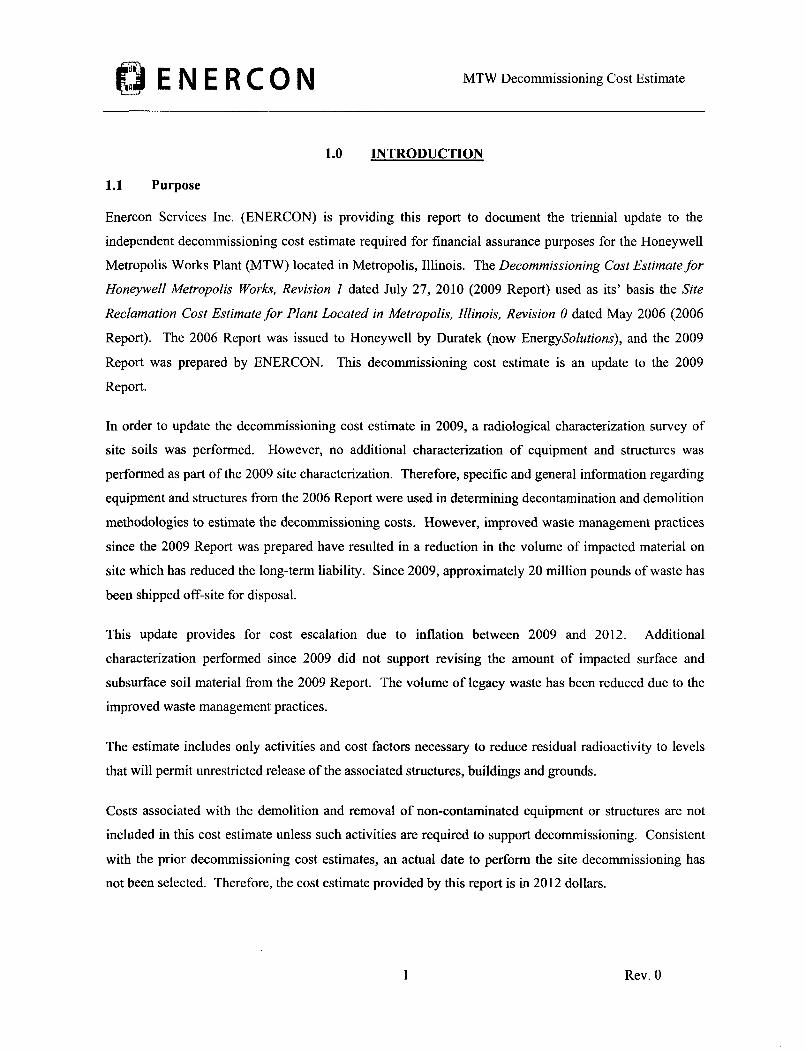
1.1 Purpose
Enercon Services Inc. (ENERCON) is providing this report to document the triennial update to the
independent decommissioning cost estimate required for financial assurance purposes for the Honeywell
Metropolis Works Plant (MTW) located in Metropolis, Illinois. The Decommissioning Cost Estimate for
Honeywell Metropolis Works, Revision 1 dated July 27, 2010 (2009 Report) used as its' basis the Site
Reclamation Cost Estimate for Plant Located in Metropolis, Illinois, Revision 0 dated May 2006 (2006
Report). The 2006 Report was issued to Honeywell by Duratek (now EnergySolutions), and the 2009
Report was prepared by ENERCON. This decommissioning cost estimate is an update to the 2009
Report.
In order to update the decommissioning cost estimate in 2009, a radiological characterization survey of
site soils was performed. However, no additional characterization of equipment and structures was
performed as part of the 2009 site characterization. Therefore, specific and general information regarding
equipment and structures from the 2006 Report were used in determining decontamination and demolition
methodologies to estimate the decommissioning costs. However, improved waste management practices
since the 2009 Report was prepared have resulted in a reduction in the volume of impacted material on
site which has reduced the long-term liability. Since 2009, approximately 20 million pounds of waste has
been shipped off-site for disposal.
This update provides for cost escalation due to inflation between 2009 and 2012. Additional
characterization performed since 2009 did not support revising the amount of impacted surface and
subsurface soil material from the 2009 Report. The volume of legacy waste has been reduced due to the
improved waste management practices.
The estimate includes only activities and cost factors necessary to reduce residual radioactivity to levels
that will permit unrestricted release of the associated structures, buildings and grounds.
Costs associated with the demolition and removal of non-contaminated equipment or structures are not
included in this cost estimate unless such activities are required to support decommissioning. Consistent
with the prior decommissioning cost estimates, an actual date to perform the site decommissioning has
not been selected. Therefore, the cost estimate provided by this report is in 2012 dollars.
I Rev. 0
0ENERCON MTW Decommissioning Cost Estimate
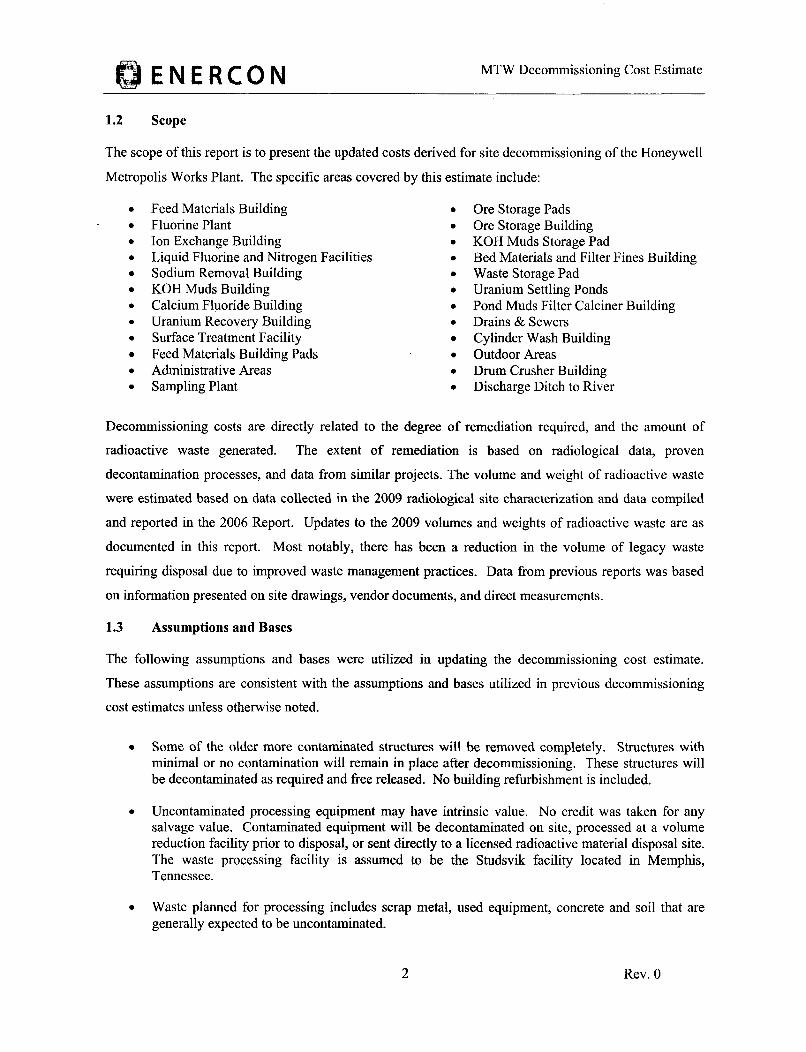
1.2 Scope
The scope of this report is to present the updated costs derived for site decommissioning of the Honeywell
Metropolis Works Plant. The specific areas covered by this estimate include:
0
S
S
0
0
0
0
0
0
S
0
Feed Materials BuildingFluorine PlantIon Exchange BuildingLiquid Fluorine and Nitrogen FacilitiesSodium Removal BuildingKOH Muds BuildingCalcium Fluoride BuildingUranium Recovery BuildingSurface Treatment FacilityFeed Materials Building PadsAdministrative AreasSampling Plant
* Ore Storage Pads* Ore Storage Building* KOH Muds Storage Pad" Bed Materials and Filter Fines Building" Waste Storage Pad" Uranium Settling Ponds" Pond Muds Filter Calciner Building" Drains & Sewers" Cylinder Wash Building" Outdoor Areas* Drum Crusher Building* Discharge Ditch to River
Decommissioning costs are directly related to the degree of remediation required, and the amount of
radioactive waste generated. The extent of remediation is based on radiological data, proven
decontamination processes, and data from similar projects. The volume and weight of radioactive waste
were estimated based on data collected in the 2009 radiological site characterization and data compiled
and reported in the 2006 Report. Updates to the 2009 volumes and weights of radioactive waste are as
documented in this report. Most notably, there has been a reduction in the volume of legacy waste
requiring disposal due to improved waste management practices. Data from previous reports was based
on information presented on site drawings, vendor documents, and direct measurements.
1.3 Assumptions and Bases
The following assumptions and bases were utilized in updating the decommissioning cost estimate.
These assumptions are consistent with the assumptions and bases utilized in previous decommissioning
cost estimates unless otherwise noted.
" Some of the older more contaminated structures will be removed completely. Structures withminimal or no contamination will remain in place after decommissioning. These structures willbe decontaminated as required and free released. No building refurbishment is included.
* Uncontaminated processing equipment may have intrinsic value. No credit was taken for anysalvage value. Contaminated equipment will be decontaminated on site, processed at a volumereduction facility prior to disposal, or sent directly to a licensed radioactive material disposal site.The waste processing facility is assumed to be the Studsvik facility located in Memphis,Tennessee.
* Waste planned for processing includes scrap metal, used equipment, concrete and soil that aregenerally expected to be uncontaminated.
2 Rev. 0

E N ERC O N MTW Decommissioning Cost Estimate
* Molyflush cylinders will be shipped off-site for processing.
* Improved waste management has reduced the volume of legacy waste that requires off-sitedisposal. This reduction in waste volume and associated decrease in costs are documented inTable A-10 and Table A-12 in Appendix A-10 and Appendix A-12 respectively. Since 2009,approximately 20 million pounds of waste has been shipped off-site for disposal. The improvedwaste management practices also have resulted in a reduction in the BSFR failure rate.
Radioactive waste with low specific activity will be sent to EnergySolutions in Clive, Utah. Itwas assumed that partially decontaminated equipment, protective clothing wastes, removedconcrete, miscellaneous dry activated waste (DAW), and soil would qualify for disposal at theEnergySolutions' facility.
" Wastes qualify for disposal at EnergySolutions under their current license and waste acceptancecriteria. Generation of Class B and C radiological waste is not anticipated duringdecommissioning.
" The independent third party site remediation contractor will provide the demolition equipmentand survey instrumentation at prevailing rates.
" During decommissioning, local decontamination technicians and supervisors will be utilized sono travel and living expenses are included. Supervisors and project management personnel willnot be local hires therefore travel and living expenses were included.
* To account for inflation between 2009 and 2012, an escalation factor of 1.141 was applied. Thisis slightly higher than the 1.126 factor applied in the 2009 Report to account for inflation between2006 and 2009. All labor costs are based on an independent third party contractor.
* The site-specific release criteria used as the basis in this report is 110 picocuries per gram (pCi/g)which would support achieving the unrestricted release criteria of 25 millirem per year (mrem/yr).This value is consistent with the site-specific release criteria approved by the NRC at the closedSequoyah Fuels UF6 conversion plant. Since 2009, site specific DCGLs (for soils) have beendeveloped. This information has not been submitted to the NRC and the DCGLs have not beenapproved. Therefore, the site-specific release criteria were not modified for this update to thedecommissioning cost estimate. However, this information does support the increase in the site-specific release criteria that occurred from the 2006 Report to the 2009 Report.
3 Rev. 0

EENERCO N MTW Decommissioning Cost Estimate
2.0 MTW LOCATION, HISTORY. AND CURRENT STATUS
2.1 MTW Location and Description
MTW is the holder of Nuclear Regulatory Commission License Number SUB-526. The plant address
listed on the license is as follows:
Honeywell2768 N US Route 45Metropolis, IL 62960-6700
The plant is located on U.S. Highway 45, approximately 1.8 miles northwest of downtown Metropolis,
Illinois. The MTW site is located on approximately 950 acres of land in Massac County at the southern
tip of Illinois (Figure 1). The primary site perimeter is formed by U.S. Highway 45 to the north, the Ohio
River to the south, an industrial coal blending plant to the west and privately-owned, developed land to
the east. Plant operations are conducted in a fenced restricted area covering approximately 59 acres in the
north-central portion of the site. MTW also owns approximately 100 acres of land directly across U.S.
Highway 45, north/northeast of the plant.
2.2 MTW History
Initial construction of the facility was completed in 1958, and the first UF 6 was produced in 1959 as part
of a five-year contract for conversion services with the former Atomic Energy Commission (AEC). In
1961 a UF 6 pilot plant was installed. The AEC conversion contract expired in 1964 and the conversion
process was mothballed. Continued increase in demand for conversion services resulted in rehabilitation
of the UF6 facility in 1967 and commercial conversion started in 1968. In 1968-1969 capacity for the
facility was expanded to 9,000 metric tons. Capacity was increased to 11,500 metric tons and 12,700
metric tons in 1975 and 1995 respectively. Re-engineering in 2001 increased capacity to approximately
14,000 metric tons. Additional re-engineering in 2007 further increased the capacity to approximately
15,000 metric tons.
2.3 MTW Physical Description
See Drawing No. MTW-2800 for the approximate location of the following areas on the MTW site.
4 Rev. 0

E N ERCON MTW Decommissioning Cost Estimate
2.3.1 Main Production and Plant Operations Buildings
Major production buildings include the following: Feed Materials Building, Ion Exchange Building,
Sodium Removal Building, KOH Muds Building, Uranium Recovery Building, Sampling Plant, Fluoride
Production Facility, Waste Treatment Plant, and UF 6 Cylinder Storage Area. The plant operations
buildings include the Administration Building, Laboratory and Office Building, Maintenance
Shop/Store/Office Building, and Powerhouse.
2.3.2 Miscellaneous Production Buildings
The miscellaneous production buildings include the Ore Storage Building, Bed Materials and Filter Fines
Building, Pond Muds Filter Calciner Building, Cylinder Wash Building, Drum Crusher Building, non-
uranium Fluorination Buildings (SF6/IF 5/SbFs), Liquid Fluorine Facility, Liquid Nitrogen Facility, and
Calcium Fluoride Facility.
2.3.3 Drum Storage Pads and Ponds
The drum storage pads and ponds include the five ore storage pads, the KOH muds storage pad, the waste
storage area, and uranium settling Ponds 3 and 4.
2.3.4 Outdoor Areas, Drains, and Sewers
The outdoor areas, drains, and sewers include the employee parking lot, paved roads on-site, railroad spur
numbers 1 through 4, the land between two parallel property exclusion fences, site drains/
sewers/underground process lines, and the MTW land outside the fenced operations area.
2.3.5 Calcium Fluoride Ponds
There are currently four calcium fluoride ponds at the site designated Ponds B, C, D and E. Pond A
(which was located north of Pond B) was removed and the Surface Treatment Facility was constructed in
the area once occupied by Pond A. The facility historically used calcium hydroxide to precipitate
fluorides as insoluble calcium fluoride into these ponds. The Surface Treatment Facility is used to treat
fluoride materials prior to a permitted discharge, so materials are no longer added to these ponds.
2.4 MTW Process Operations
The MTW Plant was designed to convert uranium ore concentrates into uranium hexafluoride, which is
then shipped to U.S. and foreign plants for enrichment of the 2 35U isotope. The facility, which uses the
fluoride volatility process, has the capacity to convert approximately 15,000 metric tons of uranium per
year from ore concentrates into UF 6. Assays of the uranium ore concentrates show approximately 75%
5 Rev. 0

(ENERCON MTW Decommissioning Cost Estimate
uranium. The distilled UF 6 product contains less than 300 parts per million (ppm) impurities. A process
flow diagram of the conversion process is provided and each significant step of the conversion process is
described in the following sections of this report.
2.4.1 UF6 Conversion Process Flow Diagram
The process flow diagram for the plant operations is as follows.
2.4.2 Ore Preparation
The plant receives uranium ore concentrates in 55-gallon drums. Each drum of ore concentrate is
weighed and then stored on storage pads until accountability procedures and the uranium and impurity
analyses are completed.
6 Rev. 0
djENERCON MTW Decommissioning Cost Estimate
Some ore concentrates and all uranium compounds from the uranium recovery process contain
undesirable amounts of contaminants (principally sodium) that must be removed. The pretreatment
process consists of a four-stage countercurrent decantation treatment with ammonium sulfate solution.
The uranium solids discharge into the ore calciner in the ore preparation area.
Incoming ore concentrates are charged into the system through a drum-dumping station. The
concentrates either go directly to the calciner or through the pretreatment area to the calciner. Following
the calciner, the ore concentrates are blended, agglomerated, dried, crushed, and sized to a uniform
particle size. Dusts and fumes from this process are controlled by a series of dust collectors.
2.4.3 Uranium Reduction
The sized U30 8 enters a fluid-bed reactor termed the reductor. In the reductor, the uranium is reduced to
the dioxide form utilizing hydrogen and nitrogen as the fluidizing gas, which is obtained from the
dissociation of ammonia. The reductor off-gas (principally hydrogen, nitrogen, water vapor, and
hydrogen sulfide) is passed through filters to remove particulate uranium, and the residual gas is
incinerated to convert the H2S to S02.
2.4.4 Uranium Hydrofluorination
The uranium dioxide from the reductor is fed into two fluid-bed hydrofluorinators operated in series. A
countercurrent flow of anhydrous hydrogen fluoride (Hf) fluidizing gas converts the uranium dioxide into
uranium tetrafluoride (UF4). The off-gas is filtered to remove particulate uranium and scrubbed with
water and potassium hydroxide solution to remove HF before being vented to the atmosphere. The HF
scrubber liquors are neutralized with KOH, and the fluoride is removed with calcium before being
discharged with the main plant effluent.
The UF 4 is then fed into two parallel fluid-bed fluorinators that contain inert bed material. Elemental
fluorine, used as the fluidizing gas, converts the UF4 to UF 6 that is volatilized from the fluorinators.
Residual uranium and nonvolatile uranium daughter products remain in the bed material, which is
recycled and reused until the buildup of contaminant levels prohibits further use. The bed material is then
retired for radioactive decay and recovery of the uranium content. The volatilized gas containing UF 6,
excess fluorine, and HF is passed through a series of filters for particulate removal and through a series of
cold traps for UF 6 collection.
7 Rev. 0

Ij ENERCO N MTW Decommissioning Cost Estimate
2.4.5 Uranium Hexafluoride Distillation
The bulk of the UF6 is condensed in a series of primary cold traps that are operated at approximately
-20'F. The secondary and tertiary traps operate at lower temperatures and remove the residual UF6.
Following liquefaction, crude UF 6 is removed intermittently from the cold traps by heating and is then
transferred to still feed tanks to await purification by fractional distillation.
Uncondensed gas from the cold traps, consisting of F2, HF, air, and traces of UF6 , is passed through
scrubbers, where contact with aqueous potassium hydroxide solution removes fluorides and traces of
uranium prior to release to the atmosphere. The potassium diuranate precipitated in the off-gas scrubbers
is settled from the KOH that is subsequently reused in the process scrubbers.
Crude UF 6 from the still feed tanks is fed into a low boiler distillation column. The UF 6 that has been
stripped of low-boiling impurities is then fed into a high boiler distillation column where high-boiling
impurities are eliminated. The product is condensed and packaged into 10-ton or 14-ton cylinders that are
shipped to gaseous diffusion plants. There are no off-gases from this process.
Potassium diuranate from the cold trap off-gas cleanup system, fluorinator filter fines, contaminated
fluorinator bed material, miscellaneous recovered dust, and scrap ore are finely ground and leached with a
sodium carbonate solution to solubilize the uranium as a tricarbonate complex. The leached material is
filtered and the insoluble material (principally inorganic fluoride containing residual uranium and
uranium daughter products) is dried and drummed for disposal at a licensed radioactive waste disposal
facility. The uranium in the filtrate is precipitated with sodium hydroxide (NaOH). The recovered
uranium is then charged to the head end of the process via the pretreatment facility. The uranium
recovery leach liquors are recycled/reused. Less than 10% of these liquors are withdrawn, treated, and
then discharged into the plant effluent.
2.4.6 UF 6 Cylinder Cleaning
Periodically, UF6 product cylinders must be washed and pressure tested to assure integrity. The cylinders
are washed with sodium carbonate solution to leach the uranium from the residual solids. The leach
liquors are then filtered to remove the unleached solids and transferred to the remaining recovery facility.
The remaining solids containing daughter products of uranium principally 234Th and 234Pa are stored on-
site in drums and are eventually disposed of at a licensed waste disposal facility.
8 Rev. 0

0 ENERCON MTW Decommissioning Cost Estimate
2.4.6.1 Fluorine Production
Fluorine, which is one of the raw materials required for the UF 6 process, is produced on-site by
electrolysis using hydrogen fluoride as the source. A portion of this material is transferred to the UF6
operation, and the remainder is used to produce materials that are sold commercially.
2.4.7 Plant and Non-Plant Area Delineation
In 2009, ENERCON assessed the plant and non-plant areas at the MTW site as part of the HSA. The
plant was delineated into 29 separate areas or systems of interest (Figure 2). Non-plant areas were
delineated into 5 separate areas or systems (Figure 3). Table 2-1 provides a list of the 34 areas or
systems.
Table 2-1: Listing of Plant and Non-Plant Areas
AreaDesignation Description
P-1 Administration Building and Parking LotP-2 Laboratory Building and Adjacent Storage AreaP-3 Former Cold Trash Storage AreaP-4 Fluorination PreparationP-5 Ore Staging Area/Drum Dumping Area/Sodium Removal Building/KOH Muds Building/Wet
Process Building/CalcinerP-6 Feed Materials Building and South PadP-7 Powerhouse, Nitrogen Generation, Laundry, Flammable Storage Building, and Storage Area
P-8 Liquid Fluorine Plant, Sulfur Hexafluoride Plant, Antimony Pentafluoride, IodinePentafluoride Plant, and the Loading Docks
P-9 Ore Sampling AreaP-10 Ore Storage BuildingP-11 Ore Storage PadsP-12 Tank Farm, Pond Muds Calciner, and Fuel Oil StorageP-13 Cylinder Wash AreaP-14 Uranium Settling PondsP-15 Bed Materials and Filter Fines BuildingP- 16 Drum Storage PadP- 17 Waste Storage AreaP-18 Uranium Hexafluoride Cylinder Storage AreaP-19 Drum Crushing FacilityP-20 Environmental Protection Facility (EPF)P-21 Calcium Fluoride PondsP-22 Maintenance Storage Area/Trash Compactor/Switchyard/Fuel DepotP-23 Maintenance Shop/Stores/Loading DockP-24 Liquid Propane Gas AreaP-25 Roadways and Ground SurfaceP-26 Plant Exclusion AreaP-27 Sanitary Drain Lines
9 Rev. 0

0ENERCON MTW Decommissioning Cost Estimate
AreaDesignation Description
P-28 Process Drain LinesP-29 Storm Water Drain LinesNP-1 Non-Plant Area 1 - NPDES OutfallsNP-2 Non-Plant Area 2 - Surface Drainage Pathways to the Ohio RiverNP-3 Non-Plant Area 3 - On-site Landfill and Kickback AreaNP-4 Non-Plant Area 4 - River RoadNP-5 Non-Plant Area 5 - Remainder of the Property
The 2009 site characterization activities evaluated the site soils in twenty-six (P-1 through P-26) of the
twenty-nine designated plant areas, and the five (NP-1 through NP-5) designated non-plant areas. Plant
areas P-27, P-28, and P-29 were not characterized due to inability to access the various subsurface lines
due to ongoing plant operations.
10 Rev. 0
j ENERCON MTW Decommissioning Cost Estimate
3.0 ASSESSMENT OF PLANT RADIOLOGICAL CONDITIONS
3.1 Radiological Criteria for License Termination
The overall objective of the MTW decommissioning is to remediate the site to an unrestricted use
condition that corresponds to a calculated dose to the public that is less than 25 mrem/yr from applicable
pathways. The site can then be used without any restrictions. The 25 mrem/yr dose limit is codified at
10 CFR 20.1402, Radiological Criteria for Unrestricted Use.
The Derived Concentration Guideline Level (DCGL) is defined in MARSSIM as the radionuclide-
specific concentration within a survey unit corresponding to the release criterion. The DCGL is dependent
upon several factors including the radionuclides of interest, applicable dose pathways, area occupancy
and the future use of the facility. DCGLs assume a uniform level of residual radioactivity across the
survey unit. For the Honeywell-Metropolis facility it was assumed that site-specific release criteria would
be developed. The 2009 Report cited as an example the release criteria of 110 pCi/g for the Sequoyah
Fuels facility. The Sequoyah Fuels facility was a uranium conversion plant similar to MTW that closed
in the 1990s. The 2009 Report and decommissioning cost estimate used as a basis a release criteria of
110 pCi/g. ENERCON believes that 110 pCi/g is a reasonable DCGL for planning purposes and can be
defended to the NRC. Since 2009, ENERCON has developed modified DCGLs for the MTW site. These
DCGLs are preliminary and have not been submitted to or approved by the NRC. Therefore, the release
criteria used in the 2009 Report were not modified for this report.
The NRC criterion for acceptable surface contamination levels historically was 5,000 dpm/100 cm2
average for U-nat and 1,000 dpm/l100 cm 2 removable for U-nat as stated in Policy and Guidance Directive
FC 83-23 "Guidelines for Decontamination of Facilities and Equipment Prior to Release for Unrestricted
Use or Termination of Byproduct, Source, or Special Nuclear Materials Licenses". The current NRC
guidance for acceptable activity levels for specific radionuclides is presented in NUREG-l1757 Table B. 1.
The NRC declined to provide specific guidance for alpha emitting radionuclides, including U-nat.
ENERCON expects that the MTW site will apply for a site specific release criteria using the guidance in
NUREG-1757 Appendix I and the ALARA analysis guidance in NUREG-1757 Appendix N. These
acceptable levels are presented in Table 3-1.
11 Rev. 0

0 ENERCON MTW Decommissioning Cost Estimate
3.2 Prior Assessment of Plant Radiological Conditions
Previous reports evaluated NRC criteria and provided the following conclusions regarding the MTW
radiological conditions/release criteria:
* NRC criterion for residual depleted uranium (DU) in soil was formerly 35 pCi/g.
• NRC guidance for acceptable license termination screening values for specific radionuclides wasavailable in NUREG-1757 Table B.2.
* Honeywell would apply for site-specific release criteria using the guidance in NUREG-1757Appendix I and the ALARA analysis guidance in NUREG1757 Appendix N. The outcome ofthis effort would be release criterion in excess of 35 pCi/g.
Other sites had previously performed evaluations and obtained site-specific release criteria in excess of
35 pCi/g. For example, the Sequoyah Fuels Corporation site's DCGL for uranium was 110 pCilg for a
release criteria of 25 mrem/yr. A corresponding ALARA evaluation indicated an ALARA action level of
4,780 pCi/g uranium, thus demonstrating that the 110 pCi/g value was ALARA. Therefore, the 2009
Report assumed that a site-specific release level of 110 pCi/g or greater for soils could be established.
The 2009 Report listed the following release criteria for surface contamination levels. This basis was
used in the 2009 Report and in this update to the decommissioning cost estimate.
Table 3-1: Acceptable Surface Contamination Levels
NUCLIDESa AVERAGEb.c'f MAXIMUMb'df REMOVABLEb~ef
U-nat, U-235, U-238, and associated 5,000 dpm/100 cm 2 15,000 dpm!100 cm2 1,000 dpmI/100 cm2
decay products
Transuranics, Ra-226, Ra-228, Th-230, 100 dpm/100 cm 2 300 dpm/100 cm2 20 dpm/100 cm'Th-228, Pa-231, Ac-227, 1-125, 1-129
Th-nat, Th-232, Sr-90, Ra-223, Ra- 1,000dpm/100cm2 3,000 dpm/100 cm2 200 dpm/100 cm2
224, U-232, 1-126, 1-131, 1-133
Beta-gamma emitters (nuclides with 5,000 dpm/100 cm2 15,000 dpm/100 cm2 1,000 dpm/100 cm2
decay modes other than alpha emissionor spontaneous fission) except Sr-90and others noted above.
aWhere surface contamination by both alpha- and beta-gamma emitting nuclides exists, the limitsestablished for alpha- and beta-gamma emitting nuclides should apply independently.
12 Rev. 0

E NENERCON MTW Decommissioning Cost Estimate
bAs used in this table, dpm (disintegrations per minute) means the rate of emission by radioactivematerial as determined by correcting the counts per minute observed by an appropriate detectorfor background, efficiency, and geometric factors associated with the instrumentation.
C
Measurements of average contaminant should not be averaged over more than 1 square meter.For objects of less surface area, the average should be derived for each such subject.
dThe maximum contamination level applies to an area not more than 100 cm2.
eThe amount of removable radioactive material per 100 cm2 of surface area should be determinedby wiping that area with dry filter or soft absorbent paper, applying moderate pressure, andassessing the amount of radioactive material on the wipe with an appropriate instrument of knownefficiency. When removable contamination on objects of less surface area is determined, thepertinent levels should be reduced proportionally and the entire surface should be wiped.
The average and maximum radiation levels associated with surface contamination resulting frombeta-gamma emitters should not exceed 0.2 mrad/hr at 1 cm and 1.0 mrad/hr at 1 cm,respectively, measured through not more than 7 milligrams per square centimeter of totalabsorber.
3.3 Identification of Potential Radionuclides of Concern
As part of the HSA prepared in 2009 by ENERCON, a list of potential radionuclides of concern (ROC)
was developed. This ROC list provided guidance on the sampling strategies, methodologies, and
analytical protocols selected for characterization. Part of the assessment and evaluation process
considered the movement of uranium daughter products in the plant processing operations. Potential
concentration of uranium daughter radionuclides in a specific waste stream was considered when
performing characterization. Identifying the location(s) where those waste streams were historically
handled was considered in the HSA.
Appendix C of the HSA assessed the ROCs in incoming ore concentrate and the plant-specific waste
streams. Evaluating the various forms of uranium found in the incoming ore concentrate and the plant
waste streams, the following was concluded:
* Dose exposure from the incoming ore concentrate is primarily (more than 90%) driven by thepresence of U-234, U-235, and U-238.
" Dose exposure based on on-site and off-site environmental air monitoring data is primarily driven(more than 90%) by the presence of U-234, U-235, and U-238.
" Dose exposure based on uranium recovery solid wastes is primarily driven by the presence ofRa-226, Th-230, and Th-232.
" Dose exposure based on water effluent monitoring data is primarily driven by the presence ofRa-226, U-234, and U-238.
13 Rev. 0

E NENERCO N MTW Decommissioning Cost Estimate
ENERCON designated radionuclides U-234, U-235, and U-238 as the base ROC group. Radionuclides
Ra-226, Th-230, and Th-232 were designated as modified ROC Group 1. Radionuclides Ra-226, U-234,
and U-238 were designated as modified ROC Group 2.
Within the plant operational processes, the uranium recovery process occurs in the Feed Materials
Building (P-6), the Cylinder Wash Area (P-13), the Bed Materials and Filter Fines Building (P-15), and
the Waste Storage Area (P-17). Thus, 4 of the 29 plant areas were assessed as requiring consideration for
the base ROC and modified ROC Group 1. The remaining plant operational areas (25 of the 29 plant
areas) were assessed as requiring consideration of the base ROC group for characterization.
The water effluent location is the NPDES outfall (NP-1). Thus, 1 of the 5 non-plant areas was assessed as
requiring consideration for modified ROC Group 2. All remaining non-plant areas (NP-2 through NP-5)
were assessed as requiring consideration for the base ROC group for characterization.
3.4 Characterization Data for Prior Assessments of Radiological Conditions
The 2006 Report used available data and experience with similar sites to determine the extent of
remediation required during decommissioning. The available characterization data for the 2006 Report
included removable activity survey data and environmental sampling data.
The removable activity survey data was utilized to help determine which buildings and indoor areas
required remediation. Fixed activity data was not available. The average and maximum activity levels
measured for each building were provided in the 2006 Report. The limit used for removable activity for
natural uranium was 1,000 dpmi/100 cm 2. No additional data from buildings and indoor areas were
collected during the 2009 site characterization. Therefore, no changes were made to the quantities
estimated in previous reports.
The 2006 Report used site environmental sample survey data to help determine which outdoor areas
potentially required remediation assuming a site-specific soil release level of 35 pCi/g. The 2009 Report
and this report use data collected during the 2009 site characterization assuming a site-specific soil release
level of 110 pCi/g.
3.4.1 Main Production Buildings
Survey data included in the 2006 Report for the Main Production Buildings indicated that in general these
buildings were contaminated and would require remediation. Specifically, the Feed Materials Building,
Uranium Recovery Building, KOH Building and Sampling Plant exceeded the release level assumed for
14 Rev. 0

E NENERCO N MTW Decommissioning Cost Estimate
the 2006 Report. The 2009 Report and this update to the decommissioning cost estimate assume no
change in the radiological status of these buildings.
3A4.2 Miscellaneous Production Buildings
Survey data included in the 2006 Report for the Miscellaneous Production Buildings indicated, that in
general, these buildings were not contaminated and would not require extensive remediation. Based on
prior history the Pond Muds Filter Calciner Building was assumed to require remediation in the 2006
Report. The 2009 Report and this update to the decommissioning cost estimate assumes no change in the
radiological status of these buildings.
3.4.3 Drum Storage Pads & Ponds
Based on history, the Drum Storage Pad, the KOH Muds Storage Pad, the Waste Storage Pad, and the Ore
Storage Pads were assumed in the 2006 Report to require remediation. Uranium Settling Pond Nos. 3 and
4 were assumed in the 2006 Report to require remediation based upon data from Uranium Settling Pond
Nos. 1 and 2 that required remediation at closure. The 2009 Report and this update to the
decommissioning cost estimate assume no change in the radiological status of these areas.
3.4.4 Outdoor Areas, Drains & Sewers
Site characterization completed in 2009 focused on plant and non-plant surface and subsurface soils.
Prior to the 2009 site characterization there was limited data available for surface and subsurface soils in
the plant and non-plant areas. Characterization activities excluded subsurface piping systems to eliminate
disruptions to plant operations. A significant volume of impacted soil was identified beyond the volume
estimated in the 2006 Report. The changes in these volumes were documented in the 2009 Report and are
as follows:
" Plant area soil impacted to a depth of approximately 1 foot below grade was identified in anestimated footprint area of 489,435 square feet (ft2 ). Therefore, an additional 489,435 cubic feet(ft3) of impacted soil was added to the 2009 decommissioning cost estimate.
" Plant area soil impacted to a depth of approximately 3 feet below grade was identified in anestimated footprint area of 69,609 ftW. Therefore, an additional 139,218 ft3 (69,609 ft2 x 2 feet) ofimpacted subsurface soil was added to the 2009 decommissioning cost estimate.
* Plant area soil impacted to a depth of approximately 6 feet below grade was identified in anestimated footprint area of 30,013 ft2. Therefore, an additional 90,039 ft3 (30,013 ft2 x 3 feet) ofimpacted subsurface soil was added to account to the 2009 decommissioning cost estimate.
15 Rev. 0

~jENERCON MTW Decommissioning Cost Estimate
Overall, the additional impacted soil volume for plant areas (P-i through P-25) and for non-plant areas
(P-26 and NP-I through NP-5) identified in the 2009 decommissioning cost estimate (based on the 2009
characterization) was estimated to be 718,692 cubic feet and 153,897 cubic feet respectively. Additional
characterization performed since 2009 does not support revising the amount of impacted surface and
subsurface soil material from the 2009 Report. It should be noted the impacted soil quantity shown in the
2009 Report contained a typographical error (the volume included the bulking factor). The volumes
noted about are in-place cubic yards and do not account for bulking.
3.4.5 Administrative Areas
The Administration Building, the Lab and Office Building, the Shop/Stores/Office Building, and the
Power House were identified in the 2006 Report as not contaminated. The 2006 Report stated that
radioactive materials were used in laboratory area and some remediation in this area will be required. The
2009 Report and this update to the decommissioning cost estimate assume no change in the radiological
status of these areas.
3.4.6 Calcium Fluoride Ponds B, C, D and E
Ponds B, C, D, and E are RCRA regulated surface impoundments. Characterization of the ponds was
completed by Honeywell in 2009. Pond closure requirements are currently under evaluation by
Honeywell. RCRA financial security for pond closures is accounted for separately and is not part of this
decommissioning cost estimate.
3.5 Changes since 2009 Report
The following is a summary of the activities or actions that have occurred since the 2009 Report was
prepared (refer to Drawing MTW-2800):
" Honeywell removed approximately 6-inches of roadway material and repaved a majority of the
roads in the restricted area;
" Radiological survey was performed on Aisle #5 of the UF 6 pad to prepare for removal of existing
concrete and repaving;
* Twelve wide trailer (BD-69) and an additional engineering trailer (BD-56) were installed in the
old LPG Area (northwest comer of the restricted area);
" RCRA KOH Mud Drums Storage Building (BD-26) was constructed in the northwest comer of
the Ore Storage Pad area;
16 Rev. 0

Ej ENERCON MTW Decommissioning Cost Estimate
" Two sheet metal buildings (BD-92 and BD-93) were constructed to support waste processing and
capital fabrications; and
* Improved waste management has reduced the volume of impacted material requiring off-site
disposal and the anticipated failure rates for BSFR waste.
3.5.1 Roads
In 2012, Honeywell replaced a majority of the asphalt roads inside the restricted area with concrete. The
project required removal of approximately 6-inches of asphalt and subgrade material so that the concrete
roadway could be constructed.
Based on the 2009 characterization data, the subgrade material under the roads (P-25) inside the restricted
area was characterized as having little or no radiological impact. Therefore, no adjustment to the
impacted volume of soil was made during this update to the cost estimate because no volume was
included in the 2009 volume adjustments. To prepare for the removal of the asphalt paving material, a
walkover survey was performed to characterize this material prior to its removal. The walkover survey
results showed little to no radiological impact to the asphalt paving material. Therefore, the material
which was removed, so that the concrete road could be poured was non-impacted material. Honeywell
used the asphalt and subgrade material as fill within the plant.
3.5.2 Aisle # 5 of the UF6 Pad
In August 2011, ENERCON performed a radiological survey of Aisle #5 of the UF6 pad. The details of
this survey are provided in Radiological Characterization Report of the UF6 Pad, prepared by
ENERCON. This survey was performed because the existing concrete in Aisle #5 was scheduled to be
removed so that the areas could be repaved with concrete. The results of the survey showed some
elevated activity in the concrete and no impacts to the aggregate beneath the existing concrete pad. The
clean concrete in Aisle #5 was removed, crushed and utilized as fill within the plant.
Based on the 2009 characterization data, a significant portion (118,560 square feet) of the total area of the
subsurface material beneath the UF6 Pad (P- 18) was assumed impacted to a depth of one foot. This area
included a portion of Aisle #5. However, the subsurface soil beneath the pad was sampled and not the
aggregate beneath the pad. Therefore there is no need to address the volume of subsurface material
impacted below the UF 6 pad for this update to the cost estimate.
17 Rev. 0

E N ENERCON MTW Decommissioning Cost Estimate
3.5.3 Support Trailers
In 2011, Honeywell installed a twelve wide trailer (BD-69) and an additional engineering trailer (BD-56)
in the old LPG Area (northwest comer of the restricted area) to provide office space to support on-going
site operations. The twelve wide trailer provides office space for the Nuclear Compliance Department. A
photograph (Photograph No. 1) of the twelve wide trailer is included in Appendix A-15. The
administrative activities being conducted in the trailers are not expected to result in any impacts to
building surface or soil. Therefore, no adjustments were made to the decommissioning cost estimate due
to the installation of these trailers.
3.5.4 RCRA KOH Mud Drums Storage Building
In 2009, Honeywell installed the RCRA KOH Mud Storage Building (BD-26), an opened wall structure,
in the south side of the Ore Storage Pad area. The location of BD-26 is depicted in Drawing No. MTW-
2800 (Rev Y). The original concrete pad is still in place and was only cut at the footer/foundation
locations for the building column installation. The Ore Storage Pads were considered impacted in the
2006 Report and 2009 Report. The volume of impacted concrete was not adjusted for the Ore Storage
Pad. The building is comprised of steel columns, trusses and a sheet metal roof. It is assumed the
building will not be contaminated from site operations; therefore, costs were not allotted in the DEC to
decommission this building.
3.5.5 Sheet Metal Buildings
In 2012, Honeywell installed two sheet metal buildings. BD-92 (Waste Storage Building) was installed
west of the Surface Treatment Facility. A photograph (Photograph No. 2) of BD-92 is included in
Appendix A-15. BD-93 (Capital Fabrication Building) was installed south of the Sampling Plant. A
photograph No. 3 of BD-93 is included in Appendix A-15. The Waste Processing Building is used to site
reduce contaminated equipment and materials. It has a poured concrete floor with industrial coating to
prevent migration of contamination into the concrete. Both buildings are small sheet metal structures that
should be kept clean of radiation contamination, therefore, no changes were made to the cost estimate due
to the installation of these buildings.
3.5.6 Waste Management
Starting in 2008, Honeywell instituted improved waste management practices at the Metropolis Works
Plant which resulted in a reduction in the volume of impacted waste on the site and improved failure rates
for BSFR. Since 2009, approximately 20 million pounds of waste has been shipped off-site for disposal.
The following items, previously included in Table A-10, have been shipped off-site for disposal at a
18 Rev. 0

E N ENERCO N MTW Decommissioning Cost Estimate
permitted disposal facility due to the improved waste management practices: (1) BM/FM Building LLRW
Trash in Blue boxes (27 tons); (2) BM/FM Building LLRW Trash in B-25 boxes (227 tons); (3) BM/FM
Building LLRW Trash in drums (338 tons); (4) Scrap Metal on Metals Pad (4,830 tons); (5) New Scrap
Metal on Metals Pad (73 tons); (6) 16" x 16" x 8" cubes on Metals Pad (22 tons); (7) Material on Waste
Pad (1.2 tons) (8) Imhoff Sludge in Crusher Building (73 tons); (9) Outfall Material in the Crusher
Building (5.1 tons); (10) RAM Flat Compactor (1.8 tons); (11) Conveyor for RAM Flat Compactor (0.8
tons); (12) HEPA unit for RAM Flat Compactor (0.3 tons); (13) Drum Washer (0.8 tons); and (14)
Equipment Removal Surface Treatment Pad (23,575 square feet). This information was provided by
interviewing site personnel and was verified through a site inspection. Therefore, the labor costs in Table
A-10 for these items have been removed. Based on information provided by Honeywell, there is
approximately 4,000 cubic feet of material typically on-site that requires processing and disposal at any
time. Recent site waste management experience predicts that of this 4,000 cf, 2,750 will be processed at
Studsvik and the balance of 1,250 cf will be disposed at EnergySolutions' facility in Clive, UT. To
account for the costs required to prepare this material for processing off-site disposal $25,000 was added
to the costs shown on Table A-10. Similarly, changes made in Table A-10 were also accounted for in
Table A-12. Therefore, the following items were removed from Table A-12: (1) Scrap Metal on Metals
Pad (4,830 tons); (2) New Scrap Metal on Metals Pad (73 tons); and (3) 16" x 16" x 8" cubes on Metals
Pad (22 tons). Additional items not accounted for on Table A-10 that were removed from Table A-12 are
as follows: (1) Thin Walled UF 6 Cylinders (660 tons); and (2) Soil from I-HF Mitigation & Fire Water
Line Rupture (450 tons). Costs were added to Table A-12 to account for the 2,750 cubic feet of material
typically on site that will require processing at Studsvik. The remaining portion (1,250 cubic feet) of
material typically on-site will require disposal as LLRW at EnergySolutions' disposal facility in Clive,
Utah, and was accounted for in a separate fashion in Table A-I and Table A-2. The failure rates for
BSFR waste in Table A-12 were modified based on the improved failure rates that have been achieved
under better waste management practices. Based on these improved failure rates, it was assumed that all
waste would have a BSFR failure rate of 5 percent.
19 Rev. 0

ýj ENERCON MTW Decommissioning Cost Estimate
4.0 2012 DECOMMISSIONING COST ESTIMATION METHODS
This section of the decommissioning cost estimate report documents the considerations and factors used
to prepare this update to the decommissioning cost estimate. Factors from the 2006 Report and 2009
Report that remain unchanged are identified and described. This update to the decommissioning cost
estimate did not modify the volumes associated with buildings and structures (Table A-i) from the 2009
Report. However, the 1,250 cubic feet of material typically on-site that requires disposal as LLRW at
EnergySolutions' disposal facility in Clive, Utah was added to Table A-1. As noted, there has been no
additional information collected that would result in a net change in the volumes of impacted surface and
subsurface soil material since 2009. The improved waste management practices have resulted in a
reduction of the impacted material on-site requiring disposal, and a reduction the failure rate for BSFR
waste. Therefore, the liability associated with this material has been reduced. This update to the
decommissioning cost estimate accounts for inflation between 2009 and 2012. The calculation of the cost
escalation factor used to account for inflation is included in Appendix A- 14.
Table 4-1: Decommissioning Cost Summary - Honeywell Facility
Labor Plus Equipment, RadwasteTravel & Waste Process Contracts Ship &
Operation Man-hours Living & Transport & Supplies Disposal Total Cost
Main Production Buildings 211,041 $12,961,100 $855,200 $1,152,741 $63,660,778 $78,629,819
Miscellaneous Production Buildings 103,738 $6,557,690 $183,150 $362,185 $7,288,566 $14,391,590
Drum Storage Pads and Ponds 349,504 $22,239,923 $602,046 $1,152,005 $5,731,534 $29,725,507
Outdoor Areas, Drains, & Sewers 6,723 $403,207 $1,451,870 $105,875 $323,546 $2,284,499
Administrative Areas 196 $11,725 $0 $902 $95,832 $108,459
Additional soil plant areas P I-P25 1,664 $0 $23,875,660 $0 $3,292,085 $27,167,745
Additional soil non-plant areas NP1-NP5 plus additional soil adjacent to 10,400 $0 $3,660,747 $0 $926,020 $4,586,766subsurface piping
Decommissioning Planning 480 $58,585 $0 $0 $0 $58,585
Characterization Surveys 2,275 $252,735 $0 $23,681 $0 $276,416
Final Surveys 9,100 $1,010,941 $0 $94,721 $0 $1,105,662
Planning Training & Mobilization 2,068 $137,656 $0 $0 $0 $137,656
Honeywell Oversight & Licensing 21,684 $2,195,794 $0 $0 $0 $2,195,794
General Plant Area Waste - $0 $49,861 $0 $231,549 $281,410
Savings from A- 0 - - - - -$7,350,024
Totals 718,873 $45,829,356 $30,678,534 $2,892,108 $81,549,911 $153,599,885
25% CONTINGENCY $38,399,971
ILLINOIS RAD WASTEFEE ($3/ft
3) $5,354,500
GRAND TOTAL $197,354,356
20 Rev. 0

' ENERCO N MTW Decommissioning Cost Estimate
Specific modifications and/or adjustments to the decommissioning cost estimate in this current report
compared to the 2009 Report are highlighted below:
* No adjustments were made in the estimated level of man-hours for tasks scoped in the 2009Report.
" Labor and travel and living costs were escalated using a cost escalation factor of 1.141 (seeAppendix A-14) to account for inflation between 2009 and 2012. This is slightly higher than thecost escalation factor of 1.126 used in 2009 to account for inflation between 2006 and 2009.Equipment contract and supplies costs in the 2009 Report were escalated by a factor of 1.141 toaccount for inflation between 2009 and 2012.
" Radwaste transportation and disposal costs in the 2009 Report were escalated by a factor of 1.141to account for inflation between 2009 and 2012.
" Waste process and transport costs in the 2009 Report were escalated by a factor of 1.141 toaccount for inflation.
* Improved waste management practices have resulted in a reduction in the volume of waste on-siterequiring disposal.
4.1 Cost Modifying Factors
In the 2006 Report, site and work conditions were assumed by Duratek to significantly affect the overall
cost of remediation. A productivity adjustment factor was incorporated based on site and work conditions
expected to be encountered during decommissioning tasks. The productivity adjustment factor was
related to personnel protection requirements and working temperatures. The degree of protection required
depended on the extent of contamination and specific activities to be performed in a given area. As the
level of personnel protection increased, so did the impact on individual productivity and task duration.
Adjustments were made to account for the implementation of personnel protective measures where
applicable. This estimate utilized standardized levels of personnel protection and their associated impacts
as shown in Table 4-2. The productivity factors related to these levels of personnel protection were
provided in Table 4-3 and Table 4-4 for light and heavy work, respectively. These factors were not
adjusted in the 2009 Report and have not been adjusted for this estimate.
Table 4-2: Personnel Protective Equipment Protection Summary
Level A: The highest available level of respiratory, skin, and eye protection
The highest level of respiratory protection, but less skin protection than Level
Level B: A. Level B is the minimum level recommended for initial site entries, or forother entry conditions dealing with unknown hazards.
21 Rev. 0

" N ENERCON MTW Decommissioning Cost Estimate
The same level of skin protection as Level B, but a lower level of respiratoryLevel C. protection.
Skin protection similar to or the same as Level C, without respiratoryLevel D Modified: prtcinprotection.
Standard work uniform suitable for construction work: no respiratory protectionLevel D: and minimal skin protection.
4.2 Radiological Waste Volume Estimates
The 2006 Report assumed the unprocessed radiological waste volumes shown in Table 4-5. These
volumes remained unchanged in the 2009 Report. This update to the.decommissioning cost estimate did
not modify the volumes associated with buildings and structures in Table A-1 from the 2009 Report.
However, approximately 1,250 cubic feet of waste was added to account for the volume of waste typically
on site that requires disposal as LLRW at EnergySolutions' disposal facility in Clive, Utah. This
modification is documented in Table A-1. No Class B and C waste is expected to be generated during
decommissioning activities.
4.3 Radiological Waste Disposal Cost
The 2006 Report assumed waste processing would occur at the Duratek facility in Oak Ridge, Tennessee
followed by disposal at EnergySolutions of Utah. Some wastes were assumed to be directly disposed at
EnergySolutions. The 2009 Report addressed changes made to the 2006 Report. The following sections
describe the adjustments made to the 2009 Report for this update to the decommissioning cost estimate.
4.3.1 EnergySolutions of Utah Disposal Costs
The 2006 Report estimated the cost to transport waste to the EnergySolutions disposal site in Clive, Utah
based on a transportation distance of 1,985 miles at a rate of $2.90 per mile. The cost to dispose of the
waste at the EnergySolutions of Utah site was based on a disposal charge of $123 per cubic foot. In 2009,
ENERCON assumed these unit costs remained the same. Therefore, in the 2009 Report a cost escalation
factor of 1.126 was used to account for inflation between 2006 and 2009. Similarly, this estimate applied
a cost escalation factor of 1.141 to account for inflation between 2009 and 2012. Table A-2 provides a
summary of the EnergySolutions Disposal Costs and Table A-3 provides a summary of the unit cost
information. Costs were added to Table A-2 to account for the 1,250 cubic feet of waste typically on-site
that requires disposal as LLRW at EnergySolutions' disposal facility in Clive, Utah.
22 Rev. 0

SENERCON MTW Decommissioning Cost Estimate
Table 4-3: Hazardous and Toxic Waste Productivity Factors: Light Work
Level A Level B Level C Level D Modified Level DVariables U/M T<70 70<T T>85 T<70 70<T T>85 T<70 70<T T>85 T<70 70<T T>85 T<70 70<T T>85
A. Standard losses Min. 160 160 160 140 140 140 128 128 128 76 76 76 32 32 32
B. Scheduled/heat stress breaks Min. 60 90 120 43 65 86 35 63 101 30 47 63 30 33 44
C. Dexterity losses Min. 78 69 60 74 69 64 55 51 44 4 4 3 5 5 5
D. Total time lost per 8-hr. WD Min. 298 319 340 257 274 290 218 242 273 110 127 142 67 70 81
E. Productivity time per 8-hr. WD Min. 182 161 140 223 206 191 262 238 207 370 353 338 413 410 399
F. Productivity time on clean site Min. 430 430 430 430 430 430 430 430 430 430 430 430 430 430 430
G. HTW Productivity Factor 0.42 0.37 0.33 0.52 0.48 0.44 0.61 •0.55 0.48 0.86 0.82 0.79 0.96 0.95 0.93
Notes:* Standard delays account for all time losses independent of temperature variations. They include safety meetings, instructions, putting on andtaking off of PPE, decontamination, switching air supply/filters, monitoring delays, and cleanup." Scheduled/heat stress breaks account for all paid rest periods per workday." Dexterity losses are based on subjective opinions of the percentage that PPE slows down a normal worker because of factors such as discomfort,clumsiness, weight, and restricted breathing and communication. The number of minutes actually worked is reduced by the percentagerepresenting the average response for that particular PPE level.- Values for A, B, and C were derived by averaging the survey responses for each PPE level. Responses that varied greatly from the average weresubject to omission at the author's discretion." Total paid time = 480 minutes." 50-minute delay on clean site = 10-minute safety meeting and instructions + 10-minute cleanup + 30-minute breaks." Calculations: D = A + B + C E = 480 - D F = 480 - 50 G = E/F U/M = unit of measure WD = workday Min. = minutesT = temperature (°Fahrenheit)* Level A-protection is used in extreme emergency situations only. Productivity factors for Level A should be used with caution because theywere extrapolated from 2 data points.
23 Rev. 0

0u ENERCON MTW Decommissioning Cost Estimate
Table 4-4: Hazardous and Toxic Waste Productivity Factors: Heavy Work
Level A Level B Level C Level D Modified Level DVariables U/M T<70 70<T T>85 T<70 70<T T>85 T<70 70<T T>85 T<70 70<T T>85 T<70 70<T T>85
A. Standardlosses Min. 220 220 220 204 204 204 135 135 135 76 76 76 28 28 28
B. Scheduled/heat stress breaks Min. 60 105 150 50 75 123 64 131 178 30 90 165 30 45 60
C. Dexterity losses Min. 80 62 44 52 46 35 44 34 26 28 24 18 11 10 10
D. Total time lost per 8-hr. WD Min. 360 387 414 306 325 362 243 300 339 134 190 259 69 83 98
E. Productivity timeper 8-hr. WD Min. 120 93 66 174 155 118 237 180 141 346 290 221 411 397 382
F. Productivity time on clean site Min. 430 430 430 430 430 430 430 430 430 430 430 430 430 430 430
G. HTW Productivity Factor 0.28 0.22 0.15 0.40 0.36 0.27 0.55 0.42 0.33 0.80 0.68 0.51 0.96 0.92 0.89
Notes:- Standard delays account for all time losses independent of temperature variations. They include safety meetings, instructions, putting on andtaking off of PPE, decontamination, switching air supply/filters, monitoring delays, and cleanup." Scheduled/heat stress breaks account for all paid rest periods per workday.• Dexterity losses are based on subjective opinions of the percentage that PPE slows down a normal worker because of factors such as discomfort,clumsiness, weight, and restricted breathing and communication. The number of minutes actually worked is reduced by the percentage representingthe average response for that particular PPE level.- Values for A, B, and C were derived by averaging the survey responses for each PPE level. Responses that varied greatly from the average weresubject to omission at the author's discretion." Total paid time = 480 minutes." 50-minute delay on clean site = 10-minute safety meeting and instructions + 10-minute cleanup + 30-minute breaks." Calculations: D = A + B + C E =480 - D F = 480 - 50 G = E/F U/M = unit of measure WD = workday Min. = minutesT = temperature ('Fahrenheit)• Level A-protection is used in extreme emergency situations only. Productivity factors for Level A should be used with caution because they wereextrapolated from 2 data points.
24 Rev. 0

0 EN ERCO N MTW Decommissioning Cost Estimate
Table 4-5: 2006 Honeywell Unprocessed Radioactive Waste Summary
Generated DirectEnergySolutions Decon EnergySolutions Total
Disposal EnergySolutions Disposal Volume DisposalArea Description Volume (ft3) Disposal Volume (ft3) (ft3) Volume (ft3)
Main Production Buildings 2,434 10,860 330,849 344,144
Miscellaneous Production Buildings 1,246 1,373 36,783 39,401
Drum Storage Pads & Ponds 4,184 0 26,800 30,984
Outdoor Areas, Drains & Sewers 105 0 1,644 1,749
Administrative Areas 18 0 500 518
TOTALS 7,987 12,233 396,576 416,796
4.3.2 Waste Processing/Burial Costs
In the 2006 Report, the cost to transport waste to the Duratek central volume reduction facility in Oak
Ridge, Tennessee was based on a transport distance of 295 miles at a rate of $2.90 per mile. Waste
processing at the Studsvik facility in Memphis, Tennessee was included in the 2009 Report for additional
soils identified during the 2009 site characterization. The unit cost was variable depending upon the
volume reduction process. These unit costs were incorporated into the costs presented in Table A-12 of
the 2009 Report. These costs have been increased by 1.141 to account for inflation between 2009 and
2012 as shown in Table A-12 of this report. Due to the improved waste management practices the
following items were removed from Table A-12, as they have been shipped off site: (1) Scrap Metal on
Metals Pad (4,830 tons); (2) New Scrap Metal on Metals Pad (73 tons); (3) 16" x 16" x 8" cubes on
Metals Pad (22 tons); (4) Thin Walled UF6 Cylinders (660 tons); and (5) Soil from I-HF Mitigation &
Fire Water Line Rupture (450 tons). The items were removed because they have been shipped off-site for
disposal. Costs were added to Table A-12 to account for the 2,750 cubic feet of material typically on-site
that will require processing at the Studsvik facility.
4.4 Remediation Methods
Remediation methods selected in the 2006 Report considered contamination levels, degree of penetration
of contamination into substrate material, equipment cost, support equipment costs, material and chemical
costs, the generation of secondary waste volumes (waste in addition to the removed contaminated
material), processing rates, labor requirements, and applicability to various tasks. Typical
25 Rev. 0

jENERCON MTW Decommissioning Cost Estimate
decontamination processes presented in the 2006 Report are summarized in Table 4-6. This table shows
the decontamination methodology, application, the process cost in dollars per square foot ($/ft2) of area
decontaminated, and the volume of secondary waste generated. In the 2006 Report, the unit factors were
applied to specific areas or equipment requiring remediation to determine the most cost-effective process.
ENERCON assumed these variables will remain as presented in the 2006 Report, and applied a cost
escalation factor of 1.126 in the 2009 Report to account for inflation between 2006 and 2009. Similarly,
to account for inflation between 2009 and 2012 a cost escalation factor of 1.141 was applied in this
estimate. The 2012 process costs are shown in Table 4-6.
Table 4-6: Decontamination Methodology Comparison
Secondary2006 2012 Waste
Penetration Process Process VolumeDepth Crew Cost Cost (ft3/1000
Methodology Application (inch) Size ($/ft2) ($/ft2) ft2)
McDonald U-5 Scabbler Floor concrete 0.25 2.0 1.069 1.373 0McDonald U-5 Scabbler Floor concrete 0.50 2.0 2.042 2,623 0McDonald 3WCD Scabbler Wall concrete 0.125 2.0 4.916 6,316 0
Blastrac 10D Shot Scabbler Floor concrete 0.063 1.1 0.437 0,561 0.53Blastrac 1OD Shot Scabbler Floor concrete 0.125 1.1 0.557 0,716 0.53LTC 10-60Pn Special VacuumBlaster All surfaces 0.310 1.3 1.837 2.360 0.53LTC 10-60Pn Special VacuumBlaster All surfaces 0.063 1.3 3.336 4.286 0.53EDCO CPU-10C Floor Plane Floor concrete 0.50 2.0 1.768 2.271 0
C02 Blasting All surfaces 0.00 2.0 4.575 5,878 0Hydrolaser (5-10,000 psi) All surfaces 0.00 2.0 0.952 1.223 9.07
Non-porousHands-On-Decon surfaces 0.00 1.0 2.197 2,823 8.33
4.5 Radiological Waste Volume Reduction Costs
The 2006 volume reduction processes presented in the 2006 Report are summarized in Table 4-7. This
table shows the volume reduction methodology, applicability, transportation container type, and total
process cost per unit weight. In the 2006 Report, unit factors were applied to specific items of equipment
requiring disposal. The waste generated at this facility were assumed to include ventilation systems,
process equipment, concrete, steel, soil and secondary waste generated during the decontamination work
such as protective clothing and materials used during manual decontamination work. ENERCON
assumed these variables will remain, as presented in the 2006 Report, and applied a cost escalation factor
26 Rev. 0

Contains Commercial InformationWithheld under 10 CFR 2.390 -Exemption 4
MTW Decommissioning Cost Estimate
of 1.126 and 1.141 to account for inflation between 2006 and 2009 and 2009 and 2012 respectively. The
exception was that the volume reduction cost to survey and release high density waste was modified to
based on vendor quotes in the 2009 Report. For this estimate, this rate was inflated by a
factor of 1.141 to account for inflation between 2009 and 2012. For ease of reference, Table 4-8 presents
a summary of the volume reduction methodologies and associated costs used in 2006, 2009, and 2012. In
the 2009 Report, a five (5) percent BSFR failure rate was assumed for contaminated concrete and soil and
all other contaminated items were assumed to have a ten (10) percent BSFR failure rate. For this update,
the failure rates were reduced based on the improved waste management practices which have resulted in
lower failure rates. In this update, all contaminated waste was assumed to have a five (5) percent BSFR
failure rate.
Table 4-7: 2006 Volume Reduction Methodology Cost Information
Volume Reduction (VR) Transportation Total VR CostMethodology Applicability Container Type ($/lb)Super Compaction Dry active waste, B-25 for EnergySolutions 4.08
20 lb/ft3 DisposalSurvey & Release Low Density Clean Low Density 55 Gallon Drum 1.31Drums WasteSurvey & Release Low Density Clean Low Density B-25 for EnergySolutions 1.68Boxes Waste DisposalSurvey & Release High Density Clean Waste at B-25 for EnergySolutions 0.50Boxes >60 lb/ft3 Disposal
Survey & Release Asbestos Potentially Clean B-25 for EnergySolutions 2.53Material Asbestos Disposal
Table 4-8: Volume Reduction Cost Summary
Super Compaction 4.08 4.59 5.24Survey & Release Low DensityDrums 1.31 1.48 1.68
Survey & Release Low DensityBoxes 1.68 1.89 2.16
Survey & Release High DensityBoxes 0.50 0.20 0.23
Survey & Release AsbestosMaterial 2.53 2.85 3.25
27 Rev. 0

0ENERCON MTW Decommissioning Cost Estimate
4.6 Unit Costs
The 2006 Report listed select unit costs used for the decommissioning cost estimate. These unit costs are
provided in Table 4-9. ENERCON assumed these unit costs will remain as presented in the 2006 Report,
and applied a cost escalation factor of 1.126 and 1.141 to account for inflation between 2006 and 2009
and 2009 and 2012 respectively. The 2012 unit cost rates are shown in Table 4-10 and Table A-3. Rates
listed in the Table 4-9, Table 4-10, and Table A-3 are non-prevailing wage rates.
Table 4-9: 2006 Decommissioning Estimate Selected Unit Cost Factors
Unit Cost Factor 2006 Unit Cost UnitsRate
Radioactive Soil and Rubble Disposal at EnergySolutions of Utah $123.00 cubic foot
Waste Transportation to EnergySolutions of Utah $2.90 mile
Transportation Distance to EnergySolutions of Utah 1,985 miles
20-ft Sea/Land Container Cost $330.00 month
Management and Supervision $130.84 hour
Engineer $87.50 hourRadiation Protection Supervisor $123.43 hour
Laborer Foreman $45.04 hour
Administrative Assistant $33.03 hour
Instrument Technician $59.78 hourRadiation Protection Technician $59.78 hour
Laborer $28.85 hour
Illinois sales tax 6.25%
Fee 20%
Table 4-10: 2012 Decommissioning Estimate Selected Unit Cost Factors
Unit Cost Factor 2012 Unit Cost Unit
Rate
Radioactive Soil and Rubble Disposal at EnergySolutions of Utah $158.03 cubic foot
Waste Transportation to EnergySolutions of Utah $3.73 mile
Transportation Distance to EnergySolutions of Utah 1,985 miles20-ft Sea/Land Container Cost $423.97 month
Management and Supervision $168.10 hour
Engineer $112.42 hour
28 Rev. 0

0 ENERCONMTW Decommissioning Cost Estimate
Unit Cost Factor 2012 Unit Cost Units,. • Rate
Radiation Protection Supervisor $158.58 hour
Laborer Foreman $57.87 hour
Administrative Assistant $42.44 hour
Instrument Technician $76.80 hour
Radiation Protection Technician $76.80 hour
Laborer $37.07 hour
Illinois sales tax 6.25%
Fee 20%
4.7 Cost Escalation Factor
A methodology for computing the cost escalation due to inflation is provided in Appendix A-14. Labor,
energy, and burial costs escalation factors were calculated. The cost escalation methodology specified in
NUREG-1307 Revision 14 was utilized to calculate a cost escalation factor of 1.141, accounting for
inflation between 2009 and 2012. This is slightly higher than the 2009 cost escalation factor of 1.126,
which accounted for inflation between 2006 and 2009.
4.8 Final Surveys
The 2006 Report estimated final survey costs based on the methodology presented in NUREG-1757
Volume 3. The estimate utilized the number of sample points for the various areas being surveyed, the
type of survey being performed, and the time to perform each of these surveys. Equipment and material
cost to perform the surveys was added along with staff support costs to determine a total cost. The survey
requirements were based on NUREG-1575, Multi-Agency Radiation Survey and Site Investigation
Manual (MARSSIM). The 2006 Report summarized the facility survey labor estimates. ENERCON
assumed these unit costs will remain as selected by Duratek. Therefore, these costs were escalated by a
factor of 1.126 in the 2009 Report to account for inflation between 2006 and 2009. Similarly, a cost
escalation factor of 1.141 was applied to account for inflation between 2009 and 2012.
29 Rev. 0

0"6 ENERCO N MTW Decommissioning Cost Estimate
5.0 DESCRIPTION OF THE DECOMMISSIONING PROCESS
Decommissioning of the Honeywell facility will require that residual radioactive materials be removed or
remediated to meet the unrestricted release criteria to allow removal of the decommissioned facilities
from the site's radioactive materials license. The unrestricted release means no restrictions are imposed
upon the site after license termination. Numerous structures will remain after license termination. These
structures will not have had their structural soundness compromised by decommissioning activities.
5.1 Characterization Survey
Characterization surveys will be conducted in areas of the facility that have a history of radioactive
materials use or storage. Survey results will determine the extent of remediation required to achieve
release of these areas for unrestricted use. Characterization surveys are normally performed in such a
manner that if no contamination is found, the results may be used as final survey data or to augment final
survey data.
5.2 Remediation
The 2009 Report summarized the anticipated remediation activities, with applicable assumptions and
bases, in the remaining areas. For this update to the decommissioning cost estimate, the following items
were removed from Table 5-1, as improved waste management practices resulted in materials shipped
off-site (Miscellaneous Waste): (1) BMIFM Building LLRW Trash in Blue boxes (27 tons); (2) BM/FM
Building LLRW Trash in B-25 boxes (227 tons); (3) BM/FM Building LLRW Trash in drums (338 tons);
(4) Scrap Metal on Metals Pad (4,830 tons); (5) New Scrap Metal on Metals Pad (73 tons); (6) 16" x 16"
x 8" cubes on Metals Pad (22 tons); (7) Material on Waste Pad (1.2 tons); (8) Imhoff Sludge in Crusher
Building (73 tons); (9) Outfall Material in the Crusher Building (5.1 tons); (10) Soil from I-HF Mitigation
& Fire Water Line Rupture (450 tons); and (11) 400 Thin Walled UF 6 Cylinders. These items were
removed due to the improved waste management practices which has resulted in these materials being
shipped off-site for disposal.
Table 5-1: 2012 Decommissioning Basis for Planned Remediation Activities
Building or Area Remediation Activities
Main Production BuildingsFM Building All equipment and structure will be removed from the site. Basement
8" concrete walls and 6" concrete floor slab will be removed. Soil 12"deep below floor slab will be removed.
30 Rev. 0

0 ENERCON MTW Decommissioning Cost Estimate
Building or Area Remediation ActivitiesKOH Muds Bldg, Sodium All equipment and structure will be removed from the site. 1/2" ofRemoval Bldg, Uranium concrete will be removed from the floor slabs and they will be left inRecovery Bldg, & Sample Plant place.BldgFM Building South Pad East & All equipment will be removed from the site. 6" concrete floor slabsFM Building South Pad West will be removed, 18"x24" footings will be removed, and 2'x3'
equipment footings will be removed. Soil 12" deep below floor slabswill be removed.
Miscellaneous Production BuildingsCalciner Building All equipment and structure will be removed from the site. 1/2" of
concrete will be removed from the floor slab and it will be left inplace.
Ore Storage Bldg., Bed Buildings will be decontaminated and remain in place. 1/2" ofMaterials and Filter Fines Bldg., concrete will be removed from the floor slabs and the slabs willCylinder Wash Bldg., remain in place.Hazardous Waste Storage Bldg.,& Drum Crusher Bldg.New Drum Washing Bldg., & All equipment will be removed from the site. Buildings will beNew Drum Crusher Bldg. decontaminated and remain in place. 1/2" of concrete will be removed
from the floor slabs and the slabs will remain in place.Miscellaneous Waste Cold Concrete (Construction Rubble) - 158 tons, Hot Concrete
(Construction Rubble) - 340 tons, Hot Asbestos in Drum CrusherBuilding - 9 tons, Large Rad. Scrap Metal (Fluorinator shell & ColdTrap Shell) - 12.5 tons, Crushed Unwashed Ore Drums - 155 tons,DAW on storage pad - 60 tons, Cold Special / Chemical Waste - 68tons, and 26 Molyflush Cylinders.
Drum Storage Pads & PondsOre Storage Pads, Drum Storage 1/2" of concrete will be removed from the concrete pads and the padsPad, Waste Storage Pad will remain in place.
Uranium Settling Pond Nos. 3 Excavate 3' from pond bottoms, backfill ponds with 9' thick clay.and 4Outdoor Areas, Drains & SewersNon-plant areas Excavate a trapezoidal area 3' wide at the bottom, 2 feet deep, with
side sloped two horizontal to 1 vertical along the 2,770 foot length ofthe drainage ditch. Excavate impacted soils along the surface drainagepathway east of the plant. Excavate impacted soils along the road tothe inactive landfill. Excavate impacted soils along old River Road.
Process Drain & Stormwater Excavate and remove all process drain lines in an area 3' x 5' x 2,567'.Pipe Excavate and remove all storm water drain lines in an area 3' x 5' x
6,175'. Portions of the stormwater piping were not consideredimpacted.
Site Soil Areas Excavate a total of 748,500 square feet to a depth of 1'. Excavateadditional soils to a depth of 3' in limited areas and in additional areasup to 6. Total volume of soils to be excavated is estimated to be883,140 cubic feet. Backfill the excavated areas.
Administrative Areas Remove and replace roofing material at Laundry Area over a 20'x50'area
31 Rev. 0

E N E R C 0 N MTW Decommissioning Cost Estimate
5.2.1 Main Production Buildings
The entire Feed Material Building, structure, concrete slab, building pads, and all of the equipment was
considered to be contaminated. The building and associated encased equipment would need to be
demolished and removed from the site for processing or disposal at a licensed radioactive waste disposal
facility.
The Ion Exchange Building, Sodium Removal Building, KOH Muds Building, Uranium Recovery
Building, and Sample Plant will be treated in a similar manner. The structures and all of the equipment
are considered to be contaminated and would need to be demolished and removed from the site for
processing or disposal at a licensed radioactive waste disposal facility. The building concrete slabs will
be left in place after being decontaminated using surface removal methods.
5.2.2 Miscellaneous Production Buildings
The Ore Storage Building, Bed Materials and Filter Fines Building, Pond Muds Filter Calciner Building,
Cylinder Wash Building, and Drum Crusher Building are considered to be contaminated. The Pond Muds
Filter Calciner Building and associated equipment would need to be demolished and removed from the
site for processing or disposal at a licensed radioactive waste disposal facility. The Ore Storage Building,
Bed Materials and Filter Fines Building, the old and new Cylinder Wash Buildings, and the old and new
Drum Crusher Buildings will be decontaminated and left in place. Building concrete slabs will be left in
place after being decontaminated using surface removal methods.
The GF 2 Plant Building, South GF 2 Plant, SF6/IF5SbF 5 Building, Liquid Fluorine Facility, Liquid
Nitrogen Facility, Surface Treatment Facility, and Calcium Fluoride Building do not require remediation.
5.2.3 Drum Storage Pads and Uranium Settling Ponds
The Ore Storage Pads, KOH Muds Storage Pad, and Waste Storage Pad are considered to be
contaminated. The concrete slabs will be left in place after being decontaminated of surface
contamination.
Uranium Settling Pond Nos. 3 and 4 are contaminated and will be remediated by removing the pond
sediments, pond liner, and contaminated soil under the ponds for disposal at a licensed radioactive waste
disposal facility.
32 Rev. 0

1P EN ERCON MTW Decommissioning Cost Estimate
5.2.4 Outdoor Areas, Drains and Sewers
The sanitary system was not assumed to be impacted; therefore would not require remediation. The
entire process system was assumed impacted and portions of the storm water system were assumed
impacted. No characterization was performed near subsurface piping systems during the 2009 site
characterization due to ongoing production at the site. The determining factor for the storm water system
was based on whether or not the piping was located downgradient of an area that had impacts to surface
and subsurface soils. If a subsurface piping system was assumed impacted, remediation was assumed to
consist of removing the piping and associated backfill. The typical cross section (3-foot wide by 5-foot
deep) used in the 2009 Report is the same cross section used in the estimate in the 2006 Report. The
disposition of the impacted piping and backfill was assumed to be disposal at a licensed radioactive waste
disposal facility. No changes were made to these assumptions in this update of the decommissioning cost
estimate.
The drainage swale from Outfall 002 (formerly referred to as "The Discharge Ditch to River" in the 2006
Report) is contaminated and will be remediated by removing the ditch sediments and surrounding
impacted soil for disposal at a licensed radioactive waste disposal facility. The typical cross section
assumed was a 2-foot deep trapezoidal shaped channel with a three foot bottom and two horizontal to one
vertical side slopes. The total length was estimated to be approximately 2,770 feet. No changes were
made to these assumptions in this update of the decommissioning cost estimate.
The other three notable impacts to areas outside the restricted area (Outdoor Areas) include impacts east
of the Ore Storage Pads, impacts detected along River Road, and the road to the inactive landfill. The
impacts along River Road were detected approximately 25 feet on either side of the center of River Road
over approximately 750 feet. The impacts east of the Ore Storage Pad were in a drainage swale located
east of the Ore Storage Pads. The typical cross section assumed a one-foot deep rectangular shaped
channel with a three foot wide bottom. Approximately 675 feet of drainage swale was assumed impacted.
The impacts along the road to the inactive landfill were isolated. Due to limited sampling, which did not
allow for extensive delineation, an assumed impacted area was used. No changes were made to these
assumptions in this update of the decommissioning cost estimate.
5.2.5 Administrative Areas
The Administration Building, Lab and Office Building, Shop/Stores/Office Building, and Power House
do not require remediation except for the roof above the laundry in the Administration Building. The
2006 Report assumed that the roof was expected to be contaminated and accounted for the removal,
33 Rev. 0

0 ENERCON MTW Decommissioning Cost Estimate
shipment, and disposal at a licensed radioactive waste disposal facility. No change was made to these
assumptions in the 2009 Report or this update to the cost estimate.
5.2.6 Calcium Fluoride Ponds
Calcium Fluoride Ponds B, C, D, and E contain CaF2 materials impacted with minor amount of uranium.
These ponds are permitted RCRA impoundments and will be remediated as RCRA regulated units. These
surface impoundments are included in the RCRA decontamination and decommissioning estimate for the
required RCRA financial security. Closure cost for these ponds have not been included in prior cost
estimates, and are not included in this update to the decommissioning cost estimate.
5.3 License Termination Surveys
License termination surveys, or final release surveys, will be performed using the guidance provided in
NUREG-1575, Multi-Agency Radiation Survey and Site Investigation Manual (MARSSIM). The surveys
will be performed in accordance with specifically developed plans and procedures.
5.3.1 Survey Instrumentation
Selection and use of instrumentation will ensure sensitivities are sufficient to detect the identified nuclidesat the minimum detection requirements. A list of typical final survey instrumentation, radiation detected,and calibration sources are provided in Table 5-2.
Table 5-2: Typical Final Survey Instrumentation
CalibrationInstrument/Detector Detector Type Radiation Detected Source Use
Ludlum Model 2350 with Gas-flow proportional Alpha or beta 99Tc (13) Direct alpha and direct4368, 43-98, 43-94 or (126cm 2) 230Th (c) beta surveys; Beta43-106 detector scans on solid surfaces.Ludlum Model 2350/ GM Pipe Detector Alpha or beta 99Tc (13) Direct beta pipe survey.SP-1 133m or SP-175-3m 230Th (a)Ludlum Model 2350 with Shielded GM Beta 99Tc (13) Direct beta surveys;44-40 detector (15.5cm 2) Beta scans on solid
surfaces.Ludlum Model 2350 with Nal (TI) Scintillator Gamma 137Cs Gamma exposure rate44-2 or 44-10 detector and gamma scans.Eberline Teletector Model Ion Chamber Gamma 60Co (y) Gamma exposure rate6112BEberline SAC-4 Scaler ZnS scintillator Alpha 230Th (a) Smear countingCounterEberline BC-4 Scaler Shielded GM Beta 99Tc (13) Smear countingCounterTennelec Planchette Shielded Gas-flow Alpha and Beta 99Tc (13), Smear countingCounter or Equal proportional 230Th (ca)EG&G NOMAD Gamma HPGe Gamma energy Mixed gamma Nuclide identificationSpectrometer or Equal and intensity and quantification of
soil and sand samples.
34 Rev. 0

SENERCON MTW Decommissioning Cost Estimate
6.0 References
Code of Federal Regulations, 10 CFR 61, Licensing Requirements for Land Disposal of Radioactive
Waste.
Means Building Construction Cost Data, 64th Annual Edition, 2006, R.S. Means Company, Inc.
Code of Federal Regulations, 10 CFR 20.1402, Radiological Criteria for Unrestricted Use.
NUREG-1575, Multi-Agency Radiation Survey and Site Investigation Manual (MARSSIM), (December1997).
NRC Policy and Guidance Directive FC 83-23, Guidelines for Decontamination of Facilities andEquipment Prior to Release for Unrestricted Use or Termination of Byproduct, Source, or Special NuclearMaterial Licenses.
NUREG-1757 Vol. 1, Rev. 1, Consolidated NMSS Decommissioning Guidance DecommissioningProcess for Materials Licensees, Table B.1, Acceptable License Termination Screening Values ofCommon Radionuclides for Building-Surface Contamination.
NUREG/CR-5512, Volume 2, Residual Radioactive Contamination From Decommissioning: User'sManual DandD Version 2.1," Decontamination and Decommissioning (DandD).
Federal Register / Vol. 46, No. 205 / Pages 52061-3 / October 23, 1981 Nuclear Regulatory Commission,"Disposal or Onsite Storage of Thorium or Uranium Wastes From Past Operations".
NUREG-1757 Vol. 1, Rev. 1, Consolidated NMSS Decommissioning Guidance DecommissioningProcess for Materials Licensees, Table B.2, Screening Values (pCi/g) of Common Radionuclides for SoilSurface Contamination Levels.
NUREG-1307, Report on Waste Burial Charges, Revision 11, March 2005.
NUREG-1757 Vol. 3, Rev. 0, Consolidated NMSS Decommissioning Guidance, Financial Assurance,Recordkeeping, and Timeliness, PART II: Financial Assurance.
Code of Federal Regulations, 10 CFR 30, Rules of General Applicability to Domestic Licensing ofByproduct Material.
Site Reclamation Cost Estimate for Plant Located in Metropolis, Illinois, May 2006, Duratek Inc.
Decommissioning Cost Estimate, Revision 1, July 27, 2010, ENERCON Services, Inc.
Historical Site Assessment, April 2009, ENERCON Services, Inc.
Modified DCGLs for the Honeywell Metropolis Works (draft), April 29, 2010, ENERCON Services, Inc.
Radiological Characterization Report For Site Soils, Revision 0, January 11, 2010, ENERCON Services,Inc.
35 Rev. 0

0 lENERCONMTW Decommissioning Cost Estimate
Radiological Characterization Report of the UF6 Pad for the Honeywell Metropolis Works (UF6PAD-RPT-00 1), Revision 0, October 31, 2011, ENERCON Services, Inc.
36 Rev. 0

0 ENERCON MTW Decommissioning Cost Estimate
FIGURES AND DRAWING(S)

Contains Security-Sensitive InformationWithheld Under 10 CFR 2.390 Oil ENERCON
MURRYSVILLE, PENNSYLVANIA
HONEYWELLMETROPOLIS PLANT
FIGURE 1
~SIZE DWG NO. REV
0 INITIAL ISSUE A 09-HON-99.DWG 0REV DESCRIPTION DRN CHK REV APP DATE SCALE NONE SHEET 1 of 1

'-I
Contains Security-Sensitive InformationWithheld Under 10 CFR 2.390 ENERCON
MURRYSVILLE, PENNSYLVANIA
HONEYWELLMETROPOLIS PLANT
FIGURE 2PLANT AREAS
SIZE DWG NO. REV
0 INITIAL ISSUE TPM JMS 10/12/9 A 09- HON- 99. DWG 0REV DESCRIPTION DRN CHK REV APP DATE SCALE AS NOTED SHEET 1 of 1

IIL
MURVUILLE, PBNYLVANIA
Olio River sW 3W 0 3W 6W 12W HONEYWELLFlow I METROPOLIS PLANT
1 "=600'-O0GRAPHIC SCALE FIGURE 3
NON-PLANT AREASSIZE M% NO. REV
0 INTA IS.M .TM CMI REM8Ie,- B 09-HON-099.DWG 0L S T SIREV I DESCRIPTION 1DRN 1CHK 1REV 1APP 1DATE SCALE AS NOTED I SHEET I of J

LEGEND* OWN WELLS
- OBSERVATION
O RE WELLS
I-
Honeywell METROPOLIS WORKS RA : . HUNT
___o___wo_ I MTW-2800 I1IDETAIL #1

ENERCON MTW Decommissioning Cost Estimate
APPENDIX A-1

I ENERCON
Table A-1CONTAMINATED WASTE VOLUME SUMMARYHoneywell - Metropolis Works (MTW) Metropolis, Illinois
Generated Decon EnergySolutions
EnergySolutions EnergySolutions Direct Bury Total
Area Waste Volume Waste Volume Waste Volume Waste Volume
CODE Description (ft3) (ft3) (ft3) (ft3)
1 Main Production Buildings 2,434 10,860 330,849 344,1442 Miscellaneous Production Buildings 1,246 1,373 36,783 39,4013 Drum Storage Pads and Ponds 4,184 0 26,800 30,9844 Outdoor Areas, Drains, and Sewers 105 0 1,644 1,7495 Administrative Areas 18 0 500 5186 Calcium Fluoride Ponds 0 0 0 07 General Plant Area 0 0 1,250 1,250
ITOTALS: 7,987 12,233 397,826 418,046
Notes:(1) Decon Waste Volume: This is the volume of waste generated directly by a decontamination process (this includes such items as blasting grit, treated chemicals, etc.).(2) Generated Waste Volume: This is the volume of protective clothing waste generated by all operations on site and is a function of labor hours for each activity.
(3) Due to rounding of values, the calculated values may not be exact.

0ENERCON MTW Decommissioning Cost Estimate
APPENDIX A-2

ENERCON MTW Decommissioning Cost Estimate
Table A-2CONTAMINATED WASTE DISPOSAL COSTHoneywell - Metropolis Works (MTW) Metropolis, Illinois
Generated Decon EnergySolutionsArea EnergySolutions EnergySolutions Direct Bury Total Waste
CODE Description Disposal Cost Disposal Cost Disposal Cost Disposal Cost
1 Main Production Buildings $428,493 $1,911,578 $58,233,679 $60,573,7492 Miscellaneous Production Buildings $219,235 $241,641 $6,474,254 $6,935,1303 Drum Storage Pads and Ponds $736,370 $0 $4,717,230 $5,453,6024 Outdoor Areas, Drains, and Sewers $18,453 $0 $289,405 $307,8585 Administrative Areas $3,179 $0 $88,006 $91,1856 Calcium Fluoride Ponds $0 $0 $0 $07 General Plant Area $22,467 $0 $197,533 $220,000
_ TOTALS:I $1,428,197 $2,153,219 $70,000,108 J $73,581,524
WASTE DISPOSAL PACKAGING AND SHIPPING COST
Generated Decon EnergySolutionsEnergySolutions EnergySolutions Direct Bury Pack Total Waste
Area Pack and Pack and and Shipping Pack andCODE Description Shipping Cost Shipping Cost Cost Shipping Cost
1 Main Production Buildings $16,685 $74,435 $2,267,580 $2,358,7012 Miscellaneous Production Buildings $8,537 $9,410 $252,103 $270,0493 Drum Storage Pads and Ponds $28,673 $0 $183,686 $212,3594 Outdoor Areas, Drains, and Sewers $718 $0 $11,269 $11,9885 Administrative Areas $123 $0 $3,426 $3,5516 Calcium Fluoride Ponds $0 $0 $0 $07 General Plant Area $463 $0 $8,082 $8,547
TOTALS:] $55,200 $83,845 $2,726,146 J $2,865,194
Notes:(1) Due to rounding of values, the calculated values may not be exact.(2) The costs shown for the General Plant Area are for the 1,250 cubic feet of waste typically on site that requires disposal at EnergySolutions'
disposal facility in Clive, Utah.

Ij ENERCON MTW Decommissioning Cost Estimate
APPENDIX A-3

ENERCON MTW Decommissioning Cost Estimate
Table A-3CONTAINER COSTHoneywell - Metropolis Works (MTW) Metropolis, Illinois
WasteTotal Waste Containers (I) Waste Container
CODE Area Description Volume (ft3) (each) Cost
1 Main Production Buildings 344,144 486 $206,051
2 Miscellaneous Production Buildings 39,401 56 $23,742
3 Drum Storage Pads and Ponds 30,984 44 $18,655
4 Outdoor Areas, Drains & Sewers 1,749 3 $1,272
5 Administrative Areas 518 1 $424
6 Calcium Fluoride Ponds 0 0 $0
7 General Plant Area 1,250 2 $848
TOTALS 418,046 592 $250,992
Note:(1) The number of waste containers is rounded up to the next full container.
UNIT COST FACTORS FOR DISPOSAL
Decon waste disposal rate for Barnwell: $2,884.26 per ft3
DAW waste disposal rate for Barnwell: $2,884.26 per ft3
DAW waste disposal rate for EnergySolutions: $158.03 per ft3
Estimated mileage rate to Barnwell: $3.73 per mile
Estimated transport distance to Barnwell: 1,192 miles
Estimated mileage rate to EnergySolutions: $3.73 per mile
Estimated transport distance to EnergySolutions: 1,985 miles
Average direct bury waste density: 56.4 pound per ft3
Average generated waste density (EnergySolutions waste): 25 pound per ft3
Truck transport waste weight limit: 44,000 pounds
20-ft shipping container internal volume: 709 ft3
Estimated cost for 20-ft shipping container use (4 months): $423.97 each
Local industrial waste landfill shipping & disposal rate: $41.11 per yd 3
Labor rate for shipping: $93.83 per hour

jENERCON MTW Decommissioning Cost Estimate
APPENDIX A-4
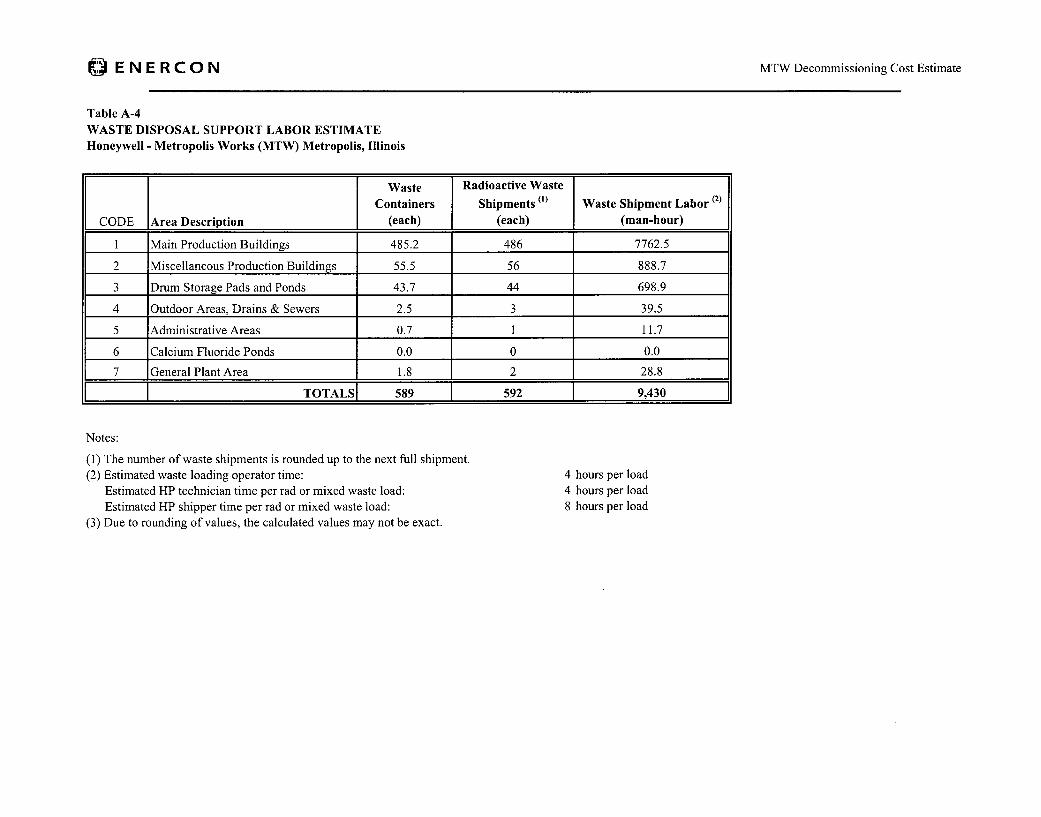
ENERCON MTW Decommissioning Cost Estimate
Table A-4WASTE DISPOSAL SUPPORT LABOR ESTIMATEHoneywell - Metropolis Works (MTW) Metropolis, Illinois
Waste Radioactive Waste
Containers Shipments (1) Waste Shipment Labor (2)
CODE Area Description (each) (each) (man-hour)
1 Main Production Buildings 485.2 486 7762.5
2 Miscellaneous Production Buildings 55.5 56 888.7
3 Drum Storage Pads and Ponds 43.7 44 698.9
4 Outdoor Areas, Drains & Sewers 2.5 3 39.5
5 Administrative Areas 0.7 1 11.7
6 Calcium Fluoride Ponds 0.0 0 0.0
7 General Plant Area 1.8 2 28.8
I TOTALS1 589 1 592 9,430
Notes:
(1) The number of waste shipments is rounded up to the next full shipment.(2) Estimated waste loading operator time:
Estimated HP technician time per rad or mixed waste load:Estimated HP shipper time per rad or mixed waste load:
(3) Due to rounding of values, the calculated values may not be exact.
4 hours per load4 hours per load8 hours per load

64 ENERCON MTW Decommissioning Cost Estimate
APPENDIX A-5

"k ENERCON MTW Decommissioning Cost Estimate
Table A-5CONTAMINATED WASTE DISPOSAL SUMMARYHoneywell - Metropolis Works (MTW) Metropolis, Illinois
SHIP LABOR•TTT• T A •
COUNIAIINER COST S__ HIP LABOR j '-'
Radioactive
Total Waste B-25 Waste Waste Waste Shipment
LOC Volume Containers Waste Container Shipments (2) Labor Waste ShipmentCODE (ft3) (each) Cost () (each) (man-hour) Labor Cost
1 344,144 485.2 $206,051 486 7762.5 $728,329
2 39,401 55.5 $23,742 56 888.7 $83,386
3 30,984 43.7 $18,655 44 698.9 $65,573
4 1,749 2.5 $1,272 3 39.5 $3,701
5 518 0.7 $424 1 11.7 $1,096
6 0 0 $0 0 0 $0
7 1,250 1.8 $848 2 32 $3,002
Total 418,046 588 $250,144 590 I 9,401.3 $885,088
Notes:(1) The number of waste containers is rounded up to the next full container.(2) The number of waste shipments is rounded up to the next full shipment.

ENERCON MTW Decommissioning Cost Estimate
APPENDIX A-6
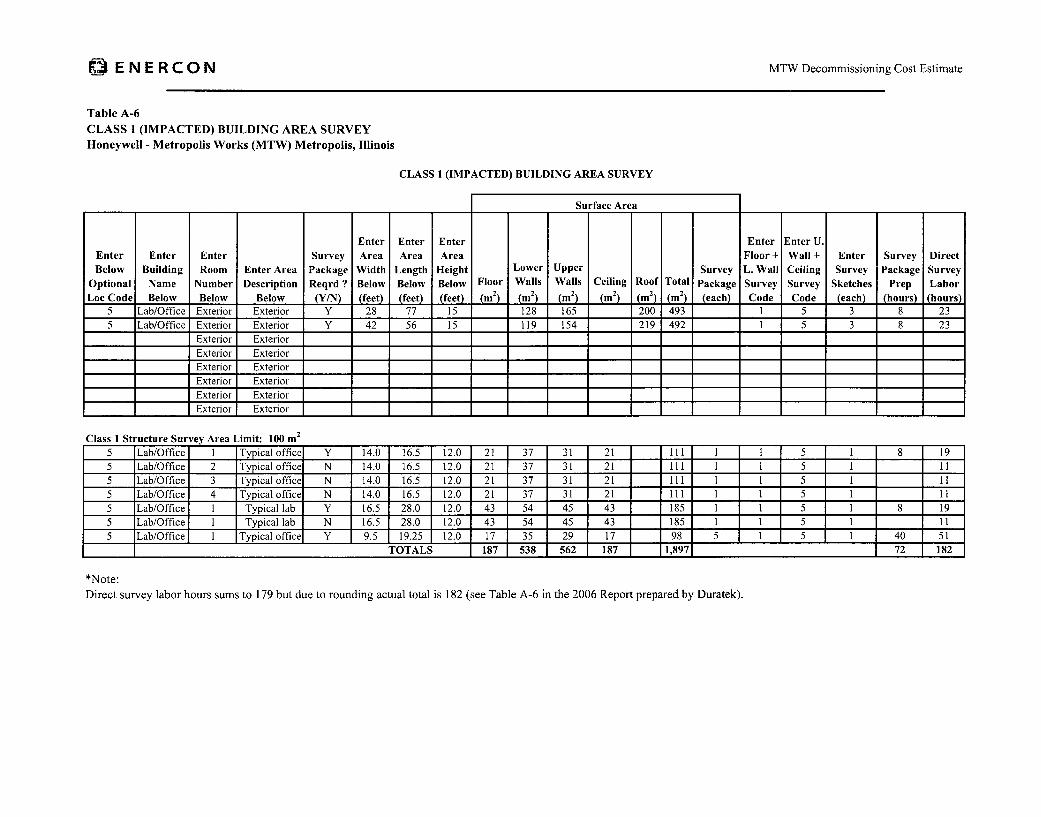
I10 ENERCON MTW Decommissioning Cost Estimate
Table A-6CLASS I (IMPACTED) BUILDING AREA SURVEYHoneywell - Metropolis Works (MTW) Metropolis, Illinois
CLASS 1 (IMPACTED) BUILDING AREA SURVEY
Surface Area
Enter Enter Enter Enter Enter U.Enter Enter Enter Survey Area Area Area Floor + Wall + Enter Survey DirectBelow Building Room Enter Area Package Width Length Height Lower Upper Survey L. Wall Ceiling Survey Package Survey
Optional Name Number Description Reqrd? Below Below Below Floor Walls Walls Ceiling Roof Total Package Survey Survey Sketches Prep LaborLoc Code Below Below Below (YIN) (feet) (feet) (feet) (m) (m) (m) (m) _(m2 (m) (each) Code Code (each) (hours) (hours)
5 Lab/Office Exterior Exterior Y 28 77 15 128 165 200 493 1 5 3 8 235 Lab/Office Exterior Exterior Y 42 56 15 119 154 219 492 1 5 3 8 23
Exterior ExteriorExterior ExteriorExterior ExteriorExterior ExteriorExterior ExteriorExterior Exterior
Class 1 Structure Survey Area Limit: 100 m2
5 Lab/Office I Typical office Y 14.0 16.5 12.0 21 37 31 21 111 1 1 5 1 8 195 Lab/Office 2 Typical office N 14.0 16.5 12.0 21 37 31 21 111 1 1 5 1 115 Lab/Office 3 Typical office N 14.0 16.5 12.0 21 37 31 21 111 1 1 5 1 115 Lab/Office 4 Typical office N 14.0 16.5 12.0 21 37 31 21 111 1 1 5 1 115 Lab/Office 1 Typical lab Y 16.5 28.0 12.0 43 54 45 43 185 1 1 5 1 8 195 Lab/Office I Typical lab N 16.5 28.0 12.0 43 54 45 43 185 1 1 5 1 115 Lab/Office I Typical office Y 9.5 19.25 12.0 17 35 29 17 - 98 5 1 5 1 40 51
TOTALS 187 538 562 187 1,897 72 182
*Note:Direct survey labor hours sums to 179 but due to rounding actual total is 182 (see Table A-6 in the 2006 Report prepared by Duratek).

ENERCON MTW Decommissioning Cost Estimate
Table A-6CLASS 2 (IMPACTED) BUILDING AREA SURVEYHoneywell - Metropolis Works (MTW) Metropolis, Illinois
CLASS 2 (IMPACTED) BUILDING AREA SURVEYEnter Enter Enter Enter Enter Enter U.Below Survey Area Area Area Floor + Wall + Survey Direct
Optional Enter Room Package Width Length Height L. Wall Ceiling Enter Package SurveyLoc Enter Building Name Number Enter Area Description Required ? Below Below Below Survey Survey Survey Prep Labor
Code Below Below Below (Y/N) (feet) (feet) (feet) Code Code Sketches (hours) (hours)
5 Administration Exterior Exterior Y 44.5 150.0 25 1 5 3 8 23
5 Shop/Stores Exterior Exterior Y 50.0 128.0 15 1 5 3 8 23
5 Engr Offices Exterior Exterior Y 64.0 128.0 15 1 5 3 8 23
5 Power House Exterior Exterior Y 35.0 84.0 25 1 5 3 8 23
2 CaF2 Exterior Exterior Y 50.0 64.0 25 1 5 3 8 23
2 SF6/SbF 5 Exterior Exterior Y 54.0 78.0 15 1 5 3 8 23
2 Liquid Fluorine Exterior Exterior Y 28.0 28.0 15 1 5 3 8 23
2 Liquid Nitrogen Exterior Exterior Y 32.0 52.0 15 1 5 3 8 23
2 CF, Exterior Exterior Y 32.0 35.0 15 1 5 3 8 23
2 N2 Gas Facility Exterior Exterior Y 29.0 47.0 15 1 5 3 8 23
2 GF2 Exterior Exterior Y 145.0 210.0 20 1 5 3 8 24
2 Hazardous Waste Exterior Exterior Y 42.0 42.0 20 1 5 3 8 23
Class 2 Structure Survey Area Limit: 1,000 mI 2
5 Admin. Office 1 Typical I st Floor Office Y 11.0 16.5 8 1 5 1 8 19
5 Admin. Office 2 Typical 1st Floor Office N 9.5 9.5 8 1 5 1 11
5 Admin. Office 3 Typical I st Floor Office N 10.0 13.0 8 1 5 1 11
5 Admin. Office 4 Typical 1st Floor Office N 16.5 22.5 8 1 5 1 11
5 Admin. Office 5 Typical 1st Floor Office N 9.0 10.5 8 1 5 1 11
5 Admin. Office 6 Typical 1st Floor Office N 11.0 16.5 8 1 5 1 11
5 Admin. Office 7 Typical I st Floor Office N 11.0 22.5 8 1 5 1 l 1
5 Admin. Office 8 Typical 1st Floor Office N 11.0 16.5 8 1 5 1 11
5 Admin. Office 9 Typical I st Floor Office N 11.0 22.5 8 1 5 1 11
5 Admin. Office 10 Typical 1st Floor Office N 11.0 14.5 8 1 5 1 11

ENERCON MTW Decommissioning Cost Estimate
Table A-6CLASS 2 (IMPACTED) BUILDING AREA SURVEYHoneywell - Metropolis Works (MTW) Metropolis, Illinois
CLASS 2 (IMPACTED) BUILDING AREA SURVEYEnter Enter Enter Enter Enter Enter U.Below Survey Area Area Area Floor + Wall + Survey Direct
Optional Enter Room Package Width Length Height L. Wall Ceiling Enter Package SurveyLoc Enter Building Name Number Enter Area Description Required ? Below Below Below Survey Survey Survey Prep Labor
Code Below Below Below (Y/N) (feet) (feet) (feet) Code Code Sketches (hours) (hours)
5 Admin. Office 11 Typical I st Floor Office N 11.0 22.5 8 1 5 1 11
5 Admin. Office 12 Typical 1st Floor Office N 1.5 8.0 8 1 5 1 11
5 Admin. Office 13 Typical 1st Floor Office Y 11.0 22.5 8 1 5 1 8 19
5 Admin. Office 14 Typical 1st Floor Office Y 11.0 14.5 8 1 5 1 8 19
5 Admin. Office 15 Typical 1st Floor Office N 11.0 22.5 8 1 5 1 11
5 Admin. Office 1 Typical 2nd Floor Office Y 11.0 16.5 8 1 5 1 8 19
5 Admin. Office 2 Typical 2nd Floor Office N 11.0 22.5 8 1 5 1 11
5 Admin. Office 3 Typical 2nd Floor Office N 11.0 16.5 8 1 5 1 11
5 Admin. Office 4 Typical 2nd Floor Office N 11.0 22.5 8 1 5 1 11
5 Admin. Office 5 Typical 2nd Floor Office N 11.0 16.5 8 1 5 1 11
5 Admin. Office 6 Typical 2nd Floor Office N 11.0 22.5 8 1 5 1 11
5 Admin. Office 7 Typical 2nd Floor Office Y 11.0 16.5 8 1 5 1 8 19
5 Admin. Office 8 Typical 2nd Floor Office N 11.0 22.5 8 1 5 1 11
5 Admin. Office 9 Typical 2nd Floor Office N 11.0 16.5 8 1 5 1 11
5 Admin. Office 10 Typical 2nd Floor Office N 11.0 22.5 8 1 5 1 11
5 Admin. Office 11 Typical 2nd Floor Office N 11.0 16.5 8 1 5 1 11
5 Admin. Office 12 Typical 2nd Floor Office N 11.0 22.5 8 1 5 1 11
5 Admin. Office 13 Typical 2nd Floor Office N 11.0 16.5 8 1 5 1 11
5 Admin. Office 14 Typical 2nd Floor Office N 7.0 14.0 8 1 5 1 11
5 Admin. Office 15 Typical 2nd Floor Office N 15.5 19.5 8 1 5 1 11
5 Shop/Stores 1 Large Space N 5.0 7.0 8 1 5 1 1 11
5 Shop/Stores 1 Smaller Space N 16.5 30.0 8 1 5 1 1 11
5 Shop/Stores 2 Smaller Space Y 22.0 31.5 8 1 5 1 8 19

ENERCON MTW Decommissioning Cost Estimate
Table A-6CLASS 2 (IMPACTED) BUILDING AREA SURVEYHoneywell - Metropolis Works (MTW) Metropolis, Illinois
CLASS 2 (IMPACTED) BUILDING AREA SURVEYEnter Enter Enter Enter Enter Enter U.Below Survey Area Area Area Floor + Wall + Survey Direct
Optional Enter Room Package Width Length Height L. Wall Ceiling Enter Package SurveyLoc Enter Building Name Number Enter Area Description Required ? Below Below Below Survey Survey Survey Prep Labor
Code Below Below Below (Y/N) (feet) (feet) (feet) Code Code Sketches (hours) (hours)
5 Shop/Stores 3 Smaller Space N 11.0 12.5 8 1 5 1 11
5 Shop/Stores 4 Smaller Space N 11.0 16.5 8 1 5 1 11
5 Shop/Stores 5 Smaller Space N 11.0 22.5 8 1 5 1 11
5 Shop/Stores 6 Smaller Space N 11.0 16.5 8 1 5 1 11
5 Engr Offices 1 Lunch Area N 11.0 22.5 8 1 5 1 11
5 Engr Offices I Engineering Area N 11.0 16.5 8 1 5 1 11
5 Engr Offices I Drafting Area N 11.0 22.5 8 1 5 1 11
5 Engr Offices 1 Drawing Room N 11.0 14.5 8 1 5 1 11
5 Power House 1 Large Space N 1.5 8.0 8 1 5 1 11
2 Power House 1 Small Space N 11.0 22.5 8 1 5 1 11
2 Power House 2 Small Space Y 11.0 14.5 8 1 5 1 8 19
2 Power House 1 Offices N 11.0 22.5 8 1 5 1 11
2 Power House 2 Offices N 11.0 16.5 8 1 5 1 11
2 Power House 3 Offices N 11.0 22.5 8 1 5 1 11
2 Power House 4 Offices N 11.0 16.5 8 1 5 1 11
2 CaF2 I Offices N 11.0 22.5 8 1 5 1 11
2 CaF2 2 Offices N 11.0 16.5 8 1 5 1 11
2 CaF2 3 Offices N 11.0 22.5 8 1 5 1 11
2 CaF 2 4 Offices N 11.0 16.5 8 1 5 1 11
2 CaF 2 I Large Bay N 11.0 22.5 8 1 5 1 11
2 CaF 2 2 Large Bay N 11.0 16.5 8 1 5 1 11
2 CaF 2 3 Large Bay Y 11.0 22.5 8 1 5 1 8 19
2 SF6/SbF 5 I Offices N 11.0 16.5 8 1 5 1 11

ENERCON MTW Decommissioning Cost Estimate
Table A-6CLASS 2 (IMPACTED) BUILDING AREA SURVEYHoneywell - Metropolis Works (MTW) Metropolis, Illinois
CLASS 2 (IMPACTED) BUILDING AREA SURVEYEnter Enter Enter Enter Enter Enter U.Below Survey Area Area Area Floor + Wall + Survey Direct
Optional Enter Room Package Width Length Height L. Wall Ceiling Enter Package SurveyLoc Enter Building Name Number Enter Area Description Required ? Below Below Below Survey Survey Survey Prep Labor
Code Below Below Below (Y/N) (feet) (feet) (feet) Code Code Sketches (hours) (hours)
2 SF6/SbF 5 2 Offices N 11.0 22.5 8 1 5 1 11
2 SF,/SbF 5 3 Offices N 11.0 16.5 8 1 5 1 11
2 SF6/SbF, 4 Offices N 7.0 160.0 8 1 5 1 112 SF6/SbF 5 1 Large Bay N 7.0 50.0 8 1 5 1 11
2 SF6/SbF5 2 Large Bay Y 7.0 160.0 8 1 5 1 8 192 SF 6/SbF5 3 Large Bay N 4.5 146.0 8 1 5 1 11
2 Liquid Fluorine 1 Interior Y 102.0 159.0 4 1 5 1 8 19
2 Liquid Nitrogen 1 Interior N 21.5 36.0 8 1 5 1 11
2 CF, I Offices N 5.5 6.0 8 1 5 1 11
2 CFx 2 Offices N 7.0 7.5 8 1 5 1 11
2 CFx I Large Bay N 5.5 14.0 8 1 5 1 11
2 N2 Gas Facility 1 Interior N 11.0 16.5 8 1 5 1 11
2 GF2 I Offices N 11.0 16.5 8 1 5 1 11
2 GF2 2 Offices N 11.0 16.5 8 1 5 1 11
2 GF2 3 Offices N 11.0 16.5 8 1 5 1 11
2 GF2 4 Offices N 11.0 16.5 8 1 5 1 11
2 GF, 5 Offices N 11.0 16.5 8 1 5 1 11
2 GF2 6 Offices N 11.0 16.5 8 1 5 1 11
2 GF2 7 Offices N 2.0 8.0 8 1 5 1 11
2 GF2 8 Offices N 11.0 16.5 8 1 5 1 11
2 GF2 9 Offices Y 11.0 16.5 8 1 5 1 8 19
2 GF2 10 Offices N 11.0 16.5 8 1 5 1 112 GF 2 11 Offices N 11.0 16.5 8 1 5 1 1 11

ENERCON MTW Decommissioning Cost Estimate
Table A-6CLASS 2 (IMPACTED) BUILDING AREA SURVEYHoneywell - Metropolis Works (MTW) Metropolis, Illinois
CLASS 2 (IMPACTED) BUILDING AREA SURVEYEnter Enter Enter Enter Enter Enter U.
Below Survey Area Area Area Floor + Wall + Survey Direct
Optional Enter Room Package Width Length Height L. Wall Ceiling Enter Package Survey
Loc Enter Building Name Number Enter Area Description Required ? Below Below Below Survey Survey Survey Prep Labor
Code Below Below Below (Y/N) (feet) (feet) (feet) Code Code Sketches (hours) (hours)
2 GF 2 12 Offices N 11.0 16.5 8 1 5 1 11
2 GF 2 1 Large Bay N 11.0 16.5 8 1 5 1 11
2 GF 2 2 Large Bay N 11.0 16.5 8 1 5 1 11
2 GF 2 3 Large Bay N 19.5 33.5 8 1 5 1 11
2 Hazardous Waste 1 Large Bay N 7.0 36.0 8 1 5 1 1 11
TOTALSI 184 1,330
*Note:Direct survey labor hours sums to 1,289 but due to rounding actual total is 1,330 (see Table A-6 in the 2006 Report prepared by Duratek).

ij ENERCON MTW Decommissioning Cost Estimate
APPENDIX A-7

ENERCON MTW Decommissioning Cost Estimate
Table A-7NON-IMPACTED OPEN LAND UNPAVED AREA SURVEYHoneywell - Metropolis Works (MTW) Metropolis, Illinois
NON-IMPACTED OPEN LAND UNPAVED AREA SURVEYEnter Enter Enter
Enter Enter Survey Area Area Random Survey 10%Below Surface Package Width Length Survey Package Survey
Optional Types Required ? Below Below Sketches Prep LaborLoc Code Below Enter Area Description Below (Y/N) (feet) (feet) (each) (hours) (hours)
4 Grass & soil 100 meter wide corridor outside fenced area Y 328 4800 4 4 5.950 meter wide corridor each side of
4 Grass & soil remediated drainage ditch Y 100 1600 4 4 5.5
TOTALS 8 8 11.4

_0" ENERCON MTW Decommissioning Cost Estimate
Table A-7NON-IMPACTED OPEN LAND UNPAVED AREA SURVEYHoneywell - Metropolis Works (MTW) Metropolis, Illinois
NON-IMPACTED OPEN LAND PAVED AREA SURVEYEnter Enter Enter
Enter Enter Survey Area Area Random Survey 10%Below Surface Package Width Length Survey Package Survey
Optional Types Required ? Below Below Sketches Prep LaborLoc Code Below Enter Area Description Below (Y/N) (feet) (feet) (each) (hours) (hours)
4 Asphalt Employee parking Y 235 240 1 4 4.34 Asphalt Main entrance road Y 30 350 1 4 4.34 Asphalt Trucking entrance road Y 30 350 1 4 4.3
TOTALS 3 12 13

ENERCON MTW Decommissioning Cost Estimate
Table A-7IMPACTED UNPAVED OPEN LAND AREA SURVEYHoneywell - Metropolis Works (MTW) Metropolis, Illinois
IMPACTED UNPAVED OPEN IAND AREA SURVEY
EnterEnter Enter Survey Enter Area Random DirectBelow Surface Package Width Enter Area Subsurface Survey Survey
Optional Types Required ? Below Length Activity Sketches LaborLoc Code Below Enter Area Description Below (Y/N) (feet) Below (feet) Depth (feet) (each) (hours)
4 Soil Corridor between two fences Y 35 4850 1 2 2703 Soil Remediated CaF2 Pond area Y 450 600 1 2 382
3 Soil Remediated Settling Pond area Y 70 100 2 2 264 Soil Remediated drainage ditch area Y 6 1600 2 8 441 Soil Remediated FM Building area Y 110 150 2 2 524 Soil and Grass Remainder of the fenced site Y 900 525 1 8 664
TOTALS 1.438

ENERCON MTW Decommissioning Cost Estimate
Table A-7IMPACTED PAVED OUTDOOR AREA SURVEYHoneywell - Metropolis Works (MTW) Metropolis, Illinois
IMPACTED PAVED OUTDOOR AREA SURVEYEnter Survey Direct
Enter Below Surface Package Enter Area Enter Area Enter Random Survey Survey
Optional Types Reqrd ? Width Below Length Below Survey Sketches Package Prep Labor
Loc Code Below Enter Area Description Below (Y/N) (feet) (feet) (each) (hours) (hours)
4 Asphalt Paved roads inside fenced area Y 24 3500 1 4 294 Asphalt Paved lot by stores Y 55 115 1 4 7
TOTALS 8 36

ENERCON MTW Decommissioning Cost Estimate
Table A-7DRAIN & SEWER SURVEYHoneywell - Metropolis Works (MTW) Metropolis, Illinois
CATCH BASIN AND CLEAN-OUT SURVEY
Basin Survey Duration (hrs): 4 D.I. Survey Duration (hrs): 2Basin Survey Crew Size (men): 2 D.I. Survey Crew Size (men): 1
Enter Enter Basin SurveyBelow Diameter Package Survey Survey
Optional Below Required? Package Prep LaborLoc Code Enter Area Description Below (feet) (Y/N) (hours) (hours)
4 Drain #1 Grate on 10" Concrete Storm Drain 5.0 Y 4 12.04 Drain #2 Grate on 10" Concrete Storm Drain 5.0 N 8.04 Drain #3 Grate on 10" Concrete Storm Drain 5.0 N 8.04 Drain #4 Grate on 10" Concrete Storm Drain 5.0 N 8.04 Drain #5 Grate on 10" Concrete Storm Drain 5.0 N 8.04 Drain #6 Grate on 10" Concrete Storm Drain 5.0 N 8.04 Drain #7 Grate on 10" Concrete Storm Drain 5.0 N 8.04 Drain #8 Grate on 10" Concrete Storm Drain 5.0 N 8.04 Sanitary Sewer Manhole #1 on 4" line 5.0 N 8.04 Sanitary Sewer Manhole #1 on 4" line 5.0 N 8.04 Sanitary Sewer Manhole #1 on 4" line 5.0 N 8.04 Sanitary Sewer Manhole #1 on 4" line 5.0 N 8.04 Sanitary Sewer Manhole #1 on 4" line 5.0 N 8.04 Sanitary Sewer Manhole #1 on 4" line 5.0 N 8.04 Sanitary Sewer Manhole #1 on 4" line 5.0 N 8.04 Sanitary Sewer Manhole #1 on 4" line 5.0 N 8.0
TOTALS 4 132.0TOTALS 4 132.0

ENERCON MTW Decommissioning Cost Estimate
Table A-7DRAIN & SEWER SURVEYHoneywell - Metropolis Works (MTW) Metropolis, Illinois
DRAIN PIPE SURVEY
Pipe Survey Rate (feet/hour): 40Pipe Survey Crew Size (men): 3
Enter Enter Pipe Enter Pipe Survey SurveyBelow Diameter Length Package Package Survey
Optional Below Below Required? Prep LaborLoc Code Enter Area Description Below (feet) (feet) (Y/N) (hours) (hours)
4 10" Storm Drain #1 10 300 Y 4 26.54 10" Storm Drain #2 10 300 N 22.54 10" Storm Drain #3 10 300 N 22.54 10" Storm Drain #4 10 300 Y 4 26.54 10" Storm Drain #5 10 300 N 22.54 10" Storm Drain #6 10 300 N 22.54 4" Cast Iron Drain #1 4 300 Y 4 26.54 4" Cast Iron Drain #1 4 300 N 22.54 4" Cast Iron Drain #1 4 300 N 22.54 4" Cast Iron Drain #1 4 300 Y 4 26.54 4" Cast Iron Drain #1 4 300 N 22.54 4" Cast Iron Drain #1 4 300 N 22.5
TOTALS 16 286

ENERCON MTW Decommissioning Cost Estimate
APPENDIX A-8

1ENERCON MTW Decommissioning Cost Estimate
Table A-8INSTRUMENT COSTSHoneywell - Metropolis Works (MTW) Metropolis, Illinois
48 D&D Duration (months)
5.0 Final Survey Duration (months)
0.5 Characterization Survey Duration (months)
INSTRUMENT COSTS
Char Survey D&D Final Survey D&DMonthly Number Number Number D&D Full Alternate Char Survey D&D Final Survey
Item Commercial Instruments Instruments Instruments Project Monthly Instrument Instrument InstrumentNo. Instrument Description Rental Rate Required Required Required Duration Daration Lease Cost Lease Cosi Lease Cost
INSTRUMENTATION __
I Becton Dickinson Tritium Air Monitor, Model Triton 1 $1,000
2icron Micro R Meter, Model MicroRen $250
3Dosimeter Corp. of America 3090-3 with 50 ft cable and detecto $165
4 Dosimeter Corporation of America 3090-3 $125Dosimeter Corporation of America Self Reading Dosimeter, Mode
5 862/866 $25
6 Eberline Beta/Gamma Survey Meter. Model E-130C $100
7 Eberline Beta/Gamma Survey Meter, Model E-141 $100
8 Eberline Beta/Gamma Survey Meter. Model E-52( $110
9 Eherline Neutron Survey Meter. Model PNRa $450
I Olberline Radiation Monitors. Model RM-1, $75
HI Fberline Radiation Monitors, Model RM-I: $10 _
12 Eberline Radiation Monitors, Model RM-21 $130
13 Eberline Ion Chambers Model RO-: $100
14 Eberline Ion Chambers, Model RO-2A $100
15 Eberline Ion Chambers. Model RO-2( $140
Eberline Low to High Ion Chamber Survey Instrument, Model RO-7
16 includes detectors and cable' $785
17 Eberline Teletector, Model 6112E $605
18 F&J Personal Air Sampler (Breathing Zone), Model Buck S! $50
19 F&J lligh Volume Air Sampler, Model IIV-I $90 2 Y $8,640
20 F&J Low Volume Air Sampler. LV-I $90 6 Y $25,920
21 F&J Low Volume Gooseneck Air Sampler, LV-lz $145
22 Gillian Personal Air Samplers (Breathing Zone), Model GilAir/GilAir- $80
23 Ludlum Survey Meter. Model 3 $50
24 Ludlum Geiger Counter, Model S $70
25 Ludlum Geiger Counter. Model 0 $50
26 Ludlum Ion Chamber, Model S $140
27 Ludlum Survey Meter, Model 12 $75 10 Y $36,000
28 Ludlum Survey Meter Model 12 with Scaler Option $115
29 Ludlum MicroR Meter, Model I0 $120 2 2 Y $11,520 $1,200
30 Ludlum Stretch Scope. Model 77-3 $385
31 Ludlum Stretch Scone, Model 70 $385
32 Ludlum Alaom Ratemeter. Model 17, $85
33 Ludlum Area Monitor. Model 30( $195
34 Ludlum Area Monitor. Model 37! $85
35 Ludlum Area Monitor. Model 39f $80
36 Ludlum Scaler/Ratemeter. Model 2221 $200
37 Lutdlum 2224 Alpha Beta Scaler Ratemetei $135
38 Ludlum Data Logger. Model 2350-1 $200 12 7 Y $115,200 $7,000
39 Ludlum Model 2360 Alpha Beta Data Loggee $155

Ij ENERCON MTW Decommissioning Cost Estimate
Table A-8INSTRUMENT COSTSHoneywell - Metropolis Works (MTW) Metropolis, Illinois
48 D&D Duration (months)
5.0 Final Survey Duration (months)
0.5 Characterization Survey Duration (months)
INSTRUMENT COSTS
Char Survey D&D Final Survey D&DMonthly Number Number Number D&D Full Alternate Char Survey D&D Final Survey
Item Commercial Instruments Instruments Instruments Project Monthly Instrument Instrument InstrumentNo. Instrument Description Rental Rate Required Required Required Duration Duration Lease Cost Lease Cost Lease Cost
NE Techoology Contamination Monitor (Simult. Alpha/Beta), Modc40 CM7A $450
41 OverhoffTritium Monitor, Model 400SB[ $600
42 Reuter Stokes Pressurized Ion Chamber, Model RSS-1 1ý $1,450
43 TSI Porlacouni Plus Respirator Fit Tester and Accessories. Model 8021 $800
44 Victorecen 450P Pressurized Ion Chamher $165Xetex Telescoping Doserate Meter with Accessories, Model 330A
45 Telescan $395RADIATION DETECTORS FOR PORTABLE
INSTRUMENTATION
46 Bieron G-5 Be Ruggidized Fiddler Detectoi $650 1
47 E
berline Aluminum Shielded Pancake Detector, Model IIP-210Al $50
41 Eberline Tungsten Shielded Pancake Detector. Model IlP-210T $100
49 Eberline GM Pancake Detector. Model I1P-26i $30
50 Eherline Spare Detector (Purging), for Model TCM-: $130
51 Eberline GM Detector, Model IIP-27( $35
52 Eherline RO-7-LD Low Range Detector 2R/hr (RO-7 not included $180
53- Eberline RO-7-BM Mid Range Detector 200R/hr (RO-7 not included $180
54 Eberline RO-7 BIt Iligh Range Detector 20KR/hr (RO-7 not included $180
55 Ludlum 50cmt
Alpha Scintillator. Model 43-: $50 12 7 Y $28,800 $1,750
5i Ludlumn 550cmt
Gas Proportional Detector, Model 43-Y1 $65 4 1 $1,300
57 Ludlum 43-89 100 cma Alpha Beta Scintillato $105
58 Ludlum 125cmt Gas Proportional Detector, Model 43-61 $50 12 7 Y $28,800 $1,750
59 Ludlum 125cmt
Gas Proportional Detector. Model 43-10f $55
60 Ludlum Beta Scintillator, Model 44-I $55 9 7 Y $23,760 $1,925
61 Ludlum Gamma Scintillator Detector. Model 44-: $55 9 7 Y $23,760 $1,925
62 Ludlum Pancake GM Detector, Model 44-6 $35 10 Y $16,800
63 Ludlum Gamma Scintillator Detector. Model 44-1 $100
64 Ludlum Windowless Tritium Detector Model 44-Il $205
65 Ludlum Gama Scintillator Detector, Model 44-1 $100
66 Ludlum Energy Compensated GM Detector, Model 44-3l $20 9 7 Y $8,640 $700
6' Ludlum Shielded Pancake GM Detector, Model 44-4( 140 6 Y $11.520SUPPORT EQUIPMENT FOR RADIATION PROTECTIONINSTRUMENTATION
68 Ludlum Floor Monitor Cart, Model 239-1I $105 4 $2_100
69 Modified Harper Carl $40 12 3 $600Concoa Gas Regulator, Model 212 for use with the large (L-PI0) and
70 msedium (Q-PIO) 80 cu f0 capacity P-10 botth $25Concoa Gas Regulator, Model 3251301-180 for use with the small (6R
71 P10) 35 cu fi capacity gas hontk $25 12 7 $875
72 Chargers for Self Reading Dosimeters (battery or electric $15SEMI-PORTABLE RADIATION PROTECTION - <'- - ,j ;-• ' '..,s
__INSTRUMENTATION v
73 Ebcrhiue Personnel Contamination Monitor, Model PCM-II $3A400
74 Eberline Portal Monitor with Scintillation Detectors, Model PM- $3.000
75 rberline Tool Contamination Monitor, Model TCM- $2,000
76 Ilydro Nuclear (HNS) Automated Laundry Frisker. Model ALF-I $1,700
77 Ludlum Beta Air Monitor, Model 333-2 with point $650
Eberline Continuous Alpha Air Particulate Monitor, Model Alpha-6A-l78 w/integral radial entry sampling head and regulated air pum $718
Eberline Continuous Beta Air Particulate Monitor, Model AMS-aw/imergal radial entry sampling head and RAP-I (Regulated Air Pump
791115v/60 hz) $1,021

e" ENERCON MTW Decommissioning Cost Estimate
Table A-8INSTRUMENT COSTSHoneywell - Metropolis Works (MTW) Metropolis, Illinois
48 D&D Duration (months)
5.0 Final Survey Duration (months)
0.5 Characterization Survey Duration (months)
Char Survey D&D Final Survey D&D
Monthly Number Number Number D&D Full Alternate Char Survey D&D Final SurveyItem Commercial Instruments Instruments Instruments Project Monthly Instrument Instrument InstrumentNo. Instrument Description Rental Rate Reouired Required Re uired Duration Duration Lease Cost Lease Cost Lease Cost
LABORATORY & ANALYTICAL COUNTING
SNSTRUMENTATION
Canberra Laboratory Based IIGPe Gamma Spectroscopy System with80 Detector, PC, Software, Shield and Accessories, Model Genie P( $6,136
81 Eberline Beta Sample counter, Model BC- $325
82 Eberline Alpha Scintillation Counter, Model SAC- $400
83 Ludlum Scaler with Single Channel Analyzer, Model 2000/220 $190
84 Ludlum Scaler with M 43-10-1 Sample Counter, Model 2921 $325Canberra PC Based Automatic Low Background Alpha/Beta Counter.
85 Model Tennelec 5XLI3 $3,950
Packard PC Base Liquid Scintillation Counter with Alpha/Beta Option
86 ad Accessories, Model A-255OP2 $4,489
87' Protean Model IPC9025 Automatic Planchet Counte $3,200
88 Derver Instruments Balance 3 kgm +/-0.1 egm. Model XE300( $70 2 2 Y $6,720 $700
85 Merlrer Balance -400 gm +/- 0.01 gm, Model S-400G $81
90 Metler 40 .m +/-0.01 cm. Model BB244 $Ws5
91 Merler 12 kgm +/-0.01 gm, Model PJ1220 $148
92 Troemner Weight Set 0-2000 gmm Model 200( $23 1 1 Y$1104 S111
PORTABLE GAMMA SPECTROSCOPY EQUIPMENTRubble Technologies Portable Gamma Spectroscopy ,l
___Svstem:- -- - - - - -With Detector, PC, Software. Case and Accessories, Model Microspee
93 2$.050U Canberra Portable Gamma Spectroscopv System: __________
94 Model Inspecton $4,750EG&G Portable Gamma Spectroscopy System:Electronics package with GPGe Detector, PC, Software, Lab Dewar,
Vertical Cryostat and Nuclear Lead, movable lead shield with table and95 liner, Model Noma/ $3,450
Exploranium Model GR-135 CZT gamma spec; Nal gamma spec; peaksearch; nuclide identification; neutron detection; and auto ranging dose
9, rates from uR/hr to 10 R/hr (all options included $1,600Canberra Inspector Portable Gamma Spectroscopy
__System:
Electronics package, w/l-lPGe detector in portable dewar, computer,97 software. nuclear lcad/movcable shield/table and lint $240 000 $25,000
Stationary Gamma Spectroscopy System:
Canberra Inspector MCA/GENIE 2000 Software, Inspector AcquisitionElectronics Package with Unit I and fUSEC shaping, Procount 2000
Counting procedures, IlPGe Detector w/3.25" End-cap, Model 7500SL
Cryostat (30 liter dewar), Genie-PC Interactive Peak Fit Software,98 Computer. Printer, Model 747 Top Opening 16" decl $7.475
Portable ISOCS Gamma Spectroscopy System: Canberra In-Situ Objec
Counting System (ISOCS) w/Canberra Inspector Portable MCA/GENII
2000 Software, Inspector Acquisition Electronics Package w/Unit I &
USEC Shaping, Procount 2000 counting Procedures, IIPGc Detectorw/3.25" End-cap, Model 7500SL Cryostat (30 liter dewar), PortableDetector Frame w/complete 2.5 and 5 cm Shields, Stationary Model 74Top Opening 16" Deep Lead Shield, Genie-PC Interactive Peak Fit
90 software. computer and printeo $10.272
Liquid Scintillation Counter: Packard LSC Model M 11302 Tricarb100 Ipha/Beta Option. w/Ruggedization option (shock mounting $5.712
Mobile Analytical Laboratory Trailer: Two each Canberra Inspectorwith IIPGe, 16 in deep lead shield, Packard Liquid Scintillation countel
101 and Automatic Planchet Counte $21,143

Ij ENERCON MTW Decommissioning Cost Estimate
Table A-8INSTRUMENT COSTSHoneywell - Metropolis Works (MTW) Metropolis, Illinois
48 D&D Duration (months)
5.0 Final Survey Duration (months)
0.5 Characterization Survey Duration (months)
Char Survey D&D Final Survey D&DMonthly Number Number Number D&D Full Alternate Char Survey D&D Final Survey
Item Commercial Instruments Instruments Instruments Project Monthly Instrument Instrument InstrumentNo. Instrument Description !Rental Rate Required Required Required Duration Duration Lease Cost Lease Cost Lease Cost
IN-SITU PFPE MONITORING EQUIPMENT ANDD_ ETECTORS
102 Dourtek GM Snoke Probe. Model SN-050-8K $162Duotek t, M Motorzed i.13" Spider Probe Extends/Retracts Detector
and Allows All Detector Signals to be read as group or lndiv., Model SI103 113-3M $175
Duratek GM Motorized 1.13" Spider Probe Extends/Retracts Detector
for Scanning and Direct Measurments of Piping inoernals 3 to 24 inch104 Diameter Pipes, Model SP-1 13-31_ $175
Duretak GM Motorized 1.13" Spider Probe Extends/Retracks Detectorand Allows All Detector Signals to be read as Group or lodiv., Model
105 SP-175-3M $175
Ludlum 0.5 inch Gas Proportional Detector to Survey Straight Piping o
106 0.75 to I inch Diameters, Model 43-94 $150Ludlom 1.5 inch Gas Proportional Detector to Survey Straight Piping oa
107 2 to 3 inch Diameters, Model 43-9W $125
Ludlum I inch Gas Proportional Detector to Survey Straight Piping of108 1.25 to 2 inch Diameters. Model 43-111 $125
109 AEES Model PSL-3 Gas Proportional Detecto $290
110 AEES Model PSL-4 Gus Proportional Detecto $370
SEALED SOURCES AND COUNTING STANDARDS
I] Tc-99 47 mm. Beta Source $100 12 7 Y
112 Th-230 47 mm Alpha Source $100 2 2 Y
113 Cs-137 Gamma Button Source $35
114 Cs-137 10cm x IOcm Beta Source $115
115 Mixed Gamma. 250 nil Sand Marinelli, 1331' $200 I I Y
116 Mixed Gamma, IL Sand Marinelli, 1331' $200
117 Mixed Gamma. I L Water Marinelli, 1331' $200 1 I Y
118 Mixed Gamma. 45mm Petri Dish $200
119 Mixed Gamma. 47 mm Filter Paper $200
120 Mixed gamma, Point Geometrr $200
121 Th-230, 150 mm x 67 mm Anodized Alpha Sourcr $150
122 Tc-99 150 mm x 67 mm Anodized Beta Source $150
123 Cs-137 100 trm x 100 mm Anodized Cesium Source $175
2006 TOTAL INSTRUMENT LEASE COST $587.184 $46.940
2012 TOTAL INSTRUMENT LEASE COST 7

E ENERCON MTW Decommissioning Cost Estimate
APPENDIX A-9

ENERCON MTW Decommissioning Cost Estimate
Table A-9EQUIPMENT COSTSHoneywell - Metropolis Works (MTW) Metropolis, Illinois
48 D&D Duration (months)5.0 Final Survey Duration (months)
D&D Final Survey D&DMonthly Number Number D&D Full Alternate D&D Final Survey
Item Commercial Items Items Project Monthly Equipment EquipmentNo. Equipment Description Rental Rate Required Required Duration Duration Lease Cost Lease Cost
DECON EQUIPMENT _
I Arizona Instruments Mercury Vapor Analyzer, Model Jerome 411 $1402 Fisher Scientific Turbidity Meter, Model DRT- 100B $1353 Metrosonics Heat Stress Monitor, Model 3600 $1404 Rae Systems Photo Ionization Detector, Mini Rae $500 1 1 Y $24,000 $2,5005 Rae Systems Photo Ionization Detector, Multi Rae $6006 TSI Portacount Plus Respirator Fit Tester and Accessories, Model 8020 $800
SEMI PORTABLE DECONTAMINATION EQUIPMENT7 ABB Raymond Grit Blast Unit $5,0008 Hako Twin Head HEPA Vacuum, Model C83985 $1509 HEPA AIRE 110 Vac Ventilation Unit, Model H1990C $135
10 HEPA AIRE 110 Vac Ventilation Unit, Model H2000 $12011 LTC Grit Blast Unit, Model 1060 $3,50012 LTC Grit Blast System, Model 1072 $4,50013 Mac Donald Single Piston Hand Scabbler, Model H-5 $9014 MacDonald Five Piston Floor Scabbler, Model U-5 $82515 MacDonald Three Piston Wall Scabbler, Model 3 WCD $28016 Nor Clean Triple Head HEPA Vacuum, Model BB-105-3 $530 3 Y $76,32017 Pentek 9A Vacuum System Base Unit, Model Vac Pac $3,780 3 Y $544,320181Pentek Needle Gun Comer Cutters $31519 Bico Jaw Crusher, Model 241-36x35 $47520 Ellis Band Saw, Model 3000 $425
OFFICE EQUIPMENT21 Download Notebook Computers: $189 4 4 Y $36,288 $3,78022 Laser Jet Printer: $104 2 2 Y $9,984 $1,040
SAMPLING EQUIPMENT23 Bico Jaw Crusher, Model 241-36x35 $497
24 FISHER SCIENTIFIC - Oven, ISOTEMP 5.0 120VAC CAT.#13247750G: $124 2 2 Y $11,866 $1,236
25 FORESTRY SUPPLIERS - Soil Sampling Auger Kit, CAT.#67352: $361

ENE RCON MTW Decommissioning Cost Estimate
Table A-9EQUIPMENT COSTSHoneywell - Metropolis Works (MTW) Metropolis, Illinois
48 D&D Duration (months)5.0 Final Survey Duration (months)
D&D Final Survey D&DMonthly Number Number D&D Full Alternate D&D Final Survey
Item Commercial Items Items Project Monthly Equipment EquipmentNo. Equipment Description Rental Rate Required Required Duration Duration Lease Cost Lease Cost
TOOLS 17
26 Set of Lifting Slings $7027 8' Fiberglass Step Ladder $5628 1" x 150' Air Hose $3529 Cutting Torch $137 1 Y $6,57630 Band Saw $72 2 Y $6,91231 Lighting standard, 2 500 W halogen quartz $46 1 Y $2,208
HEAVY EQUIPMENT RENTAL _ _ _ 6E _ ___
32 Truck Mounted Hydraulic Crane, 25 Ton $7,459 2 N 1 $14,91833 40' Telescoping Boom Work Platform $3,375 2 1 N 2 $13,500 $16,87534 Oxyacetylene Cutting Outfits, incl gas & tips $960 1 Y $46,07335 1-1/4 C.Y. Backhoe Loader $3,375 1 N 1 $3,37536 Backhoe Attachment, 1,200 ft-lb Hydraulic Hammer $1,620 1 N 2 $3,24037 Crew Carrier $1,188 1 Y $57,024
SAFETY EQUIPMENT m I _ _ __ H38 Respirators $5639 Tripod Lifeline Rescue System $240 1 1 Y $11,520 $1,20040 Portable Axial Electric Blower with 25' ducting $208 1 Y $9,98441 Confined Space Safety Harness $31 1 1 Y $1,488 $155
2006 TOTAL EOUIPMENT LEASE COST $879,596 $26.7862012 TOTAL EQUIPMENT LEASE COST $1,130,075 $34,414

ENERCON MTW Decommissioning Cost Estimate
APPENDIX A-10

ENERCON MTW Decommissioning Cost Estimate
Table A-10DEMOLITION ESTIMATEHoneywell - Metropolis Works (MTW) Metropolis, Illinois
TASK-BASED DEMOLITION COSTS42% Hazardous & Toxic Waste Productivity Factor: Level C, Heavy Work, 70-85'F
A 1n...Ia I okn,. Dof• g~R QPnrr~* |ahnn o'nct l O/..
Material Labor Equipment Material Labor EquipmentLOC WBS Unit Unit Unit Total Total Total TotalCode No. AREA Quantity Unit Price Price Price Price Price Price Price
I FM Building Demolition 370,440 CF $0.00 $0.09 $0.11 $76,336 $97,020 $173,3561 FM Building 6" Floor Slab Demolition 5,145 SF $3.84 $0.49 $47,003 $6,003 $53,0061 FM Building 8" Concrete Wall Demolition 308 LF $9.90 $1.26 $7,261 $924 $8,1851 FM Building 1' Soil Removal 191 CY $5.77 $5.95 $2,618 $2,700 $5,3181 FM Building 50' Buffer 1' Soil Removal 656 CY $5.77 $5.95 $9,006 $9,287 $18,2931 KOH Muds Building Demolition 59,850 CF $0.09 $0.11 $12,333 $15,675 $28,0081 FM Building South Pad East 6" Floor Slab Demolition 3,888 SF $3.84 $0.49 $35,520 $4,536 $40,056
FM Building South Pad East 18"x24" Concrete Footings1 Demolition 252 LF $6.46 $3.77 $3,877 $2,262 $6,139
FM Building South Pad East 2'x3' Equip. Concrete Footings1 Demolition 252 LF $9.23 $5.40 $5,539 $3,240 $8,7791 FM Building South Pad East 1' Soil Removal 144 CY $5.77 $5.95 $1,978 $2,040 $4,0181 FM Building South Pad West 6" Floor Slab Demolition 3,564 SF $3.84 $0.49 $32,560 $4,158 $36,718
FM Building South Pad West 18"x24" Concrete Footings1 Demolition 240 LF $6.46 $3.77 $3,693 $2,154 $5,847
FM Building South Pad West 2'x3' Equip. Concrete FootingsI Demolition 240 LF $9.23 $5.40 $5,275 $3,086 $8,3611 FM Building South Pad West 1' Soil Removal 132 CY $5.77 $5.95 $1,813 $1,870 $3,6831 Sodium Removal Building Demolition 93,240 CF $0.09 $0.11 $19,214 $24,420 $43,6341 U Recovery Building Demolition 114,000 CF $0.09 $0.11 $23,492 $29,857 $53,3491 Sample Plant Building Demolition 71,016 CF $0.09 $0.11 $14,634 $18,599 $33,2332 Calciner Building Demolition 22,500 CF $0.09 $0.11 $4,637 $5,893 $10,5303 Setting Ponds #3 and #4 Excavation, 3' deep 500 CY $2.31 $1.39 $2,748 $1,655 $4,4033 Backfill Settling Pond Area with Clay (9') 1,500 CY $6.10 $1.42 $1.87 $9,150 $5,071 $6,679 $20,9004 Excavate Drainage Ditch to River, 1600'x6'x3' 1,067 CY $3.09 $1.51 $7,840 $3,835 $11,6754 Backfill Drainage Ditch with Clay (5') 1,778 CY $4.77 $1.42 $1.87 $8,480 $6,011 $7,915 $22,4064 Excavate Buried Drain Pipe, 2,000'x3'x5' 1,111 CY _ $3.09 $1.51 $8,166 $3,995 $12,1614 Remove Buried Drain Pipe, 12" 2,000 LF $3.95 $1.29 $18,821 $6,143 $24,9644 Remove Imbedded Drain Pipe 250 LF $1.55 $6.12 $2.01 $388 $3,641 $1,196 $5,2254 Excavate Buried Sewer Pipe, 1,000'x3'x5' 556 CY $3.09 $1.51 $4,083 $1,997 $6,0804 Remove Buried Sewer Pipe 1,000 LF 1 $3.95 $1.29 $9,410 $3,071 $12,481
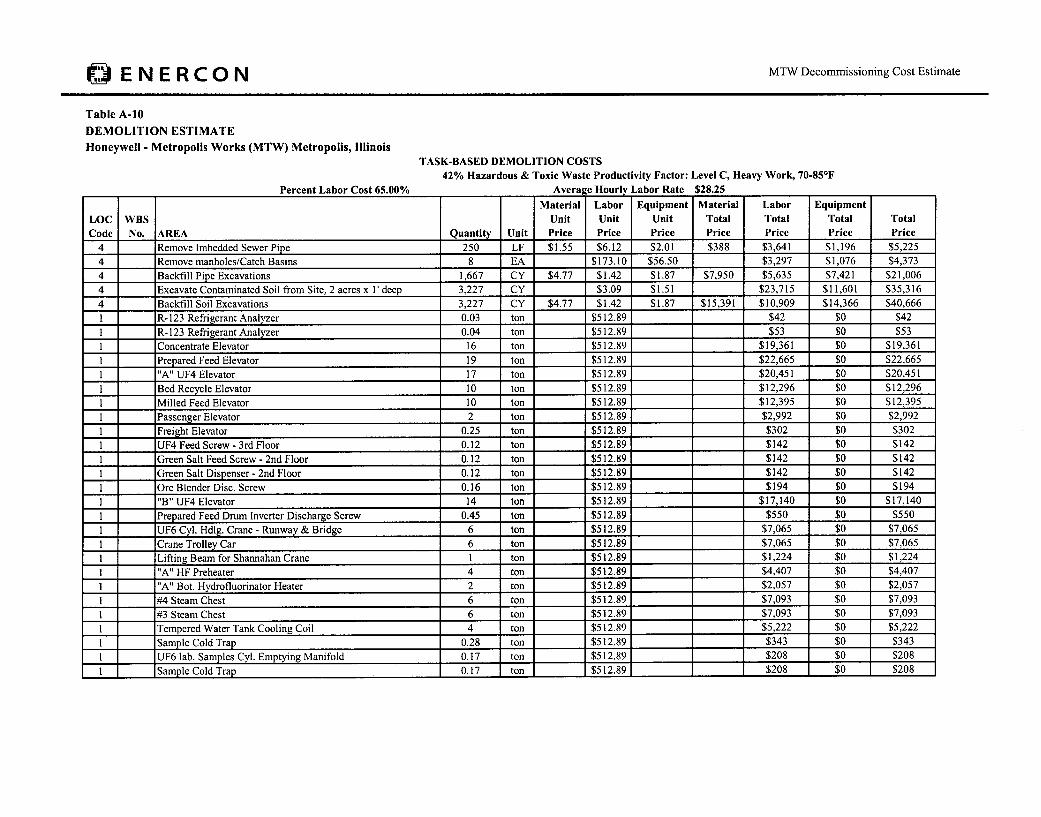
ENERCON MTW Decommissioning Cost Estimate
Table A-10
DEMOLITION ESTIMATEHoneywell - Metropolis Works (MTW) Metropolis, Illinois
TASK-BASED DEMOLITION COSTS42% Hazardous & Toxic Waste Productivity Factor: Level C, Heavy Work, 70-85'F
D . 1 1. *_ 6 Kc fino/ AAra I ah- IDot. T,9• 9* tiet tn auu t.JS U.a.V or -0 fl ti J l
Material Labor Equipment Material Labor Equipment
LOC WBS Unit Unit Unit Total Total Total Total
Code No. AREA Quantity Unit Price Price Price Price Price Price Price
4 Remove Imbedded Sewer Pipe 250 LF $1.55 $6.12 $2.01 $388 $3,641 $1,196 $5,2254 Remove manholes/Catch Basins 8 EA $173.10 $56.50 $3,297 $1,076 $4,373
4 1 Backfill Pipe Excavations 1,667 CY $4.77 $1.42 $1.87 $7,950 $5,635 $7,421 $21,006
4 Excavate Contaminated Soil from Site, 2 acres x 1V deep 3,227 CY $3.09 $1.51 $23,715 $11,601 $35,316
4 Backfill Soil Excavations 3,227 CY $4.77 $1.42 $1.87 $15,391 $10,909 $14,366 $40,666
1 R-123 Refrigerant Analyzer 0.03 ton $512.89 $42 $0 $421 R-123 Refrigerant Analyzer 0.04 ton $512.89 $53 $0 $53
1 Concentrate Elevator 16 ton $512.89 $19,361 $0 $19,361
1 Prepared Feed Elevator 19 ton $512.89 $22,665 $0 $22,665
1 "A" UF4 Elevator 17 ton $512.89 $20,451 $0 $20,451I Bed Recycle Elevator 10 ton $512.89 $12,296 $0 $12,296
1 Milled Feed Elevator 10 ton $512.89 $12,395 $0 $12,395
1 Passenger Elevator 2 ton $512.89 $2,992 $0 $2,992
1 Freight Elevator 0.25 ton $512.89 $302 $0 $302
1 UF4 Feed Screw - 3rd Floor 0.12 ton $512.89 $142 $0 $142
1 Green Salt Feed Screw - 2nd Floor 0.12 ton $512.89, $142 $0 $1421 Green Salt Dispenser - 2nd Floor 0.12 ton $512.89 $142 $0 $142
1 Ore Blender Disc. Screw 0.16 ton $512.89 $194 $0 $194
I "B" UF4 Elevator 14 ton $512.89 $17,140 $0 $17,1401 Prepared Feed Drum Inverter Discharge Screw 0.45 ton $512.89 $550 $0 $550
1 UF6 Cyl. Hdlg. Crane - Runway & Bridge 6 ton $512.89 $7,065 $0 $7,065
1 Crane Trolley Car 6 ton $512.89 $7,065 $0 $7,065
1 Lifting Beam for Shannahan Crane 1 ton $512.89 $1,224 $0 $1,224
1 "A" HF Preheater 4 ton $512.89 $4,407 $0 $4,4071 "A" Bot. Hydrofluorinator Heater 2 ton $512.89 $2,057 $0 $2,057
1 #4 Steam Chest 6 ton $512.89 $7,093 $0 $7,093
1 #3 Steam Chest 6 ton $512.89 $7,093 $0 $7,093
1 Tempered Water Tank Cooling Coil 4 ton $512.89 $5,222 $0 $5,222
1 Sample Cold Trap 0.28 ton $512.89 $343 $0 $343
1 UF6 lab. Samples Cyl. Emptying Manifold 0.17 ton $512.89 $208 $0 $208
1 Sample Cold Trap 0.17 ton $512.89 $208 $0 $208

ENERCON MTW Decommissioning Cost Estimate
Table A-10DEMOLITION ESTIMATEHoneywell - Metropolis Works (MTW) Metropolis, Illinois
TASK-BASED DEMOLITION COSTS42% Hazardous & Toxic Waste Productivity Factor: Level C, Heavy Work, 70-85'F
Percent Labor Cost 65.00% Avera e Hourly Labor Rate $28.25Material Labor Equipment Material Labor Equipment
LOC WBS Unit Unit Unit Total Total Total TotalCode No. AREA Quantity Unit Price Price Price Price Price Price Price
I Unit Heater 1 ton $512.89 $853 $0 $8531 Oil Cooler heat Exchanger 0.02 ton $512.89 $24 $0 $241 Glycol heat Exchanger 0.02 ton $512.89 $24 $0 $241 Over Feed Brine Cooler 7 ton $512.89 $8,900 $0 $8,9001 Economizer 7 ton $512.89 $8,900 $0 $8,9001 R- 134a Condenser 3 ton $512.89 $3,725 $0 $3,7251 R-134a Liquid Suction in Heat Exchanger 1 ton $512.89 $769 $0 $7691 Condenser - R- 123 (Top) 1 ton $512.89 $769 $0 $7691 Condenser - Cooler - R-123 & R-134a (Bottom) I ton $512.89 $1,722 $0 $1,722I Condenser - R- 134a Pump Down 3 ton $512.89 $3,725 $0 $3,7251 #2 Steam Chest 6 ton $512.89 $7,093 $0 $7,0931 #1 Steam Chest 6 ton $512.89 $7,093 $0 $7,0931 "B" HF Preheater 4 ton $512.89 $4,413 $0 $4,4131 "B" Bottom HydroFluorinator Heater 7 ton $512.89 1 $8,896 $0 $8,8961 Flame Tower Preheater (Former "A") 1 ton $512.89 $758 $0 $7581 Strip Heaters - Upper Section Ctr. 0.21 ton $512.89 $261 $0 $2611 Strip Heaters - Upper Section Ctr. 0.21 ton $512.89 1 $261 $0 $2611 Cooling Coils - Lower Section Ctr. 0.21 ton $512.89 $261 $0 $2611 Cooling Coils - Lower Section Ctr. 0.21 ton $512.89 $261 $0 $2611 Mist Eliminator for Vacuum Pump 0.09 ton $512.89 $110 $0 $1101 Oxide Vacuum Filter 1 ton $512.89 $1,232 $0 $1,2321 UF4 Vacuum Filter I ton $512.89 $1,232 $0 $1,2321 Ash Vacuum Cleaner I ton $512.89 $1,232 $0 $1,2321 UF4 Vacuum Cleaner 45 ton $512.89 $54,643 $0 $54,6431 Ash Vacuum Cleaner 1 ton $512.89 $1,232 $0 $1,2321 Oxide Vacuum Cleaner - Dust Collector 3 ton $512.89 1 $4,136 $0 $4,1361 Oxide Vacuum Cleaner - Dust Collector 0.45 ton $512.89 $545 $0 $5451 UF4 Vacuum Cleaner 0.45 ton $512.89 $545 $0 $5451 Spar Filter Fines Drum Dumper 2 ton $512.89 $2,355 $0 $2,3551 _ Hot Box (East) 2 ton $512.89 $2,266 $0 $2,2661 Hot Box (West) 3 ton $512.89 $3,959 $0 $3,959
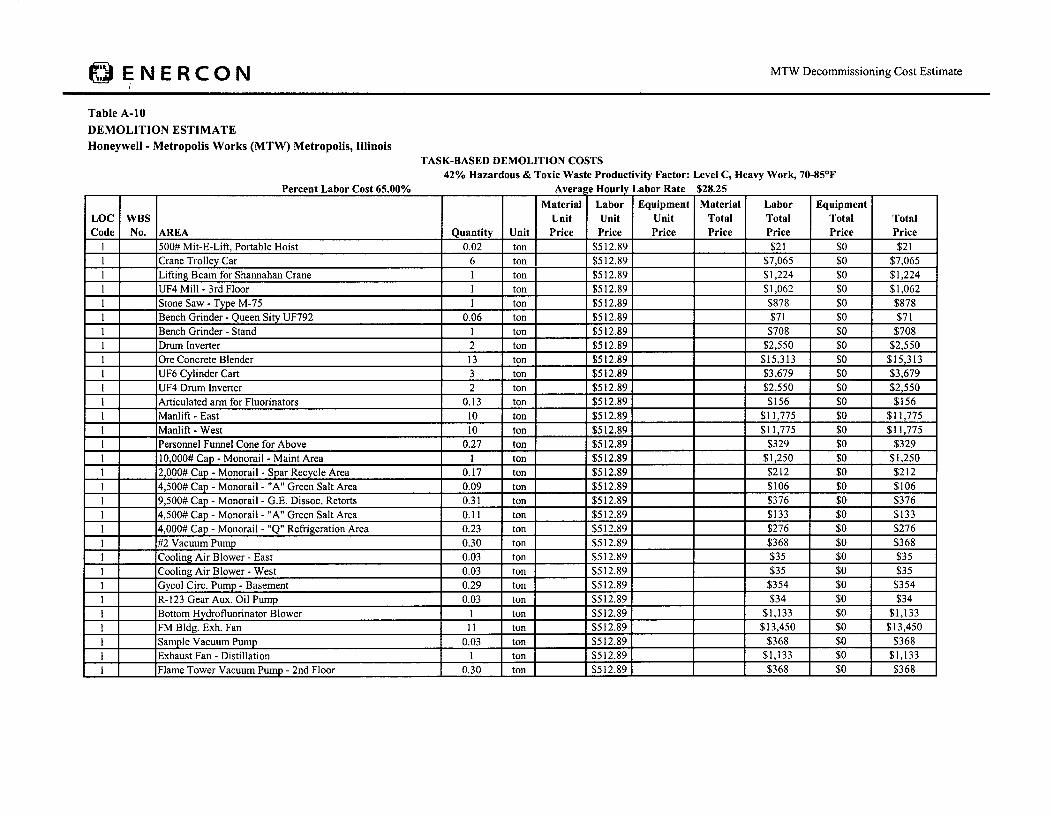
ENERCON MTW Decommissioning Cost Estimate
Table A-10DEMOLITION ESTIMATEHoneywell - Metropolis Works (MTW) Metropolis, Illinois
TASK-BASED DEMOLITION COSTS42% Hazardous & Toxic Waste Productivity Factor: Level C, Heavy Work, 70-85°F
Aroroao l rIv .•hnr Rntf' •tR "P Ien .ohn, Cnq~* • Iiflo/.
Material Labor Equipment Material Labor Equipment
LOC WBS Unit Unit Unit Total Total Total TotalCode No. AREA Quantity Unit Price Price Price Price Price Price Price
1 500# Mit-E-Lift, Portable Hoist 0.02 ton $512.89 $21 $0 $211 Crane Trolley Car 6 ton $512.89 $7,065 $0 $7,0651 Lifting Beam for Shannahan Crane 1 ton $512.891 $1,224 $0 $1,2241 UF4 Mill - 3rd Floor I ton $512.89 $1,062 s0 $1,0621 Stone Saw - Type M-75 I ton $512.89 $878 $0 $8781 Bench Grinder - Queen Sity UF792 0.06 ton $512.89 $71 $0 $711 Bench Grinder - Stand I ton $512.89 $708 $0 $7081 Drum Inverter 2 ton $512.89 $2,550 $0 $2,5501 Ore Concrete Blender 13 ton $512.89 _ $15,313 $0 $15,3131 UF6 Cylinder Cart 3 ton $512.89 $3,679 $0 $3,6791 UF4 Drum Inverter 2 ton $512.89 $2,550 $0 $2,5501 Articulated arm for Fluorinators 0.13 ton $512.89 $156 $0 $1561 Manlift - East 10 ton $512.89 $11,775 $0 $11,775I Manlift - West 10 ton $512.89 $11,775 $0 $11,7751 Personnel Funnel Cone for Above 0.27 ton $512.89 $329 $0 $3291 10,000# Cap - Monorail - Maint Area I ton $512.89 $1,250 $0 $1,2501 2,000# Cap - Monorail - Spar Recycle Area 0.17 ton $512.89 $212 $0 $2121 4,500# Cap - Monorail - "A" Green Salt Area 0.09 ton $512.89 $106 $0 $1061 9,500# Cap - Monorail - G.E. Dissoc. Retorts 0.31 ton 1 $512.89 $376 $0 $3761 4,500# Cap - Monorail - "A" Green Salt Area 0.11 ton $512.89 $133 $0 $1331 .4,000# Cap - Monorail - "Q" Refrigeration Area 0.23 ton $512.89 $276 $0 $2761 1#2 Vacuum Pump 0.30 ton $512.89 $368 $0 $3681 Cooling Air Blower - East 0.03 ton $512.89 $35 $0 $351 Cooling Air Blower - West 0.03 ton $512.89 $35 $0 $351 Gycol Circ. Pump - Basement 0.29 ton 1 $512.89 $354 $0 $3541 R-123 Gear Aux. Oil Pump 0.03 ton $512.89 $34 $0 $34I Bottom Hydrofluorinator Blower 1 ton $512.89 $1,133 $0 $1,1331 FM Bldg. Exh. Fan 11 ton $512.89 $13,450 $0 $13,4501 Sample Vacuum Pump 0.03 ton $512.89 $368 $0 $368I Exhaust Fan - Distillation 1 ton $512.89 $1,133 $0 $1,1331 Flame Tower Vacuum Pump - 2nd Floor 0.30 ton $512.89 $368 $0 $368

V" ENERCON MTW Decommissioning Cost Estimate
Table A-10DEMOLITION ESTIMATEHoneywell - Metropolis Works (MTW) Metropolis, Illinois
TASK-BASED DEMOLITION COSTS42% Hazardous & Toxic Waste Productivity Factor: Level C, Heavy Work, 70-85'F
1 .ahn, flfo* g'•ll"2Paoreont 1.2hat C'n~* I• flalo/.
Material Labor Equipment Material Labor EquipmentLOC WBS Unit Unit Unit Total Total Total TotalCode No. AREA Quantity Unit Price Price Price Price Price Price Price
1 Exhaust Fan - South Center 1 ton $512.89 $1,133 $0 $1,1331 Exhaust Fan - West 1 ton $512.89 $1,133 $0 $1,1331 Exhaust Fan - Maintenance Area 1 ton $512.89 1 $1,133 $0 $1,1331 Basement Exhaust Fan - Hoistwell I ton $512.89 $1,133 $0 $1,1331 Bottom Hydrofluorinator Air Circulation Fan 7 ton $512.89 $8,896 $0 $8,8961 Bottom Hydrofluorinator Comp. Air Blower 1 ton $512.89 $956 $0 $9561 Exhaust Fan - Sxw 1 ton $512.89 $1,133 $0 $1,1331 Refrigeration Vent Blower I ton $512.89 $1,133 $0 $1,1331 Water Cooler 0.17 ton $512.89 $212 $0 $2121 Portable Air conditioner I ton $512.89 $885 $0 $8851 R-123 Centrifugal Compressor 24 ton $512.89 $28,756 $0 $28,7561 R-123 Purge Unit 12 ton $512.89 $14,513 $0 $14,513I R-134a Purge Unit 12 ton $512.89 $14,513 $0 $14,5131 Refrigerant Management System I ton $512.89 $850 $0 $8501 R-123 High Eff. Purge Unit 0.21 ton $512.89 $255 $0 $2551 "A" Bot. Hydrofluorinator 3 ton $512.89, $3,965 $0 $3,9651 "A" Hydrofluorinator 3 ton $512.89 $3,965 $0 $3,9651 "B" Hydrofluorinator 3 ton $512.89 $3,965 $0 $3,9651 "B" Bot. Hydrofluorinator 3 ton $512.89 _ $3,965 $0 $3,9651 "C" Hydrofluorinator 5 - ton $512.89 $5,499 $0 $5,4991 12" Flame Tower Reactor 0.41 ton $512.89 $496 $0 $4961 Separator 0.44 ton $512.89 $531 $0 $5311 Separator 0.44 ton $512.89 $531 $0 $5311 Separator 0.44 ton 1 $512.89 $531 $0 $531I Switch Board - NW 1 ton $512.89 $1,700 $0 $1,7001 Switch Board - NE I ton $512.89 $850 $0 $8501 Switch Board - E - Ctr 1 ton $512.89 $850 $0 $8501 Switch Board - E - S I ton $512.89 $637 $0 $637I High Boiler Still 8 ton $512.89 1 $10,040 $0 $10,0401 Low Boiler Still 7 ton $512.89 $8,402 $0 $8,4021 #2 Sample Vac. Pump Alumina Tower I ton $512.89 $738 $0 $738

jENERCON MTW Decommissioning Cost Estimate
Table A-10DEMOLITION ESTIMATEHoneywell - Metropolis Works (MTW) Metropolis, Illinois
TASK-BASED DEMOLITION COSTS42% Hazardous & Toxic Waste Productivity Factor: Level C, Heavy Work, 70-85*F
Percent Labor Cost 65.00% Average Hourly Labor Rate $28.25Material Labor Equipment Material Labor Equipment
LOC WBS Unit Unit Unit Total Total Total TotalCode No. AREA Quantity Unit Price Price Price Price Price Price Price
I #1 Sample Vac. Pump Alumina Tower I ton $512.89 $738 $0 $7381 #2 Prepared Feed Hopper 19 ton $512.89 $23,462 $0 $23,4621 #1 Prepared Feed Hopper 19 ton $512.89 $23,462 $0 $23,4621 Tempered Water Tank 4 ton $512.89 $4,342 $0 $4,3421 #3 Prepared Feed Hopper 19 ton $512.89 $23,462 $0 $23,4621 Water Treatment Chem. Addition Pot 0.05 ton $512.89 $56 $0 $561 Knock Out Pot 0.26 ton $512.89 $319 $0 $3191 R- 134a Receiver I ton $512.89 $1,781 $0 $1,781I R-134a Accumulator 1 ton $512.89 $1,223 $0 $1,2231 Distillate Crane Scale 0.01 ton $512.89 $17 $0 $171 UF6 Cylinder Shipping Scale 5 ton $512.89 $6,109 $0 $6,1091 Delumper Flame Tower Reactor 0.10 ton $512.89 $117 $0 $1171 _ Rotary Valve - Dust Coil. Discharge 0.03 ton $512.89 $35 $0 $351 Rotary Valve - Draw Off Leg. - Basmt. 0.03 ton $512.89 $39 $0 $391 Rotary Valve - "A" Bot H'Flator Disc. 0.03 ton $512.89 _ $32 $0 $321 Dust Valve - M-410 Spar 0.03 ton $512.89 $32 $0 $321 Rotary Valve Bed Fines Hopper Disc. Rv. 0.03 ton $512.89 $35 $0 $351 Rotary Valve "B" Bot. H'Flator Disc. 0.03 ton $512.89 $35 $0 $351 Dryer Disch. Mill Feed Screw 0.47 ton $512.89 $579 $0 $5791 Calciner Elev. Disc. Screw 0.20 ton $512.89 $248 $0 $2481 Prepared Feed Hopper Feeder Screw I ton $512.89 $806 $0 $8061 Undersized Feed Material Screw I ton $512.89 $1,671 $0 $1,6711 Ore Conc. Surge Hopper Disch. Screw - N 1 ton $512.89 $1,126 $0 $1,1261 Ore Conc. Surge Hopper Disch. Screw - N 1 ton $512.89 $1,126 $0 $1,1261 UF6 Continuous Sample Vessel-East I ton $512.89 $919 $0 $9191 UF6 Continuous Sample Vessel-West I ton $512.89 $919 $0 $9191 "A" Fluorinator Heater 4 ton $512.89 $5,100 $0 $5,1001 1 "B" Fluorinator Heater 4 ton $512.89 $5,100 $0 $5,1001 _ Service Room Hot Water Heater 0.08 ton $512.89 1 $97 $0 $97I _ Tempered Water Spiral Heat Exchanger 20 ton $512.89 $24,921 $0 $24,9211 _ Tempered Water Spiral Heat Exchanger 20 ton $512.89 $24,921 $0 $24,921

0~- ENE RCONTalI -
10MTW Decommissioning Cost Estimate
Table A-10DEMOLITION ESTIMATEHoneywell - Metropolis Works (MTW) Metropolis, Illinois
TASK-BASED DEMOLITION COSTS42% Hazardous & Toxic Waste Productivity Factor: Level C, Heavy Work, 70-85'F
Percent Labor Cost 65.0%o Average Hourly Labor Rate 103._3Material Labor Equipment Material Labor Equipment
LOC WBS Unit Unit Unit Total Total Total TotalCode No. AREA Quantity Unit Price Price Price Price Price Price Price
I Unit Heater 0.04 ton $512.89 $46 $0 $46! Steam Jacket On U-430 0.45 ton $512.89 $550 $0 $5501 _ "B" Top H/EFlator Heater 2 ton $512.89 $2,656 $0 $2,6561 "C" Flator Heater 2 ton $512.89 $2,266 $0 $2,266I Fluidizing Air To All Flators 0.01 ton $512.89 $11 $0 $111 Safety Shower Filter 0.14 ton $512.89 $174 $0 $1741 #1 Instrument Air Filter 0.00 ton $512.89 $6 $0 $61 #2 Instrument Filter 0.00 ton $512.89 $6 $0 $61 Welder - Ideal Arc 250 0.23 ton $512.89 $283 $0 $2831 Welder - Da 250 0.23 ton $512.89 $283 $0 $2831 500# Cap- Mit-E-Lift - Portable Hoist 0.02 ton $512.89 $21 $0 $211 1000# Cap - Hoist - N 0.06 ton $512.89 $73 $0 $731 500# Cap - Hoist - S 0.03 ton $512.89 $37 $0 $371 500# Cap - Hoist - Cont Room Platform 0.03 ton $512.89 $37 $0 $371 Drill Press 0.48 ton $512.89 $591 $0 $5911 Prepared Feed Mill 4 ton $512.89 $4,616 $0 $4,6161 Ore Dryer Discharge Crusher I ton $512.89 $1,520 $0 $1,5201 Scrap Recovery (UF4) Mill I ton $512.89 $1,520 $0 $1,5201 Prepared Feed Mill 4 ton $512.89 $4,616 $0 $4,6161 Ore Precrusher 1 ton $512.89 $1,594 $0 $1,5941 Motor Control Center (C-Fm-40) 3 ton $512.89 $3,471 $0 $3,4711 1000# Cap - Monorail - Valve Room 0.13 ton $512.89 $159 $0 $1591 2000# - Monorail - "B" Flator 0.07 ton $512.89 $80 $0 $801 2000# Cap Monorail - "A" Flator 0.07 ton $512.89 $89 $0 $891 Vacuum Pump - East 1 ton $512.89 $850 $0 $8501 Vacuum Pump - West 1 ton $512.89 $850 $0 $8501 Yard Safety Shower Circ. Pump 0.05 ton $512.89 $57 $0 $571 _ Yard Safety Shower Circ. Pump 0.05 ton $512.89 $57 $0 $571 _ Yard Safety Shower Circ. Pump 0.05 ton $512.89 $57 $0 $571 Safety Shower Circ. Pump 0.06 ton 1 $512.89 _ $71 $0 $711 "A" Top HEFlator Blower 2 ton 1 $512.89 1 $2,833 $0 $2,833

ENERCON MTW Decommissioning Cost Estimate
Table A-10DEMOLITION ESTIMATEHoneywell - Metropolis Works (MTW) Metropolis, Illinois
TASK-BASED DEMOLITION COSTS42% Hazardous & Toxic Waste Productivity Factor: Level C, Heavy Work, 70-85'F
Percent Labor Cost 65.00U% Average Hourly Labor Rate $:28.25Material Labor Equipment Material Labor Equipment
LOC WBS Unit Unit Unit Total Total Total TotalCode No. AREA Quantity Unit Price Price Price Price Price Price Price
I1 I "A" Flator Blower 9 ton $512.89 $10,412 $0 $10,4121 "B" Flator Blower 9 ton $512.89 $10,412 $0 $10,412
I "B" Flator Comb. Air Blower I ton $512.89 1 $956 $0 $9561 "A" Flator Comb. Air Blower 0.11 ton $512.89 $130 $0 $1301 _Exhaust Fan - Maint. Area 0.06 ton $512.89 $67 $0 $671 Control Room A/C Blower 0.03 ton $512.89 $35 $0 $351 Exh. Fan - Service Room 0.06 ton $512.89 $67 $0 $671 _ Man-Cooling Fan I ton $512.89 $637 $0 $637
1 "B" Top HWFlator Air Circ. Fan 6 ton $512.89 $7,649 $0 $7,6491 Control Room Fan 1 ton $512.89 $956 $0 $9561 1"C" Flator Heat Circ. Air Blower 9 ton $512.89 $10,412 $0 $10,4121 1"C" Flator Heat Comb. Air Blower 1 ton $512.89 $956 $0 $956I I Drinking Water Cooler 0.17 ton $512.89 $212 $0 $212I _ Refrigerator - Control Room 0.07 ton $512.89 $81 $0 $811 _ Refrigerator - Cont. Room - Foreman 0.07 ton $512.89 $81 $0 $811 A/C & Heating Unit 1 ton $512.89 $1,062 $0 $1,0621 1 A/C & Heating Unit 3 ton $512.89 $3,718 $0 $3,718
1 1"B" Top H-Flator 4 ton $512.89 $4,656 $0 $4,6561 Ore Crusher Grizzley Screen 0.36 ton $512.89 $443 $0 $4431 _ Calciner Grizzley 0.36 ton $512.89 $443 $0 $4431 Scrap Recovery Screen 1 ton $512.89 $1,062 $0 $1,062
1 Switchboard - N X E 4 ton $512.89 $4,834 $0 $4,8341 Switchboard - N X W 4 ton $512.89 $4,834 $0 $4,8341 Switchboard - N X W 3 ton $512.89 $3,825 $0 $3,8251 _ Dryer Surge Hopper 3 ton $512.89 $3,187 $0 $3,187
I I UF6 Blow Off& Dump Truck 1 ton $512.89 $1,226 $0 $1,2261 Bed Fines Hopper 11 ton 1 $512.89 $13,280 $0 $13,2801 Scrap Recovery Hopper 0.30 ton $512.89 $362 $0 $362I Safety Shower Heater Storage Tank I ton $512.89 $669 $0 $669I Ore Conc. Surge Hopper 8 ton 1 $512.89 $9,833 $0 $9,833I "A" Flator Bed - Vibrator 0.01 ton 1 $512.89 $8 $0 $8

IENERCON MTW Decommissioning Cost Estimate
Table A-10DEMOLITION ESTIMATEHoneywell - Metropolis Works (MTW) Metropolis, Illinois
TASK-BASED DEMOLITION COSTS42% Hazardous & Toxic Waste Productivity Factor: Level C, Heavy Work, 70-85'F
A I~n.. , U AI h-1.+a VYl 0)9P.-.+ I h. P-# KC Mo/
Material Labor Equipment Material Labor EquipmentLOC WBS Unit Unit Unit Total Total Total TotalCode No. AREA Quantity Unit Price Price Price Price Price Price Price
I "B" Flator Bed - Vibrator 0.01 ton $512.89 $8 so $81 "B" Top H-Flator Disc. Line - Vibrator 0.01 ton $512.89 $8 $0 $81 _ Undersize Feed Mati. Screw - Vibrator 0.01 ton $512.89 $8 $0 $81 "C" Flator Bed - Vibrator 0.01 ton $512.89 $8 $0 $81 Ore Conc. Surge Hopper - N- Vibrator 0.01 ton $512.89 $8 $0 $81 Ore Conc. Surge Hopper - S - Vibrator 0.01 ton $512.89 $8 $0 $81 Cone. Blender Feed Line - Vibrator 0.01 ton $512.89 $8 $0 $8I "A" Bottom H-Flator Feeder 0.39 ton $512.89 $481 $0 $4811 _ In-Range Discharge 0.39 ton $512.89 $481 $0 $4811 Scrap Rec. Mill Feeder 0.39 ton $512.89 $481 $0 $4811 Fines Discharge 0.39 ton $512.89 $481 $0 $4811 "A" Flator Spar Feeder 0.39 ton $512.89 $481 $0 $4811 "B" Flator UF4 Feeder 0.39 ton $512.89 $481 $0 $4811 "A" Flator UF4 Feeder 0.39 ton $512.89 $481 $0 $4811_1 "B" Flator Spar Feeder 0.39 ton $512.89 $481 $0 $4811 "B" Bottom H-Flator Feeder 0.39 ton $512.89 $481 $0 $4811 "C" Flator UF4 Feeder 0.39 ton $512.89 $481 $0 $4811 "C" Flator Spar Feeder 0.39 ton $512.89 $481 $0 $4811 Ore In-Range Discharge 0.39 ton $512.89 $481 $0 $4811 Ore In-Range Discharge 0.39 ton 1 $512.89 $481 $0 $4811 "A" Reoxidizer Screw 0.47 ton $512.89 $579 $0 $5791 Flator Filter Fines Screw 0.47 ton $512.89 $579 $0 $5791 _Ore Dryer Feed Screw I ton $512.89 $1,377 $0 $1,377I "B" Reoxidizer Screw 6 ton $512.89 $7,649 $0 $7,6491 Ore Classifier Feed Screw 0.46 ton $512.89 $567 $0 $567I Hoist Trolley 0.11 ton $512.89 $137 $0 $137I Hoist Trolley 0.11 ton $512.89 1 $137 $0 $1371 Ore Dryer 0.00 ton $512.89 $0 $0 $0I Filter Dryer 4 ton $512.89 $5,100 $0 $5,1001 Ore Dryer Heater 5 ton $512.89 $6,105 $0 $6,1051 "A" Top Hflator Heater 4 ton $512.89 $5,100 $0 $5,100

ENERCON MTW Decommissioning Cost Estimate
Table A-10DEMOLITION ESTIMATEHoneywell - Metropolis Works (MTW) Metropolis, Illinois
TASK-BASED DEMOLITION COSTS42% Hazardous & Toxic Waste Productivity Factor: Level C, Heavy Work, 70-85OF
AvoonnHn.rvI .char Uato tgR •4PrnfI chnr ('nct f; flfl0/.
Material Labor Equipment Material Labor Equipment
LOC WBS Unit Unit Unit Total Total Total TotalCode No. AREA Quantity Unit Price Price Price Price Price Price Price
I High Boiler Still Condenser 0.05 ton $512.89 $59 $0 $591 H20 Filter for Metal Tube D/P Test - E 0.03 ton $512.89 $39 $0 $391 H20 Filter for Metal Tube D/P Test - W 0.03 ton $512.89 $39 $0 $391 Hot Glycol Filter 0.03 ton $512.89 $39 $0 $391 Decon Trunk Vacuum 0.03 ton $512.89 $39 $0 $391 Welder 0.19 ton $512.89 $232 $0 $232I Hot Box I ton $512.89 $719 $0 $7191 500# Cap. Portable Hoist 0.02 ton $512.89 $21 $0 $211 4000# Cap. Hoist 0.08 ton $512.89 $96 $0 $961 2000# Cap. Hoist 0.06 ton $512.89 $77 $0 $771 1000# Cap. Hoist 0.04 ton $512.89 $45 $0 $451 1000# Cap. Hoist 0.12 ton $512.89 $142 $0 $1421 1000# Cap. Hoist - Electric 0.03 ton $512.89 $42 $0 $421 Scrap Recycle Drum Inverter 2 ton $512.89 $2,656 $0 $2,656I Washer - Decon I ton $512.89 $1,275 $0 $1,2751 2,500 Cap. Monorail 0.26 ton $512.89 $319 $0 $3191 2,000 Cap. Monorail 0.11 ton $512.89 $133 $0 $1331 4,500 Cap. Monorail 0.11 ton $512.89 $133 $0 $1331 4,000 Cap. Monorail 0.32 ton $512.89 $386 $0 $386I Monorail 0.35 ton $512.89 $425 $0 $4251 1 4,000 Cap. Monorail 0.09 ton $512.89 $106 $0 $106I Dryer Combustion Air Blower 0.01 ton $512.89 $18 $0 $18I "A" Flator Offgas Lines Cooling Blower 0.23 ton $512.89 $283 $0 $283I Exhaust Fan - Service Room I ton $512.89 $956 $0 $9561 Exhaust Fan - Decon 0.11 ton $512.89 $130 $0 $1301 Wall Exhaust Fan - South I ton $512.89 , $1,133 $0 $1,1331 1 Wall Exhaust Fan - West I ton $512.89 $1,133 $0 $1,1331 4#317-1 Vent Unit I ton $512.89 $963 $0 $9631 Exhaust Fan 1 ton $512.89 $1,133 $0 $1,1331 Exhaust Fan 1 ton $512.89 $1,133 $0 $1,1331 Decon Bead Blaster 3 ton $512.89 $3,400 $0 $3,400

E ENERCON MTW Decommissioning Cost Estimate
Table A-10DEMOLITION ESTIMATEHoneywell - Metropolis Works (MTW) Metropolis, Illinois
TASK-BASED DEMOLITION COSTS42% Hazardous & Toxic Waste Productivity Factor: Level C, Heavy Work, 70-85'F
Avorno ln~~ .nhnr Unte C2R_2PentI .ohn, Cnt i;• Iflll/.
Material Labor Equipment Material Labor Equipment
LOC WBS Unit Unit Unit Total Total Total TotalCode No. AREA Quantity Unit Price Price Price Price Price Price Price
I Exhaust Fan I ton $512.89 $1,133 $0 $1,1331 "B" Top Hflator Combustion Air Blower 1 ton $512.89 $956 $0 $9561 1 Wall Exhaust Fan - Southwest 1 ton $512.89 $1,133 $0 $1,1331 Drinking Cooler 0.17 ton $512.89 $212 $0 $212I "A" Top Hflator 4 ton $512.89 $4,636 $0 $4,6361 4iE Dia. Prepared Feed Air Classifier 1 ton $512.89 $918 $0 $918I 6AE Dia. Prepared Feed Air Classifier 2 ton $512.89 $1,965 $0 $1,9651 Switchboard - East-West 3 ton $512.89 $4,250 $0 $4,2501 Switchboard - East-East 5 ton $512.89 $6,374 $0 $6,3741 Ultrasonic Cleaner Tank - Decon 1 ton 1 $512.89 $1,700 $0 $1,700
1 Dryer Feed Hopper 3 ton $512.89 $3,400 $0 $3,4001 #1 Still Feed Tank 4 ton $512.89 $5,307 $0 $5,3071 #2 Still Feed Tank 4 ton $512.89 $5,307 $0 $5,3071 Bed Fines Hopper 9 ton $512.89 $11,067 $0 $11,0671 Spar Discharge Hopper 3 ton $512.89 $4,250 $0 $4,2501 1#3 Still Feed Tank 4 ton $512.89 $5,307 $0 $5,3071 Dryer Feed Hopper Vibrator - West 0.01 ton $512.89 $8 $0 $81 "A" Reoxidizer Screw Disch. Vibrator 0.01 ton $512.89 $8 $0 $8I "B" Flator Primary Filter Disch. Vibrator 0.01 ton $512.89 $8 $0 $81 "B" Flator B.U. Filter Disch. Vibrator 0.01 ton $512.89 $8 $0 $81 "A" Flator Primary Filter Disch. Vibrator 0.01 ton $512.89 $8 $0 $81 "A" Flator B.U. Filter Disch. Vibrator 0.01 ton $512.89 $8 $0 $81 F-416 Discharge Line Vibrator 0.01 ton $512.89 $8 $0 $81 "C2" Flator Primary Filter D.O. Vibrator 0.01 ton $512.89 $8 $0 $8
1 "C 1" Flator Primary Filter D.O. Vibrator 0.01 ton $512.89 __$8 $0 $81 Dryer Feed Hopper Vibrator - East 0.01 ton $512.89 __$8 $0 $8
1 "A" Flator Primary Filter Disch. R/V 0.39 ton $512.89 $481 $0 $4811 "A" Flator Primary Filter Disch. R/V 0.39 ton $512.89 $481 $0 $481
1 "B" Flator Primary Filter Disch. R/V 0.39 ton $512.89 $481 $0 $481
1 "B" Flator Primary Filter Disch. R/V 0.39 ton $512.89 $481 $0 $481
I Spar Recycle Disch. R/V 0.39 ton 1 $512.89 $481 $0 $481

b lENERCON MTW Decommissioning Cost Estimate
Table A-10DEMOLITION ESTIMATEHoneywell - Metropolis Works (MTW) Metropolis, Illinois
TASK-BASED DEMOLITION COSTS42% Hazardous & Toxic Waste Productivity Factor: Level C, Heavy Work, 70-85OF
Averoe mnurlvI .nhnr flute V'R_•5Percent I .uhnr Cn~t #q•flfl°/..
Material Labor Equipment Material Labor EquipmentLOC WBS Unit Unit Unit Total Total Total TotalCode No. AREA Quantity Unit Price Price Price Price Price Price Price
I "C" Flator Primary Filter Disch. R/V 0.39 ton $512.89 $481 $0 $4811 "C" Flator Primary Filter Disch. R/V 0.39 ton $512.89 $481 $0 $4811 Screw Conveyor 0.33 ton $512.89 1 $403 $0 $4031 C Fluorinate Filter Fines Screw 0.20 ton $512.89 $249 $0 $2491 Rotex Feed Screw 0.23 ton $512.89 $280 $0 $2801 Mud Bailer Feed Screw 1 ton $512.89 $1,230 $0 $1,230I Hoist Trolley - "A" Green Salt 0.03 ton $512.89 $32 $0 $321 A-I Primary Cold Trap 1 ton $512.89 $1,617 $0 $1,6171 A-2 Primary Cold Trap 1 ton $512.89 $1,617 $0 $1,6171 A-3 Primary Cold Trap 1 ton $512.89 $1,617 $0 $1,6171 Product Condenser 0.02 ton $512.89 $25 $0 $251 A-4 Primary Cold Trap 2 ton $512.89 $2,867 $0 $2,8671 B-2 Primary Cold Trap 2 ton $512.89 $2,867 $0 $2,8671 B-3 Primary Cold Trap 2 ton $512.89 $2,867 $0 $2,8671_1 B-I Primary Cold Trap 2 ton $512.89 $2,867 $0 $2,8671 B-4 Primary Cold Trap 2 ton $512.89 $2,867 $0 $2,867I Alt. Primary Cold Trap - Nooter 2 ton $512.89 $2,867 $0 $2,8671 "B" Hydrogen Preheater 0.20 ton $512.89 $244 $0 $2441 "B" Reductor Heater - Surface Comb. 0.19 ton $512.89 $230 $0 $2301 Instrument Air Filter 0.00 ton $512.89 $5 $0 $51 Chem. Trap - Fluorine Analizer 0.00 ton $512.89 $5 $0 $51 Chem. Trap - Fluorine Analizer 0.00 ton $512.89 $5 $0 $51 Chem. Trap - Fluorine Analizer 0.00 ton $512.89 $5 $0 $51 Chem. Trap - Fluorine Analizer 0.00 ton 1 $512.89 $5 $0 $51 _ Chem. Trap - Sample Point 0.00 ton $512.89 $5 $0 $51 Chem. Trap - Fluorine Analizer 0.00 ton $512.89 $5 $0 $51 Air Filter 1 ton $512.89 1 $1,383 $0 $1,3831 Welder - Idealarc 400 0.19 ton $512.89 $237 s0 $2371 Welder - 400 amp stick 0.19 ton $512.89 $237 $0 $2371 HotBox 0.02 ton $512.89 $19 $0 $19I E-409-A-I Primary Cold Trap Hot Box I ton 1 $512.89 $1,133 $0 $1,1331 E-408-A-2 Primary Cold Trap Hot Box I ton 1 $512.89 __$1,133 $0 $1,133
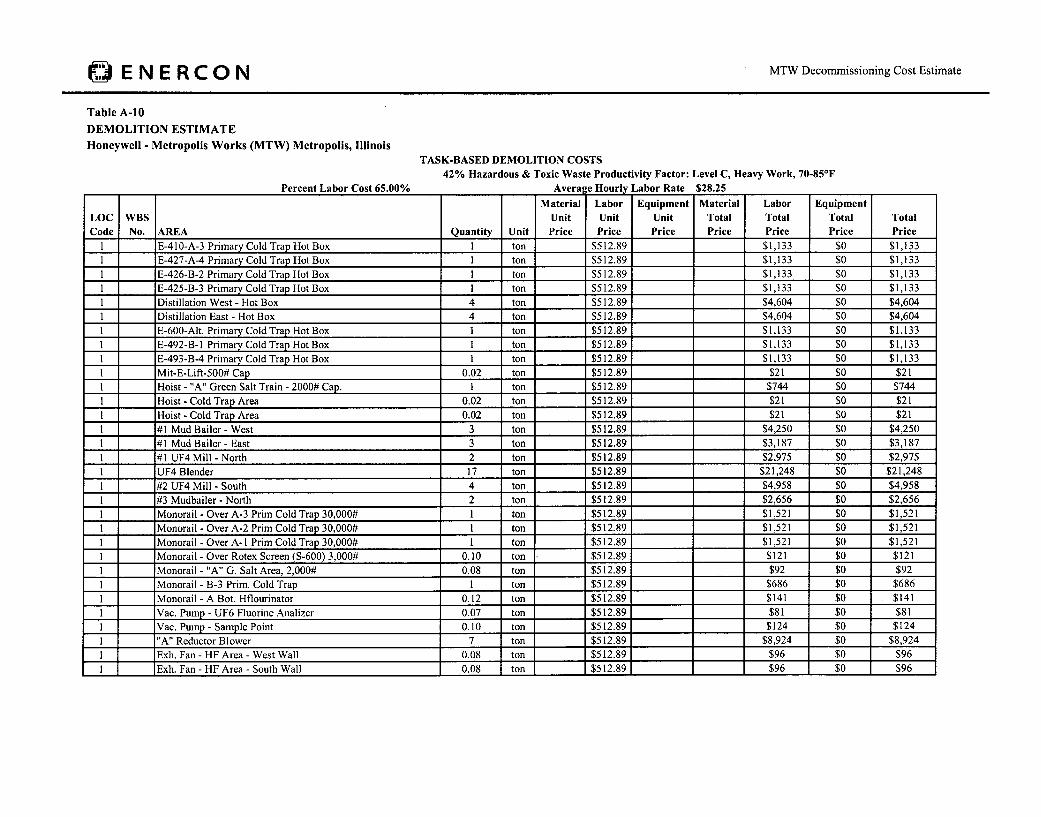
TabENERCON MTW Decommissioning Cost Estimate
Table A-10DEMOLITION ESTIMATEHoneywell - Metropolis Works (MTW) Metropolis, Illinois
TASK-BASED DEMOLITION COSTS42% Hazardous & Toxic Waste Productivity Factor: Level C, Heavy Work, 70-85'F
Avpral~ Hnulv ahnr Rate~ ,•R.2APe~reent ! .qhnr Cn,~t 6•_lfO/..
Material Labor Equipment Material Labor EquipmentLOC WBS Unit Unit Unit Total Total Total TotalCode No. AREA Quantity Unit Price Price Price Price Price Price Price
I E-410-A-3 Primary Cold Trap Hot Box 1 ton $512.89 $1,133 $0 $1,1331 E-427-A-4 Primary Cold Trap Hot Box I ton $512.89 $1,133 $0 $1,1331 E-426-B-2 Primary Cold Trap Hot Box I ton $512.89 $1,133 $0 $1,1331 E-425-B-3 Primary Cold Trap Hot Box I ton $512.89 $1,133 $0 $1,1331 Distillation West - Hot Box 4 ton $512.89 $4,604 $0 $4,6041 Distillation East - Hot Box 4 ton $512.89 $4,604 $0 $4,6041 E-600-Alt. Primary Cold Trap Hot Box I ton $512.89 $1,133 $0 $1,1331 E-492-B-1 Primary Cold Trap Hot Box I ton $512.89 _ $1,133 $0 $1,133I E-493-B-4 Primary Cold Trap Hot Box I ton $512.89 $1,133 $0 $1,1331 Mit-E-Lift-500# Cap 0.02 ton $512.89 $21 $0 $211 Hoist - "A" Green Salt Train - 2000# Cap. I ton $512.89 $744 $0 $7441 Hoist - Cold Trap Area 0.02 ton $512.89 $21 $0 $211 Hoist - Cold Trap Area 0.02 ton $512.89 $21 $0 $211 #1 Mud Bailer - West 3 ton $512.89 $4,250 $0 $4,250I #1 Mud Bailer - East 3 ton $512.89 $3,187 $0 $3,1871 #1 UF4 Mill - North 2 ton $512.89 $2,975 $0 $2,9751 UF4 Blender 17 ton $512.89 $21,248 $0 $21,2481 #2 UF4 Mill - South 4 ton 1 $512.89 $4,958 $0 $4,9581 #3 Mudbailer - North 2 ton $512.89 $2,656 $0 $2,6561 Monorail - Over A-3 Prim Cold Trap 30,000# 1 ton $512.89 $1,521 $0 $1,5211 Monorail - Over A-2 Prim Cold Trap 30,000# 1 ton $512.89 $1,521 $0 $1,5211 Monorail - Over A-I Prim Cold Trap 30,000# 1 ton $512.89 $1,521 $0 $1,5211 Monorail - Over Rotex Screen (S-600) 3,000# 0.10 ton $512.89 $121 $0 $1211 Monorail - "A" G. Salt Area, 2,000# 0.08 ton $512.89 __$92 $0 $921 Monorail - B-3 Prim. Cold Trap 1 ton $512.89 $686 $0 $6861 Monorail - A Bot. Hflourinator 0.12 ton $512.89 $141 $0 $1411 Vac. Pump - UF6 Fluorine Analizer 0.07 ton $512.89 $81 $0 $811 Vac. Pump - Sample Point 0.10 ton $512.89 $124 $0 $1241 "A" Reductor Blower 7 ton $512.89 $8,924 $0 $8,924I Exh. Fan - HF Area - West Wall 0.08 ton $512.89 $96 $0 $96
1Exh. Fan - HF Area - South Wall 0.08 ton $96_$0_$512.89 $96 $0 $96

DEMOLITIN ESRTCIAN MTW Decommissioning Cost Estimate
Table A-10DEMOLITION ESTIMATEHoneywell - Metropolis Works (MTW) Metropolis, Illinois
TASK-BASED DEMOLITION COSTS42% Hazardous & Toxic Waste Productivity Factor: Level C, Heavy Work, 70-85'F
Avera~o T rlv a.hnr Rate •2R.2•Perrent I .,ahnr Cn,~t I•_Afo/,.
Material Labor Equipment Material Labor EquipmentLOC WBS Unit Unit Unit Total Total Total TotalCode No. AREA Quantity Unit Price Price Price Price Price Price Price
I Building Ventilation Unit 3 ton $512.89 $4,250 $0 $4,2501 Man Cooling Fan 0.06 ton $512.89 $67 $0 $671 "B" Reductor Comb. Air Blower I ton $512.89 $797 $0 $7971 Exhaust Fan - South X West - I Lg I ton $512.89 $1,133 $0 $1,1331 Drinking Water Cooler 0.17 ton $512.89 $212 $0 $2121 #1 UF4 Mill Grizzley 10 ton $512.89 $12,749 $0 $12,7491 #2 UF4 Mill Grizzley 10 ton $512.89 $12,749 $0 $12,7491 Spar (Bed) Rotex Screen 2 ton $512.89 $2,975 $0 $2,9751 Rotex Screen 2 ton $512.89 $2,975 $0 $2,9751 Switchboard C- 19 West 7 ton $512.89 $8,924 $0 $8,9241 Switchboard D-20 East 7 ton $512.89 $8,924 $0 $8,924
1 Vibrator - #1 Ore Conc. Hopper 0.01 ton $512.89 $8 $0 $81 Vibrator - #2 Ore Conc. Hopper 0.01 ton $512.89 $8 $0 $81 Vibrator - #1 Dry Oxide Dust Coil 0.01 ton $512.89 $8 $0 $8
1 Vibrator - #1 Dry Oxide Dust Coil 0.01 ton $512.89 $8 $0 $81 Vibrator - #1 Dry Oxide Dust Coil 0.01 ton $512.89 $8 $0 $81 Vibrator - HF Filter (F-424) Disch. Line 0.01 ton $512.89 $8 $0 $8
1 Vibrator - HF Filter (F-425) Disch. Line 0.01 ton $512.89 $8 $0 $81 Vib. - "A" Reductor K.O. Pot Disch. Line 0.01 ton $512.89 $8 $0 $8
1 Vibrator - UF4 Hopper 0.01 ton $512.89 $8 $0 $81 Vibrator - Spar Decay Hopper Disch. Line 0.01 ton $512.89 __$8 $0 $8I _ Vibrator - #3 Ore Conc. Hopper 0.01 ton $512.89 $8 $0 $81 Vibrator - UF4 Hopper 0.01 ton $512.89 $8 $0 $81 Vibrator - "BY" HF Filter Disch. Line 0.01 ton $512.89 $8 $0 $81 Vibrator - "B4" HF Filter Disch. Line 0.01 ton $512.89 $8 $0 $81 Vibrator - "B5" HF Filter Disch. Line 0.01 ton $512.89 _ $8 $0 $81 Vibrator - "B6" HF Filter Disch. Line 0.01 ton $512.89 $8 $0 $8
1 Vib. - "B" RedfER Fines Ko Pot Disch. Line 0.01 ton $512.89 $8 $0 $8
I Vibrator-Inlet Line To #2 LUF4 Mill 0.01 ton $512.89 $8 $0 $81 Rotary Value - #1 Mudbailer Ore Blender 0.03 ton $512.89 $42 $0 $42
1 _ Rotary Value - #2 Mudbailer Ore Blender 0.03 ton $512.89 $42 $0 $42

ENE RCON MTW Decommissioning Cost Estimate
Table A-10DEMOLITION ESTIMATEHoneywell - Metropolis Works (MTW) Metropolis, Illinois
TASK-BASED DEMOLITION COSTS42% Hazardous & Toxic Waste Productivity, Factor: Level C, Heavy Work, 70-85'F
1) + k f + A fil/
Material Labor Equipment Material Labor EquipmentLOC WBS Unit Unit Unit Total Total Total TotalCode No. AREA Quantity Unit Price Price Price Price Price Price Price
I _ Rotary Value - "A" Top HAflator 0.04 ton $512.89 $46 $0 $461 Rotary Value - F-494 Fines Discharge 0.04 ton $512.89 $46 $0 $46I Rotary Value - F-493 Fines Discharge 0.04 ton $512.89 1 $46 $0 $461 Rotary Value - F-495 Fines Discharge 0.04 ton $512.89 $46 $0 $461 Rotary Value - #1 Dry Oxide Dust Col. Hop. 0.04 ton $512.89 $46 $0 $461 Rotary Value - "A" Reductor Ko Pot Disch. 0.04 ton $512.89 $46 $0 $461 Rotary Value - UF4 Mill Feeder - N 0.04 ton $512.89 $46 $0 $46I Rotary Value - "B" Top HMEflator 0.04 ton $512.89 $46 $0 $46I Rotary Value - "B-1 " Red. Filter Fines Disch. 0.04 ton I $512.89 $46 $0 $461 Rotary Value - #2 UF4 Crusher - S 0.04 ton $512.89 $46 $0 $461 Conc. Feed Hopper Screw I ton $512.89 $1,326 $0 $1,3261 Wet Oxide Dust Collector Discharge Screw I ton $512.89 $689 $0 $6891 Trolley - B-4 & B-5 HF Filters 0.03 ton $512.89 $33 $0 $331 "A" Reductor Filter Fines Hopper 0.06 ton $512.89 $71 $0 $711 A- I Tert. Cold Trap 2 ton $512.89 $2,883 $0 $2,8831 A-2 Tert. Cold Trap 2 ton $512.89 $2,883 $0 $2,8831 A-I Sec. Cold Trap 2 ton $512.89 $2,883 $0 $2,8831 "A" Reductor Heater 8 ton $512.89 $9,916 $0 $9,9161 #A4 HF Filter Heater (F-424) 0.22 ton $512.89 $269 $0 $2691 #A 5 HF Filter Heater (F-424) 0.22 ton $512.89 $269 $0 $2691 A-2 Sec. Cold Trap 2 ton $512.89 $2,883 $0 $2,8831 B-1 Sec. Cold Trap 2 ton $512.89 $2,883 $0 $2,8831 B-2 Sec. Cold Trap 2 ton $512.89 $2,883 $0 $2,8831 B-1 Tert. Cold Trap 2 ton $512.89 $2,883 $0 $2,8831 B-2 Tert. Cold Trap 2 ton $512.89 $2,883 $0 $2,8831 Shower Water Heater 0.08 ton $512.89 $94 $0 $941 _ A-3 Sec. Cold Trap 2 ton $512.89 $2,883 $0 $2,8831 B-3 Sec. Cold Trap 2 ton $512.89 $2,883 $0 $2,8831 Sample Cold Trap 2 ton $512.89 $2,883 $0 $2,8831 "B" Reductor Filter Fines Hopper "1 B" 0.06 ton $512.89 $71 $0 $71
Bot. H'Flator Filter #1 B - Heater 0.15 ton $512.89 $183 $0 $183

ENERCON MTW Decommissioning Cost Estimate
Table A-10DEMOLITION ESTIMATEHoneywell - Metropolis Works (MTW) Metropolis, Illinois
TASK-BASED DEMOLITION COSTS42% Hazardous & Toxic Waste Productivity Factor: Level C, Heavy Work, 70-85°F
Averaee Hourly Labor Rate $28.25Percent Labor Cost 65.00%
Material Labor Equipment Material Labor EquipmentLOC WBS Unit Unit Unit Total Total Total TotalCode No. AREA Quantity Unit Price Price Price Price Price Price Price
I Bot. H'Flator Filter #2B - Heater 0.15 ton $512.89 $183 $0 $1831 "B" Red. Fines Hopper Disch. Piping Heater 0.15 ton $512.89 $183 $0 $1831 _ Top H.EFlator Filter #3B Heater 0.15 ton $512.89 1 $183 $0 $1831 Top HWEFlator Filter #4B Heater 0.15 ton $512.89 $183 $0 $1831 #1 Dry Oxide Dust Collector 0.00 ton $512.89 $0 $0 $01 Vessel Vacuum, Hop. & Controller Stand I ton $512.89 $1,417 $0 $1,4171 A4 Bot. HF Filter I ton $512.89 $843 $0 $8431 A5 Bot. HF Filter I ton $512.89 $843 $0 $8431 Chem Trap 2 ton $512.89 $2,883 $0 $2,8831 Chem Trap 2 ton $512.89 $2,883 $0 $2,883I Chem Trap 2 ton $512.89 $2,883 $0 $2,8831 Chem Trap 2 ton $512.89 $2,883 $0 $2,8831 Inst. Air Filter 2 ton $512.89 $2,883 $0 $2,8831 B4 Bot. HF Filter 1 ton $512.89 $942 $0 $9421 3B Top HF Filter 1 ton $512.89 $942 $0 $9421 6B Top HF Filter 1 ton $512.89 $942 $0 $9421 5B Bottom HF Filter 1 ton $512.89 $942 $0 $9421 Welder - Idealarc 0.19 ton $512.89 $237 $0 $237I Welder - ldealarc 0.19 ton $512.89 $237 $0 $2371 Hot Box - Cold Trap E-446-1A Sec. 1 ton $512.89 $1,211 $0 $1,2111 Hot Box - Cold Trap E-413-2A Sec. I ton $512.89 $1,211 $0 $1,2111 Hot Box - Cold Trap E411-1A Tert. I ton $512.89 $1,211 $0 $1,2111 Hot Box I ton $512.89 $1,211 $0 $1,2111 Hot Box - Cold Trap E412-2A Tert. 1 ton $512.89 $1,211 $0 $1,2111 Hot Box - Cold Trap E447-1B Sec. 1 ton $512.89 $1,211 $0 $1,2111 Hot Box - Cold Trap E448-2B Sec. 1 ton $512.89 $1,211 $0 $1,2111 Hot Box - Cold Trap E472-IB Tert. 1 ton $512.89 $1,211 $0 $1,2111 _ _ Hot Box - Cold Trap E473-2B Tert. I ton $512.89 $1,211 $0 $1,2111 Hot Box I ton $512.89 $1,211 $0 $1,211I Hot Box - Cold Trap E-601 1 ton $512.89 $1,211 $0 $1,2111 Hot Box - Cold Trap E-602 1 ton $512.89 $1,211 $0 $1,211
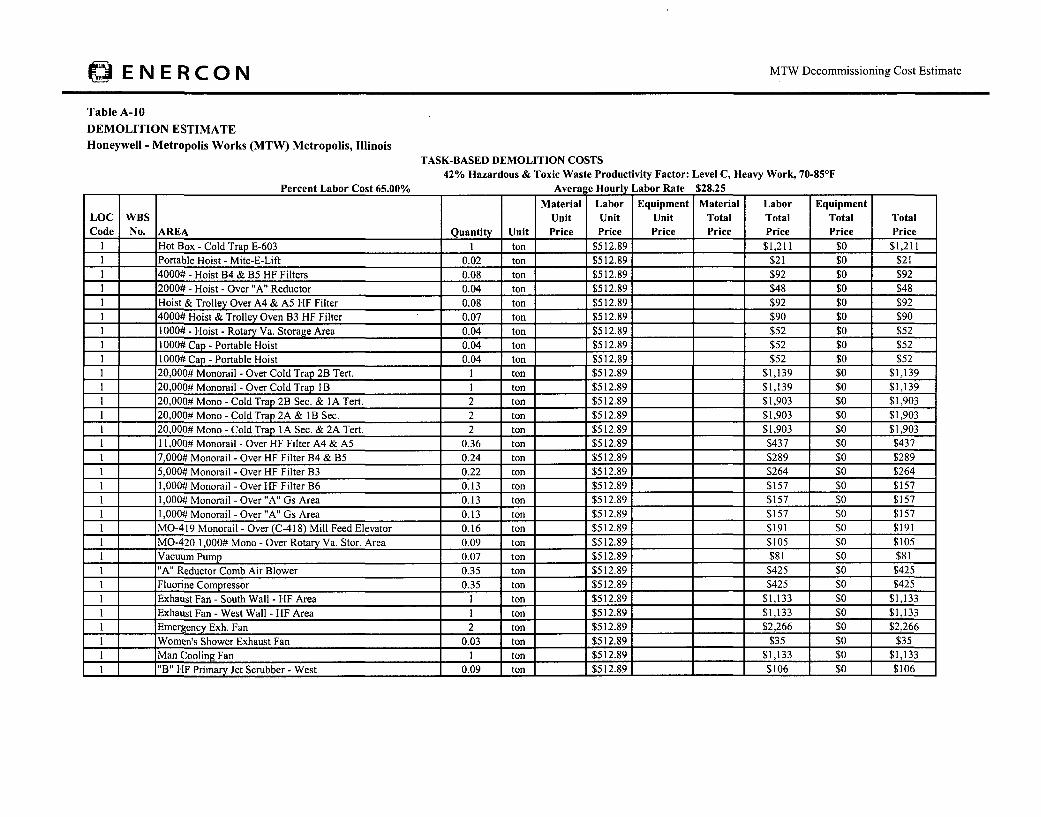
0ENERCON MTW Decommissioning Cost Estimate
Table A-10DEMOLITION ESTIMATEHoneywell - Metropolis Works (MTW) Metropolis, Illinois
TASK-BASED DEMOLITION COSTS42% Hazardous & Toxic Waste Productivity Factor: Level C, Heavy Work, 70-85*F
Percent Labor Cost 65.00% Average Hourly Labor Rate $28.25
Material Labor Equipment Material Labor EquipmentLOC WBS Unit Unit Unit Total Total Total TotalCode No. AREA Quantity Unit Price Price Price Price Price Price Price
1 Hot Box - Cold Trap E-603 I ton $512.89 $1,211 $0 $1,2111 Portable Hoist - Mite-E-Lift 0.02 ton $512.89 $21 $0 $211 1 4000# - Hoist B4 & B5 HF Filters 0.08 ton $512.89 $92 $0 $921 2000# - Hoist - Over "A" Reductor 0.04 ton $512.89 $48 $0 $481 Hoist & Trolley Over A4 & A5 HF Filter 0.08 ton $512.89 $92 $0 $921 4000# Hoist & Trolley Oven B3 HF Filter 0.07 ton $512.89 $90 $0 $901 1000# - Hoist - Rotary Va. Storage Area 0.04 ton $512.89 $52 $0 $521 1000# Cap - Portable Hoist 0.04 ton $512.89 $52 $0 $521 1000# Cap - Portable Hoist 0.04 ton $512.89 $52 $0 $521 20,000# Monorail - Over Cold Trap 2B Tert. I ton $512.89 $1,139 $0 $1,1391 20,000# Monorail - Over Cold Trap IB I ton $512.89 $1,139 $0 $1,1391 20,000# Mono - Cold Trap 2B Sec. & IA Tert. 2 ton $512.89 $1,903 $0 $1,9031 20,000# Mono - Cold Trap 2A & lB Sec. 2 ton $512.89 $1,903 $0 $1,9031 20,000# Mono - Cold Trap 1A Sec. & 2A Tert. 2 ton $512.89 $1,903 $0 $1,9031 11,000# Monorail - Over HF Filter A4 & A5 0.36 ton $512.89 $437 $0 $4371 7,000# Monorail - Over HF Filter B4 & B5 0.24 ton $512.89 $289 $0 $2891 5,000# Monorail - Over HF Filter B3 0.22 ton $512.89 $264 $0 $2641 1,000# Monorail - Over HF Filter B6 0.13 ton $512.89 $157 $0 $1571 1,000# Monorail - Over "A" Gs Area 0.13 ton $512.89 $157 $0 $1571 1,000# Monorail - Over "A" Gs Area 0.13 ton $512.89 $157 $0 $1571 1 MO-419 Monorail - Over (C-418) Mill Feed Elevator 0.16 ton $512.89 $191 $0 $1911 MO-420 1,000# Mono - Over Rotary Va. Stor. Area 0.09 ton $512.89 $105 $0 $1051 Vacuum Pump 0.07 ton $512.89 $81 $0 $811 "A" Reductor Comb Air Blower 0.35 ton $512.89 $425 $0 $425I Fluorine Compressor 0.35 ton $512.89 $425 $0 $4251 Exhaust Fan - South Wall - HF Area I ton $512.89 $1,133 $0 $1,1331 Exhaust Fan - West Wall - HF Area I ton $512.89 $1,133 $0 $1,1331 Emergency Exh. Fan 2 ton $512.89 $2,266 $0 $2,266I Women's Shower Exhaust Fan 0.03 ton $512.89 $35 $0 $351 Man Cooling Fan I ton $512.89 $1,133 $0 $1,1331 "B" HF Primary Jet Scrubber - West 0.09 ton 1 $512.89 $106 $0 $106

ENERCON MTW Decommissioning Cost Estimate
Table A-10DEMOLITION ESTIMATEHoneywell - Metropolis Works (MTW) Metropolis, Illinois
TASK-BASED DEMOLITION COSTS42% Hazardous & Toxic Waste Productivity Factor: Level C, Heavy Work, 70-85°F
Percent Labor Cost 65.00% Average Hourly Labor Rate $28.25Material Labor Equipment Material Labor Equipment
LOC WBS Unit Unit Unit Total Total Total TotalCode No. AREA Quantity Unit Price Price Price Price Price Price Price
I "B" HF Secondary Jet Scrubber - East 0.09 ton $512.89 $106 $0 $1061 "B" Reductor Air Circ. Fan 9 ton $512.89 $10,412 $0 $10,4121 Exhaust Fan 1 ton $512.89 $1,133 $0 $1,1331 Water Cooler 0.04 ton $512.89 $51 $0 $511 R-402 "A" Reductor - Surface Comb. 8 ton $512.89 $10,139 $0 $10,1391 R-600 "B" Reductor 8 ton $512.89 $10,139 $0 $10,1391 Spar Rotex Screen 0.08 ton $512.89 $96 $0 $961 Exit - Wet Oxide Dust Coil. #2 (F-416) 0.08 ton $512.89 $92 $0 $921 Exhaust Fan (P-524) 0.08 ton $512.89 $96 $0 $961 Exhaust Fan (P-639) 0.08 ton $512.89 $96 $0 $961 Exhaust Fan (P-523) 0.08 ton $512.89 $96 $0 $961 Switch Board Nxw 10 ton $512.89 $12,395 $0 $12,3951 Motor Control Ctr Nxw 4 ton $512.89 $5,100 $0 $5,1001 #1 Conc. Hopper (Ctr) 2 ton $512.89 $2,231 $0 $2,2311 "A" Reductor Filter Fines Hopper 0.10 ton $512.89 $117 $0 $1171 #2 Conc. Hopper (East) - Cont. Boiler 2 ton $512.89 $2,231 $0 $2,2311 HF Filter Bump Tank 1 ton $512.89 $790 $0 $7901 UF6 Surge Tank 5 ton $512.89 $6,258 $0 $6,2581 "lB" Reductor Filter Fines Hopper 0.31 ton $512.89 $375 $0 $3751 #3 Conc. Hopper - West 2 ton $512.89 $2,231 $0 $2,2311 Vibrator - #1 Wet Oxide Dust Coil. Hop. (E) 0.01 ton $512.89 $8 $0 $81 Vibrator - #1 Wet Oxide Dust Coil. Hop. (W) 0.01 ton $512.89 $8 $0 $81 Vibrator - #2 Wet Oxide Dust Coil. Hop. (E) 0.01 ton $512.89 $8 $0 $81 Vibrator - #2 Wet Oxide Dust Coil. Hop. (W) 0.01 ton $512.89 $8 $0 $81 Vibrator - HF Filter "AI" (F-406) Disch. Line 0.01 ton $512.89 $8 $0 $81 Vibrator - HF Filter "A2" (F-407) Disch. Line 0.01 ton $512.89 $8 $0 $81 Vibrator - HF Filter "A3" (F-419) Disch. Line 0.01 ton $512.89 $8 $0 $81 Vibrator - HF Filter "A6" (F-443) Disch. Line 0.01 ton $512.89 $8 $0 $81 Vib.-"A" UF4 Prim. Dust Coil. (F-426) Hop. 0.01 ton $512.89 $8 $0 $8
I Vibrator - A2 Prim Flation Filter (F-432) 0.01 ton $512.89 1 $8 $0 $81 Vibrator - Al Prim Flation Filter (F-433) 0.01 ton $512.89 $8 $0 $8

ENERCON MTW Decommissioning Cost Estimate
Table A-10DEMOLITION ESTIMATEHoneywell - Metropolis Works (MTW) Metropolis, Illinois
TASK-BASED DEMOLITION COSTS42% Hazardous & Toxic Waste Productivity Factor: Level C, Heavy Work, 70-85'F
rercent Labor Cost 65.00% Avera e Hourly Labor Kate $28.25Material Labor Equipment Material Labor Equipment
LOC WBS Unit Unit Unit Total Total Total TotalCode No. AREA Quantity Unit Price Price Price Price Price Price Price
I Vibrator - B2 Prim Flation Filter (F-408) 0.01 ton $512.89 $8 $0 $81 Vibrator - BI Prim Flation Filter (F-409) 0.01 ton $512.89 $8 $0 $81 Vibrator - Span Decay Hopper Disch. Line 0.01 ton $512.89 $8 $0 $81 Vib. - "A" Filter Fines Hopper Disch. Line 0.01 ton $512.89 $8 $0 $81 Vibrator - "A" Reductor Feeder 0.01 ton $512.89 $8 $0 $81 Vibrator - UF4 Prim Dust Coll. (F-61 1) 0.01 ton $512.89 $8 $0 $81 Vibrator - "A" Reduction Feed Hopper 0.01 ton $512.89 $8 $0 $8I Vibrator - "B I" HF Filter (F-608) Disch. Line 0.01 ton $512.89 $8 $0 $81 Vibrator - "B2" HF Filter (F-609) Disch. Line 0.01 ton $512.89 $8 $0 $81 _Vibrator - "B" Red. Feed Hopper (U-606) 0.01 ton $512.89 $8 $0 $81 Vibrator - "B" Red. Feed (R-600) 0.01 ton $512.89 $8 $0 $81 Vibrator - "B" Red. Prim Filter 0.01 ton $512.89 $8 $0 $81 Vibrator - "C2" Flator Prim Filter Shell 0.01 ton $512.89 $8 $0 $81 Vibrator - "Cl" Flator Prim Filter Shell 0.01 ton $512.89 $8 $0 $81 Rotary Va. - "A" Reductor Feeder (R-402) 0.03 ton $512.89 $42 $0 $421 Rotary Va. - Prim. UF4 Dust Coll. Disch. 0.03 ton $512.89 $42 $0 $421 Rotary Va. - Ash Dust Coll. Disch. (F-422) 0.03 ton $512.89 $42 $0 $421 Rotary Va. - Spar Decay Hopper Disch. 0.03 ton $512.89 $42 $0 $421 Rotary Va. - #2 Dry Oxide Dust Coll. Disch. 0.03 ton $512.89 $42 $0 $421 Rotary Va. - #1 Wet Oxide Dust Coll. Disch. 0.03 ton $512.89 $42 $0 $421 Rotary Va. - #2 Wet Oxide Dust Coll. Disch. 0.03 ton $512.89 $42 $0 $421 Rotary Va. - #1 Wet Disch. 0.03 ton $512.89 $42 $0 $421 Rotary Va. - "B" Reductor Feeder 0.04 ton $512.89 $46 $0 $461 Rotary Va. - "B" UF4 Prim. Dust Coll. Disch. 0.03 ton $512.89 $42 $0 $421 Rotary Va. - "Conc. Surge Hopper Feeder 0.03 ton $512.89 , $42 $0 $421 "A" Reductor Hopper Feed Conveyer 0.40 ton $512.89 $484 $0 $4841 Spar Decay Hopper Feed Screw 0.45 ton 1 $512.89 $550 $0 $5501 _ "B" Reductor Hopper Feed Screw I ton $512.89 $843 $0 $8431 "B" UF4 Elevator Disch. Screw 2 ton $512.89 $1,912 $0 $1,9121 "A" UF4 Elevator Disch. Screw I ton $512.89 $615 $0 $615
1 1"B" UF4 Elevator Sec. Feed Screw 0.30 ton $512.89 $365 $0 $365
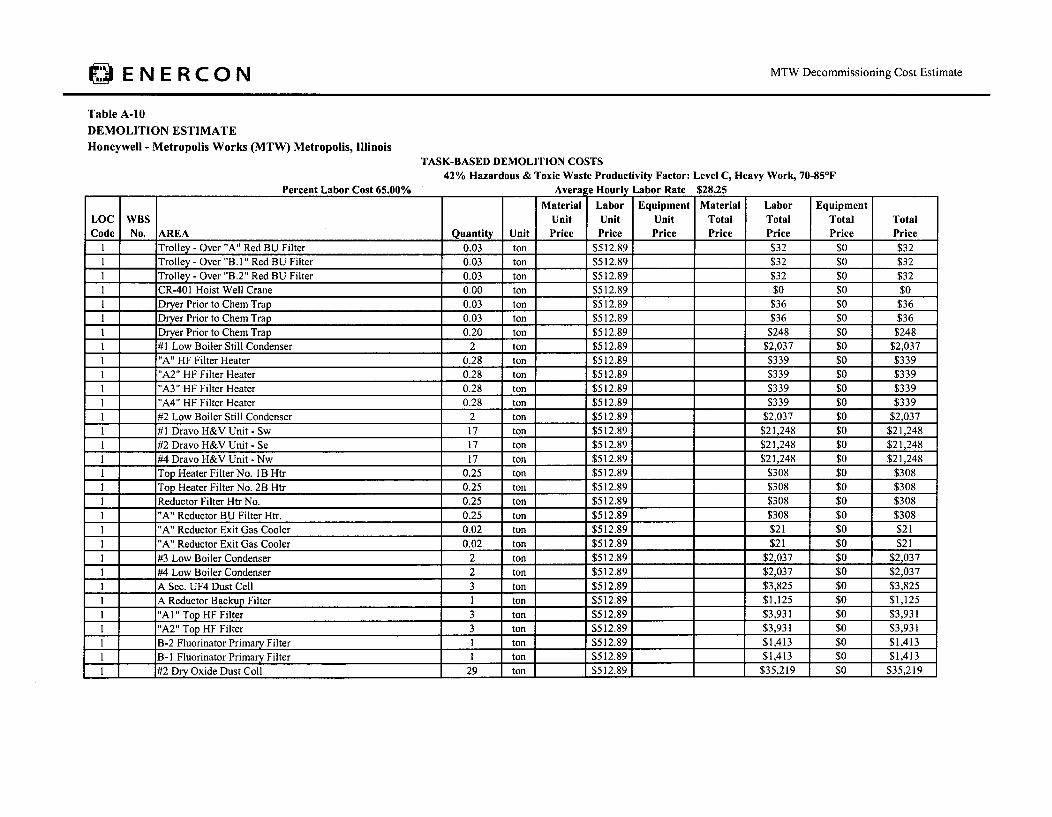
ENERCON MTW Decommissioning Cost Estimate
Table A-10DEMOLITION ESTIMATEHoneywell - Metropolis Works (MTW) Metropolis, Illinois
TASK-BASED DEMOLITION COSTS42% Hazardous & Toxic Waste Productivity Factor: Level C, Heavy Work, 70-85*F
D~n # I knf fnc AC ino/_
Material Labor Equipment Material Labor EquipmentLOC WBS Unit Unit Unit Total Total Total TotalCode No. AREA Quantity Unit Price Price Price Price Price Price Price
I Trolley - Over "A" Red BU Filter 0.03 ton $512.89 $32 so $321 Trolley - Over "B.l" Red BU Filter 0.03 ton $512.89 $32 $0 $321 Trolley - Over "B.2" Red BU Filter 0.03 ton $512.89 $32 $0 $32I CR-401 Hoist Well Crane 0.00 ton $512.89 $0 $0 $01 Dryer Prior to Chem Trap 0.03 ton $512.89 $36 $0 $36I Dryer Prior to Chem Trap 0.03 ton $512.89 $36 $0 $361 Dryer Prior to Chem Trap 0.20 ton $512.89 $248 $0 $2481 #1 Low Boiler Still Condenser 2 ton $512.89 $2,037 $0 $2,0371 "A" HF Filter Heater 0.28 ton $512.89 $339 $0 $3391 "A2" HF Filter Heater 0.28 ton $512.89 $339 $0 $3391 "A3" HF Filter Heater 0.28 ton $512.89 $339 $0 $3391 "A4" HF Filter Heater 0.28 ton $512.89 $339 $0 $3391 #2 Low Boiler Still Condenser 2 ton $512.89 $2,037 $0 $2,0371 #1 Dravo H&V Unit - Sw 17 ton $512.89 $21,248 $0 $21,2481 1 #2 Dravo H&V Unit - Se 17 ton $512.89 $21,248 $0 $21,2481 #4 Dravo H&V Unit - Nw 17 ton $512.89 $21,248 $0 $21,2481 Top Heater Filter No. lB Htr 0.25 ton $512.89 $308 $0 $3081 Top Heater Filter No. 2B Htr 0.25 ton $512.89 $308 $0 $3081 Reductor Filter Htr No. 0.25 ton $512.89 $308 $0 $3081 "A" Reductor BU Filter Htr. 0.25 ton $512.89 $308 $0 $3081 "A" Reductor Exit Gas Cooler 0.02 ton $512.89 $21 $0 $211 "A" Reductor Exit Gas Cooler 0.02 ton $512.89 $21 $0 $211 #3 Low Boiler Condenser 2 ton $512.89 $2,037 $0 $2,0371 #4 Low Boiler Condenser 2 ton $512.89 $2,037 $0 $2,0371 A Sec. UF4 Dust Cell 3 ton $512.89 $3,825 $0 $3,8251 A Reductor Backup Filter 1 ton 1 $512.89 $1,125 $0 $1,1251 _"Al" Top HF Filter 3 ton $512.89 $3,931 $0 $3,9311 "A2" Top HF Filter 3 ton $512.89 $3,931 $0 $3,9311 B-2 Fluorinator Primary Filter I ton $512.89 $1,413 $0 $1,4131 B-1 Fluorinator Primary Filter 1 ton $512.89 $1,413 $0 $1,4131 1#2 Dry Oxide Dust Coil 29 ton $512.89 $35,219 $0 $35,219

15" ENERCON MTW Decommissioning Cost Estimate
Table A-b0DEMOLITION ESTIMATEHoneywell - Metropolis Works (MTW) Metropolis, Illinois
TASK-BASED DEMOLITION COSTS42% Hazardous & Toxic Waste Productivity Factor: Level C, Heavy Work, 70-85*F
Averae Hnil L~ahnr Rate •2R.25Percent lahnr Cost 6•.flfl%
Material Labor Equipment Material Labor EquipmentLOC WBS Unit Unit Unit Total Total Total TotalCode No. AREA Quantity Unit Price Price Price Price Price Price Price
1 #1 Wet Oxide Dust Coll. - Primary 0.00 ton $512.89 so $0 $01 A3 Top HF Filter 3 ton $512.89 $3,931 $0 $3,9311 Ash Dust Coll #1 2 ton $512.89 $1,987 $0 $1,9871 A Pri UF4 Dust Coil 17 ton $512.89 $20,267 $0 $20,2671 A- I Fluorinator Primary Filter 3 ton $512.89 $3,559 $0 $3,5591 B-3 Fluorinator Primary Filter 3 ton $512.89 $3,559 $0 $3,5591 Ash Vac Cleaner 0.28 ton $512.89 $336 $0 $3361 Ash Dust Coil #2 Spar Recycle 5 ton $512.89 $5,666 $0 $5,6661 A6 Top HF Filter 0.43 ton $512.89 $528 $0 $5281 B-2 Fluorinator Backup Filter 0.11 ton $512.89 $131 $0 $1311 B-1 Fluorinator Backup Filter 0.11 ton $512.89 $131 $0 $1311 A-1 Fluorinator Backup Filter 0.11 ton $512.89 $131 $0 $1311 B-3 Fluorinator Backup Filter 0.11 ton $512.89 $131 $0 $1311 B UF4 Spec Dust Coll. 17 ton $512.89 $20,267 $0 $20,2671 Chem. Traps 0.03 ton $512.89 $31 $0 $311 Chem. Traps 0.03 ton $512.89 $31 $0 $311 Chem. Traps 0.03 ton $512.89 $31 $0 $311 Chem. Traps 0.03 ton $512.89 $31 $0 $311 Chem. Traps 0.03 ton $512.89 $31 $0 $311 Chem. Traps 0.03 ton $512.89 $31 $0 $311 Chem. Traps 0.03 ton $512.89 $31 $0 $311 Chem. Traps 0.03 ton $512.89 $31 $0 $311 Blow Back Air Filter On F-446 0.01 ton $512.89 $16 $0 $16I C- I Fluorinator Primary Filter - West 2 ton $512.89 $2,001 _ $0 $2,0011 C-2 Fluorinator Primary Filter - Center 2 ton $512.89 $2,001 $0 $2,0011 C-3 Fluorinator Primary Filter - East 2 ton $512.89 $2,001 $0 $2,0011 C-I Fluorinator Backup Filter - West I ton 1 $512.89 $1,045 $0 $1,0451 IC-2 Fluorinator Backup Filter - Center I ton $512.89 $1,045 $0 $1,0451 _ C-3 Fluorinator Backup Filter - East 1 ton $512.89 $1,045 $0 $1,0451 "B" Reductor Fri Filter 1 ton $512.89 $1,125 $0 $1,1251 "B" Reductor Backup Filter 1 ton $512.89 $942 $0 $942

0ENERCON MTW Decommissioning Cost Estimate
Table A-10DEMOLITION ESTIMATEHoneywell - Metropolis Works (MTW) Metropolis, Illinois
TASK-BASED DEMOLITION COSTS42% Hazardous & Toxic Waste Productivity Factor: Level C, Heavy Work, 70-85'F
Avernr ll 1.rl hnr flnte t•R_Prerent .,dhnr Cndt •;.AOl/•
Material Labor Equipment Material Labor EquipmentLOC WBS Unit Unit Unit Total Total Total TotalCode No. AREA Quantity Unit Price Price Price Price Price Price Price
I lB Top Hflator Filter I ton $512.89 $942 $0 $9421 2B Top Hflator Filter I ton $512.89 $942 $0 $9421 B UF4 Pri. Dust Coll. 10 ton $512.89 $12,395 $0 $12,395I IA Reductor Fri. Filter I ton $512.89 $1,125 $0 $1,1251 A-2 Fluorinator Primary Filter - West 1 ton $512.89 $1,045 $0 $1,0451 A-3 Fluorinator Primary Filter - Center 1 ton $512.89 $1,045 $0 $1,0451 A-2 Fluorinator Backup Filter - West I ton $512.89 $1,045 $0 $1,0451 A-3 Fluorinator Backup Filter - Center I ton $512.89 $1,045 $0 $1,0451 Welder 0.19 ton $512.89 $237 $0 $2371 Hoist - 500# Cap. - Portable 0.02 ton $512.89 $21 $0 $211 Hoist - "A" Reductor BU Filter 0.04 ton $512.89 $48 $0 $481 Hoist - B-1 Filter 0.04 ton $512.89 $48 $0 $481 Hoist - B-2 Filter 0.04 ton $512.89 $48 $0 $481 Hoist - F-496 & F-497 Fluorinator Filter 0.04 ton $512.89 $48 $0 $481 Hoist - F-493 & F-494 Fluorinator Filter 0.04 ton $512.89 $48 $0 $48I Hoist - AB HF Filter 0.04 ton $512.89 $48 $0 $481 Hoist - Al & A2 HF Filter 0.04 ton $512.89 $48 $0 $48I Hoist - "B" Reductor BU Filter 0.04 ton $512.89 $48 $0 $481 _Hoist - A2 Fri & BU Flation Filter 0.04 ton $512.89 $48 $0 $481 Hoist - B I BU Flation Filter & A6 HF Filter 0.04 ton $512.89 1 $48 $0 $481 Hoist - Ash Dust Coll. 0.04 ton $512.89 $48 $0 $481 Hoist - A I & B2 BU & B2 Prim-Flation Filters 0.04 ton $512.89 $48 $0 $481 Hoist - A I & B2 BU & B2 Prim-Flation Filters 0.04 ton $512.89 $48 $0 $481 Hoist - "B" Red. Prim. Filters 0.04 ton $512.89 $48 $0 $481 Hoist - "C" Flator Prim. Filters 0.04 ton $512.89 $48 $0 $481 Hoist - "C" Flator BU Filters 0.04 ton $512.89 _ $48 $0 $481 3000# Monorail 0.12 ton $512.89 $149 $0 $1491 2000# Monorail - "C" Flaton Pri Filters 0.33 ton $512.89 $398 $0 $3981 2000# Monorail - "C" Flaton Sec. Filter 0.26 ton $512.89 $319 $0 $319S1 6000# Monorail - Al & B2 BU & B2 Fri Flation Fil. 0.26 ton $512.89 $318 $0 $3181 4000# Monorail - BI BU Flation & A6 HF Flit. 0.24 ton $512.89 $292 $0 $292

0ENERCON MTW Decommissioning Cost Estimate
Table A-10DEMOLITION ESTIMATEHoneywell - Metropolis Works (MTW) Metropolis, Illinois
TASK-BASED DEMOLITION COSTS42% Hazardous & Toxic Waste Productivity Factor: Level C, Heavy Work, 70-85*F
PoonftI okr nnctf ffllo/..
Material Labor Equipment Material Labor EquipmentLOC WBS Unit Unit Unit Total Total Total TotalCode No. AREA Quantity Unit Price Price Price Price Price Price Price
1 3500# Monorail - AI BU, BI Fri. & B2 BU Flation 0.23 ton $512.89 $280 so $2801 4000# Monorail - A2 Fri & A2 BU Flation Fil. 0.17 ton $512.89 $212 $0 $2121 .1500# Monorail - #2 Wet Oxide Dust Coll. 0.17 ton $512.89 $212 $0 $2121 4000# Monorail - Al HF Filter 0.43 ton $512.89 $530 $0 $5301 4000# Monorail - At & A2 HF Filter 0.29 ton $512.89 $348 $0 $3481 4000# Monorail - "A" UF4 Sec. Dust Coil 0.29 ton $512.89 $348 $0 $3481 4500# Monorail - "A" Red. BU Filter 0.13 ton $512.89 $159 $0 $1591 6000# Monorail - "B" Reductor BU Filter 0.11 ton $512.89 $131 $0 $1311 11900# Monorail - "B" Reductor BU Filter 0.16 ton $512.89 $195 $0 $1951 1700# Monorail - B2 HF Filter 0.16 ton $512.89 $195 $0 $1951 5500# Monorail - BI HF Filter 0.16 ton $512.89 $195 $0 $1951 3000# Monorail - #1 Low Boiler Condenser 0.15 ton $512.89 $186 $0 $1861 3000# Monorail - #2 Low Boiler Condenser 0.15 ton $512.89 $186 $0 $1861 3000# Monorail - #3 Low Boiler Condenser 0.15 ton $512.89 $186 $0 $1861 3000# Monorail - #4 Low Boiler Condenser 0.15 ton $512.89 $186 $0 $1861 2000# Monorail - Ash Dust Coll. Blower 0.09 ton $512.89 $106 $0 $1061 2000# Monorail - Ash Dust Coll. Blower Motor 0.09 ton $512.89 $106 $0 $1061 10000# Monorail 0.22 ton $512.89 $264 $0 $2641 10000# Monorail 0.26 ton $512.89 $318 $0 $3181 Monorail - F-496 & F-497 Fluorinator Filter 0.26 ton $512.89 $319 $0 $3191 Monorail - F-493 & F-494 Fluorinator Filter 0.26 ton $512.89 $319 $0 $3191 Silencer - Ash Vac Cl. Exhst. 0.21 ton $512.89 $255 $0 $2551 "A" UF4 D.C. Exhauster 2 ton $512.89 $2,656 $0 $2,6561 Wet Oxide Dust Coll. Blower 2 ton $512.89 $2,334 $0 $2,3341 UF4 BU D.C. Blower 2 ton $512.89 $2,125 $0 $2,1251 "A" Reducton Exit Cooling Blower I ton '$512.89 $637 $0 $6371 Ash Vac. Cl. Exhauster 2 ton $512.89 $2,833 $0 $2,8331 Dry Oxide D.C. Blower 4 ton $512.89 $4,869 $0 $4,8691 "A" HF Pri. Jet Scrubber-East 0.05 ton $512.89 $57 $0 $57
Ash D.C. Exhauster 1 ton $512.89 $850 $0 $8501 "A" HF Sec. Jet Scrubber-West 0.05 ton $512.89 $57 $0 $57

ENERCON MTW Decommissioning Cost Estimate
Table A-10DEMOLITION ESTIMATEHoneywell - Metropolis Works (MTW) Metropolis, Illinois
TASK-BASED DEMOLITION COSTS42% Hazardous & Toxic Waste Productivity Factor: Level C, Heavy Work, 70-85*F
Percent Labor Cost 65.00% Average Hourly Labor Rate $28.25Material Labor Equipment Material Labor Equipment
LOC WBS Unit Unit Unit Total Total Total TotalCode No. AREA Quantity Unit Price Price Price Price Price Price Price
I Dravo H&V Unit # 1 6 ton $512.89 $7,012 $0 $7,0121 Dravo H&V Unit #2 6 ton $512.89 $7,012 $0 $7,0121 I Dravo H&V Unit #4 6 ton $512.89 $7,012 $0 $7,0121 Dravo Induced Draft Fan 6 ton $512.89 $7,012 $0 $7,0121 Dravo Induced Draft Fan 6 ton $512.89 $7,012 $0 $7,0121 Dravo Induced Draft Fan 6 ton $512.89 $7,012 $0 $7,0121 Roof Exhaust Blower Nxe 6 ton $512.89 $7,012 $0 $7,0121 Roof Exhaust Blower Hoist Well 6 ton $512.89 $7,012 $0 $7,0121 jTrane Vent Unit No 317-1 3 ton $512.89 $3,368 $0 $3,3681 Trane Vent Unit No 222-1 5 ton $512.89 $5,666 $0 $5,6661 Exhaust Fan - Sxw I ton $512.89 $1,133 $0 $1,1331 Exhaust Fan - Wxs I ton $512.89 $1,133 $0 $1,1331 Exhaust Fan - Wxn I ton $512.89 $1,133 $0 $1,1331 Fan - Man Cooler 0.06 ton $512.89 $67 $0 $671 Vent Fan 0.06 ton $512.89 , $67 $0 $671 "B" Reductor Exit Gas Cooler Blower 0.15 ton $512.89 $183 $0 $1831 Drinking Water Cooler 0.04 ton $512.89 $51 $0 $511 Scrubber, A Green Salt Dust Collector 0.38 ton $512.89 $464 $0 $4641 Scrubber, B Green Salt Dust Collector 0.38 ton $512.89 $464 $0 $4641 SW-22 Switchboard - See Dwg MTW-A0029 0.33 ton $512.89 $403 $0 $4031 SW-23 Switchboard - See Dwg MTW-A0030 0.3 ton $512.89 $366 $0 $3661 UF4 Hopper 0 ton $512.89 $0 $0 $0I Spar Decay Hopper 0 ton $512.89 $0 $0 $0I Air Blow Back Surge Tank 0.24 ton $512.89 $297 $0 $2971 "A" Reductor Feed Hopper 7 ton $512.89 $8,853 $0 $8,8531 "B" Reductor Feed Hopper 7 ton $512.89 1 $8,853 $0 $8,8531 Vibrtr-On No2 Dry Ox Dust Coil Hppr(F412) 0.01 ton $512.89 $8 $0 $8I Vibrator - On"A"Sec UF4 Dust Coil 0.01 ton $512.89 $8 $0 $81 Vibrator - On"B"Sect UF4 Dust Col1(F450) 0.01 ton $512.89 $8 $0 $81 Vibrator - On"A"Red Exit Gas Cooler(E625) 0.01 ton $512.89 $8 $0 $81 Vibrator - On"B"Red Exit Gas Cooler(E632) 0.01 ton $512.89 $8 $0 $81 Vibrator - On (F-450) 0.01 ton $512.89 $8 $0 $8

0 ENERCON MTW Decommissioning Cost Estimate
Table A-10DEMOLITION ESTIMATEHoneywell - Metropolis Works (MTW) Metropolis, Illinois
TASK-BASED DEMOLITION COSTS42% Hazardous & Toxic Waste Productivity Factor: Level C, Heavy Work, 70-85*F
Percepnt I ,ihnr Co~t fi;fll/ Av~r2QP Hourly 1.2bnr R2te ~2R.2~
Material Labor Equipment Material Labor Equipment
LOC WBS Unit Unit Unit Total Total Total TotalCode No. AREA Quantity Unit Price Price Price Price Price Price Price
I Rotary Valve-"A"UF4 Sec D.C. Disch 0.03 ton $512.89 $42 so $421 Rotary Valve-"B"UF4 Sec D.C. Disch 0.03 ton $512.89 $42 $0 $42
1 Equipment Removal Average Over Entire Basement 5,134 SF $0.00 $49.78 $0.00 $0.00 $255,594 $0 $255,5941 Equipment Removal Sodium Removal/Ion Exchange Bldg 3,808 SF $0.00 $49.78 $0.00 $0.00 $189,579 $0 $189,5791 _ Equipment Removal Sodium Removal/Ion Exchange Bldg 2,520 SF $0.00 $49.78 $0.00 $0.00 $125,457 $0 $125,4571 Equipment Removal KOH Muds Building 2,394 SF $0.00 $49.78 $0.00 $0.00 $119,184 $0 $119,1841 Equipment Removal Uranium Recovery Building 4,560 SF $0.00 $49.78 $0.00 $0.00 $227,017 $0 $227,0171 Equipment Removal Uranium Recovery Building 1,100 SF $0.00 $49.78 $0.00 $0.00 $54,763 $0 $54,7631 Equipment Removal FM Building Southeast pad 3,888 SF $0.00 $49.78 $0.00 $0.00 $193,562 $0 $193,5621 Equipment Removal FM Building Southwest pad 3,564 SF $0.00 $49.78 $0.00 $0.00 $177,432 $0 $177,4321 Equipment Removal Sample Plant 4,488 SF $0.00 $49.78 $0.00 $0.00 $223,433 $0 $223,4332 Equipment Removal Pond Muds Filter Calciner Bldg 1,125 SF $0.00 $49.78 $0.00 $0.00 $56,008 $0 $56,008
2 Equipment Removal Cylinder Wash Building 504 SF $0.00 $49.78 $0.00 $0.00 $25,091 $0 $25,0912 Equipment Removal Drum Crusher Building 5,340 SF $0.00 $49.78 $0.00 $0.00 $265,849 $0 $265,8494 Contaminated Soil at Sampling Plant Railroad Tracks 132 CY $5.77 $5.95 $1,811 $1,868 $3,6794 Contaminated Soil at Sampling Plant North Fence 5 CY $5.77 $5.95 $67 $69 $1364 Contaminated Debris at Sampling Plant Railroad Tracks 2 ton $512.89 $2,149 $0 $2,1495 Remove Roof Over Laundry 1,000 SF $1.30 $3,091 $0 $3,091
- Miscellaneous Debris(3 ) 4,000 CF 1 $25,000TOTALSI $41,747 $3,873,451 $307,807 $4,248,005
Total over 1st to 5th floors of FM Building
Floor area of 1st to 5th floors of FM Building:Average per ft2 for 1st to 5th floors of FM Building:
Notes:(1) Due to rounding of values, the calculated values may not be exact (see Table A- 10 in the 2006 Report prepared by Duratek).
$1,533,423
30,804 ft2
$49.78
(2) The following 2009 cost items were removed because these items have been disposed based on interviewing site personnel and verified through site inspection:BM/FM Building LLRW Trash in drums, Material on Waste Pad/Other, BM/FM Building LLRW Trash in B-25 Boxes, BM/FM Building LLRW Trash in Blue Boxes,
Scrap Metal, New Scrap Metal, and 16"x16"x8" cubes on Metals Pad, lmhoff Sludge and Outfall Material in Crusher Building, RAM Flat Compactor, Conveyorfor RAM Flat Compactor, HEPA unit for RAM Flat Compactor, Drum Washer, and Equipment Removal Surface Treatment Pad.Since the 2009 update, over 20 million pounds of waste has been removed and disposed of as a result of the improved waste management activities.
(3) Curent steady state site radiological waste volume.
", ENERCON MTW Decommissioning Cost Estimate
APPENDIX A-11
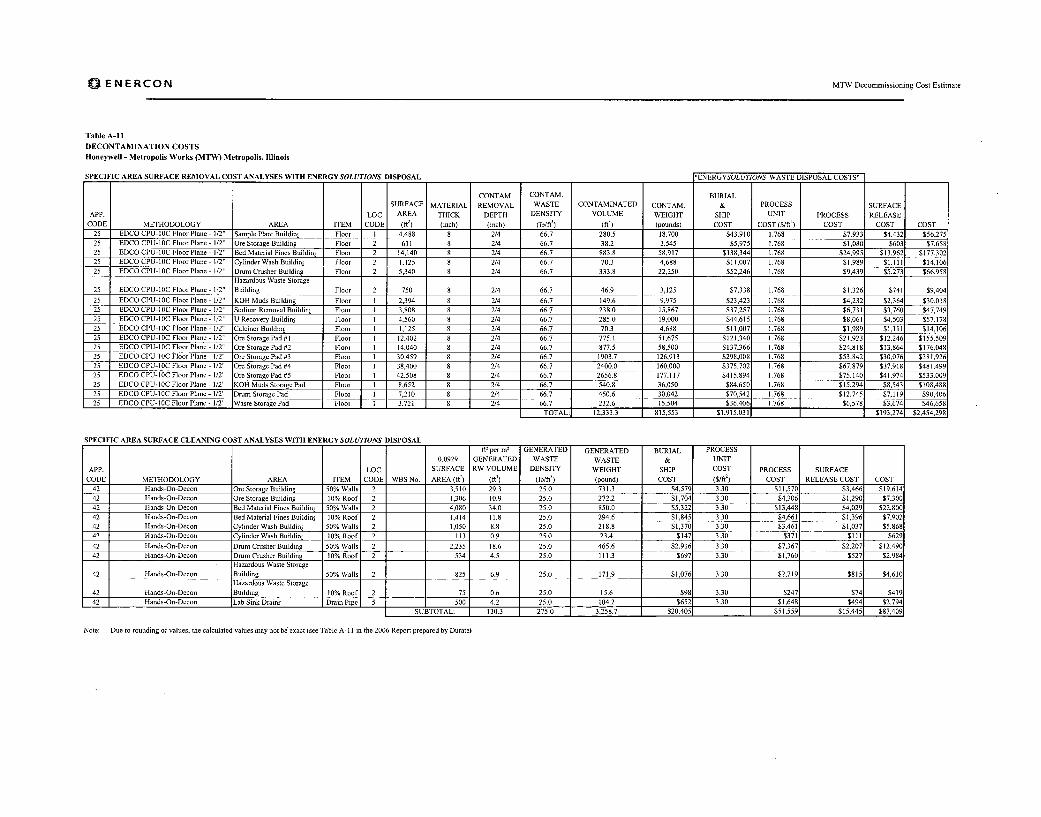
OjEN8ERCON MTW Decommissioning Cost Estimate
Table A-I IDECONTAMINATION COSTSHoneywell - Metropolis Works (MTW) Metropolis, Illinois
SPECIFIC AREA SURFACE REMOVAL COST ANALYSES WITH ENERGYSOLUTIONS DISPOSAL "ENERGYSOLUTIONS WASTE DISPOSAL COSTS"
CONTAM. CONTAM. BURIALSURFACE MATERIAL REMOVAL WASTE CONTAMINATED CONTAM. & PROCESS SURFACE
APP. LOC AREA THICK DEPTH DENSITY VOLUME WEIGIIT SHIP UNIT PROCESS RELEASECODE METIIODOLOOY AREA ITEM CODE (fit) (inch) (inch) (Ib/fIt) (ft3) (pounds) COST COST ($/ft') COST COST COST
25 EDCO CPU-t0C Floor Plane - 1/2" Sample Plant Buildinj Flooi 1 4,488 8 2/4 66.7 280.5 18,700 $43,910 1.768 $7,933 $4,432 $56,27325 EDCO CPU-10C Floor Plane - 1/2' Ore Storage Buildin8 Flooe 2 611 8 2/4 66.7 38.2 2,545 $5,975 1.768 $1,080 $603 $7,65825 EDCO CPU-10C Floor Plane - 1/2' Bed Material Fines Buildini Floor 2 14,140 8 2/4 66.7 883.8 58.917 $138,344 1.768 $24,995 $13,962 $177,30225 EDCO CPU-10C Floor Plane - 1/2' Cylinder Wash Buildint Floa. 2 1,125 8 2/4 66.7 70.3 4,688 $11,007 1.768 $1,989 $1,111 $14,10625 EDCO CPU-10C Floor Plane - 1/2' Drum Crasher Building Flooa 2 5,340 8 2/4 66.7 333.8 22,250 $52,246 1.768 $9,439 $5,273 $66,958
Hazardous Waste Storage25 EDCO CPU-IOC Floor Plane- 1/2" Building Floor 2 750 8 2/4 66.7 46.9 3,125 $7,338 1.768 $1,326 $741 $9,40425 EDCO CPU-IOC Floor Plane- 1/2" KOH Muds Building Floor 1 2,394 8 2/4 66.7 149.6 9,975 $23,423 1.768 $4,232 $2,364 $30,01825 EDCO CPU-IOC Floor Plane- 1/2' Sodium Removal Buildinj Flooa 1 3,808 8 2/4 66.7 238.0 15,867 $37,257 1.768 $6,731 $3,760 $47,74925 EDCO CPU-10C Floor Plane - 1/2' U Recovery Buildinj Floot 1 4,560 8 2/4 66.7 285.0 19,000 $44,615 1.768 $8,061 $4,503 $57,17825 EDCO CPU-I0C Floor Plane - 1/2" Calciner Building Float I 1,125 8 2/4 66.7 70.3 4,688 $11,007 1.768 $1,989 $1,111 $14,10625 EDCO CPU-I0C Floor Plane - 1/2" Ore Storage Pad #1 Floor 1 12,402 8 2/4 66.7 775.1 51,675 $121,340 1.768 $21,923 $12,246 $155,50925 EDCO CPU-1iC Floor Plane - 1/2" Ore Storage Pad #2 Flooe 1 14,040 8 2/4 66.7 877.5 58,500 $137,366 1.768 $24,818 $13,864 $176,04825 EDCO CPU-10C Floor Plane - 1/2' Ore Storage Pad #3 Floor 1 30,459 8 2/4 66.7 1903.7 126,913 $298,008 1.768 $53,842 $30,076 $381,92625 EDCO CPU-10C Floor Plane - 1/2" Ore Storage Pad #4 Floor 1 38,400 8 2/4 66.7 2400.0 160,000 $375,702 1.768 $67,879 $37,918 $481,49925 EDCO CPU-]OC Floor Plane - 1/2' Ore Storage Pad #5 Floor 1 42,508 8 2/4 66.7 2656.8 177,117 $415,894 1.768 $75,140 $41,974 $533,00925 EDCO CPU-1IC Floor Plane - 1/2' KOH Muds Storage Pad Floor 1 8,652 8 2/4 66.7 540.8 36,050 $84,650 1.768 $15,294 $8,543 $108,48825 EDCO CPU-IOC Floor Plane - 1/2' Drum Storage Pad Floor 1 7,210 1 8 2/4 66.7 450.6 30,042 $70,542 1.768 $12,745 $7,119 $90,40625 EDCO CPU-10C Floor Plane - 1/2" Waste Storage Pad Flon, 1 3,721 8 2/4 66.7 232.6 15,504 $36,406 1.768 $6,578 $3,674 $46,658
TOTAL: 12,333.3 815,553 $1,915,031 $193,274 $2,454,298
SPECIFIC AREA SURFACE CLEANING COST ANALYSES WITH ENERGYSOLUTIONS DISPOSALf1' per M2 GENERATED GENERATED BURIAL PROCESS
0.0929 GENERATED WASTE WASTE & UNIT
APP. LOC SURFACE RW VOLUME DENSITY WEIGHT SHIP COST PROCESS SURFACECODE METIIODOLOGY AREA ITEM CODE WBS No. AREA (ft) (16) (lb/fi') (pound) COST ($/f02) COST RELEASE COST COST
42 Hands-On-Decon Ore Storage Buildin8 50% Walls 2 3,510 29.3 25.0 731.3 $4,579 3.30 $11,570 $3,466 $19,610
42 1ands-On-Decon Ore Storage Building 10% Roof 2 1,306 10.9 25.0 272.2 $1,704 3.30 $4,306 $1,290 $7,30(42 Hands-On-Decon Bed Material Fines Buildinj 50% Walls 2 4,080 34.0 25.0 850.0 $5,322 3.30 $13,448 $4,029 $22,80(42 Hands-On-Decon Bed Material Fines Buildint 10% Roof 2 1,414 11.8 25.0 294.6 $1,845 3.30 $4,661 $1,396 $7,90,42 Hands-On-Decon Cylinder Wash Buildin1 50% Walls 2 1,050 8.8 25.0 218.8 $1,370 3.30 $3.461 $1,037 $5,86842 Hands-Oa-Decna Cylinder Wash Buildinj 10% Roof 2 113 0.9 25.0 23.4 $147 3.30 $371 $111 $625
42 Hands-On-Decon Drum Crasher Building 58% Wails 2 2,235 18.6 25.0 465.6 $2,916 3.30 $7,367 $2,207 $12,49(
42 Hands-On-Dcenn Dram Crasher Building 10% Roof 2 534 4.5 25.0 111.3 $697 3.30 $1,768 $527 $2,985Hazardous Waste Storage
42 Iands-On-Decon Building 50% Walls 2 1 825 6.9 25.0 171.9 $1,076 3.30 $2,719 $815 $4,61H
42 Ilands-On-DeconHazardous Waste StorageBuilding 10% Roofl 2 75 0.6 25.0 15.6 $98 3.30 $24ý $74 $41S
42 Hands-On-Decon Lab Sink Drains Drain Pipe 1 5 500 4.2 25.0 -
IDU.J •/JU
Note: Due to rounding of values, the calculated values may not be exact (see Table A- Il in the 2006 Report prepared by Duratei

Ij ENERCON MTW Decommissioning Cost Estimate
APPENDIX A-12

Ij ENERCON
Table A-12
VOLUME REDUCTION COSTSHoneywell - Metropolis Works (MTW) Metropolis, Illinois
Contains Commercial InformationWithheld under 10 CFR 2.390 -Exemption 4
SPECIFIC MATERIAL VOLUME REDUCTION COST ANALYSES - STUDSVIK/ENERGYSOLUTIONS DISPOSAL
APP.
CODE
VOLUME REDUCTION
METHODOLOGYITEM
CODE
CONTAMINATEDVOLUME
(ft31~
BULK
DENSITY(Ib/ft')
CONTAMINATED
WEIGHT
(oound)
PROCESSAREA ITEM
88 Boxes >60 lbs/ft for BSFR Storage Pads Scap Metal on Metals Pad 3 96,602 100 9,660,20084 Added Charge for Failed BSFR Storage Pads Scap Metal on Metals Pad 3 9,660 100 966,02088 Boxes >60 lbs/ft for BSFR Storage Pads New Scrap Metal on Metals Pad 3 1,458 100 145,80084 Added Charge for Failed BSFR Storage Pads New Scrap Metal on Metals Pad 3 146 100 14,58088 Boxes >60 lbs/ft for BSFR Storage Pads 16"x I 6"x8" cubes for disposal on Metals Pad 3 432 100 43,20084 Added Charge for Failed BSFR Storage Pads 16"x16"x8" cubes for disposal on Metals Pad 3 43 100 4,32088 Boxes >60 lbs/ft for BSFR Sample Plant Equipment Sample Plant 1 7,715 62 480,234 184 Added Charge for Failed BSFR Sample Plant Equipment Sample Plant 1 772 62 47,83388 Boxes >60 lbs/ft for BSFR Cylinder Wash Building Equipment Cylinder Wash Building 2 866 62 53,93084 Added Charge for Failed BSFR Cylinder Wash Building Equipment Cylinder Wash Building 2 87 62 5,36988 Boxes >60 lbs/ft for BSFR Drum Crusher Building Equipment Drum Crusher Building 2 9,180 62 571,401 184 Added Charge for Failed BSFR Drum Crusher Building Equipment Drum Crusher Building 2 918 62 56,91688 Boxes >60 lbs/ft for BSFR FM Building FM Building Demolition Concrete Rubble 1 9,677 75 725,77584 Added Charge for Failed BSFR FM Building FM Building Demolition Concrete Rubble 1 484 75 36,28988 Boxes >60 lbs/ft for BSFR FM Building FM Pads Demolition Concrete Rubble 1 2,650 107 282,49084 Added Charge for Failed BSFR FM Building FM Pads Demolition Concrete Rubble 1 133 107 14,17888 Boxes >60 lbs/ft for BSFR Storage Pads Cold Concrete (Construction Rubble) 3 5,250 60 315,000108 Molyflush Cylinder Processing Storage Pads Molyflush Cylinders 3 4,160 84 351,00088 Boxes >60 lbs/ft for BSFR Storage Pads Thin Walled UF6 Cylinders 3 62,857 21 1,320,00084 Added Charge for Failed BSFR Storage Pads Thin Walled UF6 Cylinders 3 6,286 21 132,00088 Boxes >60 lbs/ft for BSFR Storage Pads I-HF Mitigation & Fire Water Line Rupture 3 12,000 75 900,00084 Added Charge for Failed BSFR Storage Pads I-HF Mitigation & Fire Water Line Rupture 3 600 75 45,00088 Boxes >60 lbs/ft for BSFR FM Building Soil Under FM Bldg - 1' 1 7,332 80 586,53084 Added Charge for Failed BSFR FM Building Soil Under FM Bldg - 1 1 367 80 29,32888 Boxes >60 lbs/ft for BSFR FM Building Soil Under FM Bldg Pad SE - 1' 1 5,540 80 443,23284 Added Charge for Failed BSFR FM Building Soil Under FM Bldg Pad SE - 1' 1 277 80 22,16088 Boxes >60 lbs/ft for BSFR FM Building Soil Under FM Bldg Pad SW - 1' 1 5,079 80 406,29684 Added Charge for Failed BSFR FM Building Soil Under FM Bldg Pad SW - 1 1 254 80 20,31688 Boxes >60 lbs/ft for BSFR Outdoor Plant Areas Plant areas P-I through P-25 1 foot depth 1 694,998 80 55,599,81684 Added Charge for Failed BSFR Outdoor Plant Areas Plant areas P-I through P-25 1 foot depth 1 34,750 80 2,779,99288 Boxes >60 lbs/ft for BSFR Outdoor Plant Areas Plant areas P-I through P-25 I to 6 foot depth 1 325,545 80 26,043,59584 Added Charge for Failed BSFR Outdoor Plant Areas Plant areas P- I through P-25 I to 6 foot depth 1 16,277 80 1,302,18088 Boxes >60 lbs/ft for BSFR Settling Ponds Settling Ponds #3 & #4 - 3' 3 19,238 80 1,539,000184 Added Charge for Failed BSFR Settling Ponds Settling Ponds #3 & #4 - 3' 3 962 80 76,952 1

IENERCON
Table A-12VOLUME REDUCTION COSTSHoneywell - Metropolis Works (MTW) Metropolis, Illinois
Contains Commercial InformationWithheld under 10 CFR 2.390 -Exemption 4
SPECIFIC MATERIAL VOLUME REDUCTION COST ANALYSES - STUDSVIK/ENERGYSOLUTIONS DISPOSAL
APP.
CODEVOLUME REDUCTION
METHODOLOGYITEM
CODE
CONTAMINATED
VOLUMES (ft3)
BULK
DENSITY
(lb/ft3)
CONTAMINATED
WEIGHT(pound)
PROCESSCnOZTAREA ITEM
88 Boxes> lbs/ftforBSFR Outdoor Non-Plant Areas Additional non-plant soils& sub-surface pipingl 4 218,534 80 17,482,720
84 . Added Charge for Failed BSFR Outdoor Non-Plant Areas Additional non-plant soils & sub-surface pipingl 4 10,927 80 874,136
88 Boxes >60 lbs/ft for BSFR Drum Compactor Area Conveyor from Drum Compactor 2 75 20 1,50084 Added Charge for Failed BSFR Drum Compactor Area Conveyor from Drum Compactor 2 8 20 150
_______ _____________________________________ _____________________________ - _______ ______________________ ____________ tTOTAL
Notes(1) Due to rounding of values, the calculated values may not be exact.
(2) BSFR = Bulk Survey for Release.
(3) Assumed 5 percent BSFR failure for contaminated concrete and soil. All other contaminated items were assumed 10 percent BSFR failure.
(4) The 2009 costs were increased by a factor of 1.141 to account for inflation between 2009 and 2012.

ENERCON MTW Decommissioning Cost Estimate
APPENDIX A-13
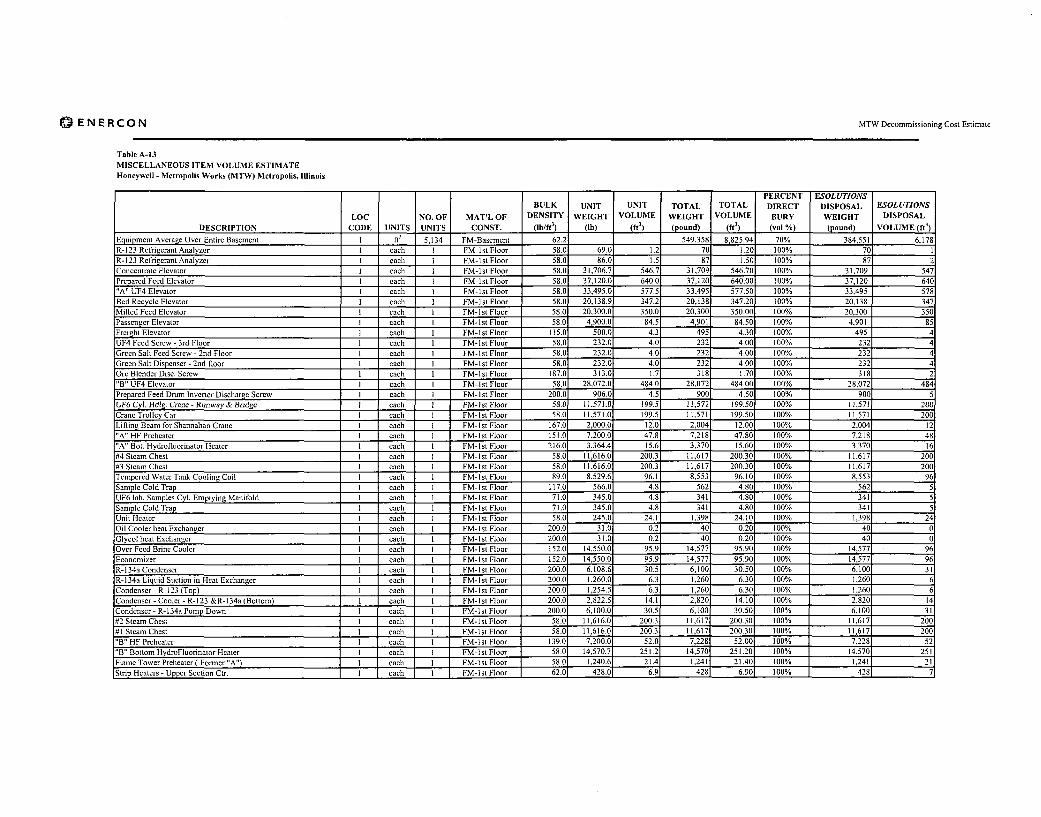
MENERCON MTW Decommissioning Cost Estimate
Table A-13MISCELLANEOUS ITEM VOLUME ESTIMATEHoneywell - Metropolis Works (MTWs) Metropolis, Illinois
PERCENT ESOLUTIONSBULK UNIT UNIT TOTAL TOTAL DIRECT DISPOSAL ESOLUTIONS
LOC NO. OF MAT'L OF DENSITY WEIGHT VOLUME WEIGHT VOLUME BURY WEIGHT DISPOSALDESCRIPTION CODE UNITS UNITS CONST. (lb/ft
3) (lb) (ft
3) (pound) (ft') (Vol %) (pound) VOLUME (ft
3)
Equipment Average Over Entire Basement 1 ftt
5,134 FM-Basement 62.2 549,358 8,825.94 70% 384,551 6,178R-l 23 Refrigerant Analyzer I each I FM-Ist Floor 58.0 69.0 1.2 70 1.20 100% 70R- 123 Refrigerant Analyzer I each I FM-Ist Floor 58.0 86.0 1.5 87 1.50 100% 87 2
Concentrate Elevator I each I FM-lst Floor 58.0 31,706.7 546.7 31,709 546.70 100% 31,709 547Prepared Feed Elevator I each I FM-lst Floor 58.0 37,120.0 640.0 37,120 640.00 100% 37,120 640"A" UF4 Elevator I each I FM-lst Floor 58.0 33,495.0 577.5 33,495 577.50 100% 33,495 578Bed Recycle Elevator I each I FM-lat Floor 58.0 20,138.9 347.2 20,138 347.20 100% 20,138 347
Milled Feed Elevator I each I FM-lst Floor 58.0 20,300.0 350.0 20,300 350.00 100% 20,300 350Passenger Elevator I each I FM-lst Floor 58.0 4,900.0 84.5 4,901 84.50 100% 4,901 85Freight Elevator I each I FM-1 st Floor 115.0 500.0 4.3 495 4.30 100% 495 4
UF4 Feed Screw - 3rd Floor I each I FM-ls[ Floor 58.0 232.0 4.0 232 4.00 100% 232 4Green Salt Feed Screw - 2nd Floor I each I FM-1 st Floor 58.0 232.0 4.0 232 4.00 100% 232 4Green Salt Dispenser - 2nd floor I each I FM-I st Floor 58.0 232.0 4.0 232 4.00 100% 232 4Ore Blender Disc. Screw I each I FM-lst Floor 187.0 313.0 1.7 318 1.70 100% 318 2"B" UF4 Elevator I each I FM-I st Floor 58.0 28,072.0 484.0 28,072 484.00 100% 28,072 484
Prepared Feed Drom Inverter Discharge Screw I each I FM-Ist Floor 200.0 906.0 4.5 900 4.50 100% 900 5UF6 Cyl. Hdlg. Crane - Runway & Bridge I each I FM- Ist Floor 58.0 11,571.0 199.5 11,571 199.50 100% 11,571 205Crane Trolley Car I each I FM-Ist Floor 58.0 11,571.0 199.5 11,571 199.50 100% 11,571 204Li fline Beam for Shannahan Crane I each I FM- lst Floor 167.0 2,000.0 0 2,004 12.00 100% 2,004 12"A" He Preheatcer I each I FM-Ist Floor 151.0 7,200.0 47.8 7,218 47.80 100% 7,218 40"A" BOet. Hydrofuorinator Heater I each I FM- I st Floor 216.0 3,364.4 15.6 3,370 15.60 100% 3,370 96#4 Steam Chest I each I FM-lst Floor 58.0 11,616.0 200.3 11,617 200.30 100% 11,617 209#3 Steam Chest I each I FM-Ist Floor 58.0 11,616.6 200.3 11,617 200.30 100% 11,617 203T3mperad Water Tank Cooling Coil 1 each I FM-Ist Floor 89.0 8,529.6 96.1 8,553 96.10 100% 8,553 96Sample Cold Trap I each I FM- I st Floor 117.0 566.0 4.8 562 4.80 100% 5625UF6 lab. Samples Cyl. Emptying Manifold I each I FM- Ist Floor 71.0 345.0 4.8 341, 4.80 100% 341,Sample Cold Trap I each I FM-lIst Floor 71.0. 345.0 4.8 341 4.80 100% 3415Unit Heater I each I FM- I st Floor 58.01 245.0 24.1 1,398 24.1I0 100% 1,398 2
Oil Cooler heat Exchanger I each I FM- I st Floor 200.01 31.5 0.2 40 0.20 100% 40 6Glycol heat Exchanger I each I FM-lIst Floor 200.0 31.0 0.2 40 0.20 100% 400
Over Feed Brine Cooler 1 each I FM-lst Floor 152.0 14,550.5 95.9 14,577 95.90 100% 14,577 94Economizer I each I FM-Ist Floor 152.0 14,550.01 95.9 14,577 95.90 100% 14,577 93R-1I34a Condenser I each I FM- Ist Floor 200.0 6,108.6 30.5 6,100 30.50 100% 6,100 31R-1 34a Liquid Suction in Heat Exchanger 1 each I FM- I st Floor 200.0 1,260.01 6.3 1,260 6.30 100% 1,260Condenser - R- 123 (Top) I each I FM-I st Floor 200.0 1,254.5 63 120 6.30 100% 1,260Condenser - Cooler - R-1 23 &R- I 34a (Bottom) 1 each 1 FKM- Ist, Flo or 25050.0 2,122.5 14.11 2,820 14.10 100% 2,820 14Condenser - R-1I34a Pump Down _ eah 1 FMltFoo.0. 6,100.01 30.51 6,100 30.50 100% 16,1001 311
#2 Steam Chest I each I I I FM- I st Floor 58.01 11,616.0 200.3 11,6171 200.301 100% 11,617 20C#I Steam Chest eac] M-lst Floor 1 58.0 11,616.01 200.3 11,617 200.30 100% 1 11,6171 20C"B" HF Preheater eac] M- st Floor 139.01 7,200.01 52.0 7,2281 52.001 100% 7,228 52
lst Floor 58.0 14,570.7 251.2 14,5701 251.20 100% 14,570 251Ist Floor 58.0 1,240.6 21.4 1,241 21.40 100% 1 1,2411 21I st Floor 62.01 428.0 6.9 428 6.90 100% 1 4281

MENERCON MTW Decommissioning Cost Estimate
Table A-13MISCELLANEOUS ITEM VOLUME ESTIMATEHoneywell - Metropolis Works (MTWt) Metropolis, Illinois
PERCENT ESOLUTIONS
BULK UNIT UNIT TOTAL TOTAL DIRECT DISPOSAL ESOLUTIONS
LOC NO. OF MAT'L OF DENSITY WEIGHT VOLUME WEIGHT VOLUME BURY WEIGHT DISPOSAL
DESCRIPTION CODE UNITS UNITS CONST. (lb/ftt) (lb) (ft
t) (pound) (ft') (vol %) (pound) VOLUME (ft
3)
Strip Heaters - Upper Section Ctr. I each I FM- I st Floor 62.0 428.0 6.9 428 6.90 100% 428 7Cooling Coils - Lower Section Ctr. I each I FM-I st Floor 62.0 428.0 6.9 428 6.90 100% 428 7Cooling Coils - Lower Section Ctr. I each I FM-1 st Floor 62.0 428.0 6.9 428 6.90 100% 428 7Mist Eliminator for Vacuum Pump I each I FM-lstFloor 58.0 120.0 3.1 180 3.10 100% 180 3
Oxide Vacuum Filter I each I FM-Ist Floor 58.0 1,390.2 34.8 2,018 34.80 100% 2.018 35UF4 Vacuum Filter I each I FM-Ist Floor 58.0 1,390.2 34.8 2,018 34.80 100% 2.018 35Ash Vacuum Cleaner I each I FM-Ist Floor 58.0 1,390.2 34.8 2,018 34.80 100% 2,018 35UF4 Vacuum Cleaner I each I FM-1 st Floor 58.0 7,855.0 1,543.0 89,494 1,543.00 100% 89,494 1,543Ash Vacuum Cleaner I each I FM-lst Floor 58.0 1,390.2 34.8 2,018 34.80 100% 2.018 35Oxide Vacuum Cleaner - Dust Collector I each 1 FM-1st Floor 58.0 4,670.4 116.8 6,774 116.80 100% 6,774 117
Oxide Vacuum Cleaner - Dust Collector I each I FM-lst Floor 77.0 900.0 11.6 893 11.60 100% 893 12UF4 Vacuum Cleaner I each I FM-Ist Floor 77.0 900.0 11.6 893 11.60 100% 893 12Spar Filter Fines Drum Dumper I each I FM-1st Floor 58.0 1,661.5 66.5 3,857 66.50 100% 3,857 67Hot Box (East) I each I FM-Ist Floor 58.0 1,600.0 64.0 3,712 64.00 100% 3,712 64Hot Box (West) I each I FM-Ist Floor 58.0 2,795.0 111.8 6,484 111.80 100% 6,484 112500# Mit-E-Lif, Portable Hoist I each I FM-Ist Floor 58.0 56.0 0.58 34 0.58 100% 34 1Crane Trolley Car I each I FM-lst Floor 58.0 11,571.0 199.5 11,571 199.50 100% 11,571 200
Lifting Beam for Shannahan Crane I each I FM- I st Floor 167.0 2,000.0 12.40 2,004 12.00 100% 2,004 12UF4 Mill - 3rd Floor I each I FM-lst Floor 58.0 2,500.0 30.5. 1,740 30.00 100% 1,740 30Stone Saw - Type M-75 I each I FM-Ist Floor 58.0 1,440.9 24.8 1,438 24.80 100% 1,438 23Bench Grinder - Queen Sity UF792 I each I FM-Ist Floor 58.0 116.0 2.03 116 2.00 100% 116 2
Bench Grinder - Stand I each I FM- I st Floor 58.0 400.0 20.5 1,160 20.00 100% 1,160 20Drum Inverter I each I FM-lIst Floor 58.0 4,176.0 72.03 4,176 72.00 100% 4,176 72
Ore Concrete Blender I each I FM-Ist Floor 58.0 10,300.0 432.4 25,079 432.40 100% 25,079 432
UF6 Cylindor Cart I each I FM-Ist Floor 58.0 6,027.2 103.9 6,026 103.90 100% 6,026 107UF4 Drum Inverter I each I FM-Ist Floor 58.0 4,176.0 2.0 4,176 72.00 100% 4,176 72Articulated arm for Fluorinators I each I FM-1 st Floor 58.0 258.0 4.4, 255 4.40, 100% 255 4Manlift - East I each I FM-lst Floor 58.0 2,400.0 332.5 19,285 332.50 100% 19,285 333Manlift - West I each I FM-lst Floor 58.0 2,400.0 332.5 19,285 332.50 100% 19,285 333Personnel Funnel Cone for Above I each I FM-Ist Floor 58.0 288.0 9.3 539 9.30 100% 539 90,000# Cap - Monorail -Maint Area I each I FM-lIst Floor 117.0 2,040.0 17.5 2,048 17.50 100% 2,048 18
!2,000# Cap - Monorail -Spar Recycle Area I each I FM-lIst Floor 124.0 345.0 2.8 347 2.80 100% 347 3:4,500# Cap - Monorail -"A" Green Salt Area I each I F-lst Floor 145.0 173.0 1.2 174 1.20 100 .174 19,500# Cap - Monorail -G.E. Dissoc. Retorts I each I FM-lst FLoo 92. 1. . 1 .0 10116 3
4,500# Cap - Monorail -"A" Green Salt Area 1 each I FM-Itt Floor 145.0 216.0 1.5 218 1.50 100% 2181 24,000# Cap - Monorail - "Q" Refrigeration Area I each I FM-Ist Floor 133.0 450.0 3.4 452 3.40 100% 4521 3#2 Vacuum Pumo each FM-I st Floor 58.01 230.0 10.4 6031 10.401 100% 603 10
each I FM-Ist Floor 1 95.0 56.0 0.61 571 0.60 100% 1 571 1each FM-Ist Floor 95.0 56.0 0.6 571 0.601 100% 57
I FM-Ist Floor 58.01 286.0 10.01 5801 10.001 100% 580 10
FM-Ist Floor 550.0 50.0 0.1 55 0.10 100% 55 0FM-lIt Floor 1 58.0 300.0 32.0 1,856 32.00 100% 1,856 32FM-ltt Floor 1 58.0 400.0 379.8 22,028 379.80 100% 22,028 380

MENERCON MTW Decommissioning Cost Estimate
Table A-13MISCELLANEOUS ITEM VOLUME ESTIMATEHoneywell - Metropolis Works (MTW) Metropolis, Illinois
PERCENT ESOLUTIONSBULK UNIT UNIT TOTAL TOTAL DIRECT DISPOSAL ESOLUTIONS
LOC NO. OF MAT'L OF DENSITY WEIGHT VOLUME WEIGHT VOLUME BURY WEIGHT DISPOSAL
DESCRIPTION CODE UNITS UNITS CONST. (Ib/ftI) (lb) (ft3) (pound) (ft') (vol %) (pound) VOLUME (ft')
Sample Vacuum Pump I each I FM-Ist Floor 58.0 230.0 10.4 603 10.40 100% 603 10Exhaust Fan - Distillation I each I FM-1st Floor 58.0 230.0 32.0 1,856 32.00 100% 1,856 32Flame Tower Vacuum Pump - 2nd Floor I each I FM-1 st Floor 58.0 230.0 10.4 603 10.40 100% 603 10Exhaust Fan - South Center I each I FM-1st Floor 58.0 230.0 32.0 1,856 32.00 100% 1,856 32Exhaust Fan - West I each I FM-lst Floor 58.0 230.0 32.0 1,856 32.00 100% 1,856 32Exhaust Fan - Maintenance Area I each I FM-1 st Floor 58.0 230.0 32.0 1,856 32.00 100% 1,856 32Basement Exhaust Fan - Hoistwell I each I FM- Ist Floor 58.0 230.0 32.0 1,856 32.00 100% 1,856 32Botom Hydrofluorinator Air Circulation Fan I each I FM-lst Floor 58.0 600.0 251.2 14,570 251.20 100% 14,570 251Bottom Hydrofluorinator Comp. Air Blower I each I FM-Ist Floor 58.0 450.8 27.0 1,566 27.00 100% 1,566 27Exhaust Fan - Sxw I each I FM-I st Floor 58.0 230.8 32.0 1,856 32.00 100% 1,856 32Refrigeration Vent Blower I each I FM-lst Floor 58.0 230.8 32.01 1,856 32.00 100% 1,856 32
Water Cooler I each I FM-lst Floor 58.0 83.8 6.0 3489 6.00 100% 348 4Po"Cab" Air conditioner I each I FM-1 st Floor 58.0 440.0 25.0 1,450 25.00 100% 1,450 25R-123 Cenrifugal Compressor I each I FM-Ist Floor 58.0 32,480.0 812.0 47,096 812.00 100% 47,096 814R-123 Purge Unit I each I FM-lst Floor 58.0 16,393.8 409.8 23,768 409.80 100% 23,768 410R-1I34a Purge Unit I each I1 FM-lst Floor 58.0 16,393.8 409.8 23,768 409.80 100% 23,768 410
Refrigerant Management System I each I FM- I st Floor 58.0 960.0 24.0 1,392 24.00 100% 1,392 24
R-123 High Efa . Purge Unit I each I FM-lst Floor 58.0 230.0 5 7.2 418 7.20 100% 4187 7"A" Bot. Hydrofluorinator I each I FM-lst Floor 155.0 6,483.8 41.9, 6,495 41.90. 100% 6,495 42"A" Hydrofluorinator I each I FM-lIst Floor 155.0 6,483.8 41.9 6,495 41.90 100% 6,495 42"B" Hydrofluorinator I each I F'M-lst Floor 155.0 6,483.8 41.9 6,495 41.90 100% 6,495 42
"B" Bot. Hydrofluorinator I each I FM-lst Floor 155.0 6,483.8 41.9 6,495 41.90 100% 6,495 42"C" Hydrofluorinator I each 11 FM-lst Floor 158.0 9,000.0 57.0 9,006 57.00 100% 9,006 5";12" Flame Tower Reactor I each I FM-lIst Floor 58.0 540.0 14.0 812 14.00 100% 812 1,4Separator I each I FM- Ist Floor 58.0 420.0 15.0 870 15.00 100% 870 15•Separator I each I FM-lIst Floor 58.0 420.0, 15.0 870, 15.00 100% 870, 15
Scoarator each FM-I st Floor 58.01 420.( 15.0 8701 15.001 100% 870
1 each I FM-lst Floor 1 58.0 480.01 48.0 2,784 48.00 100% 2,7841 4ieach FM-lst Floor 58.01 240.C 24.0 1,3921 24.001 100% 1,392
each FM-lst Floor 58.01 240.( 24.0 1,3921 24.001 100% 1,392
I FM-lst Floor 1 58.0 180.01 18.0 1,044 18.00 100% 1,044 1FM-lst Floor 145.01 16,500.C 113.4 16,4431 113.401 100% 16,443 112
FM-Ist Floor 83.01 13,719.C 165.8 13,7611 165.801 100% 13,761 16()or 77.01 1,216.8 15.7 1,2091 15.701 100% 1,209
77.0 1,216.0 15.7 1,209 15.70 100% 1,2091 1H2 Prepared Feed Hopper 58.01 6.000.8 662.5 38.4251 662.50! 100% 38,425 66'
#1 Prepared Feed Hopper each 662.5 38.4251 662.501 100% 38,425 662
Tempered Water Tank 1 each 9.1 7,111 96.10 100% 1 7 .1111 __ __
#3 Prepared Feed Hopper each 662.5 38,4251 662.501 100% 38,425 662
Water Treatment Chem. Addition Pot each FM-I 0.9 91 0.901 100% 91
Knock Out Pot I each FM-IR-134a Receiver each FM-Ist Floor
522 9.00 100% 1 52212,917 50.30 100% 1 2,9171 5(2,003 10.60 100% 1 2,0031 11R-134a Accumulator each FM-lIst Floor

ENERCON MTW Decommissioning Cost Estimate
Table A-I3MISCELLANEOUS ITEM VOLUME ESTIMATEHoneywell - Metropolis Works (MTW) Metropolis, Illinois
PERCENT ESOLUTIONS
BULK UNIT UNIT TOTAL TOTAL DIRECT DISPOSAL FSOLUTIONS
LOC NO. OF MAT'L OF DENSITY WEIGHT VOLUME WEIGHT VOLUME BURY WEIGHT DISPOSAL
DESCRIPTION CODE UNITS UNITS CONST. (lb/ft3) (lb) (ft3) (pound) (ft') (vol %) (pound) VOLUME (ft
3)
Distillate Crane Scale I each I FM-Ist Floor 140.0 25.0 0.2 28 0.20 100% 28 0UF6 Cylinder Shipping Scale I each I FM-lst Floor 58.0 3,450.0 172.5 10,005 172.50 100% 10,005 173Delumper Flame Tower Reactor I each I FM-lst Floor 58.0 150.0 3.3 191 3.30 100% 191 3Rotary Valve - Dust Coll. Discharge I each I FM-I st Floor 58.0 57.0 1.0 58 1.00 100% 1 58 1Rotary Valve - Draw Off Leg. - Basmt. I each I FM-Ist Floor 58.0 63.0 1.1 64 1.10 100% 64 1Rotary Valve "A" Bot H'Flator Disc. I each I FM- I st Floor 58.0 54.0 0.9 52 0.90 100% 52 1Dust Valve - M-410 Spar I each I FM-dst Floor 58.0 50.0 0.0 52 0.90 100% 52 7
Rotary Valve Bed Fines Hopper Disc. Rv. I each I FM-n st Floor 58.0 57.0 1.0 58 1.00 100% 58 1Rotary Valve "B" BIt. H'Flator Disc. I each I FM-dst Floor 58.0 57.0 1.0 58 1.00 100% 58 1Dryer Disch. Mill Feed Screw I each I FM-2nd Floor 120.0 943.0 7.6 948 7.90 100% 948
Calciner Elev, Disc. Screw I each 1 FM-2nd Floor 58.0 54.0 7.0 406 7.00 100% 406, 7Prepared Feed Hopper Feeder Screw I each I FM-2nd Floor 120.0 1,319.5 703.7 1,320 ,5 1.00 100% 1,320 170Undersized Feed Material Screw I each I FM-2nd Floor 120.0 2,733.2 22.8 2,736 22.80 100% 2,736 25Ore Cone. Surge Hopper Disch. Screw -N I each I FM-2nd Floor 58.0 1,700.0 31.8 1,844 31.80 100% 1,844 31Ore Cone. Surge Hopper Disch. Screw -N I each I FM-2nd Floor 58.0 1,700.0 31.8 1,844 31.80 100% 1,844 32
UF6 Continuous Sample Vessel-East I each I FM-2nd Floor 215.0 1,500.0 7.0 1,505 7.00 100% 1,5057
UF6 Continuous Sample Vessel-West I each I FM-2nd Floor 215.0 1,500.0 7.0 1,505 7.00 100% 1,5057
"A" Fluorinator Heater I each I FM-2nd Floor 58.0 5,760.0 144.0 8,352 144.00 100% 8,352 147
"B" Fluorinator Heater I each I FM-2nd Floor 58.0 5,760.0 144.0 8,352 144.00 100% 8,352 144Service Room Hot Water Heater I each I FM-2nd Floor 99.0 154.0 1.6 158. 1.60 100% 1582
Tempered Water Spiral Heat Exchanger I each I FM-2nd Floor 58.0 14,074.3 703.7 40,815 703.70 100% 40,815 704
Tempered Water Spiral Heat Exchanger I each I FM-2nd Floor 58.0 14,074.3 703.7 40,815 703.70 100% 40,815 704
Unit Heater I each I FM-2nd Floor 58.0 75 1.29 100% 75
Steam Jacket On U-430 I each I FM-2nd Floor 58.0 900 15.50 100% 900 16
"B" Top HfEFlator Heater I each I FM-2nd Floor 58.0 1,500.0 75.0 4,350 75.00 100% 4,350 75'
"C" FHater Heater I each I FM-2ndFor5. 1,280.0 64.0 3,712 64.00 100% 3,712 64
Fluidizing Air To All Flators I each I FM-2nd Floor 87.0 17.0 0.2 17 0.20 100% 170Safety Shower Filter I each I FM-2nd Floor 92.0 290.0 3.1 285 3.10 100% 285 3#1 Instrument Air Filter I each I FM-2nd Floor 92.0 0.1 9 0.101 100% 9
nt Air Filter I each 1 FM-2nd Floor 92.0 0.1 9 0.101 100% 9
I each 1 FM-2nd Floor 58.0 375.01 8.08 4641 8.00 100% 4641I each I FM-2nd Floor 58.01 375S &8C 464 8.001 100% 464
each 1 FM-2nd Floor 58.01 56.( 0.58 34 0.581 100% 341 FM-2nd Floor 60.01 1201 2.C 120 2.001 100% 120
2nd Floor 121.01 60.( 0.5 61 0.501 100% 61nd Floor 121.0 60.( 0.5 61 0.501 100% 61
Drill Press 58.01 250.( 16.7 969 16.701 100% 1 969
Prepared Feed MillOre Dryer Discharge Crasher
o.! 126.0 7,560 126.00 100% I 7,5601 12t30.C 2,490 30.001 100% 2,490
Scrap Recovery (UF4) MillPrepared Feed Mill 1Ore Precrusher 1
30.0 2,490 30500 100% 2,490 3Y126.0 7560 12 100% 560 12(45.0 2,610 45.00 100% 1 2,6101 4f980 5,684 98.00 100% j 5,6841 9iMotor Control Center (C-Fm-40) I each
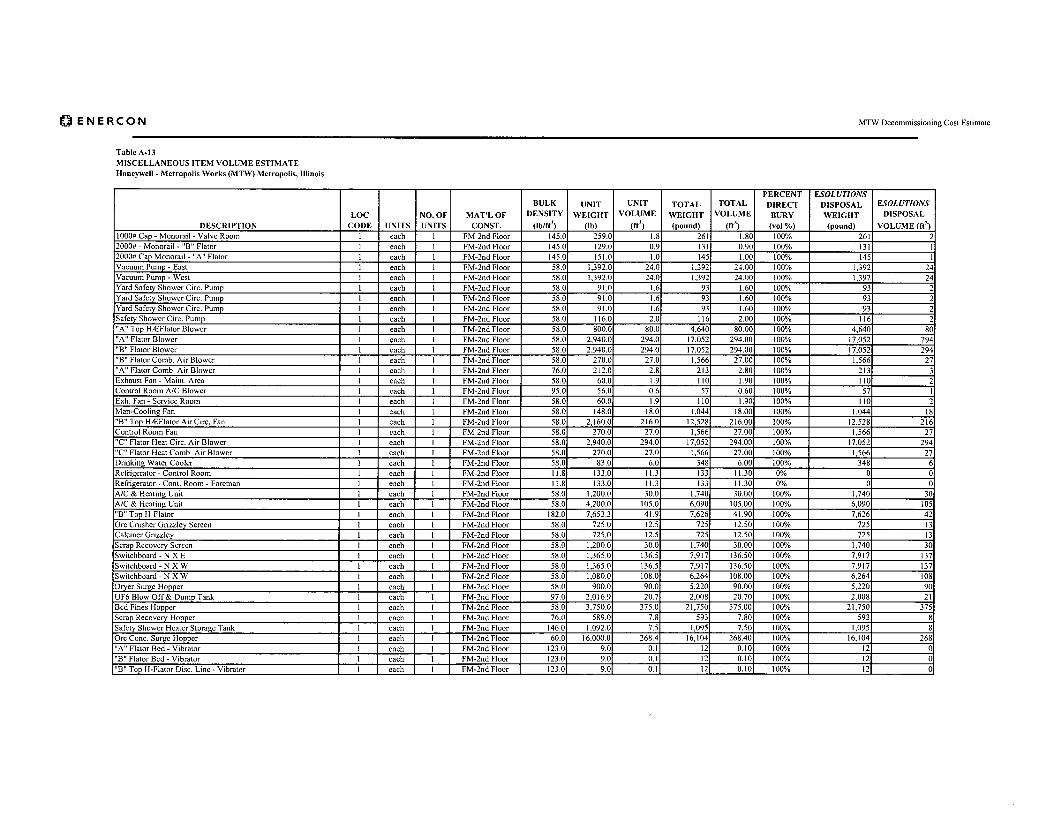
0 ENERCON MTW Decommissioning Cost Estimate
Table A-13MISCELLANEOUS ITEM VOLUME ESTIMATEHoneywell - Metropolis Works (MTW) Metropolis, Illinois
PERCENT ESOLUTIONSBULK UNIT UNIT TOTAL TOTAL DIRECT DISPOSAL ESOLUTIONS
LOC NO. OF MAT'L OF DENSITY WEIGHT VOLUME WEIGHT VOLUME BURY WEIGHT DISPOSALDESCRIPTION CODE UNITS UNITS CONST. (lb/ft
3) (lb) (ft') (pound) (ft') (vol %) (pound) VOLUME (ft')
1000# Cap - Monorail - Valve Room 1 each I FM-2nd Floor 145.0 259.0 1.8 261 1.80 100% 261 .22000# - Monorail - "B" Flator I each I FM-2nd Floor 145.0 129.0 0.9 131 0.90 100% 131 12000# Cap Monorail - "A" Flator I each 1 FM-2nd Floor 145.0 151.0 1.0 145 1.00 100% 145 1Vacuum Pump - East I each I FM-2nd Floor 58.0 1,392.0 24.01 1,392 24.00 100% 1,392 24Vacuum Pump - West I each I FM-2nd Floor 58.0 1,392.0 24.0 1,392 24.00 100% 1,392 24Yard Safety Shower Cire. Pump I each I FM-2nd Floor 58.0 91.0 1.6 93 1.60 100% 93Yard Safety Shower Circ. Pump I each I FM-2nd Floor 58.0 91.0 1.6 93 1.60 100% 93 2Yard Safety Shower Circ. Pump I each I FM-2nd Floor 58.0 91.0 1.6 93 1.60 100% 93 2Safety Shower Cire. Pump I each I FM-2nd Floor 58.0 116.0 2.0 116 2.00 100% 116"A" Top H4EFlator Blower I each I FM-2nd Floor 58.0 800.0 80.0 4,640 80.00 100% 4,640 80"A" Flator Blower I each I FM-2nd Floor 58.0 2,940.0 294.0 17,052 294.00 100% 17,052 294"B" Flator Blower 1 each I FM-2nd Floor 58.0 2,940.0 294.0 17,052 294.00 100% 17,052 294"B" Flator Comb. Air Blower I each I FM-2nd Floor 58.0 270.0 27.0 1,566 27.00 100% 1,566 27"A" Flator Comb. Air Blower I each I FM-2nd Floor 76.0 212.0 2.8 213 2.80 100% 213 3Exhaust Fan - Maint. Area I each I FM-2nd Floor 58.0 60.0 1.9 110 1.90 100% 110 2Control Room A/C Blower I each I FM-2nd Floor 95.0 56.0 0.6 57 0.60 100% 57Exh. Fan - Service Room I each I FM-2nd Floor 58.0 60.0 1.9 110 1.90 100% 110 2Man-Cooling Fan I each I FM-2nd Floor 58.0 148.0 18.0 1,044 18.00 100% 1,044 18"B" Top HLEFlator Air Circ. Fan I each 1 FM-2nd Floor 58.0 2,160.0 216.0 12,528 216.00 100% 12,528 216Control Room Fan I each I FM-2nd Floor 58.0 270.0 27.0 1,566 27.00 100% 1,566 27"C" Flator Heat Cire. Air Blower I each I FM-2nd Floor 58.0 2,940.0 294.0 17,052 294.00 100% 17,052 294"C" Flator Heat Comb. Air Blower I each I FM-2nd Floor 58.0 270.0 27.0 1,566 27.00 100% 1,566 27Drinking Water Cooler I each I FM-2nd Floor 58.0 83.0 6.0 348 6.00 100% 348 6Refrigerator - Control Room I each I FM-2nd Floor 11.8 133.0 11.3 133 11.30 0% 0 (3Refrigerator - Cont. Room - Foreman I each 1 FM-2nd Floor 11.8 133.0 11.3 133 11.30 0% 0 0A/C & Heating Unit I each 1 FM-2nd Floor 58.0 1,200.0 30.0 1,740 30.00 100% 1,740 30A/C & Heating Unit I each I FM-2nd Floor 58.0 4,200.0 105.0 6,090 105.00 100% 6,090 105"B" Top H-Flator 1 each 1 FM-2nd Floor 182.0 3 7,653.3 41.9 7,621 41.90 100% 7,626 42Ore Crusher GrizzlHy Screen I each I FM-2nd Floor 58.0 725.0 12.5 725 12.50 100% 725 13Calciner Grizzley I each I FM-2nd Floor 58.0 725.0 12.5 725 12.50 100% 725 13Scrap Recovery Scrge n I each 1 FM-2nd Floor 58.0 1,200.0 30.0 1,7410 30.00 100% 1,740 30Switchboard - N X E I each I FM-2nd Floor 58.03 1,365.0 136.5 7,917, 136.503 100% 7,917 137Switchboard - N X W I each I FM-2nd Floor 58.03 1,365.0 136.5 7,917 136.503 100% 7,917 137Switchboard - N X W I each I FM-2nd Floor 58.03 1,080.0 108.0 6,264 108.003 100% 6,264 108
Dryer Surge Hopper I each I FM-2nd Floor 58.0( 900.0 90.0 5,2203 90.00 100% 5,220 90UF6 Blow Off& Dump Tank I each I FM-2nd Floor 97.03 2,016.9 20.7 2,008 20.70 100% 2,008 21Bed Fines Hopper 1 each 1 FM-2nd Floor 58.03 3,750.0 375.0 21,7503 375.003 100% 21,750 375Scrap Recovery Hopper I each I FM-2nd Floor 76.03 589.0 7.8 593 7.80 100% 593 8Safety Shower Heater Storage Tank I each I FM-2nd Floor 146.0 1,092.0 7.5 1,095 7.50 100% 1,095 8Ore Come. Surge Hopper c ech 1 FM-2nd Floor 60.03 16,000. 268.4 16,104 268.403 100% 16,124 268
"A" Flator Bed - Vibrator I each 1 FM-2nd Floor 123.0 39.0 0.1 12 0.10 100% 12 0"B" Flator Bed - Vibrator I each 1 FM-2nd Floor 123.0 9.0 0.1 12 0,10 100% 2.i 0"B" Top H-Flator Disc. Line - Vibrator I each I FM-2nd Floor 230 9.01 0.1 121 0.101 100% 1121

MENERCON MTW Decommissioning Cost Estimate
Table A-l 3MISCELLANEOUS ITEM VOLUME ESTIMATEHoneywell - Metropolis Works (MTW) Metropolis, Illinois
PERCENT ESOLUTIONSBULK UNIT UNIT TOTAL TOTAL DIRECT DISPOSAL ESOLUTIONS
LOC NO. OF MAT'L OF DENSITY WEIGHT VOLUME WEIGHT VOLUME BURY WEIGHT DISPOSALDESCRIPTION CODE UNITS UNITS CONST. (Ib/ft
3) (Ib) (ft') (pound) (ft') (vol %) (pound) VOLUME (ft
3)
Undersizc Feed Mat]. Screw - Vibrator I each I FM-2nd Floor 123.0 9.0 0.1 12 0.10 100% 12 0"C" Flator Bed - Vibrator I each I FM-2nd Floor 123.0 9.0 0.1 12 0.10 100% 12 0Ore Cone. Surge Hopper - N - Vibrator I each I FM-2nd Floor 123.0 9.0 0.1 12 0.10 100% 12Ore Cone. Surge Hopper- S - Vibrator I each I FM-2nd Floor 123.0 9.0 0.1 12 0.10 100% 121 0Cone. Blender Feed Line - Vibrator I each I FM-2nd Floor 123.0 9.0 0.1 12 0.10 100% 12 0"A" Bottom H-Flator Feeder I each I FM-2nd Floor 358.0 800.0 2.2 788 2.20 100% 788 2In - Range Discharge I each I FM-2nd Floor 358.0 800.0 2.2 788 2.20 100% 788 2Scrap Rec. Mill Feeder I each I FM-2nd Floor 358.0 800.0 2.2 788 2.20 100% 788 2Fines Discharge I each I FM-2nd Floor 358.0 800.0 2.2 788 2.20 100% 788 2"A" Flator Spar Feeder I each I FM-2nd Floor 358.0 800.0 2.2 788 2.20 100% 788 2"B" Flator UF4 Feeder I each I FM-2nd Floor 358.0 800.0 2.2 788 2.20 100% 788 2"A" Flator UF4 Feeder I each I FM-2nd Floor 358.0 800.0 2.2 788 2.20 100% 788 2"B" Flator Spar Feeder I each I FM-2nd Floor 358.0 800.0 2.2 788 2.20 100% 788 2"B" Bottom H-Flator Feeder I each I FM-2nd Floor 358.0 800.0 2.2 788 2.20 100% 788 2"C" Flator UF4 Feeder I each I FM-2nd Floor 358.0 800.0 2.2 788 2.20 100% 788 2"C" Flator Spar Feeder 1 each I FM-2nd Floor 358.0 800.0 2.2 788 2.20 100% 788 2Ore In-Range Discharge I each I FM-2nd Floor 358.0 800.0 2.2 788 2.20 100% 788 2Ore In-Range Discharge I each I FM-2nd Floor 358.0 800.0 2.2 788 2.20 100% 788 2"A" Reoxidizer Screw I each I FM-3rd Floor 120.0 943.0 7.9 948 7.90 100% 948 8Flator Filter Fines Screw I each I FM-3rd Floor 120.0 943.0 7.9 948 7.90 100% 948 8Ore Dryer Feed Screw I each I FM-3rd Floor 120.0 2,261.9 18.8 2,256 18.80 100% 2,256 19"B" Reoxidizer Screw I each I FM-3rd Floor 58.0 4,500.0 216.0 12,528 216.00 100% 12,528 216Ore Classifier Feed Screw I each I FM-3rd Floor 58.0 500.0 16.0 928 16.00 100% 928 16Hoist Trolley I each I FM-3rd Floor 75.0 225.0 3.0 225 3.00 100% 225 3Hoist Trolley I each I FM-3rd Floor 75.0 225.0 3.0 225 3.00 100% 225 3Ore Dryer I each I FM-3rd Floor 58.0 35,000.0 1,085.0 62,930 1,085.00 100% 62,930 1,085Filter Dryer I each I FM-3rd Floor 58.0 2,000.0 144.0 8,352 144.00 100% 8,352 144Ore Dryer Heater I each I FM-3rd Floor 58.0 10,000.0 172.4 9,999 172.40 100% 9,999 172"A" Top Hflator Heater I each I FM-3rd Floor 58.0 5,760.0 144.0 8,352 144.00 100% 8,352 144High Boiler Still Condenser I each I FM-3rd Floor 120.0 94.0 0.8 96 0.80 100% 96 1H20 Filter For Metal Tube D/P Test - E I each I FM-3rd Floor 58.0 63.0 1.1 64 1.10 100% 64 1H20 Filter For Metal Tube D/P Test - W I each I FM-3rd Floor 58.0 63.0 1.1 64 1.10 100% 64Hot Glycol Filter I each I FM-3rd Floor 58.0 63.0 1.1 641 1.10 100% 64Decon Trunk VacuumWelder
each I FM-3rd Floor 58.( 63.0 64 1.101 100% 61 I1 1 each I FM-3rd Floor 1 214.31 380.0 9 9.11 1, 9.101 100% 7 1.9509
Hot Box each I FM-3rd Floor 58.( 1,174.5 20.3 1,1771 20.301 100% 1,177 20FM-3rd Floor 58.( 56.0 0.6 341 0.581 100% 34
225.01 150.01 0.71 158_ 0.701 100% 1581 1631 125.0 2.0 1261 2.001 100% 126 2
0.7 74 0.70 100% 74 14.0 232 4.00 100% 232 41.1 6_ 1.10 100% 69 1
75.0 4,3502 75.00 100% 4,3501 751000# Cap. Hoist - ElectricScrap Recycle Drum Inverter

MENERCON MTW Decommissioning Cost Estimate
Table A-13MISCELLANEOUS ITEM VOLUME ESTIMATEHoneywell - Metropolis Works (MTW) Metropolis, Illinois
PERCENT ESOLUTIONSBULK UNIT UNIT TOTAL TOTAL DIRECT DISPOSAL ESOLUTIONS
LOC NO. OF MAT'L OF DENSITY WEIGHT VOLUME WEIGHT VOLUME BURY WEIGHT DISPOSAL
DESCRIPTION CODE UNITS UNITS CONST. (lb/ftl) (lb) (ft3) (pound) (ft
3) (vol %) (pound) VOLUME (ft
3)
Washer - Decon I each I FM-3rd Floor 58.0 150.0 36.0 2,088 36.00 100% 2,088 3R2,500 Cap. Monorail I each I FM-3rd Floor 145.0 518.0 3.6 522 3.60 100% 5222,000 Cap. Monorail I each I FM-3rd Floor 145.0 216.0 1.5 218 1.50 100% 2184,500 Cap. Monorail I each I FM-3rd Floor 145.0 216.0 1.5 218 1.50 100% 218,4,000 Cap. Monorail I each I FM-3rd Floor 124.0 633.0 5.1 632 5.10 100% 632Monorail I each I FM-3rd Floor 145.0 690.0 4.8 696 4.80 100% 6964,000 Cap. Monorail I each I FM-3rd Floor 124.0 173.0 1.4 174 1.40 100% 174 1Dryer Combustion Air Blower I each I FM-3rd Floor 58.0 5.0 0.5 29 0.50 100% 29 1"A" Flator Offgas Lines Cooling Blower I each I FM-3rd Floor 58.0 80.0 8.0 464 8.00 100% 464 0Exhaust Fan - Service Room I each I FM-3rd Floor 58.0 270.0 27.0 1,566 27.00 100% 1,566 27Exhaust Fan - Decon I each I FM-3rd Floor 76.0 213.0 2.8 213 2.80 100% 213 3Wall Exhaust Fan - South I each I FM-3rd Floor 58.0 200.0 32.0 1,856 32.00 100% 1,856 32Wall Exhaust Fan - West I each I FM-3rd Floor 58.0 200.0 32.0 1,856 32.00 100% 1,856 32
#317-1 Vent Unit I each I FM-3rd Floor 58.0 544.0 27.2 1,578 27.20 100% 1,578 27Exhaust Fan I each I FM-3rd Floor 58.0 200.0 32.0 1,856 32.00 100% 1,856 T2Exhaust Fan I each I FM-3rd Floor 58.0 200.0 32.0 1,856 32.00 100% 1,856 32Decon Bead Blaster I each I FM-3rd Floor 58.0 960.0 96.0 5,568 96.00 100% 5,568 96Exhaust Fan I each I FM-3rd Floor 58.0 200.0. 32.0 1,856 32.00 100% 1,856 32"B" Top Hflator Combustion Air Blower I each I FM-3rd Floor 58.0 270.0 27.0 1,566 27.00 100% 1,566 27Wall Exhaust Fan - Southwest I each I FM-3rd Floor 58.0 200.0 32.0 1,856 32.00 100% 1,856 32Drinking Cooler I each I FM-3rd Floor 58.0 83.0 6.0 348 6.00 100% 348 6"A" Top Hflator i each I FM-3rd Floor 58.0 7,592.2 130.9 7.592 130.90 100% 7,592 1314,,E Dia. Prepared Feed Air Classifier I each I FM-3rd Floor 113.0 1,500.0 13.3 1,503 13.30 100% 1,503 136,E Dia. Prepared Feed Air Classifier I each I FM-3rd Floor 72.0 3,200.0 44.7 3,218 44.70 100% 3,218 45Switchboard East-West I each I FM-3rd Floor 58.0 1,200.0 120.0 6,960 120.00 100% 6,960 120
Switchboard East-East I each I FM-3rd Floor 58.0 1,800.0, 180.0 10,440 180.00 100% 10,440 180Ultrasonic Cleaner Tank - DeconDryer Feed Hopper#1 Still Feed Tank#2 Still Feed TankBed Fines HopperSpar Discharge Hopper
each I FM-3rd Floor 58.0 300.f 48.0 2,78/ 48.00 100% 2,784 48
I each 1 FM-3rd Floor 1 58.0 1,920.01 96.0 5,568 96.00 100% 5,568 96each I FM-3rd Floor 212.0 8,710.01 41.01 8,6921 41.001 100% 8,692 41
FM-3rd Floor 212.0 8,710A1 41.01 8,69, 41.001 100% 8,692 41loor i 58.0 6,400.01 312.5 18,1251 312.50 100% 1 18,1251 313loor 58.0 2.400.C 120.0 6,96( 120.001 100% 6,960 120
#3 Still Feed Tank 212.0 8,710.C 41.0 8.6921 41.001 100% 8,692 41
Dryer Feed Hopper Vibrator - West"A" Reoxidizer Screw Ditch. Vibrator
9.8 0.1 0.101 100% 12 0
0.1 121 0.10 100% 1 121 C"B" Flator Primary Filter Disch. Vibrator each 1 0.1 0.101 100% 12 C
"B" Flator B.U. Filter Disch. Vibrator each I FM--- 0.101 100% 12 0
"A" Flator Primary Filter Disch. Vibrator I each I FM-3rd Fl 0.10 100% 121 C
"A" Flator B.U. Filter Disch. Vibrator each I FM-3rd Floor 0.101 100% 12 0
F-416 Discharge Line Vibrator I each [ FM-3rd Floor"C2" Flator Primary Filter D.O. Vibrator I each 1 FM-3rd Floor"Cl " Flator Primary Filter D.O. Vibrator I each 1 FM-3rd Floor
12 0
D3•r 'd 4n rVi tr U¢ e•eh 1 FSM-3r,5FPnnr 1 23.0yer Feed Ho er Vibrator - East each I FM-3rd Floor 1230,
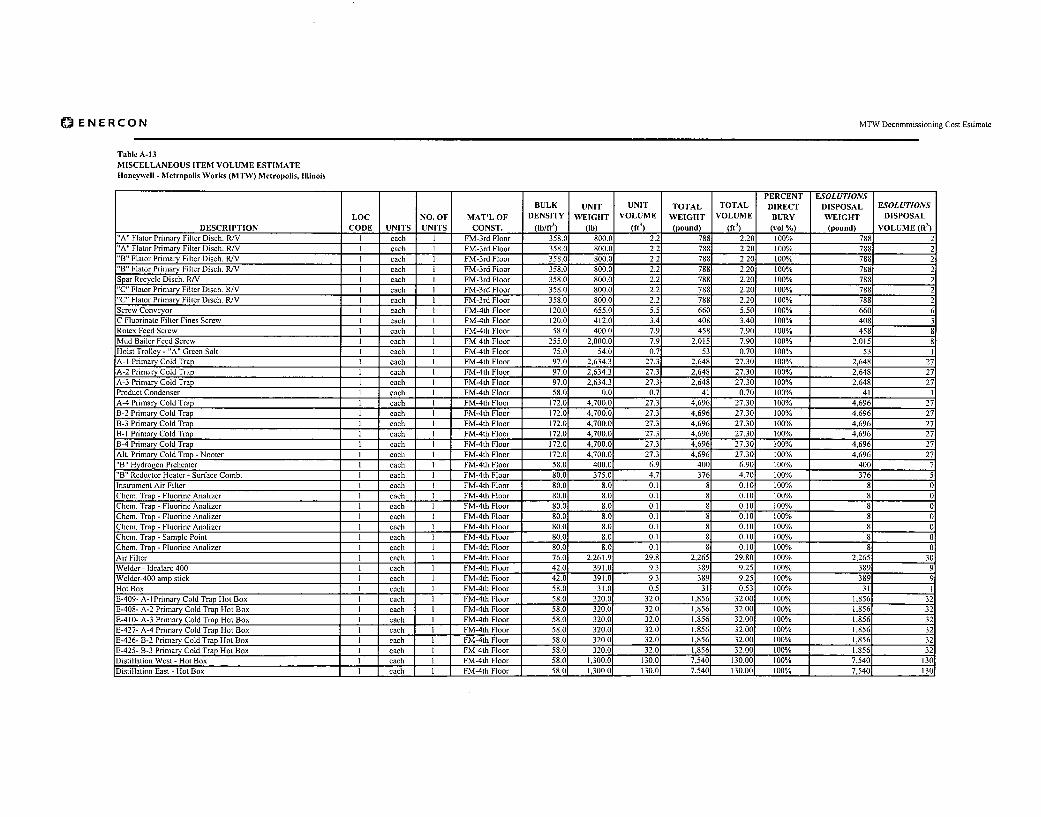
MENERCON MTW Decommissioning Cost Estimate
Table A-13MISCELLANEOUS ITEM VOLUME ESTIMATEHoneywell - Metropolis Works (MTW) Metropolis, Illinois
PERCENT ESOLUTIONSBULK UNIT UNIT TOTAL TOTAL DIRECT DISPOSAL ESOLUTIONS
LOC NO. OF MAT'L OF DENSITY WEIGHT VOLUME WEIGHT VOLUME BURY WEIGHT DISPOSALDESCRIPTION CODE UNITS UNITS CONST. (lb/ft
t) (lb) (ft
3) (pound) (ft') (vol %) (pound) VOLUME (ft
5)
"A" Flator Primary Filter Disch. R/V I each I FM-3rd Floor 358.0 800.0 2.2 788 2.20 100% 788 2"A" Flator Primary Filter Disch. RNV I each I FM-3rd Floor 358.0 800.0 2.2 788 2.20 100% 788 2"B" Flator Primary Filter Disch. R/V I each 1 FM-3rd Floor 358.0 800.0 2.2 788 2.20 100% 788 2"B" Flator Primary Filter Disch. RNV i each I FM-3rd Floor 358.0 800.0 2.2 788 2.20 100% 788 2Spar Recycle Disch. RNV I each I FM-3rd Floor 358.0 800.0 2.2 788 2.20 100% 788 2"C" Flator Primary Filter Disch. R/V I each I FM-3rd Floor 358.0 800.0 2.2 788 2.20 100% 788 2"C" Flator Primary Filter Disch. R/V I each I FM-3rd Floor 358.0 800.0 2.2 788 2.20 100% 788Screw Conveyor I each I FM-4th Floor 120.0 655.0 5.5 660 5.50 100% 660 6C Fluorinate Filter Fines Screw I each I FM-4th Floor 120.0 412.0 3.4 408 3.40 100% 408Rotcx Feed Screw I each I FM-4th Floor 58.0 400.0 7.9 458 7.90 100% 458 8Mud Bailer Feed Screw I each I FM-4th Floor 255.0 2,000.0 7.9 2,015 7.90 100% 2,015 8Hoist Trolley - "A" Green Salt I each I FM-4th Floor 75.0 54.0 0.7 53 0.70 100% 53 1A-I Primary Cold Trap I each I FM-4th Floor 97.0 2,634.3 27.3 2,648 27.30 100% 2,648 27A-2 Primary Cold Trap I each I FM-4th Floor 97.0 2,634.3 27.3 2,648 27.38 100% 2,648 27A-3 Primary Cold Trap I each I FM-4th Floor 97.0 2,634.3 27.3 2,648 27.30 100% 2,648 27Product Condenser I each I FM-4th Floor 58.0 0.0 0.7 41 0.70 100% 41 1A-4 Primary Cold Trap I each I FM-4th Floor 172.0 4,700.0 27.3 4,696 27.30 100% 4,696 27B-2 Primary Cold Trap I each I FM-4th Floor 172.0 4,700.0 27.3 4,696 27.30 100% 4,696 27B-3 Primary Cold Trap I each I FM-4th Floor 172.0 4.700.0 27.3 4,696 27.30 100% 4,696 27B-I Primary Cold Trap I each I FM-4th Floor 172.0 4,700.0 27.3 4,696 27.30 100% 4,696 27B-4 Primary Cold Trap I each I FM-4th Floor 172.0 4,700.0 27.3 4,696 27.30 100% 4,696 27M~t. Primary Cold Trap - Nooter I each I FM-4th Floor 172.0 4,700.0 27.3 4,696 27.30 100% 4,696 27'B" Hydrogen Preheater I each I FM-4th Floor 58.0 400.0 6.9 400 6.90 100% 400 7'B" Reductor Heater - Surface Comb. I each I FM-4th Floor 80.0 375.0 4.7 376 4.70 100% 376 5Instrument Air Filter I each I FM-4th Floor 80.0 8.0 0.1 8 0.10 100% 8 0Chem. Trap - Fluorine Analizer I each I FM-4th Floor 80.0 8.0 0.1 8 0. 10 100% 8 0Them. Trap - Fluorine Analizer I each I FM-4th Floor 80.0 8.0 0.1 8 0.10 100% 8 0Zhem. Trap - Fluorine Analizer I each 1 FM-4th Floor 80.0 8.0 0.1 8 0.10 100% 1 81 0-hem. Trap - Fluorine Analizer I1 each I FM-4th Floor 80.0 8.0 0.1 8 0.10 100% 8Chem. Tran - Samole Point each I FM-4th Floor 80.0 0.1 8 0.101 100% 8-.h each I FM-4th Floor 1 80.0 8.0 0 0.11 81 0.101 100% 1 81
each I FM-4th Floor 76.01 2.261.S 29.8 2.265 29.801 100% 2.26542.01 391.( 9.3 389 9.251 100% 389
9.3 389 9.251 100%
E-408- y Cold Trap Hot BoxF-410- , y Cold Trap Hot Box IE-427- A-4 Primary Cold Trap Hot BoxE-426- B-2 Primary Cold Trap Hot Box each I FME-425- B-3 Primary Cold Trap Hot Box Ii each 1Distillation West - Hot Box I each IDistillation East - Hot Box I1 each I 1 FM-4th Floor 7,540 13C

ENERCON MTW Decommissioning Cost Estimate
Table A-13MISCELLANEOUS ITEM VOLUME ESTIMATEHoneywell - Metropolis Works (MTW) Metropolis, Illinois
PERCENT ESOLUTIONSBULK UNIT UNIT TOTAL TOTAL DIRECT DISPOSAL ESOLUTIONS
LOC NO. OF MAT'L OF DENSITY WEIGHT VOLUME WEIGHT VOLUME BURY WEIGHT DISPOSAL
DESCRIPTION CODE UNITS UNITS CONST. (lb/ft') (Ib) (ft) (pound) (ft') (vol %) (pound) VOLUME (ft)E-600-Alh. Primary Cold Trap Hot Box I each I FM-4th Floor 58.0 320.0 32.0 1,856 32.00 100% 1,856 32E-492- B-I Primary Cold Trap Hot Box I each I FM-4th Floor 58.0 320.0 32.0 1,856 32.00 100% 1,856 32E-493- B-4 Primary Cold Trap Hot Box I each I FM-4th Floor 58.0 320.0 32.0 1,856 32.00 100% 1,856 32Mit-E-Lift - 500# Cap 1 each I FM-4th Floor 58.0 56.0 0.6 34 0.58 100% 34Hoist - "A" Green Salt Train - 2000# Cap. I each I FM-4th Floor 58.0 125.0 21.0 1,218 21.00 100% 1,218 21Hoist - Cold Trap Area I each I FM-4th Floor 58.0 56.0 0.6 34 0.58 100% 34Hoist - Cold Trap Area I each I FM-4th Floor 58.0 56.0 0.6 34 0.58 100% 34#1 Mud bailer - West I each I FM-4th Floor 58.0 4,000.0 120.0 6,960 120.00 100% 6,960 120#2 Mud bailer - East I each I FM-4th Floor 58.0 4,000.0 90.0 5,220 90.00 100% 5,220 90#1 UF4 Mill -North I each I FM-4th Floor 58.0 4,872.0 84.0 4,872 84.00 100% 4,872 84UF4 Blender I each I FM-4th Floor 58.0 10,500.0 600.0 34,800 600.00 100% 34,800 600#2 UF4 Mill - South I each I FM-4th Floor 58.0 8,120.0 140.0 8,120 140.00 100% 8,120 140#3 Mudballer - North I each I FM-4th Floor 58.0 4,000.0 75.0 4,350 75.00 100% 4,350 75Monorail - Over A-3 Prim. Cold Trap, 30,000# 1 each I FM-4th Floor 106.0 2,500.0 23.5 2,491 23.50 100% 2,491 24Monorail - Over A-2 Prim. Cold Trap, 30,000# 1 each I FM-4th Floor 106.0 2,500.0 23.5 2,491 23.50 100% 2,491 24Monorail - Over A-I Prim. Cold Trap, 30,000# 1 each I FM-4th Floor 106.0 2,500.0 23.5 2,491 23.50 100% 2,491 24Monorail - Over Rotex Screen (S-600), 3,000# 1 each I FM-4th Floor 62.0 200.0 3.2 198 3.20 100% 198 3Monorail - "A" G. Salt Area, 2,000# 1 each I FM-4th Floor 58.0 151.0 2.6 151 2.60 100% 151 3Monorail - B-3 Prim. Cold Trap I each I FM-4th Floor 106.0 1,125.0 10.6 1,124 10.60 100% 1,124 11Monorail - A Bot. Hflourinator I each I FM-4th Floor 66.0 230.0 3.5 231 3.50 100% 231 4Vac. Pump - UF6 Fluorine Analizer I each I FM-4th Floor 58.0 131.0 2.3 133 2.30 100% 133 2Vac. Pump - Sample Point I each I FM-4th Floor 58.0 203.0 3.5 203 3.50 100% 203 4"A" Reductor Blower I each I FM-4th Floor 58.0 2,520.0 252.0 14,616 252.00 100% 14,616 252Exh. Fan - HF Area - West Wail I each I FM-4th Floor 58.0 27.0 2.7 157 2.70 100% 157 3Exh. Fan - HF Area - South Wail I each I FM-4th Floor 58.0 27.0 2.7 157 2.70 100% 157 3Building Ventilation Unit I each I FM4th Floor 58.0 800.0 120.0 6,960 120.00 100% 6,960 120Man Cooling Fan I each I FM-4th Floor 58.0 60.0 1.9 110 1.90 100% 110 2"B" Reductor Comb. Air Blower I each I FM-4th Floor 58.0 146.0 22.5 1,305 22.50 100% 1,305 23Exhaust Fan - South X West - I Lg I each I FM-4th Floor 58.0 200.0 32.0 1,856 32.00 100% 1,856 32Drinking Water Cooler I each I FM-4th Floor 58.0 83.0 6.0 348 6.00 100% 348 6#1 UF4 Mill Grizzley I each I FM-4th Floor 58.0 3,600.0 360.0 20,880 360.00 100% 20,880 360#2 UF4 Mill Grizzley I each I FM-4th Floor 58.0 3,600.0 360.0 20,880 360.00 100% 20,880 360Spar (Bed) Rotex Screen I each I FM-4th Floor 58.0 840.0 84.0 4,872 84.00 100% 4,872 84Rotex Screen I each I FM-4th Floor 58.0 840.0 84.0 4,872 84.00 100% 4,872 84Switchboard C-19 West I each I FM-4th Floor 58.0 2,520.0 252.0 14,616 252.00 100% 14,616 252Switchboard D-20 East I each I FM-4th Floor 58.0 2,520.0 252.0 14,616 252.00 100% 14,616 252Vibrator - #1 Ore Cone. Hopper I each I FM-4th Floor 123.01 9.0 0.1 12 0.10 100% 12 0Vibrator - #2 Ore Cone. Hopper I each I FM-4th Floor 123.0 9.0 0.1 12 0.10 100% 12 0Vibrator - #1 Dry Oxide Dust Coil. I each I FM-4th Floor 123.0 9.0 0.1 12 0.10 100% 12 0Vibrator - #1 Dry Oxide Dust Coil. 1 each I FM-4th Floor 123.0 9.0 0.1 12 0.10 100% 12 0Vibrator - #1 Dry Oxide Dust Coil. I each I FM-4th Floor 123.0 9.0 0.1 12 0.10 100% 12 0Vibrator - HF Filter (F-424) Disch. Line I each I FM-4th Floor 123.0 9.0 !0.1 12 0.10 100% 12 0Vibrator- HF Filter (F-425) Disch. Line I each I FM-4th Floor 123.0 9.0 0.1 121 0.10 100% 12 0

MENERCON MTW Decommissioning Cost Estimate
Table A-]13MISCELLANEOUS ITEM VOLUME ESTIMATEHoneywell - Metropolis Works (MTW) Metropolis, Illinois
PERCENT ESOLUTIONSBULK UNIT UNIT TOTAL TOTAL DIRECT DISPOSAL ESOLUTIONS
LOC NO. OF MAT'L OF DENSITY WEIGHT VOLUME WEIGHT VOLUME BURY WEIGHT DISPOSALDESCRIPTION CODE UNITS UNITS CONST. (lb/fl
3) (b) (ft
t) (pound) (f') (Vol %) (pound) VOLUME (f1t)
Vib. - "A" Reductor K.O. Pot Disch. Line I each I FM-4th Floor 123.0 9.0 0.1 12 0.10 100% 12 8Vibrator - UF4 Hopper I each I FM-4th Floor 123.0 9.0 0.1 12 0.10 100% 12Vibrator - Spar Decay Hopper Disch. Line I each I FM-4th Floor 123.0 9.0 0.1 12 0.10 100% 12 0Vibrator- N3 Ore Cone. Hopper I each I FM-4th Floor 123.0 9.0 0.1 12 0.10 100% 12 CVibrator - UF4 Hopper I each I FM-4th Floor 123.0 9.0 0.1 12 0.10 100% 12 8Vibrator - "B3" HF Filter Disch. Line I each I FM-4th Floor 123.0 9.0 0.1 12 0.10 100% 12 CVibrator - "B4" HF Filter Disch. Line I each I FM-4th Floor 123.0 9.0 0.1 12 0.10 100% 12 0Vibrator - "B5" HF Filter Disch. Line I each I FM-4th Floor 123.0 9.0 0.1 12 0.10 100% 12 0Vibrator - "16" HF Filter Disch. Line I each I FM-4th Floor 123.0 9.0 0.1 12 0.10 100% 12 0Vib. - "B" Red.ER Fines Ko Pot Disch. Line I each I FM-4th Floor 123.0 9.0 0.1 12 0.10 100% 12 0Vibrator-Inlet Line To #2 UF4 Mill I each I FM-4th Floor 123.0 9.0 0.1 12 0.10 100% 12 0Rotary Valve - #I Mudbailer Ore Blender I each I FM-4th Floor 58.0 68.0 1.2 70 1.20 100% 70Rotary Valve - #2 Mudballer Ore Blender I each I FM-4th Floor 58.0 68.0 1.2 70 1.20 100% 701Rotary Valve - "A" Top HjEFlator I each I FM-4th Floor 58.0 73.0 1.3 75 1.30 100% 75Rotary Valve - F-494 Fines Discharge I each I FM-4th Floor 58.0 73.0 1.3 75 1.30 100% 75 1Rotary Valve - F-493 Fines Discharge I each I FM-4th Floor 58.0 73.0 1.3 75 1.30 100% 75 1Rotary Valve - F-495 Fines Discharge I each I FM-4th Floor 58.0 73.0 1.3 75 1.30 100% 75 1Rotary Valve-#1I Dry Oxide Dust Col. Hop. I each I FM-4th Floor 58.0 73.0 1.3 75 1.30 100% 75 IRotary Valve - "A" Reductor Ko Pot Disch. I each I FM-4th Floor 58.0 73.0 1.3 75 1.30 100% 75 1Rotary Valve - UF4 Mill Feeder- N I each I FM-4th Floor 58.0 73.0 1.3 75 1.30 100% 75 1Rotary Valve - "B"Top H-LFlator I each I FM-4th Floor 58.0 73.0 1.3 75 1.30 100% 75 1Rotary Valve - "B-I" Red. Filter Fines Disch. I each I FM-4th Floor 58.0 73.0 1.3 75 1.30 100% 75 1Rotary Valve - #2 UF4 Crusher - S I each 1 FM-4th Floor 58.0 73.0 1.3 75 1.30 100% 75 1Conc. Feed Hopper Screw I each I FM-5th Floor 120.0 2,167.7 18.1 2,172 18.10 100% 2,172 18Wet Oxide Dust Collector Discharge Screw I each I FM-5th Floor 120.0 1,131.0 9.4 1,128 9.40 100% 1,128 9Trolley - B-4 & B-5 HF Filters I each I FM-5th Floor 77.1 54.0 0.7 54 0.70 100% 54, _ 1A" Reductor Filter Fines Hopper I each 1 FM-Sib Floor 58.0 120.0 2.0 116 2.00 100% 116 _2
rA-I Te. Cold Trap I each I FM-5th Floor 74.0 4,700.0 63.8 4,721 63.80 100% 4,721 64,\-2 Tcrt. Cold Trat I each I FM-5th Floor 74.0 4,700.0 63.J 4,721 63.801 100% 4,721 64A-1 Sec. Cold Trap"A" Reductor Heate#A4 HF Filter Heatc#A5 HF Filter HeatcA-2 Sec. Cold TrapB-I Sec. Cold TrapB-2 Sec. Cold Trap
eacheacheacheacheacheacheach
I Iour 74.0 4.700.0 63.1 4,721 63.801 100% 4,721 641,400.0 280.01 16,240 280.00 100% 16,240 280
440.0 1I. 441 11.601 100% 441 120.0 111. 441 11.60 100% 441 12
3.80 100% 64100%
I 100%
B-I Teri. Cold Trap each IB-2 Tert. Cold Trap lI each I f:Shower Water Heater I each I IA-3 Sec. Cold Trap I each I I I FM-5th FloorB-3 Sec. Cold Trap I each I FM-5th FloorSample Cold Trap 1 each I FM-5th Floor
B" Reductor Filter Fines Hopper" "1 B" each I 1 FM-5th Floor 2

MENERCON MTW Decommissioning Cost Estimate
Table A-13MISCELLANEOUS ITEM VOLUME ESTIMATEHoneywell - Metropolis Works (MTW) Metropolis, Illinois
PERCENT ESOLUTIONSBULK UNIT UNIT TOTAL TOTAL DIRECT DISPOSAL ESOLUTIONS
LOC NO. OF MAT'L OF DENSITY WEIGHT VOLUME WEIGHT VOLUME BURY WEIGHT DISPOSALDESCRIPTION CODE UNITS UNITS CONST. (lb/ft
3) (Ib) (ft') (pound) (ft
3) (vol %) (pound) VOLUME (fti)
Bot. HFlator Filter #1 B - Heater I each I FM-5th Floor 40.0 300.0 7.5 300 7.50 100% 300Bet. H'Flator Filter #2B - Heater I each I FM-5th Floor 40.0 300.0 7.5 300 7.50 100% 300"B" Red. Fines Hopper Disch. Pipinn Heater I each I FM-5th Floor 40.0 300.0 7.5 300 7.50 100% 300Top HiEFlator Filter #3B Heater I each I FM-5th Floor 40.0 300.0 7.5 300 7.50 100% 300Top HAEFlator Filter #4B Heater I each I FM-5th Floor 40.0 300.0 7.5 300 7.50 100% 300#I Dry Oxide Dust Collector I each I FM-5th Floor 58.0 6,930.0 1,386.0 80,380 1,386.00 100% 80,388 1,380Vessel Vacuum, Hop. & Controller Stand I each I FM-5th Floor 58.0 500.0 40.0 2.320 40.00 100% 2,320 4CA4 Bot. HF Filter I each I FM-5th Floor 119.0 1,381.8 11.6 1,380 11.60 100% 1,380 12
A5 Bot. HF Filter I each I FM-5th Floor 119.0 1,381.8 11.6 1,380 11.60 100% 1,380 12Chem Trap I each I FM-5th Floor 74.0 4,700.0 63.8 4,721 63.80 100% 4,721 64Chem Trap I each I FM-5th Floor 74.0 4,700.0 63.8 4,721 63.80 100% 4,721 64Chem Trap I each I FM-5th Floor 74.0 4,700.0 63.8 4,721 63.80 100% 4,721 64Chem Trap I each I FM-5th Floor 74.0 4,700.0 63.8 4,721 63.80 100% 4,721 64Inst. Air Filter I each I FM-5th Floor 74.0 4,700.0 63.8 4,721 63.80 100% 4,721 64B4 Bot. HF Filter I each I FM-5th Floor 116.0 1,535.2 13.3 1,543 13.30 100% 1,543 133B Top HF Filter I each I FM-5th Floor 116.0 1,535.2 13.3 1,543 13.30 100% 1,543 2136B Top HF Filter I each I FM-5th Floor 116.0 1,535.2 13.3 1,543 13.30 100% 1,543 135B Bottom HF Filter I each I FM-5th Floor 116.0 1,535.2 13.3 1,543 13.30 100% 1,543 13Welder - Idealarc I each I FM-5th Floor 42.0 391.0 9.3 389 9.25 100% 389 SWelder - Idealarc I each I FM-5th Floor 42.0 391.0 9.3 389, 9.25 100% 389Hot Box - Cold Trap E-446-IA Sec. I each I FM-5th Floor 58.0 199.0 34.2 1,984 34.20 100% 1,984 34Hot Box - Cold Trap E-413-2A Sec. I each I FM-5th Floor 58.0 199.0 34.2 1,984 34.20 100% 1,984 34Hot Box - Cold Trap E41I- 1A Tcrt. I each I FM-5th Floor 58.0 199.0 34.2 1,984 34.20 100% 1,984 34Hot Box I each I FM-5th Floor 58.0 199.0 34.2 1,984 34.20 100% 1,984 34Hot Box - Cold Trap - E-412-2A Teri. I each I FM-5th Floor 58.0 199.0 34.2 1,984 34.20 100% 1,984 34Hot Box - Cold Trap - E-447-lB Sec. I each I FM-5th Floor 58.0 199.01 34.2 1,984 34.20 100% 1,984, 34Hot Box - Cold Trap - E-448-2B Sec.Hot Box - Cold Tran - E-472-IB Tert.
I each I FM-5th Floor 58.( 199.C 34.2 1,9841 34.201 100% 1,984 34each I I I FM-5th Floor 1 58.0 199.0( 34.2 1,984 34.20 100% r 1,984 34
Hot Box - Cold Tr, each I FM-5th Floor 58.( 199.C 34.2 1.9841 34.201 100% 1,984 3458.( 199.C 34.2 1.9841 34.201 100% 1,984 34
199.0 34.2 1 [984 34.20 100% 1 1,984 34199.C 34.2 1.9841 34.201 100% 1.984 34
34.2 1.9841 34.2( 100% 1.984 340.51 100% 34 1
150ver"A" Redactor 78
Hoist & Trolley Over A4 & A5 HF Filter each I I40006 Hoist & Trolley Oven B3 HF Filter I each I1000# - Hoist - Rotary Va. Storage Area each I1000# Cap - Portable Hoist each I FM-5th Floor
1000# Cap - Portable Hoist I each I FM-5th Floor20,0008 Monorail - Over Cold Trap 2B Teri. i each I FM-5th Floor
20,000# Monorail - Over Cold Trap lB 31 each [ I FM-5th Floor

MENERCON MTW Decommissioning Cost Estimate
Table A-13MISCELLANEOUS ITEM VOLUME ESTIMATEHoneywell - Metropolis Works (MTW) Metropolis, Illinois
PERCENT ESOLUTIONSBULK UNIT UNIT TOTAL TOTAL DIRECT DISPOSAL ESOLUTIONS
LOC NO. OF MAT'L OF DENSITY WEIGHT VOLUME WEIGHT VOLUME BURY WEIGHT DISPOSAL
DESCRIPTION CODE UNITS UNITS CONST. (lb/ftt) (Ib) (ft
3) (pound) (ft
3) (vol %) (pound) VOLUME (ft
3)
20,000# Mono -Cold Trap 2B Sec. & IA Tert. I each I FM-5th Floor 106.0 3,125.0 29.4 3,116 29.40 100% 3,116 2920,000# Mono - Oven Cold Trap 2A & lB Sec. I each I FM-5th Floor 106.0 3,125.0 29.4 3,116 29.40 100% 3,116 2920,000# Mono -Cold Trap IA Sec. & 2A Teri. I each I FM-5th Floor 106.0 3,125.0 29.4 3,116 29.40 100% 3,116 29I 1,000# Monorail - Over lIF FilterA4 & A5 I each I FM-5th Floor 77.0 719.0 9.3 716 9.30 100% 716 97,000# Monorail - Over HF Filter B4 & B5 I each I FM-5th Floor 103.0 474.0 4.6 474 4.60 100% 474 55,000# Monorail - Over HF Filter B3 I each I FM-5th Floor 103.0 431.0 4.2 433 4.20 100% 433 4
1 Monorail - Over HF Filter I6 1 each I FM-5th Floor 103.0 259.0 2.5 258 2.50 100% 258 3OI,000#1 Monorail - Oven "A" Gs Area I each I FM-5th Floor 103.0 259.0 2.5 258 2.50 100% 258 3
1,000# Monorail - Over "A" Gs Area I each I FM-5th Floor 103.0 259.0 2.5 258 2.50 100% 258 3MO-419 Monorail - Over (C-418) Mill Feed Elevator I each I FM-5th Floor 78.0 311.0 4.0 312 4.00 100% 312 4
MO-420 1,000# Mono - Over Rotary Va. Stor. Area I each I FM-5th Floor 115.0 173.0 1.5 173, 1.50 100% 173 2
Vacuum Pump I each I FM-5th Floor 58.0 131.0 2.3 133 2.30 100% 133 2"A" Redactor Comb Air Blower I each I FM-5th Floor 58.0 120.0 12.0 696 12.00 100% 696 12Fluorine Compressor I each I FM-5th Floor 58.0 120.0 12.0 696 12.00 100% 696 12
Exhaust Fan - South Wail - HF Area I each I FM-Si Floor 58.0 230.0 32.0 1,856 32.00 100% 1,856 32Exhaust Fan - West Wall - HF Area I each I FM-5th Floor 58.0 230.0 32.0 1,856 32.00 100% 1,856 32;Emergency Exh. Fan I each I FM-5th Floor 58.0 320.0 64.0 3,712 64.00 100% 3,712 64
Women's Shower Exhaust Fan I each I FM-5th Floor 58.0 15.0. 1.0 58 1.00 100% 58 1Man Cooling Fan I each 1 FM-5th Floor 58.0 230.01 32.0. 1,856, 32.00, 100% 1,856, 32"B" HF Primary Jet Scrubber - West 1 ah 1 FM-5th Floor 58. 27. 3.1 174 122; 100 17 3
"B" HF Secondary Jet Scrubber - East I cach I FM-5th Floor 58.0 174.0 3.0 174 3.00 100% 174 3"B" Reductor Air Cire. Fan I each I FM-5th Floor 1 58.0 1,470.0 294.01 17,052 294.00 100% 17,052 294Exhaust Fan each I FM-5th Floor 58.01 230.0 32.1 1,8561 32.001 100% 1,856 32Water Cooler 1 each iR-402 "A" Reductor - Surface Comb. 1 each 1
orDr
1 13.8 83.0 6.01 83 6.00 0% [ 01 5
1 58.0 10,900.0 286.31 16,605 286.30 100% 16,6051 286R-600 "B" Reductor each I FM-5th Floor 58.01 10,900.0 286.3 16,6051 286.301 100% 16,605 286
each I FM-5th Floor 58.01 155.0 1571 2.701 100% 157 3
I each 1 FM-5th Floor 60.0 150.0 2.51 150 2.501 100% [ 1501 3each I FM-5th Floor 58.0 27.0 1571 2.701 100% 157 3
each I FM-5th Floor 58.0 27.0 1571 2.701 100% 157 3
FM-5th Floor 58.0 27.0 2.71 157 2.70 100% 1 157 3FM-5th Floor 58.01 3,500.0 350.01 20,3001 350.001 100% 20,300 350
h Floor 58.01 1.440.0 144.C 8,3521 144.001 100% 8,352 144
loor 58.01 2.500.0 63.1 3,6541 63.001 100% 3,654 63
"A" Reductor Filter I OO or 58.01 0.0 3.31 ___ 1911 3.301 100% _____ 191 ____ 3#2 Cone. Hopper (East) - Cont. Boiler or 58.01 2.500.0 63.C 3.6541 63.001 100% 3,654 63
HF Filter Bump Tank 58.01 1.083.4 22.3 1.2931 22.301 100% 1,293 22
U F6 SurecTank 58.0 6,583.0 176.71 10,249 176.70 100% 10,249 177UF6 SurgcTank"1B" Reductor Filter Fines Hopper 58.01 615.0 10.6 6151 10.601 100% 615 I1
#3 Cone. Hopper - West 1 0.0 63.C 3,6541 63.001 100% 3,654 63
Vibrator - #1 Wet Oxide Dust Coil. Hop. (E) 1
Vibrator - #1 Wet Oxide Dust Coil. Hop. (W) each 10.1 2 0.10 100% 2__ _ _ _ _ _ _
0.11_____ 121 0.10 100% 1 H____ 12 __ __ _0.1 11 010 100% L 121___ 0___
Vibrator - #2 Wet Oxide Dust Coll. Hop. (E) each 1

MENERCON MTW Decommissioning Cost Estimate
Table A-13MISCELLANEOUS ITEM VOLUME ESTIMATEHoneywell - Metropolis Works (MTW) Metropolis, Illinois
PERCENT ESOLUTIONSBULK UNIT UNIT TOTAL TOTAL DIRECT DISPOSAL ESOLUTIONS
LOC NO. OF MAT'L OF DENSITY WEIGHT VOLUME WEIGHT VOLUME BURY WEIGHT DISPOSALDESCRIPTION CODE UNITS UNITS CONST. (lb/ft
t) (Ib) (ft
3) (pound) (It') (vol %) (pound) VOLUME (ft')
Vibrator - #2 Wet Oxide Dust Coil. Hop. (W) I each I FM-5th Floor 123.0 9.0 0.1 12 0.10 100% 12 0Vibrator - HF Filter "AI" (F-406) Disch. Line I each I FM-5th Floor 123.0 9.0 0.1 12 0.10 100% 12 0Vibrator - HF Filter "A2" (F-407) Disch. Line I each I FM-5th Floor 123.0 9.0 0.1 12 0.10 100% 12 0Vibrator- lIF Filter "AY' (F-419) Disch. Line I each I FM-5th Floor 123.0 9.0 0.1 12 0.10 100% 12 0Vibrator- HF Filter "A6" (F-443) Disch Line I each I FM-5th Floor 123.0 9.0 0.1 12 0.10 100% 12 0Vib.- "A" UF4 Prim. Dust Call. (F-426) Hop. I each I FM-5th Floor 123.0 9.0 0.1 12 0.10 100% 12 0Vibrator - A2 Prim Flation Filter (F-432) I each I FM-5th Floor 123.0 9.0 0.1 12 0.10 100% 12 0Vibrator - Al Prim Flation Filter (F-433) I each I FM-5th Floor 123.0 9.0 0.1 12 0.10 100% 12 0Vibrator - B2 Prim Flation Filter (F-408) I each I FM-5th Floor 123.0 9.0 0.1 12 0.10 100% 12 0Vibrator - BI Prim Flation Filter (F-409) I each I FM-5th Floor 123.0 9.0 0.1 12 0.10 100% 12 0Vibrator- Span Decay Hopper Disch. Line I each I FM-5th Floor 123.0 9.0 0.1 12 0.10 100% 12 0Vib. - "A" Filter Fines Hopper Disch. Line I each I FM-5th Floor 123.0 9.0 0.1 12 0.10 100% 12 0Vibrator - "A" Reductor Feeder I each I FM-5th Floor 123.0 9.0 0.1 12 0.10 100% 12 0Vibrator - UF4 Prim Dust Coil. (F-61 1) I each I FM-5th Floor 123.0 9.0 0.1 12 0.10 100% 12 0Vibrator - "A" Reduction Feed Hopper I each I FM-5th Floor 123.0 9.0 0.1 12 0.10 100% 12 0Vibrator - "BI" HF Filter (F-608) Disch. Line I each I FM-5th Floor 123.0 9.0 0.1 12 0.10 100% 12 0Vibrator - "B2" HF Filter (F-609) Disch. Line I each I FM-Sh Floor 123.0 9.0 0.1 12 0.10 100% 12 0Vibrator - "B" Red. Feed Hopper (U-606) I each I FM-5th Floor 123.0 9.0 0.1 12 0.10 100% 12 0Vib!1or- "B" Red. Feeder (R-600) I each I FM-5tLh Floor 123.0 9.0 0.1 12 0.10 100% 12 0Vihrator- "B" Red. Prim Filter I each 1 FM-5it Floor 123.0 9.0 0.1 12 0.10 100% 12 0Vibrator- "C2" Fiator Prim Filter Shell I each I FM-5th Floor 123.0 9.0 0.1 12 0.10 100% 12
Vibrator - "C" Fiaton Prim Filter Shell I each I FM-5th Floor 123.0 9.0 0.1 12 0.10 100% 12 0
Rotary Va. - "A" Red uctor Feeder (R-402) I each I FM-5th Floor 58.0 68.0 1.2 70 1.20 100% 70 TRotary Va. - "A" Prim. UF4 Dust Coll. Disch. I each I FM-5th Floor 58.0 68.0 1.2 70 1.20 100% 70Rotary Va. - Ash Dust Coll. Disch. (F-422) I each I FM-5th Floor 58.0 68.0 1.2 70 1.20 100% 70Rotary Va. - Spar Decay Hopper Disch. I each I FM-5th Floor 58.0 68.0 1.2 70 1.20 100% 70Rotary Va. - #2 Dry Oxide Dust Coll. Disch. I each I FM-Sth Floor 58.0 68.0 1.2 70 1.20 100% 70 1Rotary Va. - #1 Wet Oxide Dust Coll. Disch. I each I FM-5th Floor 58.0 68.0 1.2 70 1.20 100% 70 TRotary Va. - #2 Wet Oxide Dust Coll. Disch. I each I FM-5th Floor 58.0 68.0 1.2 70 1.20 100% 70 1Rotary Va. - #1 Wet Disch. I each I FM-5th Floor 58.0 68.0 1.2 70 1.20 100% 70 1Rotary Va. - "B" Reductor Feeder I each I FM-5th Floor 58.0 0.0 1.3 75 1.30 100% 75 1Rotary Va. - "B" UF4 Prim. Dust Coll. Disch. I each I FM-5th Floor 58.0 68.0 1.2 70 1.20 100% 70 1Rotary Va. - "Cone. Surge Hopper Feeder I each I FM-5th Floor 58.0 68.0 1.2 70 1.20 100% 70"A" Reductor Hopper Feed Conveyer I each 1 FM-6th Floor 120.0 795.0 6.6 792 6.60 100% 792 7Spar Decay Hopper Feed Screw I each 1 FM-6th Floor 120.0 900.0 7.5 900 7.50 100% 900 8"BI" Reductor Hopper Feed Screw I each I FM-6th Floor 120.0 1,378.4 11.5 1.380 11.501 100% 1,3801 1.B" UF4 Elevator Disch. Screw each I FM-6th Floor 1 120.01 3,127.8 26.1 3J132 26.101 100% 3,132 26
3rcw FM-6th Floor 1 120.01 1,007.3 8.4 1,008 8.401 100% 1 1,008rew FM-6th Floor 136.01 600.01 4.41 5981 4.401 100% 1 598 4
FM-6th Floor 75.0 54.0 0.7 53 0.701 100% 53loor 75.0 54.0 0.7 531 0.70 100% __ N_53
loor 75.0 54.0 0.71 531 0.70 100% 1 315[oor 1 58.01 96,787.51 1,668.81 96,7901 1,668.80 100% 1 96,790 1,669CR-4 I
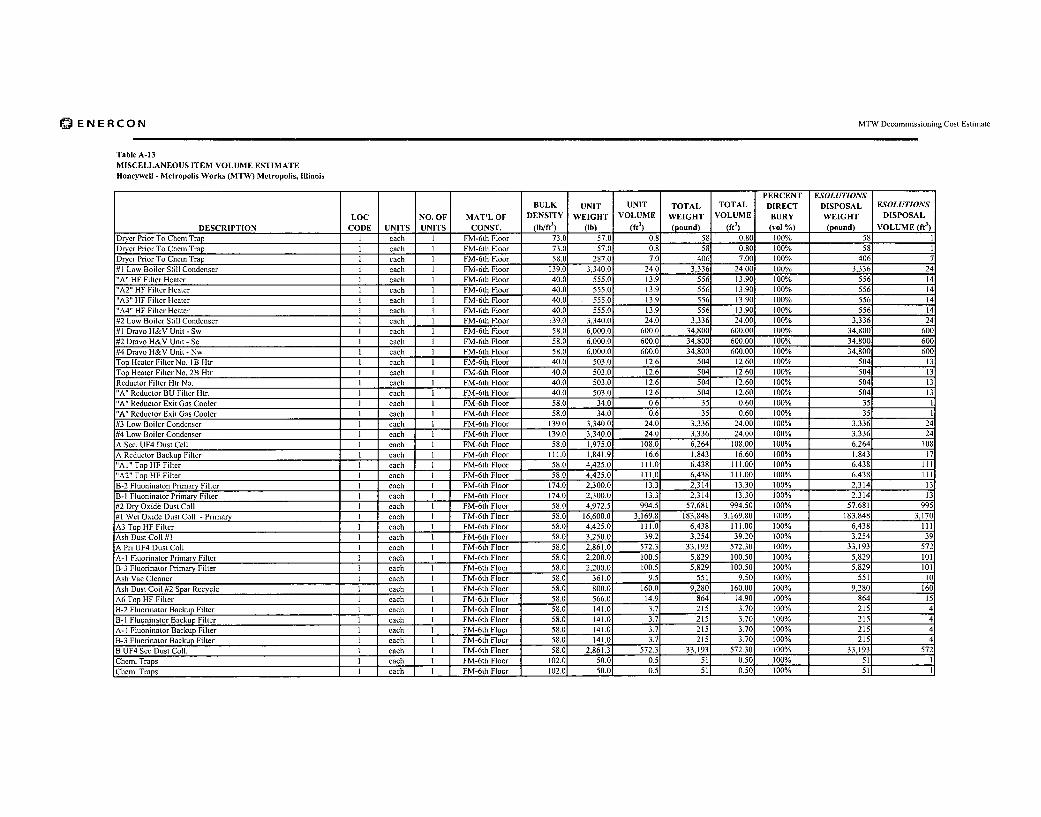
MENERCON MTW Decommissioning Cost Estimate
Table A-13MISCELLANEOUS ITEM VOLUME ESTIMATEHoneywell - Metropolis Works (MTXV) Metropolis, Illinois
PERCENT ESOLUTIONSBULK UNIT UNIT TOTAL TOTAL DIRECT DISPOSAL ESOLUTIONS
LOC NO. OF MAT'L OF DENSITY WEIGHT VOLUME WEIGHT VOLUME BURY WEIGHT DISPOSAL
DESCRIPTION CODE UNITS UNITS CONST. (lb/ft5
) (Ib) (ft5) (pound) (ft
5) (vol %) (pound) VOLUME (1t
3)
Dryer Prior To Chem Trap I each I FM-6th Floor 73.0 57.0 0.8 58 0.80 100% 58 1Dryer Prior To Chem Trap I each I FM-6th Floor 73.0 57.0 0.8 58 0.80 100% 58 1Dryer Prior To Chem Trap I each I FM-6th Floor 58.0 287.0 7.0 406 7.00 100% 406 7#1 Low Boiler Still Condenser I each I FM-6th Floor 139.0 3,340.0 24.0 3,336 24.00 100% 3,336 24'A" HF Filter Heater I each I FM-6th Floor 40.0 555.0 13.9 556 13.90 100% 556 14"A2" HF Filter Heater I each I FM-6th Floor 40.0 555.0 13.9 556 13.90 100% 556 14"AY' HF Filter Heater I each I FM-6th Floor 40.0 555.01 13.9 556 13.90 100% 556 14"A4" RF Filter Heater I each I FM-6th Floor 40.0 555.0 13.9 556 13.90 100% 556 14#2 Low Boiler Still Condenser I each I FM-6th Floor 139.0 3,340.0 24.0 3,336 24.00 100% 3,336 24#4 Dravo H&V Unit - Sw I each I FM-6th Floor 58.0 6,000.0 600.0 34,800 600.00 100% 34,800 602#2 Dravo H&V Unit - Se I each 1 FM-6th Floor 58.0 6,000.0 600.0 34,800 600.00 100% 34,800 608#4 Dravo H&V Unit - Nw I each I FM-6th Floor 58.0 6,000.9 600.0 34,800 600.00 100% 34,800 607Top Heater Filter No. 1B Htr I each I FM-6th Floor 40.0 503..0 12.6 504 12.60 100% 504 13Top Heater Filter No. 2B Htr I each I FM-6th Floor 40.0 503..0 12.6 504 12.60 100% 504 13Reductor Filtor Htr No. I each I FM-6th Floor 40.0 503.00 12.6 504 12.60 100% 504 13"A" Rcductor BU Filter Htr. I each I FM-6lh Floor 40.0 503.00 12.6 504 12.60 100% 504 13"A" Reductor Exit Gas Cooler I each I FM-6th Floor 58.0 34.03 0.6 35 0.60 100% 351
"A" Reductor Exit Gas Cooler I each I FM-6th Floor 58.0. 34.0 0.6 35 0.60 100% 357 9#3 Low Boiler Condenser I each I FM-6th Floor 139.0 3,340.0 24.0 3,336, 24.00 100% 3,336 21#4 Low Boiler Condenser I each I FM-6th Floor 139.0 3,340.0 24.0 3,336 24.00 100% 3,336 24" Sec. UF4 Dust Cell I each I FM-6th Floor 58.0 1,975.0 108.0 6,264 108.00 100% 6,264 108" Reductor Backup Filter I each I FM-6th Floor I 11.0 1,841.9 16.6 1,843 16.60 100% 1,843 17•"A 1" Top HF Filter I each I FM-6th Floor 58.0 4,425.0 111.0 6,438 111.00 100% 6,438 111"AT' Top HF Filter I each I FM-6th Floor 58.0: 4,425.0 I 11.0 6,438 111.00 100% 6,438 illB-2 Fluoninaton Primary Filter I each I FM-6th Floor 174.0 2,300.0 13.3 2,314 13.30 100% 2,314 1313-1 Fluoninator Primary Filter I each I FM-6th Floor 174. 2 ,220O300. 13.3 2,314 13.30 100% 2,314 13N2 Dry Oxide Dust Coll 1 ach l FM-6th Floo 58.1 4,972. 994.5 57,681, 994.50 100% 57,681 995#I Wet Oxide Dust Coll. - Primary 1 eah 1 FM-6th Floor 1 58.01 16,600-01 3,169.81 183,8481 3,169.801 100% 1 183.8481 3,170:
A3 Too HF Filter each I FM-6th Floor 58.01 4,425.0 111.0 6,4381 111.001 100% 6,438 illeach I FM-6th Floor 58.01 3,250.0 39.2 3,2541 39.201 100% 3,254
hh 1 FM-6th Floor 58.0 2,861.0 572.3 33,193 572.30 100% 33,193 572FM-6th Floor 58.01 2.200.0 100.5 5.8291 100.501 100% 5,829 101
h Floor 58.01 2.200.0 100.5 5.8291 100.501 100% 1 5,829 10158.01 361.0 9.5 5511 9.501 100% 1 551
Ash Dust Coil #2 Spar Recycle 160.0 92801 160.001 100% 9.280 16(
A6 Top HF Filter 14.9 8641 14.901 100% 864
B-2 Fluorinator Backup Filter each 1 215 3.701 100% 215 4
B-I Fluoninator Backup Filter 1 each 1 FM-(A-I Fluoninator Backup Filter 1 each I FM-(B-3 Fluorinator Backup Filter I each I FM-(
211 3.701 100% __ __ 215 _ _ 4215 3.701 100% 215 4
3.701 100% 215
B UF4 Sec Dust Coll. each 1 FM-6th FlooChem. Traps each I FM-6th FloorChem. Traps each I FM-6th Floor 102.(

IENERCON MTW Decommissioning Cost Estimate
Table A-I3MISCELLANEOUS ITEM VOLUME ESTIMATEHoneywell - Metropolis Works (MTW) Metropolis, Illinois
PERCENT ESOLUTIONSBULK UNIT UNIT TOTAL TOTAL DIRECT DISPOSAL ESOLUTIONS
LOC NO. OF MAT'L OF DENSITY WEIGHT VOLUME WEIGHT VOLUME BURY WEIGHT DISPOSALDESCRIPTION CODE UNITS UNITS CONST. (lb/ft
3) (lb) (ft
t) (pound) (ft') (vol %) (pound) VOLUME (ft
3)
Chem. Traps I each I FM-6th Floor 102.0 50.0 0.5 51 0.50 100% 51Chem. Traps I each I FM-6th Floor 102.0 50.0 0.5 51 0.50 100% 51Chem. Traps I each I FM-6th Floor 102.0 50.0 0.5 51 0.50 100% 51Chem. Traps I each I FM-6th Floor 102.0 50.0 0.5 51 0.50 100% 51Chem. Traps I each I FM-6th Floor 102.0 50.0 0.5 51 0.50 100% 51Chem. Traps I each I FM-6th Floor 102.0 50.0 0.5 51 0.50 100% 51Blow Back Air Filter On F-446 I each I FM-6th Floor 127.0 25.0 0.2 25 0.20 100% 25 0C-1 Fluoninator Primary Filter - West I each I FM-6th Floor 58.0 3,170.0 56.5 3,277 56.50 100% 3,277 57C-2 Fluoninaton Primary Filter - Center I each I FM-6th Floor 58.0 3,170.0 56.5 3,277 56.50 100% 3,277 57C-3 Fluorinator Primary Filter - East I each I FM-6th Floor 58.0 3,170.0 56.5 3,277 56.50 100% 3,277 57C- I Fluorinator Backup Filter - West I each I FM-6th Floor 58.0 1,492.0 29.5 1,711 29.50 100% 1,711 30C-2 Fluoninaton Backup Filter - Center I each I FM-6th Floor 58.0 1,492.0 29.5 1,711 29.50 100% 1,711, 30C-3 Fluoninator Backup Filter - East e each I FM-6th Floor 58.0 1,492.0 29.5 1,711 29.50 100% 1,711 30"B" Reductor Fri Filter I each I FM-6th Floor 111.0 1,841.9 16.6 1,843 16.60 100% 1,843 17"B" Reductor Backup Filter I each I FM-6th Floor 116.0 1,535.2 13.3 1,543 13.30 100% 1,543 13lB Top Hflator Filter I each I FM-6th Floor 116.0 1,535.2 13.3 1,543 13.30 100% 1,543 132B Top Hflator Filter I each I FM-6th Floor 116.0 1,535.2 13.3 1,543 13.30 100% 1,543 13B UF4 Pri. Dust Coil. I each I FM-6th Floor 58.0 2,200.0 350.0 20,300 350.00 100% 20,300 350IA Reductor Fri. Filter I each I FM-6th Floor 111.0 1,841.9 16.6 1,843 16.60 100% 1,843 17A-2 Fluoninator Primary Filter - West I each I FM-6th Floor 58.0 1,492.0 29.5 1,711 29.50 100% 1,711 30A-3 Fluoninaton Primary Filter - Center I each I FM-6th Floor 58.0 1,492.0 29.5 1,711 29.50 100% 1,711 30A-2 Fluoninator Backup Filter - West I each I FM-6th Floor 58.0 1,492.0 29.5 1,711 29.50 100% 1,711 30A-3 Fluoninator Backup Filter - Center I each I FM-6th Floor 58.0 1,492.0 29.5 1,711 29.50 100% 1,711 30Welder I each I FM-6th Floor 42.0 391.0 9.3 389 9.25 100% 389 9Hoist - 500# Cap. - Portable I each I FM-6th Floor 58.0 56.0 0.6 34 0.58 100% 34 1Hoist-"A" Reductor BU. Filter I each I FM-6th Floor 98.0 80.0 0.8 78 0.80 100% 78Hoist - B-I Filter I each I FM-6th Floor 98.0 80.0 0.8 78 0.80 100% 78Hoist - B-2 Filter I each I FM-6th Floor 98.0 80.0 0.8 78 0.80 100% 78 1Hoist - F-496 & F-497 Fluorinator Filter I each I FM-6th Floor 98.0 80.0 0.8 78 0.80 100% 78 1Hoist - F-493 & F-494 Fluorinator Filter I each I FM-6th Floor 98.0 80.0 0.8 78 0.80 100% 78 FHoist - AB HF Filter I each I FM-6th Floor 98.0 80.0 0.8 78 0.80 100% 78Hoist - Al & A2 HF Filter I each I FM-6th Floor 98.0 80.0 0.8 78 0.80 100% 78Hoist - "B" Reductor BU Filter I each I FM-6th Floor 98.0 80.0 0.8 78 0.80 100% 78Hoist - A2 Fri & BU Flation Filter I each I FM-6th Floor 98.0 80.0 0.8 78 0.80 100% 78 1Hoist - B I BU Flation Filter & A6 HF Filter I each I FM-6th Floor 98.0 80.0 0.8 78 0.80 100% 78 1Hoist - Ash Dust Coll. I each I FM-6th Floor 98.0 80.0 0.8 78 0.80 100% 78 1Hoist - Al & B2 BU & B2 Pnim-Flation Filters I each I FM-6th Floor 98.0 80.0 0.8 78 0.80 100% 78 1Hoist - Al & B2 BU & B2 Pnim-Flation Filters I each I FM-6th Floor 98.0 80.0 0.8 78 0.80 100% 78 1Hoist - "B" Red. Prim. Filters I each I FM-6th Floor 98.0 80.0 0.8 78 0.80 100% 78 1Hoist - "C" Flator Prim. Filters I each I FM-6th Floor 98.0 80.0 0.8 78 0.80 100% 78 IHoist - "C" Flator BU Filters I each I FM-61h Floor 98.0 80.0 0.8 78 0.80 100% 78 13000# Monorail I each I FM-6th Floor 153.0 238.0 1.6 245_ 1.60 100% 2451 22000# Monorail - "C" Flaton Pri Filters I each I FM-6th Floor 145.0 647.0 4.5 653 4.50 100% 6531 5

MENERCON MTW Decommissioning Cost Estimate
Table A-13MISCELLANEOUS ITEM VOLUME ESTIMATEHoneywell - Metropolis Works (MTW) Metropolis, Illinois
PERCENT ESOLUTIONSBULK UNIT UNIT TOTAL TOTAL DIRECT DISPOSAL ESOLUTIONS
LOC NO. OF MAT'L OF DENSITY WEIGHT VOLUME WEIGHT VOLUME BURY WEIGHT DISPOSAL
DESCRIPTION CODE UNITS UNITS CONST. (lb/ftt) (lb) (ft ) (pound) (ft3) (vol %) (pound) VOLUME (ft')
2000# Monorail - "C" Flator Sec. Filter I each I FM-6th Floor 145.0 518.0 3.6 522 3.60 100% 522 46000# Monorail - AI & B2 BU & B2 Fri Flation Fil. I each I FM-6th Floor 124.0 518.0 4.2 521 4.20 100% 521 44000# Monorail - B I BU FRation & A6 HF Flit. I each I FM-6th Floor 145.0 474.0 3.3 479 3.30 100% 479 33500# Monorail-Al BU, B I Fri. & B2 BU Fiation I each I FM-6th Floor 124.0 460.0 3.7 _ 459 3.70 100% 459.0009 Monorail - A2 Fri & A2 BU Flstion Fil. I each I FM-6th Floor 124.0 345.0 2.8 347 2.80 100% 347 3
1500# Monorail - #2 Wet Oxide Dust Coll. I each I FM-6th Floor 145.0 345.0 2.4 348 2.40 100% 3483000# Monorail -A I HF Filter I each I FM-6th Floor 124.0 863.0 7.1 868 7.00 100% 868 74000# Monorail - AI & A2 HF Filter I each I FM-6th Floor 124.0 575.0 4.6 570 4.60 100% 570 54000# Monorail - "A" UF4 Sec. Dust Col l I each I FM-6th Floor 124.0 575.0 4.2 570 4.60 100% 5704500# Monorail - "A" RCd.sBU Filter I each I FM-6th Floor 145.0 259.0 1.8 261 1.80 100% 2616000# Monorail - "B" RIductor BU Filter I each I FM-6th Floor 153.0 214.0 1.4 214 1.40 100% 214 11900# Monorail - "B" Redactor BU Filter I each I FM-6th Floor 145.0 323.0 2.2 319 2.20 100% 319 41700# Monorail - B2 HF Firlter I each I FM-6th Floor 145.0 323.0 2.2 319 2.20 100% 3195500# Monorail - B FI HF Filter I each I FM-6th Floor 145.0 323.0 2.2 319 2.20 100% 319 43000# Monorail - #I Low Boiler Condenser I each I FM-6th Floor 145.0 302.0 2.5 305 2.10 100% 305 23000# Monorail - #2 Low Boiler Condenser I each I FM-6th Floor 145.0 302.0 2.1 305 2.10 100% 30503000# Monorail - #3 Low Boiler Condenser I each I FM-6th Floor 145.0 302.0 2.1 305 2.10 100% 305 23000# Monorail - #4 Low Boiler Condenser I each I FM-6th Floor 145.0 302.0 2.1 305 2.10 100% 305 22000# Monorail - Ash Dust Coll. Blower I each I FM-6th Floor 1450.0 90.0_ 1.2 174 1.20 100% 174 12000# Monorail - Ash Dust Coll. Blower Motor I each I FM-6th Floor 145.01 173.0 1.2 174, 1.20 100% 1741
10000# Monorail I each I FM-6th Floor 127.0 438.0 3.4 432 3.40 100% 432310000# Monorail I each I FM-6th Floor 127.0 525.1] 4.1 521 4.10 100% 521 4Monorail - F-496 & F-497 Fluorinator Filter I each I FM-6th Floor 145.01 518.10 3.6 522 3.60 100% 522 4Monorail - F-493 & F-494 Fluorinator Filter I each I FM-6th Floor 145.0 518.0 3.6 522 3.60 100% 5224:Silencer - Ash Vac Cl. Exhst. I each I FM-6th Floor 76.0: 417.0 5.5 418 5.50 100% 418,6"A" UF4 D.C. Exhauster I each I FM-6th Floor 58.0 375.0 75.0 4,350 75.0-0 100% 4,350 75Wet Oxide Dust Coll. Blower I each I FM-6th Floor 58.01 330.0 65.9 3,822 65.90 100% 3,822 66U74 BU D.C. Blower 1 acL1F-;6th Flor 58.0, 300.01 62. 3,4801 6.02 100% 3,480 601"A" Rcducton Exit Cooling Blower 1 ach I FM_6th Floor 1 58.0 90.01 18. 1,44 1.0 1 1,044 18
Ash Vac. Cl. Exhausten each FM-6th Floor 58.01 400.01 80.01 4,640 80.001 100% 4,640Dry Oxide F ach FM-6th Floor 58.01 688.0 137.5 7,975 137.501 100% 7,975 138"A" HF Pri. FM-6th Floor 58.01 91.01 1.61 931 1.601 100% 93Ash D.C. E, FM-6th Floor 58.01 120.0 24.0 1,392 24.001 100% 1,392"A" HF Sem. Jet ScruDravo H&V Unit #1Dravo H&V Unit #2
I-6th Floor 58.01 91.( 1.61 931 1.601 100% 9358.0 200.0] 198.0 11,484 198.00 100% 11,484 19858.01 200.0 198.0 11.484 198.001 100% 11.484 198
I Unit #4 each 200.C 198.C 11,484 198.00 100% 11.484 198
__ __ __ __ __ __ __ each IT__________________ 1 each 1 I
11,4841 198.001 100% 1 11,4841 19811.484 198.00 100% 11.484 19m
each 1 1.484 198.00 19W.lower Nxe eneh I 195.0'
each I IRoof Exhaust Blower Hoist Well each 1 198.00 .Trane Vent Unit No 317-1 1 each I FM-4 95.10
,

OENERCON MTW Decommissioning Cost Estimate
Table A-13MISCELLANEOUS ITEM VOLUME ESTIMATEHoneywell - Metropolis Works (MTW) Metropolis, Illinois
PERCENT FSOLUTIONS
BULK UNIT UNIT TOTAL TOTAL DIRECT DISPOSAL ESOLUTIONS
LOC NO. OF MAT'L OF DENSITY WEIGHT VOLUME WEIGHT VOLUME BURY WEIGHT DISPOSAL
DESCRIPTION CODE UNITS UNITS CONST. (Ib/ft3) (Ib) (ft') (pound) (ft') (vol %) (pound) VOLUME (ft1)Tnane Vent Unit No 222-1 1 each I FM-6th Floor 58.0 800.0 160.0 9,280 160.00 100% 9,280 160Exhaust Fan - Sxw I each I FM-6th Floor 58.0 230.0 32.0 1,856 32.00 100% 1,856 32Exhaust Fan - Wxs I each I FM-6th Floor 58.0 230.0 32.0 1,856 32.00 100% 1,856 32Exhaust Fan - Wxn I each I FM-6th Floor 58.0 230.0 32.0 1,856 32.00 100% 1,856 32Fan - Man Cooler I each I FM-6th Floor 58.0 100.0 1.9 110 1.90 100% 110 2Vent Fan I each I FM-6th Floor 58.0 100.0 1.9 110 1.90 100% 110 2"B" Reductor Exit Gas Cooler Blower I each I FM-6th Floor 40.0 300.0 7.5 300 7.50 100% 300 8Drinking Water Cooler I each I FM-6th Floor 13.8 83.0 6.0 83.0 6.00 0% 0 0Scrubber, A Green Salt Dust Collector I each I FM-6th Floor 58.0 498.0 13.1 760 13.10 100% 760 13Scrubber, B Green Salt Dust Collector I each I FM-6th Floor 58.0 498.0 13.1 760 13.10 100% 760 13SW-22 Switchboard - See Dwg MTW-A0029 I each I FM-6th Floor 40.0 660.0 16.5 660 16.50 100% 660 17
SW-23 Switchboard - See Dwg MTW-A0030 I each I FM-6th Floor 40.0 660.0 15.0 600 15.00 100% 600 15UF4 Hopper I each I FM-6th Floor 58.0 9,625.0 1,925.0 111,650 1,925.00 100% 111,650 1,925Spar Decay Hopper I each I FM-6th Floor 58.0 21,321.6 4,264.3 247,329 4,264.30 100% 247,329 4,264Air Blow Back Surge Tank I each I FM-6th Floor 58.0 338.0 8.4 487 8.40 100% 487 8"A" Reductor Feed Hopper I each I FM-6th Floor 58.0 2,650.0 250.0 14,500 250.00 100% 14,500 250"B" Reductor Feed Hopper I each I FM-6th Floor 58.0 2,650.0 250.0 14,500 250.00 100% 14,500 250Vibrtr-On No2 Dry Ox Dust Coil Hppr(F412) I each I FM-6th Floor 123.0 9.0 0.1 12 0.10 100% 12 0Vibrator - On"A"Sec UF4 Dust Coil I each I FM-6th Floor 123.0 9.0 0.1 12 0.10 100% 12 0Vibrator - On"B"Sec UF4 Dust Coll(F450) I each I FM-6th Floor 123.0 9.0 0.1 12 0.10 100% 12 0Vibrator - On"A" Red Exit Gas Cooler(E625) I each I FM-6th Floor 123.0 9.0 0.1 12 0.10 100% 12 0Vibrator - On"B"Red Exit Gas Cooler(E632) I each I FM-6th Floor 123.0 9.0 0.1 12 0.10 100% 12 0Vibrator - On (F-450) I each I FM-6th Floor 123.0 9.0 0.1 12 0.10 100% 12 0Rotary Valve-"A"UF4 Sec D.C. Disch I each I FM-6th Floor 58.0 68.0 1.2 70 1.20 100% 70 1Rotary Valve-"B" UF4 Sec D.C. Disch I each I FM-6th Floor 58.0 68.0 1.2 70 1.20 100% 70 1
Contaminated Debris at Sampling Plant Railroad Tracks 4 fte 88 Debris 40.0 40.0 1.0 3,520 88.00 100% 3,520 88BM/FF building LLRW Trash in drums 2 drum 2,250 DAW 40.0 300.0 7.5 675,000, 16,875.00 100% 675,000 16,875Material on Waste Pad / Other 3 drum 8 DAW 40.0 300.0 7.5 2,4001 60.00 100% 2,400 60
BM/FF building LLRW Trash in B-25 Boxes 2 B-25 box 128 DAW 40.0 3,552.0 88.8 454,656 11,366.40 100% 454,656 11,366BM/FF building LLRW Trash in Blue Boxes 2 blue box 25 DAW 40.0 2,180.0 54.5 54,500 1,362.50 100% 54,500 1,363
Scrap Metal on Metals Pad 3 ft3
96,602 Metals 100.0 100.0 1.0 9,660,200 96,602.00 0% 0 0
New Scrap Metal on Metals Pad 3 ftR 1,458 Metals 100.0 100.0 1.0 145,800 1,458.00 0% 0 0
16"x16"x8" cubes for disposal on Metals Pad 3 fW3 432 Metals 100.0 100.0 1.0 43,200 432.00 0% 0 0Imhoff Sludge in Crusher Building 2 drum 217 sludge 90.0 675.0 7.5 146,475 1,627.50 100% 146,475 1,628Outfall Material in Crasher Building 2 drum 15 sludge 90.0 675.0 7.5 10,125 112.50 100% 10.125 113
Equipment Sodium Removal/Ion Exchange Bldg I f12 3,808 Metals 62.2 407,471 6,546.00 90% 366,724 5,892
Equipment Sodium Removal/lon Exchange Bldg I ft2
2,520 Metals 62.2 269,650 4,332.00 90% 242,685 3,899
Equipment KOH Muds Building I fl2 2,394 Metals 62.2 256,167 4,116.00 90% 230,551 3,704
Equipment Uranium Recovery Building I fR2 4,560 Metals 62.2 487,938 7,839.00 90% 439,144 7,055
Equipment Uranium Recovery Building I ft2
1,100 Metals 62.2 117,704 1,891.00 90% 105,934 1,702

ENERCON MTW Decommissioning Cost Estimate
Table A-13MISCELLANEOUS ITEM VOLUME ESTIMATEHoneywell - Metropolis Works (MTW) Metropolis, Illinois
PERCENT ESOLUTIONSBULK UNIT UNIT TOTAL TOTAL DIRECT DISPOSAL FSOLUTIONS
LOC NO. OF MAT'L OF DENSITY WEIGHT VOLUME WEIGHT VOLUME BURY WEIGHT DISPOSAL
DESCRIPTION CODE UNITS UNITS CONST. (lb/ft3) (lb) (ft') (pound) (ft
3) (vol %) (pound) VOLUME (ft')
Equipment FM Building Southeast pad 1 ft2
3,888 Metals 62.2 416,031 6,684.00 90% 374,428 6,016
Equipment FM Building Southwest pad I ft2
3,564 Metals 62.2 381,362 6,127.00 90% 343,226 5,514
Equipment Sample Plant 1 ft2 4,488 Metals 62.2 480,234 7,715.00 50% 240,117 3,858
Equipment Pond Muds Filter Calciner Bldg 2 ftt 1,125 Metals 62.2 120,379 1,934.00 95% 114,360 1,837
Equipment Cylinder wash Building 2 ft- 504 Metals 62.2 26,965 866.00 0% 0 0
Equipment Drum crusher Building 2 ft2
5,340 Metals 62.2 57,140 9,180.00 0% 0 0
FM Building Demolition Debris 1 ft 109,043 Debris 33.3 5,670,249 170,371.00 100% 5,670,249 170,371
FM Building Demolition Concrete Rubble I ft3
6,048 concrete rubble 75.0 725,760 9,677.00 0% 0 0
Na Removal Building Demolition Debris 1 ft3
13,796 Debris 34.8 717,392 20,610.00 100% 717,392 20,610
U Recovery Building Demolition Debris I ft3
14,141 Debris 52.0 735,332 20,955.00 100% 735,332 20,955
KOH Muds Building Demolition Debris 1 ft3
1,193 Debris 52.0 62,010 1,193.00 100% 62,010 1,193
Sample Plant Building Demolition Debris 1 ft3
14,231 Debris 52.0 740,012 21,045.00 100% 740,012 21,045
Calciner Building Demolition Debris 2 ft3
981 Debris 52.0 51,025 981.00 100% 51,025 981
FM Pads Demolition Concrete Rubble 1 ft3
2,355 concrete rubble 106.6 282,600 2,650.00 0% 0 0
Excavated Pipe 4 ft3
1,556 Steel 42.3 65,770 1,556.00 100% 65,770 1,556
Roofing Over Laundry Area 5 ft3
500 Asphalt/Gravel 100.0 50,000 500.00 100% 50,000 500
Cold Concrete (Construction Rubble) 3 ft3
5,250 concrete rubble 60.0 315,000 5,250.00 0% 0 0
Soil from HF Mitigation & Fire Water Line Ruptures 3 ft3
12,000 soil 75.0 900,000 12,000.00 0% 0 0
Rad. Contaminated Concrete from HF Mitigation 3 ft3
10,000 concrete rubble 60.0 600,000 10,000.00 100% 600,000 10,000
Hot Concrete (Construction Rubble) 3 ft3
1,350 concrete rubble 60.0 81,000 1,350.00 100% 81,000 1,350
Hot Asbestos 2 ft3
2,500 Asbestos 7.0 17,500 2,500.00 100% 17,500 2,500Large Rad. Scrap Metal (Fluorinator shell & Cold Trap) 3 lbs 25,000 steel 21.0 25,000 1,190.00 100% 25,000 1,190
Crushed Unwashed Ore Drums 3 ft' 6,200 50.0 310,000 6,200.00 100% 310,000 6,200DAW: Construction Rubble (Block Wall), Broken Filter Tubes
(Fluorination), Dust Collector Bags, Trash, PPE, Floor sweeping,Incinerator Ash 3 ft
3 8,000 debris 15.0 120,000 8,000.00 100% 120,000 8,000
Cold Special / Chemical Waste 2 ft3
9,105 chemical waste 15.0 136,575 9,105.00 0% 0 0Molyflush Cylinders 3 cylinders 26 steel 84.4 13,500 160 351,000 4,160.00 0% 0 0Thin Walled UF6 Cylinders 3 cylinders 400 steel 21.0 3,300 1,320,000 62,875.00 0% 0 0RAM Flat Compactor 2 each 1 steel 70.0 3,525 50.4 3,525 50.00 100% 3,525 50Conveyor for RAM Flat Compactor 2 each I steel 20.0 1,500 75 1,500 75.00 0% 20 0HEPA Unit for RAM Flat Compactor 2 each I steel 30.0 600 20 600 20.00 100% 600 20Drum Washer 2 each I steel 30.0 1,500 50 1,500 50.00 100% 1,500 50
TOTALS: 31,345,776 621,343 100% 16,730,307 396,576
Note(1) Due to rounding of values the calculated values may not be exact (see Table A-13 in the 2006 Report prepared by Duratek).

ENERCON MTW Decommissioning Cost Estimate
APPENDIX A-14

E N E R C O N MTW Decommissioning Cost Estimate
APPENDIX A-14COST ESCALATION METHODOLOGY
As described in NUREG-1307 Revision 14, the adjustment of the total decommissioning cost estimatecan be expressed by:
Estimated Cost (Year X) = [Base Cost] [ALX + BE, + CB,1
Where, per NUREG-1307, A, B, and C are the fractions of the total 1986 dollar costs that are attributableto labor (0.65), energy (0.13), and burial (0.22), respectively, and sum to 1.0. The factors Lx, E,, and B,are the Labor Cost, Energy Cost, and the Low-Level Waste (LLW) Burial/Disposition Cost Adjustmentsrespectively.
The above equation when adjusted to reference the 2012 Honeywell-Metropolis estimate can beexpressed as follows:
Estimated Cost (2012) = [2009 Cost] [AL, + BEx + CBX]
where A, B, and C are the fractions of the total 2009 Honeywell-Metropolis dollar costs that areattributable to labor, energy, and burial, respectively, and sum to 1.0. The Honeywell-Metropolis valuesfor these fractions are given below:
A = 0.278
B = 0.0175
C = 0.705
The factors L,, Ex, and Bx are defined by:
L, = Labor Cost Adjustment, May 2009 to the re-estimate month of 2012,
Ex, = Energy Cost Adjustment, May 2009 to the re-estimate month of 2012, and
B,, = LLW Burial/Disposition Cost Adjustment, May 2009 to the re-estimate month of2012, (i.e., burial/disposition cost in the new estimate month of 2012 divided bythe burial cost in May 2009)
Licensees are to evaluate Lx and E, for the years subsequent to 1986 based on the national producer priceindexes, national consumer price indexes, and on local conditions for a given site (NUREG-1307,Rev. 14). For the Metropolis plant, the estimates will be adjusted based on the indexes for 2012.
Calculation of the Honeywell-Metropolis factors are detailed in the following sections.
Calculation of Honeywell Labor Cost Adiustment Factor L.
Current employment cost indexes for labor can be obtained from the U.S. Department of. Labor, Bureauof Labor Statistics. On the internet select the BLS website at www.bls.gov. Select "Pay & Benefits", nextselect "National Compensation Data", then select "Occupational Wages", next select the database"Employment Cost Index" one screen data search.
To generate the correct report select the following options for the report: (1) Total Compensation, (2)Private Industry, (3) Index Number, (4) 220 South Region (5) Not seasonally adjusted. Then click the getdata button. The report extracts the data presented below.
1
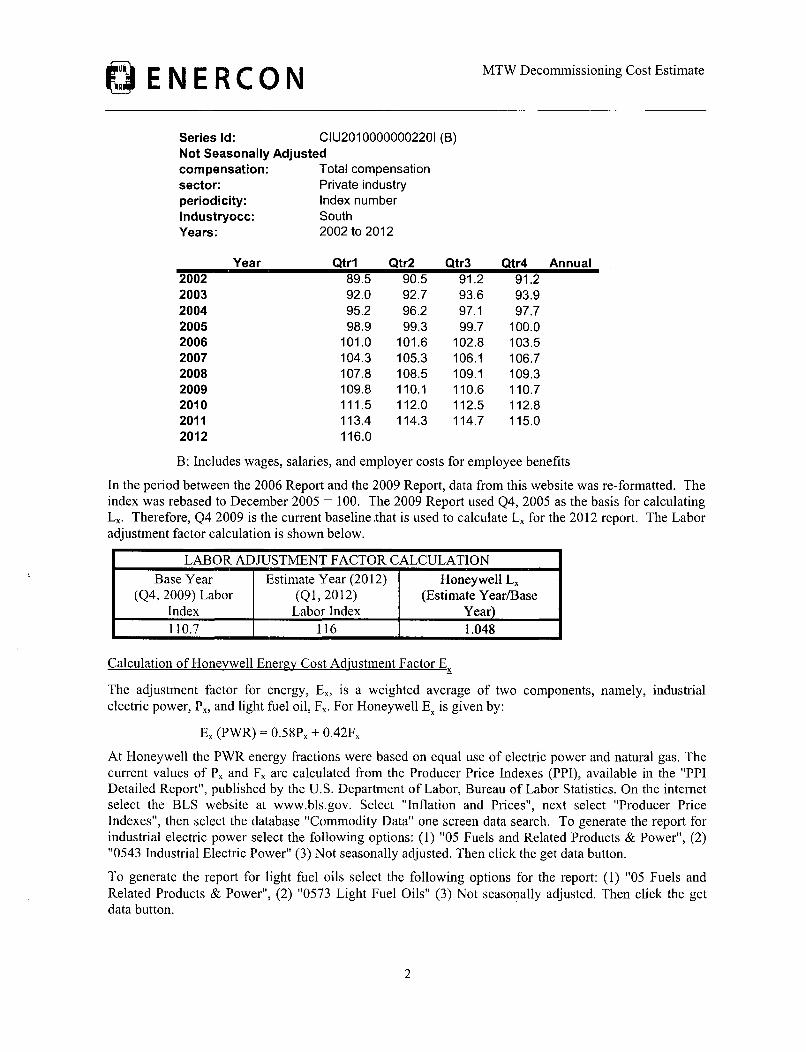
jENERCON MTW Decommissioning Cost Estimate
Series Id: CIU20100000002201 (B)Not Seasonally Adjustedcompensation: Total compensationsector: Private industryperiodicity: Index numberIndustryocc: SouthYears: 2002 to 2012
Year Qtrl Qtr2 Qtr3 Qtr4 Annual20022003200420052006200720082009201020112012
89.592.095.298.9
101.0104.3107.8109.8111.5113.4116.0
90.592.796.299.3
101.6105.3108.5110.1112.0114.3
91.293.697.199.7
102.8106.1109.1110.6112.5114.7
91.293.997.7
100.0103.5106.7109.3110.7112.8115.0
B: Includes wages, salaries, and employer costs for employee benefits
In the period between the 2006 Report and the 2009 Report, data from this website was re-formatted. Theindex was rebased to December 2005 = 100. The 2009 Report used Q4, 2005 as the basis for calculatingL,. Therefore, Q4 2009 is the current baseline that is used to calculate Lx for the 2012 report. The Laboradjustment factor calculation is shown below.
LABOR ADJUSTMENT FACTOR CALCULATIONBase Year Estimate Year (2012) Honeywell Lx
(Q4, 2009) Labor (Q1, 2012) (Estimate Year/BaseIndex Labor Index Year)110.7 116 1.048
Calculation of Honeywell Energy Cost Adjustment Factor E.
The adjustment factor for energy, Ex, is a weighted average of two components, namely, industrialelectric power, Px, and light fuel oil, Fx. For Honeywell E, is given by:
E. (PWR) = 0.58Px + 0.42F,
At Honeywell the PWR energy fractions were based on equal use of electric power and natural gas. Thecurrent values of P, and Fx are calculated from the Producer Price Indexes (PPI), available in the "PPIDetailed Report", published by the U.S. Department of Labor, Bureau of Labor Statistics. On the internetselect the BLS website at www.bls.gov. Select "Inflation and Prices", next select "Producer PriceIndexes", then select the database "Commodity Data" one screen data search. To generate the report forindustrial electric power select the following options: (1) "05 Fuels and Related Products & Power", (2)"0543 Industrial Electric Power" (3) Not seasonally adjusted. Then click the get data button.
To generate the report for light fuel oils select the following options for the report: (1) "05 Fuels andRelated Products & Power", (2) "0573 Light Fuel Oils" (3) Not seasonally adjusted. Then click the getdata button.
2
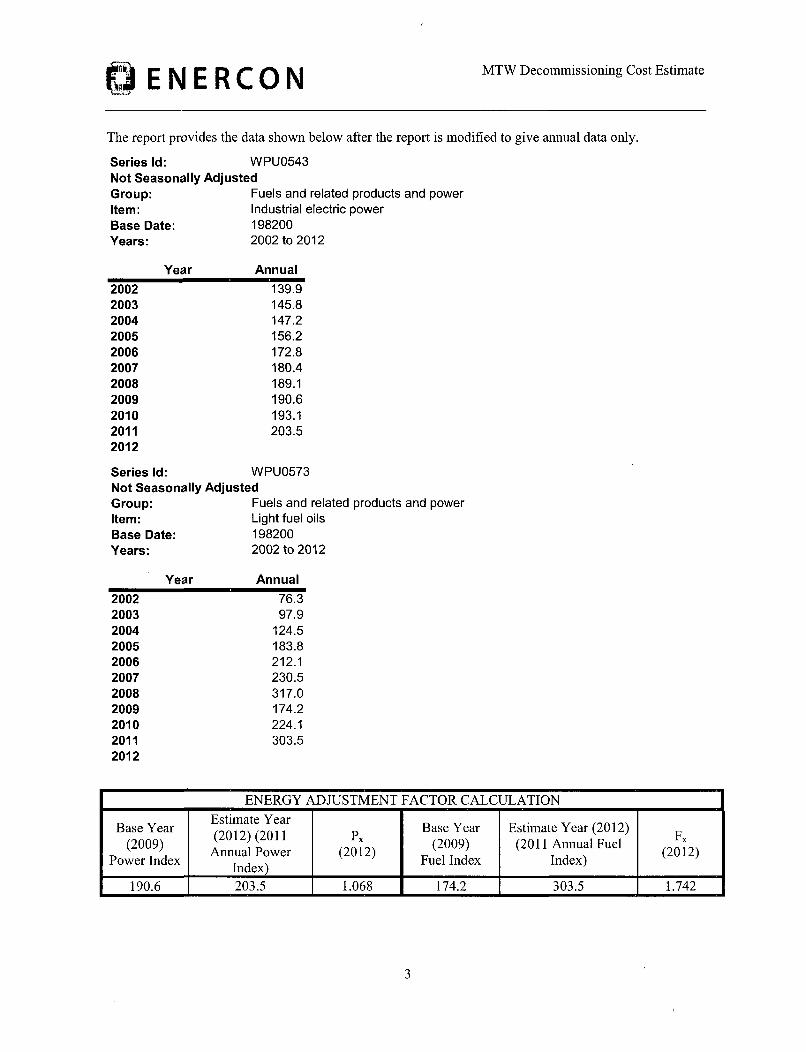
0 ENERCONMTW Decommissioning Cost Estimate
The report provides the data shown below after the report is modified to give annual data only.
Series Id: WPU0543Not Seasonally AdjustedGroup: Fuels and related products and powerItem: Industrial electric powerBase Date: 198200Years: 2002 to 2012
Year Annual
20022003200420052006200720082009201020112012
139.9145.8147.2156.2172.8180.4189.1190.6193.1203.5
Series Id: WPU0573Not Seasonally AdjustedGroup: Fuels and related products and powerItem:Base Date:Years:
Light fuel oils1982002002 to 2012
Year Annual20022003200420052006200720082009201020112012
76.397.9
124.5183.8212.1230.5317.0174.2224.1303.5
ENERGY ADJUSTMENT FACTOR CALCULATION
Base Year Estimate Year Base Year Estimate Year (2012)(2009) (2012)(2011 PP (2009) (2011 Annual Fuel (2012)
Power Index Annual Power (2012) Fuel Index Index)Index)
190.6 203.5 1.068 174.2 303.5 1.742
3

E" N E R CO N MTW Decommissioning Cost Estimate
E, = 0.58P, + 0.42Fx
E, = 0.58 (1.068) + 0.42 (1.742), or
E, = 1.351
Calculation of Waste Burial Cost Adjustment Factor B
The adjustment factors for waste burial/disposition Bx, were calculated based on data are taken directlyfrom data on the appropriate LLW locations given in Table 2.1 of NUREG-1307 Revision 14.
At Honeywell waste will be sent to an (1) offsite waste processor, (2) the EnergySolutions of Utah Burialsite. The adjustment factor for waste burial/disposition Bx, is a weighted average of these threecomponents. For the Honeywell, B, is given by:
Bx (HON) = D*WP, + E*BARN, + F*ENV,
where D, E, and F are the fractions of the total 2009 waste dollar costs that are attributable to (1) anoffsite waste processor, (2) Barnwell South Carolina burial site, and (3) Energy Solution of Utah Burialsite respectively, and sum to 1.0. These values are:
D= 0.322
E= 0.000
F= 0.678
WP., Factor Calculation
The adjustment factor for Waste Processors, WP,,, is calculated from extrapolated data given in Table 2.1of NUREG-1307 Revision 14 for Direct Disposal with Vendors at U.S. Ecology from a PWR for theestimate year 2012 divided by the adjustment factor for the Base Year 2009. The cost factor for 2009 wascalculated to be 5.871 from the average of the 2008 and 2010 values. The 2012 waste processing factorwas calculated using the Microsoft Excel 'trend' function to extrapolate from the available data for years2000 through 2010 and was determined to be 5.961.
The waste processor factor for Honeywell assuming a base year of 2009 and estimate year of 2012 isgiven by:
WP 2 0 12 = Y2 0 12 /Y 2 009
The computed value of WP 20 12 is (5.961/5.871), or 1.015
BARNX, Factor
The adjustment factor for Barnwell South Carolina burial site, BARN,, is 0. Since Barnwell has closedand is not available outside the Atlantic Compact, Table 2.1 of NUREG-1307 Revision 14 for DirectDisposal from a Non-Atlantic Compact PWR is N/A. Therefore, this value is 0.
ENV, Factor Calculation
The adjustment factor for EnergySolutions of Utah, ENVx, is calculated from extrapolated data given inTable 2.1 of NUREG-1307 Revision 14 for Direct Disposal for Washington Site from a PWR for theestimate year 2012 divided by the adjustment factor for the Base Year 2009. EnergySolutions of Utahdoes not publish a rate schedule. Rates are negotiated with each waste shipper based primarily on wastevolume. The cost factor for 2009 was calculated to be 8.159 from the average of the 2008 and 2010
4

EMTW Decommissioning Cost Estimate
values. The 2012 waste processing factor was calculated using the Microsoft Excel 'trend' function toextrapolate from the available data for years 2000 through 2010 and was determined to be 10.176.
The waste burial/disposition factor for Honeywell assuming a base year of 2009 and estimate year of2012 is given by:
ENV 2012 = Y2012/ Y2009
The computed value of ENV 20 12 is (10.176/8.159), or 1.247.
B-, Calcuation
The Bx factor equation for the year 2012 is as follows:
B2012 (HON) = D*WP2 012 + E*BARN 2012 + F*ENV 2012 , or
B2012 (HON) = (0.322)(1.015) + 0 + (0.678)(1.247), or
B 2012 (HON) = 1.172
2012 Escalation Factor Calculation
As described in NUREG-1307 Revision 14, the adjustment of the total decommissioning cost estimatecan be expressed by:
Escalation Factor for Year 2012 = [AL 2012 + BE2 012 + CB2 012]
Portions of the 2009 Decommissioning Cost Estimate were not re-estimated for the 2012 Report. Forthose costs, a specific cost escalation factor was calculated and applied. The adjustment factorcomputation used factors listed below that are detailed in the previous sections.
A = 0.278
B = 0.0175
C = 0.705
L 2 0 12 = 1.048
E2012 = 1.351
B2012 = 1.172
The 2012 escalation factor calculation is:
2012 Escalation Factor = (0.278)(1.048) + (0.0175)(1.351) + (0.705)(1.172), or
2012 Escalation Factor = 0.291 + 0.0236 + 0.826
2012 Escalation Factor = 1.141
5

0ENERCON MTW Decommissioning Cost Estimate
APPENDIX A-15

Photograph No. 1 - Twelve wide trailer (BD-69) (looking northwest)
A-15 Page 1 ot 3

Photograph No. 2 - Waste Sorting Building (BD-92) (looking south)
A-15 Page 2 ot 3

Photograph No. 3- Capital Fabrication Building (BD-93) (looking north)
A-15 Page 3 of 3