Decline in reported GC morbidity in NYC Preeti Pathela [email protected].
16
-
Upload
ezra-hopkins -
Category
Documents
-
view
214 -
download
0
Transcript of Decline in reported GC morbidity in NYC Preeti Pathela [email protected].

Where do we stand?
105
110
115
120
125
130
135
140
Overall Male Female
NYCNYCNYC
USUS US
GonorrheaC
as
es p
er 1
00,
000
po
p.

Gonorrhea Rates:
United States, 1970-2004
and the Healthy People 2010 target
-74%
-12%

Gonorrhea Rates by Sex:
United States, 1981-2004
and the Healthy People 2010 target

Gonorrhea Rates by Sex
New York City, 1995-2005
0
50
100
150
200
250
1995
1996
1997
1998
1999
2000
2001
2002
2003
2004
2005
Year
Cas
e R
ate
per
100
,000
p
op
ula
tio
n
malefemaleoverall
Data based on cases reported to the NYC DOHMH
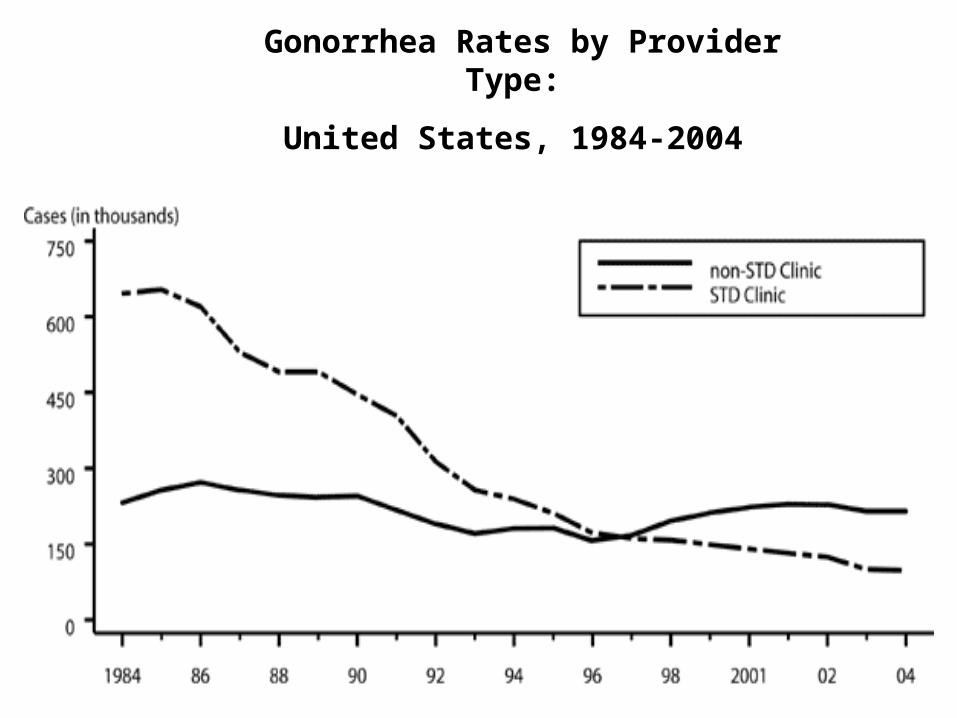
Gonorrhea Rates by Provider Type:
United States, 1984-2004
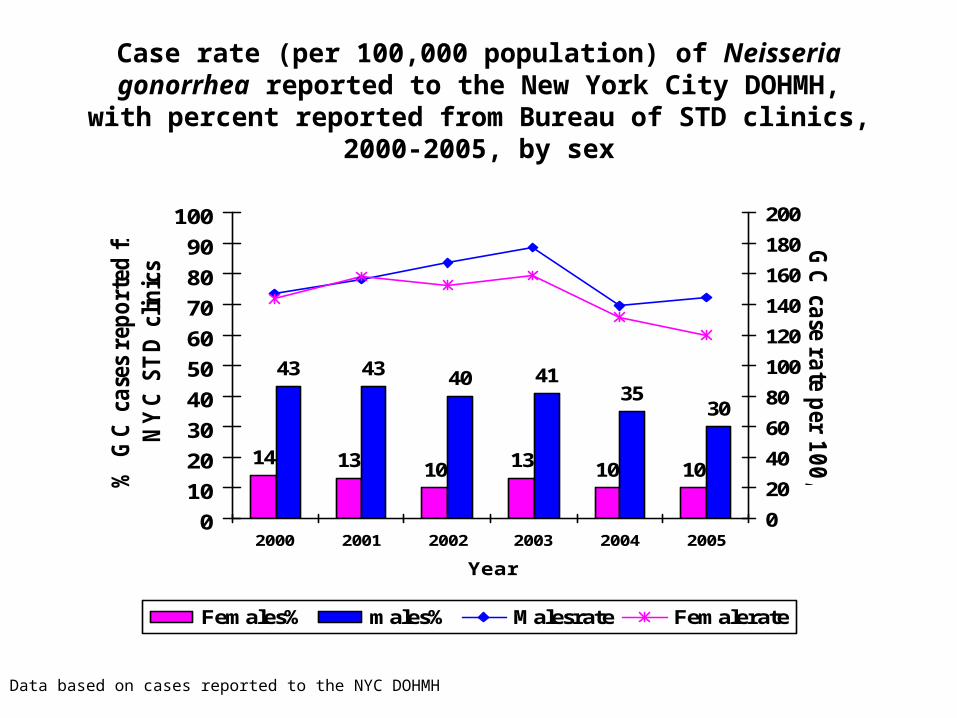
Case rate (per 100,000 population) of Neisseria gonorrhea reported to the New York City DOHMH, with percent reported from Bureau of STD clinics,
2000-2005, by sex
Data based on cases reported to the NYC DOHMH
14 13 10 13 10 10
43 43 40 4135
30
0
10
20
30
40
50
60
70
80
90
100
2000 2001 2002 2003 2004 2005
Year
% G
C c
ase
s re
po
rted
fro
m
NY
C S
TD
cli
nic
s
0
20
40
60
80
100
120
140
160
180
200
GC
case ra
te per 1
00
,00
0
Females% males% Malesrate Femalerate

HIV Counseling & Testing
STD Clinic
Drug Treatment
Family Planning
Prenatal
Other Clinic
Private Physician
Hospital
Correctional Facility
Laboratory
Other
Unknown
Provider types in NYC BSTDC Surveillance Database
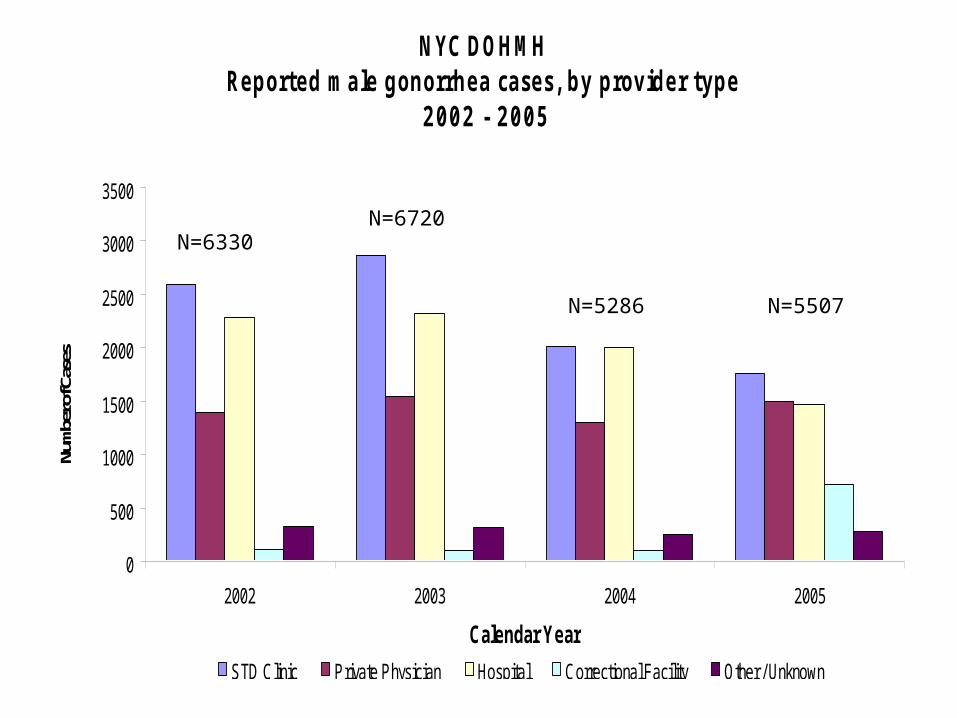
NYC DOHMHReported male gonorrhea cases, by provider type
2002 - 2005
0
500
1000
1500
2000
2500
3000
3500
2002 2003 2004 2005
Calendar Year
Num
ber o
f Cas
es
STD Clinic Private Physician Hospital Correctional Facility Other / Unknown
N=5507N=5286
N=6720N=6330
0500
1000150020002500300035004000
2002 2003 2004 2005
Calendar year
No
. o
f ca
ses
STD Clinic Private Provider Hospital Correctional Facility Other / Unknow n
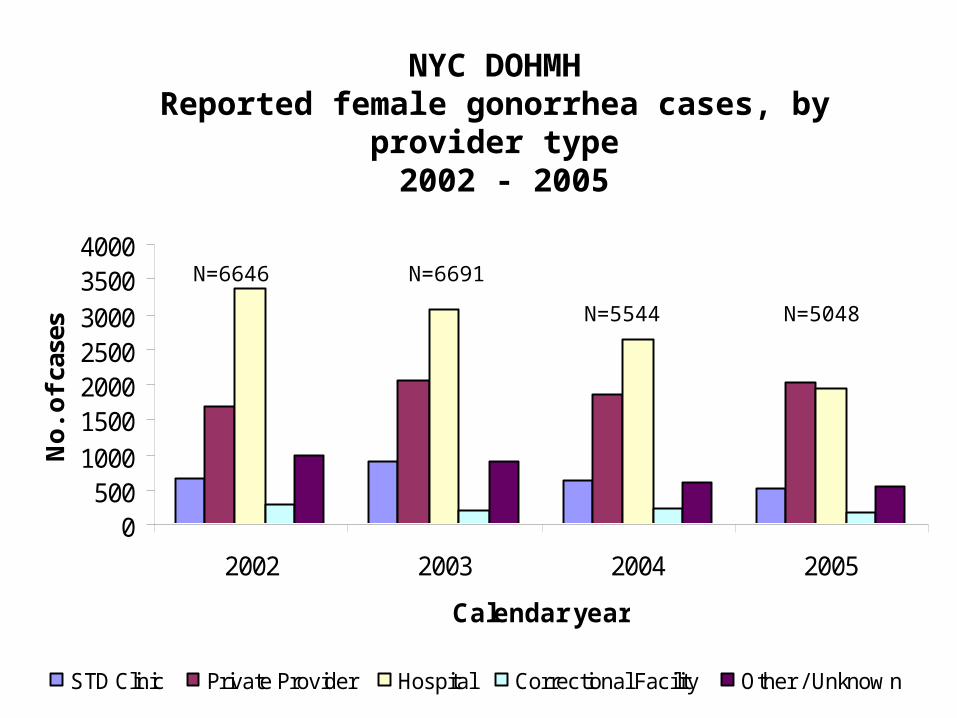
NYC DOHMHReported female gonorrhea cases, by provider type
2002 - 2005
N=5048N=5544
N=6691N=6646
10-14
15-19
20-24
25-29
30-34
35-39
40-44
45-49
50-54
55-59
60-64
65+
Age (years)
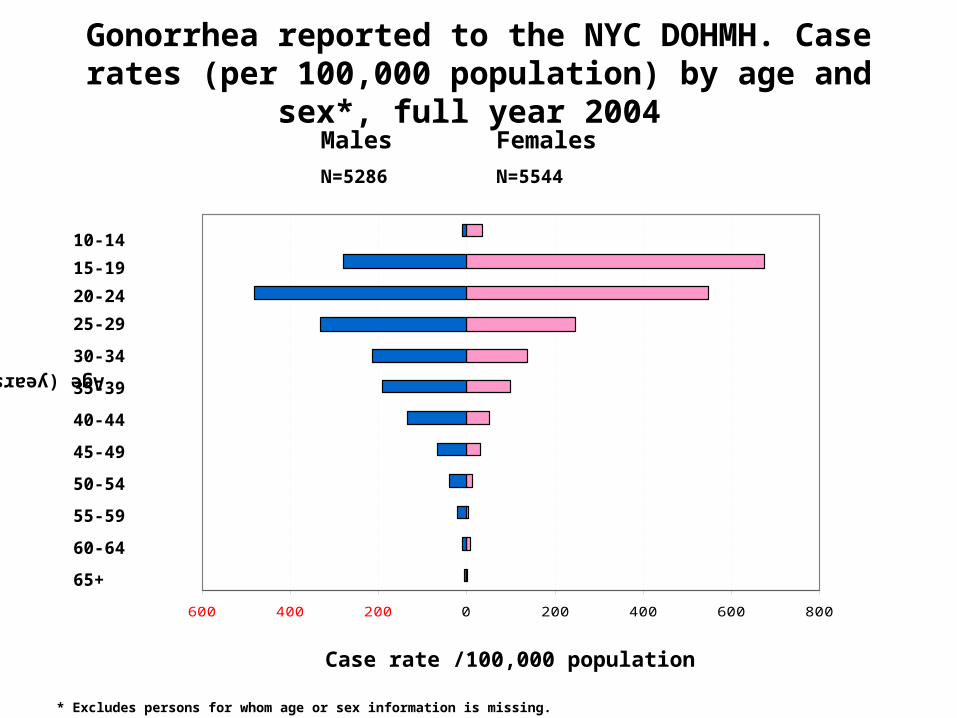
MalesN=5286
FemalesN=5544
Gonorrhea reported to the NYC DOHMH. Case rates (per 100,000 population) by age and sex*, full year 2004
* Excludes persons for whom age or sex information is missing.
600 400 200 0 200 400 600 800
Case rate /100,000 population
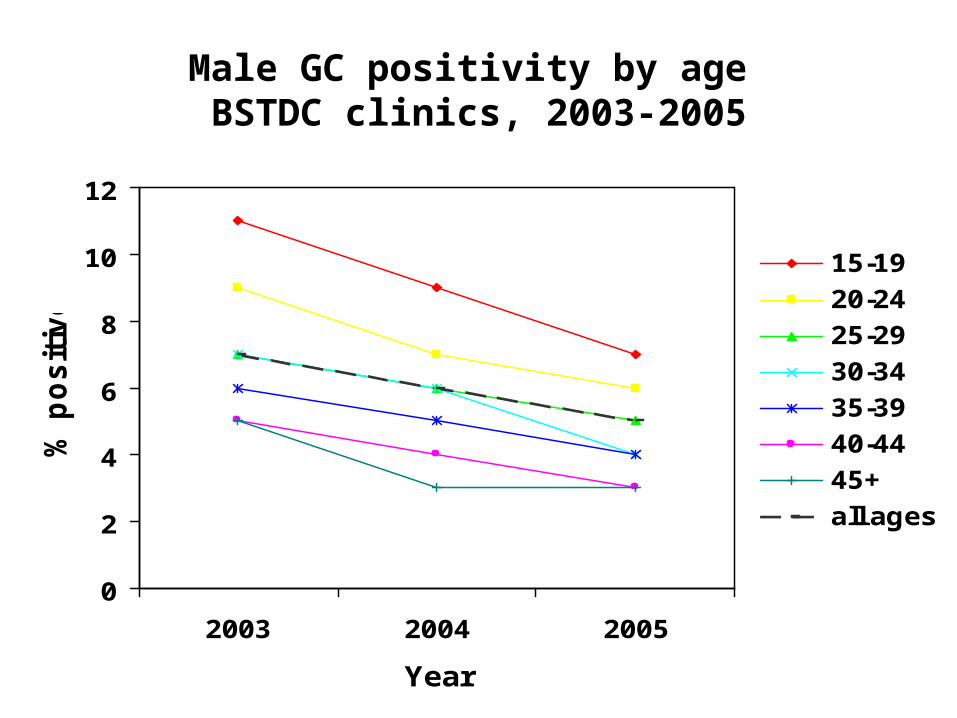
Male GC positivity by age BSTDC clinics, 2003-2005
0
2
4
6
8
10
12
2003 2004 2005
Year
% p
os
itiv
e
15-19
20-24
25-29
30-34
35-39
40-44
45+
all ages
0
1
2
3
4
5
6
7
2003 2004 2005
Year
% p
os
itiv
e
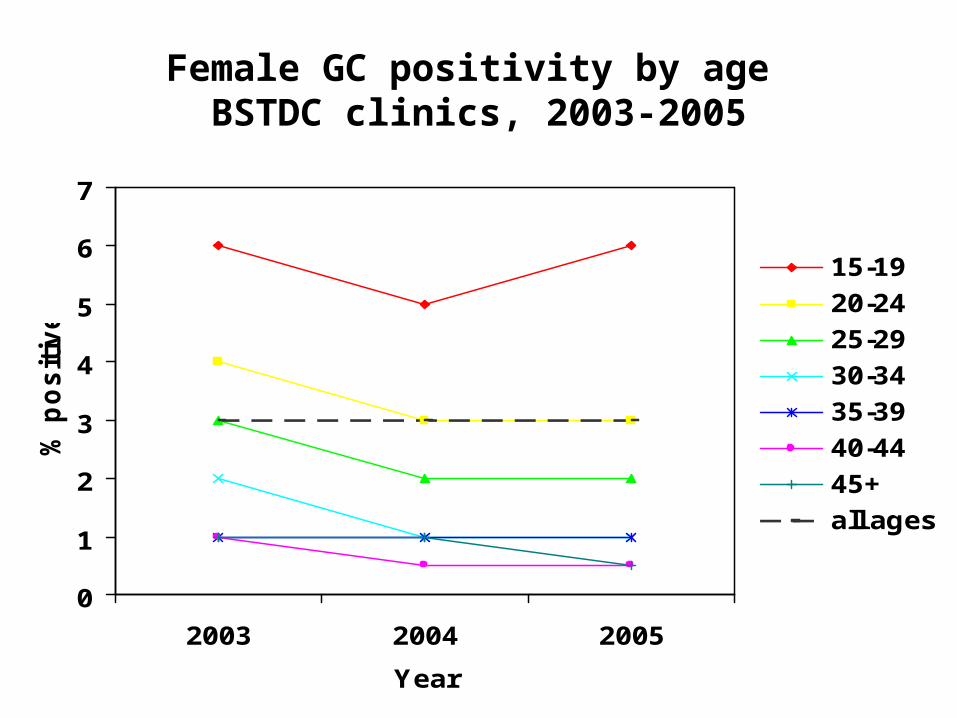
15-19
20-24
25-29
30-34
35-39
40-44
45+
all ages
Female GC positivity by age BSTDC clinics, 2003-2005
• A true decline in GC
• Changes in screening practices • Use of diagnostic tests with different sensitivities
• Changes in reporting practices
What is leading to the apparent decline in GC cases?

If decreases are true decreases…
• How would this impact targeting of GC screening?
• Could this impact manufacturers of tests
(provision of Ct-only tests) for low GC prevalence areas?

Thanks!