Decision-making exercises in exams - Pearson Publishing ... · PDF fileabout the advantages of...
3
5 Look at the questions carefully. Some candidates find it helpful to underline key words, eg ‘Explain how your plan is best for the envir onment and for local people .’ In this case, you should try to write roughly the same amount about the advantages of your plan for the environment and for local people – try not to rush one section. If you are given the resources for the exam in advance, spend some time looking over them and highlighting key facts and patterns. Your teacher will help you in this. Find out whether your exam will include a decision-making exercise and, if so, what form it will take. Drawing sketch maps and diagrams There are two main ways that you are likely to use sketch maps and diagrams in an exam: 1 To back up a case study, eg ‘Describe the land use pattern in a town you have studied. You may wish to include a sketch map in your answer’ or ‘With the help of a diagram, explain how relief rainfall occurs’. 2 A map of a scheme you design as part of a decision-making exercise, eg ‘Draw an annotated map to show how the National Park should be managed’. Maps and diagrams should be clear and simple. Remember that the geographical information is more important than how artistic your drawing is, though it should be neat. it is best to use pencil for drawing and pen for labels. Coloured pencils are useful to make features clear (eg different types of roads, or to shade in areas being managed in different ways). Include clear labels on maps and diagrams and use a key when appropriate. Diagrams should be fully explained, and maps may be annotated (labelled) to show more information, eg reasons why a supermarket site was chosen (see the example on page 6). 1 Skills 4 Decision-making exercises in exams In decision-making papers, you usually answer all questions. The order of the questions usually follows the decision-making process below: If the questions follow this pattern, try to answer them in order as you may need information that you look at in one question to answer the next one. If you can, refer to similar real life examples that you have studied – but only if they are relevant! 1 Describing information Short questions, using OS maps, graphs or other sources. 2 Using the information Perhaps working out different people’s attitudes to a proposal or assessing the advantages and disadvantages of a scheme. 3 Making a decision This may involve choosing a site or planning something. You may have to write down your plan or draw an annotated (labelled) map. There is usually more than one correct answer in a decision-making exercise. If you have thought through your choice carefully and looked at all the information and instructions, it should be acceptable. 4 Justifying your decision Explaining why your choice or plan is the best. When you justify a choice, always say why you rejected the other options as well as why you did choose that particular one. This part of the question often has the most marks, so really explain it – don’t just describe your plan again. 1 Skills
Transcript of Decision-making exercises in exams - Pearson Publishing ... · PDF fileabout the advantages of...
5
Look at the questions carefully. Some candidates find it helpful to underlinekey words, eg ‘Explain how your plan is best for the environment and forlocal people.’ In this case, you should try to write roughly the same amountabout the advantages of your plan for the environment and for local people– try not to rush one section.
If you are given the resources for the exam in advance, spend some timelooking over them and highlighting key facts and patterns. Your teacher willhelp you in this.
Find out whether your exam will include a decision-making exerciseand, if so, what form it will take.
Drawing sketch maps and diagramsThere are two main ways that you are likely to use sketch maps and diagramsin an exam:
1 To back up a case study, eg ‘Describe the land use pattern in a townyou have studied. You may wish to include a sketch map in your answer’or ‘With the help of a diagram, explain how relief rainfall occurs’.
2 A map of a scheme you design as part of a decision-making exercise,eg ‘Draw an annotated map to show how the National Park should bemanaged’.
Maps and diagrams should be clear and simple. Remember that thegeographical information is more important than how artistic your drawingis, though it should be neat.
it is best to use pencil for drawing and pen for labels. Coloured pencils areuseful to make features clear (eg different types of roads, or to shade inareas being managed in different ways). Include clear labels on maps anddiagrams and use a key when appropriate. Diagrams should be fullyexplained, and maps may be annotated (labelled) to show moreinformation, eg reasons why a supermarket site was chosen (see theexample on page 6).
1 Skills
4
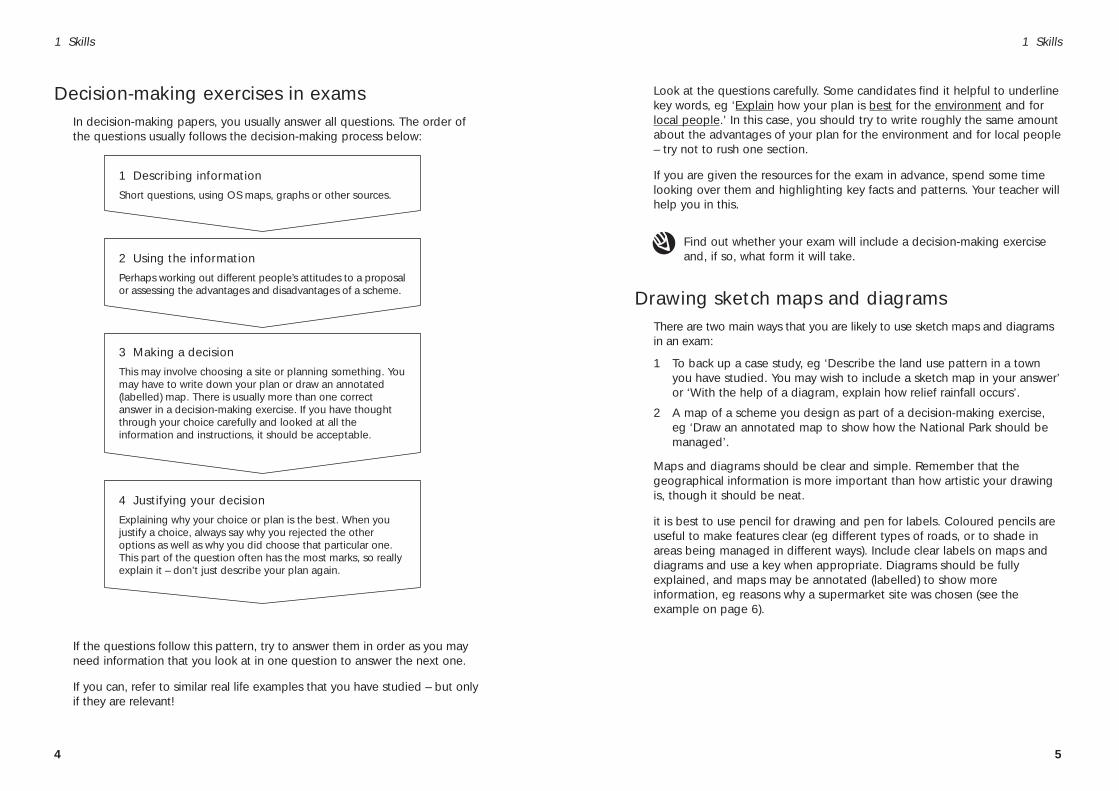
Decision-making exercises in examsIn decision-making papers, you usually answer all questions. The order ofthe questions usually follows the decision-making process below:
If the questions follow this pattern, try to answer them in order as you mayneed information that you look at in one question to answer the next one.
If you can, refer to similar real life examples that you have studied – but onlyif they are relevant!
1 Describing information
Short questions, using OS maps, graphs or other sources.
2 Using the information
Perhaps working out different people’s attitudes to a proposal or assessing the advantages and disadvantages of a scheme.
3 Making a decision
This may involve choosing a site or planning something. You may have to write down your plan or draw an annotated (labelled) map. There is usually more than one correct answer in a decision-making exercise. If you have thought through your choice carefully and looked at all the information and instructions, it should be acceptable.
4 Justifying your decision
Explaining why your choice or plan is the best. When you justify a choice, always say why you rejected the other options as well as why you did choose that particular one. This part of the question often has the most marks, so really explain it – don’t just describe your plan again.
1 Skills

51
Describe the UK’s energy mix. Suggest how the energy mix for an LEDC might be different.
Both renewable and non-renewable energysources have some effect on the environment.However, the effects of renewable energysources tend to be much more localised, eg noise from wind turbines. Burning fossilfuels produces air pollution which may affecta wide area, and is responsible for acid rainand contributes to global warming.
Make a table comparing the advantages and disadvantages of onerenewable and one non-renewable energy source you have studied.
Acid rain Acid rain is rain with a pH of less than 5.
Complete this diagram to show the causes of acid rain:
.............................. and .............................. gases are released when
.............................. and .............................. are burnt in
.............................., .............................. and ...................................... .
..................................... occurs in clouds and acids dissolve in moisture.
Clouds carried by ..............................
The most acidic rain recorded was pH ........ in .............................4
3
2
1
Sea
Dry deposition1
2 3
4
3 Ecosystems & environmental issues
50
The effects of energy production
Types of energy
Draw a spider diagram showing ‘Types of power supply’.One to start you off – ‘Oil’.
Fossil fuels are the fossilised remains of plants and animals.
The major fossil fuels are coal, oil and gas.
A finite resource is one that will run out if we keep usingit, eg oil.
An infinite resource is one that will not run out, eg solarpower.
Renewable energy is energy that will not run out, eg windpower, or that regenerates and willnot run out if carefully managed, eg wood.
Non-renewable energy is a power source that can only beused once, eg oil. It does notregenerate within human time scales.
Energy use is higher in MEDCs, eg in 1992, North Americaused 351 gigajoules of energy perperson, compared to 36 gigajoulesin Africa and the Middle East.
Energy efficiency means not wasting energy, eg using energy-saving light bulbs.
A country’s energy mix is the combination of different energysources it uses.
3 Ecosystems & environmental issues
OIL
COAL
GAS
NUCLEAR
RENEWABLE
Energy mix for UK

103
In many areas, the cliffs are protected by a sand or shingle beach. Thewaves will only erode the cliffs during storm conditions. Beaches areconstantly changing.
Destructive waves are powerful. They move material downthe beach towards the sea.
Constructive waves are gentle. They move material up thebeach towards the cliffs.
Sand is carried along the coastline by the process of long shore drift (see diagram below).
Why is the backwash at a different angle to the swash?
Distinctive coastal landforms are also created by deposition.
Draw lines to match up the following landforms with their definitions:
spit • • a small hill of sand at the top of abeach, not usually reached by thetide, which may have vegetationon it.
dune • • a narrow ridge of sand or shinglejoining an island to the mainland.
bar • • a long, narrow projection of sandor shingle, joined to the land atone end.
tombolo • • a narrow area of sand and shingleconnecting two headlands acrossa bay. The area of water itencloses is called a lagoon.
3
1
4
5
2
34
512
Incoming wave (swash)LAND
SEA
Outgoing wave (backwash)
Prevailing (usual) wind
Direction of movement of sandand shingle (long shore drift)
Material piling up on the windwardside of wooden groynes
7 Water landforms & systems
102
Write a summary of ways of reducing the risk of flooding (eg buildingdams, building artificial levees, afforestation, straightening channels).Include a brief case study.
Coastal landforms and processesThe basic processes of erosion, transportation and deposition are the samefor coasts as they are for rivers, except that sea water is doing the workinstead of river water.
The process of erosion is most obvious in areas where the sea reaches cliffs ona daily basis. As with rivers, softer rocks (eg boulder clay) erode faster thanharder rocks (eg granite). Along the coast, an area of harder rock tends to stickout to form a headland, whilst softer areas of rock are eroded to make bays.
Coastal landforms made by erosion:
3
1
4
5
2
Arch
Stack
Stump
Cave
Wave cut notch
6 Wave cut platform
34
5
1 2
6
Case study: The Bangladesh Floods
Much of Bangladesh is situated on the delta of the Ganges andBrahmaputra rivers. The delta provides fertile land for rice-growing, butmeans that much of the country is very low lying (less than 6 metres abovesea level). Flooding is an annual event, but sometimes floods are verysevere. For example, in August/September 1988, over 60% of Bangladeshwas flooded. This was caused by unusually heavy monsoon rains, anddeforestation in the Himalayas may have contributed to the problem byincreasing surface run-off. Over 2000 people were killed, buildings androads were destroyed and crop yields were reduced. Bangladesh is alsoaffected by coastal flooding from storm surges caused by tropical cyclones.
7 Water landforms & systems