Decision Analysis - University of Colorado Denver A decision tree is a \convenience" tool Nothing...
33
Decision Analysis Marcelo Coca Perraillon University of Colorado Anschutz Medical Campus Cost-Effectiveness Analysis HSMP 6609 2016 1 / 33
Transcript of Decision Analysis - University of Colorado Denver A decision tree is a \convenience" tool Nothing...

Decision Analysis
Marcelo Coca Perraillon
University of ColoradoAnschutz Medical Campus
Cost-Effectiveness AnalysisHSMP 6609
2016
1 / 33

Outline
A (silly) decision making example
Decision tree components
Review of basic probability
A less silly example: doing CEA/CUA with decision trees
Steps to construct models
Limitations of decision models
Recurrent decisions: Markov models
2 / 33
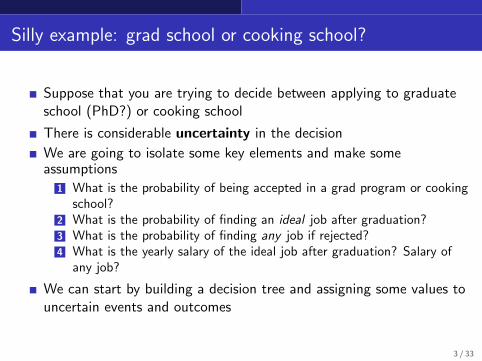
Silly example: grad school or cooking school?
Suppose that you are trying to decide between applying to graduateschool (PhD?) or cooking school
There is considerable uncertainty in the decision
We are going to isolate some key elements and make someassumptions
1 What is the probability of being accepted in a grad program or cookingschool?
2 What is the probability of finding an ideal job after graduation?3 What is the probability of finding any job if rejected?4 What is the yearly salary of the ideal job after graduation? Salary of
any job?
We can start by building a decision tree and assigning some values touncertain events and outcomes
3 / 33
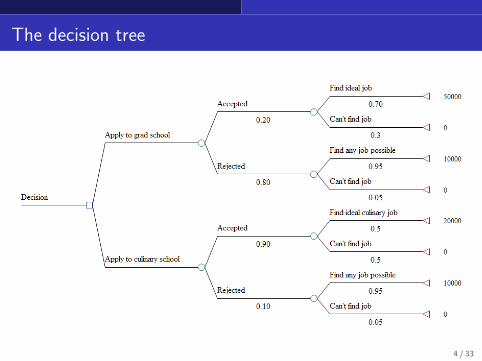
The decision tree
4 / 33

Trees
A decision tree is a “convenience” tool
Nothing magical about trees; they are useful for visualizing theproblem
Trees are not needed to “solve” a decision problem but it is very hardto think of all possibilities without a tree
It’s a good idea to start by drawing a tree
5 / 33

A digression about software
We will use Excel to work with decision and Markov models (nextclass)
A popular book on decision modeling (Briggs et al, 2006) has tons ofexamples of models using Excel
For learning, Excel is the best tool. You can see how everything iscalculated
Not the only tool. TreeAge is the most popular alternative
But it’s not easy to learn/use and is a “black box.” Not great forlearning
TreeAge does make life easier if you often work with decision/Markovmodels
6 / 33

Decision node
A decision node is where a decision needs to take place; thebranches are the choices (note the square)
Usually at left of tree but it could be in the middle of the treedepending of the problem
Our current example has two choices, but it could be more than two
7 / 33
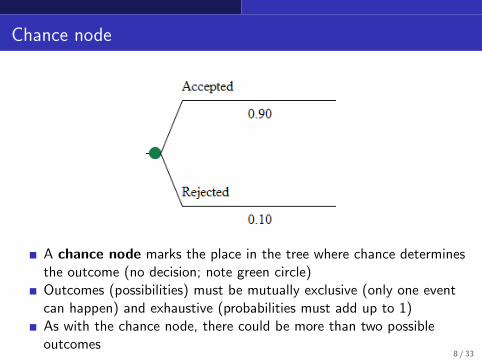
Chance node
A chance node marks the place in the tree where chance determinesthe outcome (no decision; note green circle)Outcomes (possibilities) must be mutually exclusive (only one eventcan happen) and exhaustive (probabilities must add up to 1)As with the chance node, there could be more than two possibleoutcomes
8 / 33

Terminal node
The terminal node is the final outcome associated with each branch
In this example, the payoff is yearly income but it could be somethingmore complicated and there could be more than one payoff
9 / 33
Big picture
Only three elements –decision, chance, and terminal nodes– providethe whole structure of a decision tree
The data needed are 1) probabilities for chance nodes and 2)payoffs for terminal nodes
A decision tree defines many possibly pathways
10 / 33

Pathways
This simple example has 8 pathways (A to H)
For example, pathway B: Accepted into grad school but can’t findideal job
11 / 33

The role of time
Time is implied in the decision
In this example we do not take into account time very precisely
Grad school is about 5 years, cooking school is shorter (2-3 years)
We could adjust the payoffs to more realistically describe thedifference in time
For example, we could calculate salary over 10 years in the marketand take into account that cooking school would provide two extrayears of income
12 / 33

Rolling back the tree
To figure out what we should do, we calculate the expected payoffof each chance node until we get to the decision node
We start from right to left
This is called “rolling back” the tree (or the rollback method)
13 / 33

Expected value
The expected value after being accepted into grad school is0.7× 50, 000 + 0.3× 0 = $35, 000
The expected value after being rejected is0.95× 10, 000 + 0.05× 0 = $9, 500
Using these results, we can then calculate the expected value ofapplying to grad school: 0.20× 35, 000 + 0.80× 9, 500 = $14, 600
14 / 33

Rolling back with TreeAge
The expected payoff from grad school is $14,600, which is larger thanthe expected payoff of culinary school, $9,950. Therefore, we shouldapply to grad school
15 / 33

Using Excel
We can calculate the probability of each pathway and then multiplythat probability by the corresponding payoff
Note that we are using some rules of probability –most of which youdon’t really need to know but it’s useful to know them
16 / 33

Probability
Conditional probability: P(A|B) = P(A∩B)P(B)
In words, the probability of event A happening given that event B hashappened
P(A ∩ B) is the probability of both events A and B happening (jointprobability)
The probability of finding an ideal job if accepted to grad schoolis a conditional probability because it depends on first being acceptedintro grad school
The probability of pathway A happening is the probability of twoevents happening: accepted intro grad school and finding an ideal job
Solving for the joint probability: P(A∩B) = P(B)× P(A|B). That’swhy we multiply probabilities in decision trees
With more branches, events are nested, but the rule is the same. Theprobability of a pathway is a joint probability
17 / 33

Probability, graphically
Graphically, from trusty Wikipedia
If two events are independent, P(A ∩ B) = P(A)× P(B) (but that’snot why we multiply branches’ probabilities)
This implies that if A and B are independent
P(A|B) = P(A∩B)P(B) = P(A)×���P(B)
���P(B)= P(A)
In words, event B happening does not change the probability of eventA happening
18 / 33
Using decision analysis
Rolling the decision tree is never the end of the story
Decision models are useful because they allow us to study the keyelements of the decision
One way to figure out which are the key elements is to see howchanging some values affects the decision
In other words, performing sensitivity analyses
Some effects are obvious; others not so much
19 / 33

Changing payoff
What about if the salary for jobs after cooking school are too low?
20 / 33

Changing payoff
The threshold is $30,333
If salary after cooking school is greater than $30,333, then we shouldgo to culinary school
This is a one-way sensitivity analysis (we’re changing only oneparameter)
Note that the line for applying to grad school is flat because we aren’tchanging the payoff after grad school
Is 30K realistic? It could be. But 50k after grad school is kind of low
21 / 33

Changing both payoffs
Range of 15K to 35K for culinary job and 40K to 70K after gradschool
22 / 33

Changing the probability of acceptance to grad school
This was surprising. Even at a very low probability of getting intograd school, the expected value of applying to grad school is higher
23 / 33

Changing the Pr of acceptance to grad school and salary
At low probability of getting into grad school, the salary after gradschool would need to be very low to change the decision
We will study more ways to perform sensitivity analyses towards theend of the semester
24 / 33

Adding another payoff
We can consider other payoffs. What about a negative payoff?
One not-so-good thing about grad school is that it requires a lot ofeffort while cooking school may be more enjoyable
We could come up with a number that reflects effort. Let’s say anumber between 0 and 1 (0 being no effort; 1 max effort)
What is the expected effort level for each alternative?
25 / 33

Salary and effort
Each terminal node has an effort level now
The expected effort for the grad school option is 0.6; the expectedeffort for the cooking school option is 0.23
What about the salary per unit of effort?
26 / 33

Salary and effort
Cooking school’s salary per unit of effort is a lot higher 43K vs 24K
Cooking school effort is probably underestimated (wishful thinking).Besides, this is short-term effort...
27 / 33

What does this have to do with CEA?
Hopefully you can see the connection by now
In cost effectiveness, the decision node will have the alternatives wewant to compare (e.g. new treatment versus usual care)
The payoffs are 1) costs and 2) outcomes (life years, QALYs, naturalunits, etc)
We can then calculated the (expected) ICER
So what is different now? We have incorporated uncertainty
When using a decision tree to model CEA, we do not necessarilymake a decision; the final product will be an ICER, which, as usual,we need to compare to other ICERs or a threshold
28 / 33

CEA example
Choosing between two medications (from Briggs et al, 2006); payoffsare costs and utilities
Tree defines 10 pathways
29 / 33

Steps in decision modeling
1 Identify the decision problem: What are the alternatives? What isthe research question? What are the key elements of the decision?Identify sub-populations
2 Draw the tree: It’s very helpful to draw the tree to determinepathways
3 Synthesize evidence: Evidence usually comes from the literature.We need probabilities, costs, and benefits. Meta-analysis is a big partof CEA
4 Analyze the tree and perform sensitivity analyses: Alwaysone-way to debug tree, set probabilities to 0 and 1 (things that shouldhappen must happen), set payoffs to zero (alternatives should havesame expected value)
5 Go back to 1) when necessary: Always an iterative process
30 / 33

The big picture
Rolling back trees, defining probabilities, doing a sensitivity analysisare the easy parts
The hardest part is to structure the tree. It requires isolating thekey elements of the decision
Without good knowledge of the problem, it is very hard to ascertain ifa tree is modelling the situation correctly
When reading a paper, always wonder what could be missing that isimportant
A paper without a sensitivity analysis is a bad paper
You will read this in every decision modeling book so I should just sayit: All models are wrong, some are useful
31 / 33

Limitations of decision models for CEA
Decision models do not easily handle recurrent events and diseaseprogression
We could add another tree to model a recurrent event, but thisbecomes very complicated very quickly
For example, in the sumatriptan example, it is likely that anothermigrane attack will happen. The tree time horizon could be, say, aweek. We would need to add another tree for next week. And anotherfor the following week... The tree become very complicated
For these reasons, decision models are commonly used to study shortterm CEA problems
For long term CEA problems and recurrent events, Markov models aremore common
Markov models incorporate changes in disease states
32 / 33

Summary
Decision models in CEA/CUA directly incorporate uncertainty
The basics of measuring costs and benefits have not changed; butICER now is an expected value
The hardest part of decision models is to make sure the key elementsof a decision are isolated and that the model represents the problemwell
Rolling back the tree, sensitivity analyses are the easy parts
Decision models are limited when dealing with recurrent events andwhen we want to model disease progression
Markov models to the rescue (next class)
33 / 33