December 31, 2018
47
December 31, 2018
Transcript of December 31, 2018

December 31, 2018

2
Table of Contents Page No. Equity Market
How the Indian equity markets fared in 2018? 3
Domestic MF continued robust net inflows 4
Macro overview 5
Crude oil - A joker in the pack 6
Earnings downgrade increases the equity valuations 7
Model portfolios - Direct Equity
Aggressive model portfolio – Equity 9-14
Moderate model portfolio – Equity 15-21
Conservative model portfolio – Equity 22-27
Mutual Funds
Top 5 recommended mutual funds 29-34
Aggressive model portfolio – Mutual Funds 35-38
Moderate model portfolio – Mutual Funds 39-42
Conservative model portfolio - Mutual Funds 43-46
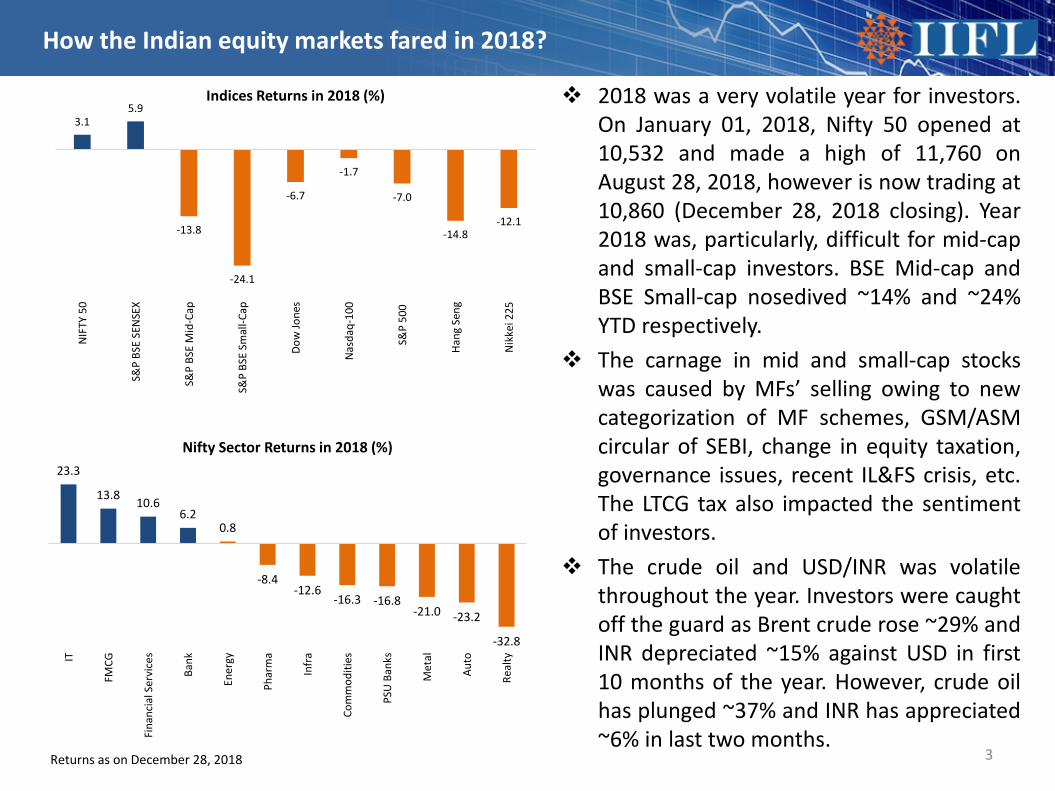
2018 was a very volatile year for investors.On January 01, 2018, Nifty 50 opened at10,532 and made a high of 11,760 onAugust 28, 2018, however is now trading at10,860 (December 28, 2018 closing). Year2018 was, particularly, difficult for mid-capand small-cap investors. BSE Mid-cap andBSE Small-cap nosedived ~14% and ~24%YTD respectively.
The carnage in mid and small-cap stockswas caused by MFs’ selling owing to newcategorization of MF schemes, GSM/ASMcircular of SEBI, change in equity taxation,governance issues, recent IL&FS crisis, etc.The LTCG tax also impacted the sentimentof investors.
The crude oil and USD/INR was volatilethroughout the year. Investors were caughtoff the guard as Brent crude rose ~29% andINR depreciated ~15% against USD in first10 months of the year. However, crude oilhas plunged ~37% and INR has appreciated~6% in last two months.
3
How the Indian equity markets fared in 2018?
Returns as on December 28, 2018
3.15.9
-13.8
-24.1
-6.7
-1.7
-7.0
-14.8-12.1
NIF
TY 5
0
S&P
BSE
SEN
SEX
S&P
BSE
Mid
-Cap
S&P
BSE
Smal
l-Cap
Dow
Jone
s
Nas
daq-
100
S&P
500
Hang
Sen
g
Nik
kei 2
25
Indices Returns in 2018 (%)
23.3
13.8 10.66.2
0.8
-8.4-12.6
-16.3 -16.8-21.0 -23.2
-32.8
IT
FMCG
Fina
ncia
l Ser
vice
s
Bank
Ener
gy
Phar
ma
Infr
a
Com
mod
ities
PSU
Ban
ks
Met
al
Auto
Real
ty
Nifty Sector Returns in 2018 (%)

FIIs were net sellers in 2018 after a periodof 6 years. FIIs had reduced their exposureto emerging markets as US 10-yearTreasury yield rose to ~3% and emergingmarket currencies depreciated against USdollar due to rising interest rate in US.
Domestic mutual funds continued to pourinto Indian equity markets. In 2018,domestic MF’s net inflow in equity stoodat ~`1.10 lakh cr. The inflows fromdomestic MF industry is expected tocontinue on the back of strong MFinvestments.
Indian mutual funds continued to receiverobust SIP inflow. In last 11 months, SIPinflows stood at `80,645cr despitevolatility in Indian markets vs. `59,482cr in2017. This reflects that, today retailinvestors are more financially educatedand upbeat about investing in MFs,despite recent disturbances.
4
Domestic MF continued robust net inflows
-30000
0
30000
60000
90000
120000
150000
2009 2010 2011 2012 2013 2014 2015 2016 2017 2018
Net Inflows in Equity (` crore)
Domestic Mutual Fund FIIs
0
1,000
2,000
3,000
4,000
5,000
6,000
7,000
8,000
Nov
/16
Dec/
16Ja
n/17
Feb/
17M
ar/1
7Ap
r/17
May
/17
Jun/
17Ju
l/17
Aug/
17Se
p/17
Oct
/17
Nov
/17
Dec/
17Ja
n/18
Feb/
18M
ar/1
8Ap
r/18
May
/18
Jun/
18Ju
l/18
Aug/
18Se
p/18
Oct
/18
Nov
/18
SIP Inflows (` crore)
Domestic MF and FII’s net inflows as on Dec 27, 2018Source: Bloomberg, IIFL Research

Lower subsidies, higher taxes,disinvestment and higher petroleum taxeshave helped the Central Government toreduce the fiscal deficit over the years.
Benign food inflation and lower crude oilprices have led the decline in the consumerinflation.
5
Macro Overview
Source: IIFL Research
1.11.0
0.91.0
1.5
1.81.6
0.80.9
0.7
0.5
0.2 0.2 0.1
FY12 FY13 FY14 FY15 FY16 FY17 FY18
Lower Subsidies & Higher Taxes on Petroleum Sector (% of GDP)
Indirect taxes Subsidies
1.21.4
1.6
3.4
1.1
2.0
2.6 2.6
0.70.4 0.3 0.3
FY15 FY16 FY17 FY18
Disinvestment & Petroleum Taxes are up 2-3x since FY14Disinvestments Indirect taxes on petroleum sector Petroleum subsidies
9.8 9.5
5.95.0
4.33.8
FY13 FY14 FY15 FY16 FY17 FY18
Consumer inflation has declined YoY (%)

Crude oil price has plunged ~37% in last 2months as US waived off eight countries toimport oil from Iran. Higher oil productionby US and OPEC also reduced the dearth ofoil. Meanwhile, INR also gained someground and strengthened ~6% against USDin last 2 months.
US has been pressurizing Saudi Arabia tocompensate the undersupply created bythe Iran sanctions and the latter has givenpositive indications. If this materializes wewill see moderation in the prices of oil.
In case if oil price rebounds again, the CADwill widen and weaken the INR againstUSD, and accelerate inflation forcing RBI tofurther hike interest rates. This may lead toa negative impact on interest sensitivesectors, however positive impact will bewitnessed in export oriented and importsubstitution stories.
6
Crude oil - A joker in the pack
55
60
65
70
75
Dec/
13
Mar
/14
Jun/
14
Sep/
14
Dec/
14
Mar
/15
Jun/
15
Sep/
15
Dec/
15
Mar
/16
Jun/
16
Sep/
16
Dec/
16
Mar
/17
Jun/
17
Sep/
17
Dec/
17
Mar
/18
Jun/
18
Sep/
18
Dec/
18
USDINR
20
30
40
50
60
70
80
90
100
110
120
Dec/
13
Mar
/14
Jun/
14
Sep/
14
Dec/
14
Mar
/15
Jun/
15
Sep/
15
Dec/
15
Mar
/16
Jun/
16
Sep/
16
Dec/
16
Mar
/17
Jun/
17
Sep/
17
Dec/
17
Mar
/18
Jun/
18
Sep/
18
Dec/
18
Brent Crude Oil ($)
Source: Bloomberg, IIFL Research

Currently, the market is trading at ~14.5%premium to its 10-year average P/E ratioafter earnings downgrade from ~20% to~14% in FY19.
The bond yields have cooled followingreceding oil prices, strengthening INRagainst USD and open market operationsby RBI to infuse liquidity. However, thespread between earnings yield and bondyield continues to widen due to premiumequity valuations.
Moreover, general election in May 2019has made investors extra cautious.
Thus, in 2019, investors should focus onsustainability of earnings growth thanpercentage of growth while investing incurrent round of market uncertainty. Assmall-caps and mid-caps are down by morethan 30%, one can start to bottom fish ingood quality companies but avoidaveraging stocks whose fundamentals havedeteriorated significantly. 7
Earnings downgrade increases equity valuations
8.0
10.0
12.0
14.0
16.0
18.0
Dec/
08
Jun/
09
Dec/
09
Jun/
10
Dec/
10
Jun/
11
Dec/
11
Jun/
12
Dec/
12
Jun/
13
Dec/
13
Jun/
14
Dec/
14
Jun/
15
Dec/
15
Jun/
16
Dec/
16
Jun/
17
Dec/
17
Jun/
18
Dec/
18
Nifty Forward P/EP/E Ratio (Next Ann) 10 year Avg +1 Std dev -1 Std dev
2.0
4.0
6.0
8.0
10.0
12.0
Jun/
05De
c/05
Jun/
06De
c/06
Jun/
07De
c/07
Jun/
08De
c/08
Jun/
09De
c/09
Jun/
10De
c/10
Jun/
11De
c/11
Jun/
12De
c/12
Jun/
13De
c/13
Jun/
14De
c/14
Jun/
15De
c/15
Jun/
16De
c/16
Jun/
17De
c/17
Jun/
18De
c/18
Yield SpreadEarning Yield (%) Bond Yield (%)
Source: Bloomberg, IIFL Research

Model Portfolios – Direct Equity
8

Aggressive Model Portfolio
9
No. Company Allocation (%)
1 Apollo Tyres 8.02 Axis Bank 7.03 Bajaj Finance 7.04 Chola. Invest & Fin. 8.05 ICICI Bank 7.06 Indian Energy Exch 8.07 Jubilant LifeScience 8.08 KEC International 9.09 L&T Infotech 8.0
10 Mindtree Ltd 8.011 Navin Fluorine Intl 7.012 Petronet LNG 7.013 TeamLease Services 8.0
Total 100.0
Aggressive model portfolio – Equity
Model Portfolio vs. Benchmark
Investment Objective & Portfolio Strategy
The objective of the strategy is to generate long term capital appreciation for investors from a portfolio ofequity and equity related securities.
The investment strategy is to invest in companies that are available at significant discount to their intrinsicvalue and provide earnings visibility. The strategy takes a concentrated position in stocks and endeavours tostrategically change allocation between sectors depending on change in the business cycles.
100
110
120
130
140
150
Feb-
17
Apr-
17
Jun-
17
Aug-
17
Oct
-17
Dec-
17
Feb-
18
Apr-
18
Jun-
18
Aug-
18
Oct
-18
Dec-
18
Aggressive NIFTY 50

10
Aggressive model portfolio – Equity
Market Cap Allocation
Large cap28%
Mid cap40%
Small cap32%
Sector Allocation
Risk Reward Statistics
Portfolio Beta 1.00
Sharpe Ratio 3.2
Portfolio Std. Deviation 34.8
Valuation Multiples (Forward)Large Cap P/E 18.9Mid Cap P/E 14.1Small Cap P/E 22.3Portfolio P/E 18.1Portfolio P/B 4.0Nifty P/E 16.1Nifty P/B 2.5
IT16%
NBFC15%
Banks14%
Capital Goods9%
Power Exchange
8%
Tyres8%
Pharma8%
Staffing8%
Chemicals7%
Gas7%

Aggressive model portfolio – Equity
No. Company Sector Outlook
1 Axis Bank
Banks
Axis Bank is expected to benefit from new CEO to accelerate the transition process,robust NII growth, decline in loan loss provisioning and earnings recovery.
2 ICICI Bank The standalone bank is undervalued, core revenue growth is gathering momentum,asset quality is improving and valuations appear attractive.
3 MindTree IT
Strong deal wins and sustained growth in top clients aided by new growth channelsand strong digital offerings. This would allay growth concerns and recentunderperformance presents good investment opportunity.
4 LTI The company is set to benefit from its focused micro-vertical led strategy, clientmining, strong deal inflow and deal pipeline.
5 IEX Power Exchange
Linking of DSM prices to exchange price and creation of a real time power marketcould further increase exchange volumes over the next 2-3 years. Strong volumegrowth likely to support EPS CAGR of 15% p.a. over FY19-21E. Superior returnratios (ROE ~50%) and dividend payout (>50%) justifies premium valuations for IEX(27x FY20E EPS).
6 KEC International Capital Goods
Traction in power T&D segment due to increased focus on international T&Dmarket. To benefit from healthy railway pipeline in FY19-20. Margins to expand,driven by increasing operating efficiencies and contribution from high marginrailways and civil business. KEC’s order book stood around `20,000cr by Q2FY19.
7 Apollo Tyres Tyres
Apollo Tyres is best placed among peers given its lower exposure to the highlycompetitive 2W tyre space and ramping up of operations at its low-cost Hungaryplant. Given that tyre companies derive 66% volumes from after-market, the recentslowdown in Auto OEM volumes will have limited impact. Company took price hikesbetween Sep-Nov'18 to offset input cost inflation. Recent cooling off in crude pricesand stable natural rubber prices will steer 160bps EBITDA margin expansion to12.7% in FY20E.
11

Aggressive model portfolio – Equity
No. Company Sector Outlook
8 Jubilant Life Pharma
Jubilant’s Specialty injectable business is expected to grow due to Rubyfill launch inthe US market, Venom products business to likely benefit after ALK-Abello hasexited the US market. Jubilant’s diversified business is expected to deliver revenueand PAT CAGR of 9% and 12% over next three years, current valuation i.e. 7x FY21EEV/EBITDA looks attractive.
9 Bajaj Finance NBFC Adequately capitalized with better loan growth, strong asset quality and earningsgrowth.
10 TeamLease Services StaffingThe company should perform well after recent disruption on higher penetration offlexi staffing across sectors, industry consolidation and favorable margin levers inplace.
11 CIFC NBFC
We expect growth in CIFC’s loan book to be driven by an uptick in demand forvehicle finance and home loans. We further expect to see traction in VF loan bookat ~15% CAGR over FY18-20E due to disbursements. Home loans are expected topick up pace due to government’s initiatives like Credit-Linked Subsidy Scheme(CLSS) under PMAY.
12 Navin Fluorine Chemicals
We expect higher volumes on ramp-up of existing Dewas plant capacity underCRAMS business. It's specialty chemical segment is likely to gain traction oncustomer acquisition for new value-added products in pharma intermediates.Overall, we expect revenue CAGR of 19% with ~23% EBITDA margin over FY18-20Econsidering the lag in passing on input cost pressures. We expect the company toremain debt free at net-debt level.
13 Petronet LNG Gas Petronet LNG is expect to benefit from Dahej terminal expansion, improvement in Kochi terminal utilization and attractive valuations
12

Aggressive model portfolio – Equity
13
Absolute % Returns CAGR % Return Quant's
Sr. No Scheme Name Allocation
(%) 6 M 1 Yr 2 Yr 3 Yr 1 Yr FwdPE
1 Yr FwdP/BV Beta
1 Apollo Tyres 8.0 -11.1 -13.9 10.9 14.6 10.8 1.2 1.4
2 Axis Bank 7.0 21.7 11.4 18.8 11.0 16.5 2.2 1.2
3 Bajaj Finance 7.0 10.6 46.1 78.6 63.5 30.9 6.4 1.4
4 Chola. Invest & Fin. 8.0 -22.0 -4.6 14.2 23.1 15.9 2.5 1.5
5 ICICI Bank 7.0 27.4 13.7 24.2 14.8 15.3 2.0 1.3
6 Indian Energy Exch 8.0 3.4 4.1 -- -- 26.0 11.9 0.3
7 Jubilant LifeScience 8.0 -1.8 -9.4 10.4 19.4 10.0 1.9 1.0
8 KEC International 9.0 -15.9 -21.1 46.3 22.8 12.2 2.5 0.8
9 L&T Infotech 8.0 1.3 54.8 58.4 -- 17.9 5.3 1.0
10 Mindtree Ltd 8.0 -11.8 40.5 32.8 5.5 16.0 3.7 0.9
11 Navin Fluorine Intl 7.0 7.5 -15.7 20.2 22.5 16.9 2.7 0.8
12 Petronet LNG 7.0 7.3 -11.3 11.4 22.6 12.8 2.7 0.7
13 TeamLease Services 8.0 -5.1 15.7 79.8 -- 34.8 7.2 0.4
Total 100.0
Returns and ratios as on December 28, 2018

Aggressive Model Portfolio
14
No. What’s in Rationale
1 KEC Increasing momentum in international T&D coupled with high margin railways and civil business to drive future growth.
2 CIFC We estimate 25% earnings CAGR over FY18-21E led by strong loan growth and reduction in cost ratios. RoE is likely to improve to c21.3% by FY21E from 19.5% in FY18.
3 Mindtree Prefer Mindtree as new growth channels and strong digital offerings would allay concerns.
Aggressive model portfolio – Equity
No. What’s Out Rationale
1 MothersonSumi (MSSL)
Motherson Sumi faces certain headwinds in its India business (lower volumes, delay in cost pass-through)and pressure on SMP margins (high start-up costs), which may persist for a couple of quarters more. Theongoing trade tariff war and uncertainty surrounding Brexit poses biggest challenge to the company'searnings. Already, some of MSSL's clients have issued profit warnings for the year due to prevailingconditions. MSSL remains a solid franchise given its strong management pedigree, diversified global presenceand acquisition-led growth strategy, which has helped hasten revenue growth. However, in the currentscenario, we prefer to avoid the stock, since global factors are difficult to predict.
2 Sun TvCompany saw viewership loss in its key channels in past 1 year. Further, it is evident through media reportsthat Superstar Rajinikant is launching 3 new channels ahead of his political party's launch, which may impactthe viewership. Hence, these two factors may impact Sun's advertising revenues.
3 Mphasis Switched to Mindtree on better measurable (ROE, EPS CAGR and Cheaper valuation).
Aggressive Model Portfolio
15
No. Company Allocation (%)
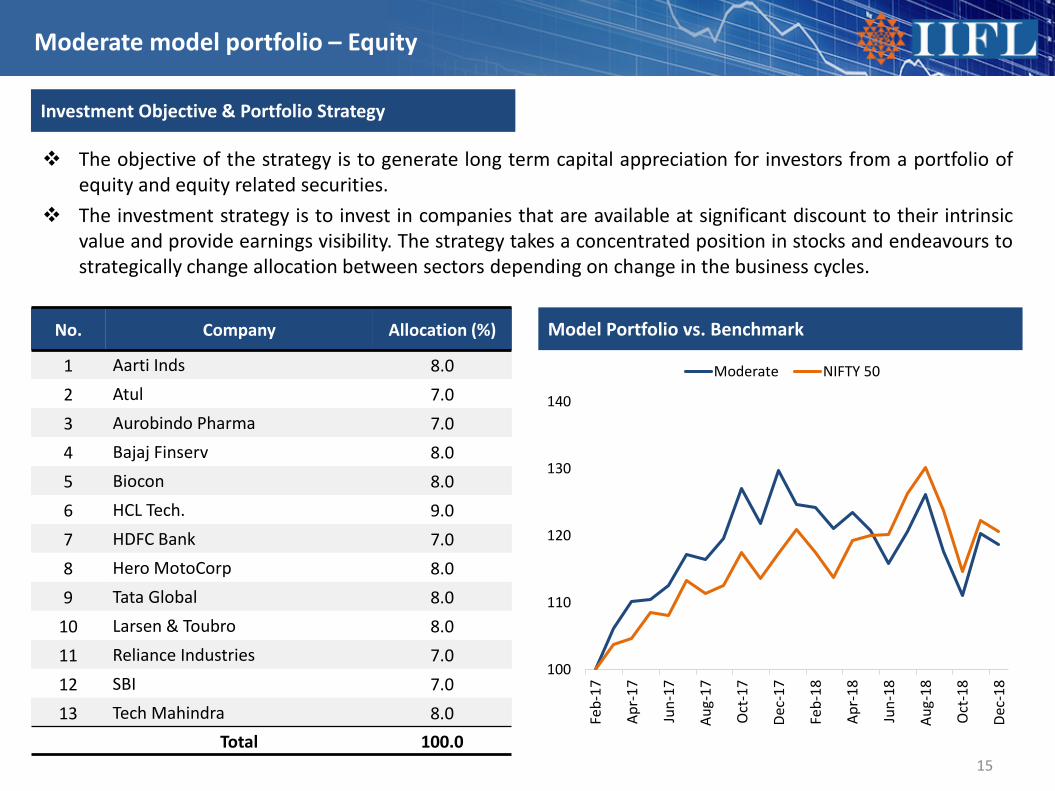
1 Aarti Inds 8.02 Atul 7.03 Aurobindo Pharma 7.04 Bajaj Finserv 8.05 Biocon 8.06 HCL Tech. 9.07 HDFC Bank 7.08 Hero MotoCorp 8.09 Tata Global 8.0
10 Larsen & Toubro 8.011 Reliance Industries 7.012 SBI 7.013 Tech Mahindra 8.0
Total 100.0
Moderate model portfolio – Equity
Model Portfolio vs. Benchmark
Investment Objective & Portfolio Strategy
The objective of the strategy is to generate long term capital appreciation for investors from a portfolio ofequity and equity related securities.
The investment strategy is to invest in companies that are available at significant discount to their intrinsicvalue and provide earnings visibility. The strategy takes a concentrated position in stocks and endeavours tostrategically change allocation between sectors depending on change in the business cycles.
100
110
120
130
140
Feb-
17
Apr-
17
Jun-
17
Aug-
17
Oct
-17
Dec-
17
Feb-
18
Apr-
18
Jun-
18
Aug-
18
Oct
-18
Dec-
18
Moderate NIFTY 50

16
Moderate model portfolio – Equity
Market Cap Allocation
Large cap77%
Mid cap8%
Small cap15%
Risk Reward Statistics
Portfolio Beta 0.95
Sharpe Ratio 3.2
Portfolio Std. Deviation 28.0
Valuation Multiples (Forward)Large Cap P/E 17.8Mid Cap P/E 23.2Small Cap P/E 20.2Portfolio P/E 18.4Portfolio P/B 3.2Nifty P/E 16.1Nifty P/B 2.5
IT17%
Diversified15%
Chemicals15%Pharma
15%
Banks14%
FMCG8%
Auto8%
Infra8%
Sector Allocation

Moderate model portfolio – Equity
No. Company Sector Outlook
1 HCL Tech
IT
Valuation is attractive and would benefit from consistent investments in IPpartnerships. The company is expected to perform well on recovery in IMS andhigher traction in ER&D segment.
2 Tech MahindraTo benefit from 5G rollouts FY20 onwards. Its LCC and Altiostar networkacquisitions would differentiate its offerings. Additionally, focus on IoT basedplatforms would drive telecom revenues.
3 HDFC Bank
Banks
Beneficiary of better loan growth, high operating efficiency, robust capital positionand relatively superior asset quality.
4 SBI Beneficiary of normalisation of credit cost, loan book improvement and focus onhigh margin retail book.
5 Tata Global FMCG Attractive valuations, restructuring of international business and improvement inoperational performance of Starbucks
6 Bajaj Finserv Diversified
We expect Bajaj Allianz General Insurance's earnings to witness CAGR of ~18% overFY18-20E on regulatory changes in motor TP (third-party) segment and healthinsurance. Its life insurance business is expected to stabilize over the next two yearswith focus towards a sustainable product mix leading to increase in value of newbusiness (VNB) margin. The AUM of lending vertical i.e. Bajaj Finserv is expected toregister CAGR of ~30% over FY18-20E, aided by lifestyle finance and personal-loan-cross-sell segments.
17

Moderate model portfolio – Equity
No. Company Sector Outlook
7 Atul Ltd
Chemicals
We expect Atul to benefit from increase utilization levels of newly-commissionedcapacities. The ramp-up of existing capacities have a potential to add revenueamounting to Rs740cr over next few years. Atul is a beneficiary of increasingcompetitive intensity of Indian chemical players globally with strong integratedproduct offering.
8 Aarti
We expect Aarti to be a key beneficiary of manufacturing outsourcing, underpinnedby a low-cost and high-quality manufacturing edge. Rising costs in China due toshutdown of capacities (regulatory clampdown) is a major tailwind. Robustearnings growth is likely to be driven by improving utilization of new capacities,rupee depreciation vs. dollar, better realizations and recent multi-period projectwins.
9 Reliance Industries Diversified Reliance Industries is expected to benefit from strong petrochemicals volumegrowth, improvement in GRMs and traction in Jio subscribers
10 Hero Moto Corp (HMCL) Auto
We expect volumes for the 2W space to pick up as the wedding season commencesand also due to upcoming elections in CY2019. The recent farm loan waivers mayalso stimulate 2W sales as it puts more money in the hands of farmers. HMCL’smargin contraction has been limited to 180bps over past 8 quarters vs. Bajaj Auto's380bps contraction. It is also trading cheaper compared to peers (12x FY20E EPS,vs. 28x for TVSM and 15x for BJAUT). Hence, we prefer HMCL to its 2W peers.
11 Larsen & Toubro (L&T) Infrastructure Larsen and Toubro is expected to benefit from strong order-book (Rs2.8 lakh cr),pick up in execution and improvement in working capital.
18

Moderate model portfolio – Equity
No. Company Sector Outlook
12 Biocon
Pharma
Mylan/Biocon has launched Pegfilgrastim in the US while Trastuzumab is expected to be launched in H1FY20E, Insulin Glargine is expected to be launched in early 2019 in EU, while US launch is expected in 2020E. We expect Biocon to deliver PAT growth of ~5x over next five years due to the strong contribution from these three products in the US and EU.
13 Aurobindo Pharma
Due to diversified US product portfolio, Aurobindo's US business has grown from $792m in FY16 to $1156mn in FY18. Despite the challenging environment for generic companies, Aurobindo is expected to do well due to recent launch of Ertapenem injection as well as launch of 10-12 OTC products in US. We expect Revenue/PAT CAGR of 27%/29% over next three years, including Sandoz deal.
19

Moderate model portfolio – Equity
20
Absolute % Returns CAGR % Return Quant's
Sr. No Scheme Name Allocation
(%) 6 M 1 Yr 2 Yr 3 Yr 1 Yr FwdPE
1 Yr FwdP/BV Beta
1 Aarti Inds 8.0 18.1 32.7 44.8 40.9 20.4 5.1 0.7
2 Atul 7.0 29.9 26.6 31.0 28.2 19.6 3.2 0.7
3 Aurobindo Pharma 7.0 16.0 3.2 5.1 -6.5 13.5 2.5 1.0
4 Bajaj Finserv 8.0 7.0 20.1 52.9 49.0 23.7 3.7 1.4
5 Biocon 8.0 -3.8 13.3 41.7 53.4 34.2 5.3 1.1
6 HCL Tech. 9.0 3.2 7.2 8.6 3.3 11.9 2.7 0.5
7 HDFC Bank 7.0 -0.3 13.4 33.3 25.1 21.8 3.4 0.7
8 Hero MotoCorp 8.0 -11.5 -17.1 1.6 5.2 16.5 4.8 0.9
9 Larsen & Toubro 8.0 15.2 13.1 25.6 18.1 19.9 2.9 1.1
10 Reliance Industries 7.0 16.0 21.4 45.1 30.7 13.2 1.8 1.4
11 SBI 7.0 11.5 -7.1 8.3 8.4 9.5 1.1 1.4
12 Tata Global Beverage 8.0 -16.6 -27.6 35.6 15.1 23.2 1.8 1.1
13 Tech Mahindra 8.0 -0.8 40.8 22.9 10.9 13.2 2.6 0.6
Total 100.0
Returns and ratios as on December 28, 2018
Aggressive Model Portfolio
21
Moderate model portfolio – Equity
No. What’s in Rationale
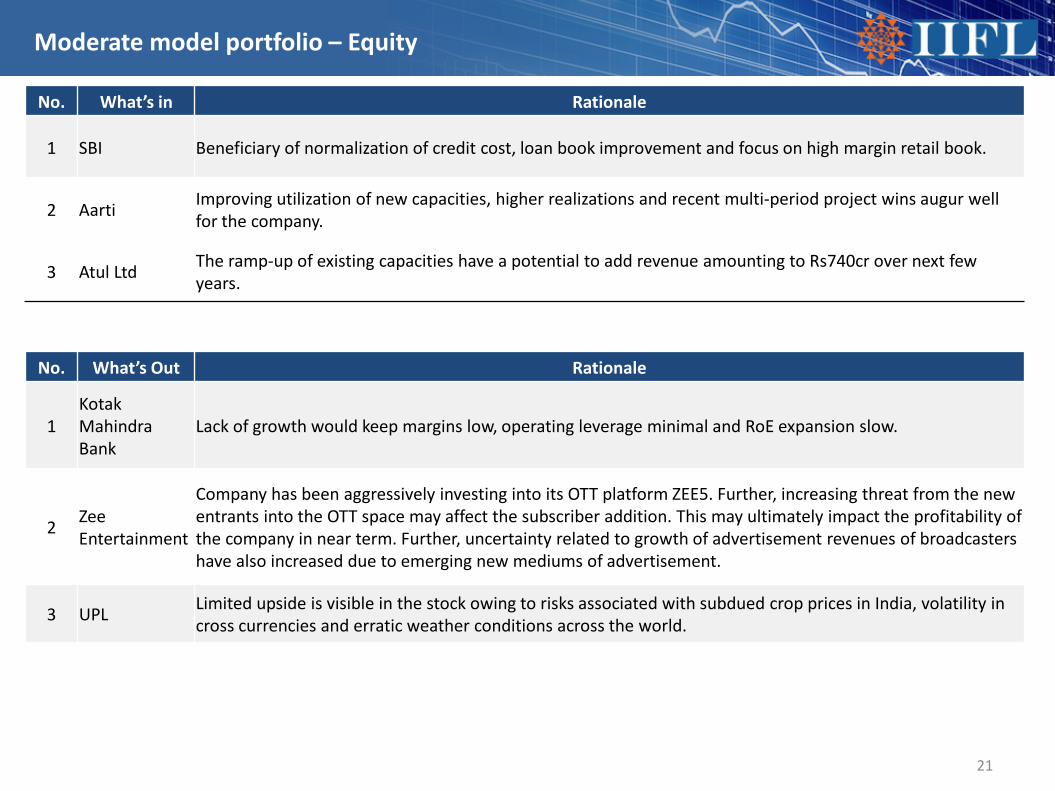
1 SBI Beneficiary of normalization of credit cost, loan book improvement and focus on high margin retail book.
2 Aarti Improving utilization of new capacities, higher realizations and recent multi-period project wins augur well for the company.
3 Atul Ltd The ramp-up of existing capacities have a potential to add revenue amounting to Rs740cr over next few years.
No. What’s Out Rationale
1Kotak Mahindra Bank
Lack of growth would keep margins low, operating leverage minimal and RoE expansion slow.
2 Zee Entertainment
Company has been aggressively investing into its OTT platform ZEE5. Further, increasing threat from the new entrants into the OTT space may affect the subscriber addition. This may ultimately impact the profitability of the company in near term. Further, uncertainty related to growth of advertisement revenues of broadcasters have also increased due to emerging new mediums of advertisement.
3 UPL Limited upside is visible in the stock owing to risks associated with subdued crop prices in India, volatility in cross currencies and erratic weather conditions across the world.

Aggressive Model Portfolio
22
No. Company Allocation
1 Asian Paints 7.02 Biocon 8.03 Coromandel Interntl. 7.04 Dabur India 8.05 HCL Tech. 8.06 HDFC Bank 6.07 ICICI Lombard 9.08 Infosys 8.09 ITC 8.0
10 Maruti Suzuki 8.011 Power Grid Corpn. 9.012 Reliance Industries 8.013 Tata Chemicals 6.0
Total 100%
Conservative model portfolio – Equity
Model Portfolio Vs Benchmark
Investment Objective & Portfolio Strategy
The objective of the strategy is to generate long term capital appreciation for investors from a portfolio ofequity and equity related securities.
The investment strategy is to invest in companies that are available at significant discount to their intrinsicvalue and provide earnings visibility. The strategy takes a concentrated position in stocks and endeavours tostrategically change allocation between sectors depending on change in the business cycles.
100
110
120
130
140
Feb-
17
Apr-
17
Jun-
17
Aug-
17
Oct
-17
Dec-
17
Feb-
18
Apr-
18
Jun-
18
Aug-
18
Oct
-18
Dec-
18
Conservative NIFTY 50

23
Conservative model portfolio – Equity
Market Cap Allocation
Large cap87%
Mid cap13%
Risk Reward Statistics
Portfolio Beta 0.84
Sharpe Ratio 4.7
Portfolio Std. Deviation 25.3
Valuation Multiples (Forward)Large Cap P/E 24.8Mid Cap P/E 14.6Portfolio P/E 23.4Portfolio P/B 4.8Nifty P/E 16.1Nifty P/B 2.5
Sector Allocation
FMCG 23%
IT16%
Power9%Insurance
9%
Auto8%
Pharma8%
Diversified8%
Agriculture7%
Banks6%
Chemical6%

Conservative model portfolio – Equity
No. Company Sector Outlook
1 ITC
FMCG
Market share gain in FMCG, recovery in cigarette segment (acceptance of highcigarette price among consumers and volume growth) and attractive valuation
2 Dabur Beneficiary of increasing rural reach, market share gain and new product launches
3 Asian Paints Leadership position (~54% market share), capacity expansion (1.1mn MT currentlyto 2.2mn MT over next 1-1.5 years) and price hikes to aid growth
4 Maruti Suzuki (MSIL) Auto
The PV sector currently faces headwinds by way of weak demand, higher cost ofownership and discounting in the system. The management recently indicatedsingle-digit volume growth in FY19E. However, MSIL continues to command ~50%PV market share in India with strong recall for its models. Despite the sectoralheadwinds, MSIL remains best placed to benefit from BS-VI implementation. MSIL'spetrol-heavy portfolio will see lower price increase compared to diesel vehicles,hence impact on demand will be minimal.
5 HDFC Bank Banks Beneficiary of better loan growth, high operating efficiency, robust capital positionrelatively superior asset quality.
6 Power Grid Corp PowerHealthy capitalization of Rs27,000cr per annum to support PAT CAGR of 19% overFY18-20E. Capitalization likely to pick up in 2HFY19 given the lumpy nature ofproject execution. Valuations inexpensive at 8.8x FY20E EPS.
7 ICICI Lombard General (ILom) Insurance
ILom is well positioned to capture the growth potential in the sector driven bysignificant lower penetration and market share gains from PSUs. Changes inregulations, especially under motor segment, improving competitive dynamics andILOM’s conservative strategy of focusing on profitability will likely acceleratepremium growth and improvement in loss ratios.
24

Conservative model portfolio – Equity
No. Company Sector Outlook
8 HCL Tech
IT
Valuation is attractive and would benefit from consistent investments in IPpartnerships. The company is expected to perform well on recovery in IMS andhigher traction in ER&D segment.
9 InfosysFocus on execution and investments behind digital to drive revenues.Infosys announced large deal wins worth TCV of $2bn+, its highest ever. This wouldprovide strong revenue visibility.
10 Biocon Pharma
Mylan/Biocon has launched Pegfilgrastim in the US while Trastuzumab is expected to be launched in H1FY20E, Insulin Glargine is expected to be launched in early 2019 in EU, while US launch is expected in 2020E. We expect Biocon to deliver PAT growth of ~5x over next five years due to the strong contribution from these three products in the US and EU.
11 Coromandel Intl Agriculture
Coromandel is likely to benefit from capacity augmentation in phosphoric acid,providing strong backward integration. Enhanced capacity of mancozeb (crop-protection segment) from Sarigam plant and Dahej plant will help the companygain market access in new geographies. We expect moderation in input costscoupled with likely price hikes, leading to improvement in operating margin.
12 Tata Chemical (TCL) Chemical
TCL’s international business is likely to recover during H2FY19 with full utilizationlevel in North America and recovery in UK business. The global market for soda ashis expected to stabilize leading to firmness in soda ash realizations with fullabsorption of additional capacities in Turkey. We expect TCL's consumer productsand nutritional solutions business to gain traction with new product offerings andcommissioning of additional capacities.
13 Reliance Industries Diversified Reliance Industries is expected to benefit from strong petrochemicals volumegrowth, improvement in GRMs and traction in Jio subscribers.
25

Conservative model portfolio – Equity
26
Absolute % Returns CAGR % Return Quant's
Sr. No Scheme Name Allocation
(%) 6 M 1 Yr 2 Yr 3 Yr 1 Yr FwdPE
1 Yr FwdP/BV Beta
1 Asian Paints 7.0 8.1 19.0 24.9 15.7 48.5 12.2 1.0
2 Biocon 8.0 -3.8 13.3 41.7 53.4 34.2 5.3 1.1
3 Coromandel Interntl. 7.0 11.4 -20.0 28.2 33.0 15.2 3.1 0.6
4 Dabur India 8.0 9.6 22.2 26.1 15.7 42.5 10.9 1.0
5 HCL Tech. 8.0 3.2 7.2 8.6 3.3 11.9 2.7 0.5
6 HDFC Bank 6.0 -0.3 13.4 33.3 25.1 21.8 3.4 0.7
7 ICICI Lombard General Ins 9.0 22.1 11.0 -- -- 31.9 6.2 0.4
8 Infosys 8.0 3.6 27.1 14.7 6.2 15.6 3.9 0.6
9 ITC 8.0 6.6 6.6 9.3 9.1 24.7 5.7 0.8
10 Maruti Suzuki 8.0 -15.7 -22.2 19.8 17.7 21.2 4.1 1.1
11 Power Grid Corpn. 9.0 4.4 -2.4 4.1 11.8 10.1 1.5 0.5
12 Reliance Industries 8.0 16.0 21.4 45.1 30.7 13.2 1.8 1.4
13 Tata Chemicals 6.0 -0.5 -4.5 20.3 19.9 14.0 1.4 0.9
Total 100.0
Returns and ratios as on December 28, 2018

Aggressive Model Portfolio
27
Conservative model portfolio – Equity
No. What’s in Rationale
1 Asian Paints Limited downside in the stock; raw material deflation a key positive.
2 ITC Prefer ITC in FMCG space given the comfort on valuations; replaced GSK Consumer.
No. What’s Out Rationale
1 GSK Consumer Upside owing to Horlicks deal played out. Now the price will be linked to the price of HUL.

Mutual Funds
28

29
Top 5 recommended mutual funds
Scheme Name Fund Manager AUM (` cr)
1M(%)
6 M(%)
1 Y (%)
3 Y (%)
5 Y (%)
ICICI Pru Equity & Debt Fund(G) Sankaran Naren 26,566 1.7 4.2 -1.7 11.6 15.6
Axis Bluechip Fund(G) Shreyash Devalkar 3,295 2.4 0.5 7.0 12.7 14.5
Tata Equity P/E Fund(G) Sonam Udasi 5,021 2.4 -1.6 -6.6 14.7 20.7
Franklin India Prima Fund(G) R. Janakiraman 6,374 3.1 0.2 -8.8 11.2 21.1
IDFC Tax Advt(ELSS) Fund(G) Daylynn Pinto 1,689 1.2 -2.4 -9.2 11.9 16.2
Returns less than 1 year are absolute; Returns greater than 1 year are CAGR.AUM as on: November 2018; Returns as on December 28, 2018Source: ACE MF
Equity is the best way to create wealth in long term vs. other asset classes like debt, gold, realestate, etc., since historically it has been seen that equity based investments have given inflationbeating returns over long term despite short term volatilities. Equity mutual fund is a right wayfor investors to invest in equity market who do not have time and/or knowledge to understandthe equity market.
The Indian mutual fund industry is well regulated, transparent and mature. Instead of timing themarket, investors can regularly invest in the market and can reap the benefit of ‘Rupee CostAveraging’ via SIP.
Thus, we present some mutual fund recommendations to create wealth in the long term.

30
ICICI Pru Equity & Debt Fund
Fund Benchmark CRISIL Hybrid 35+65 - Aggressive Index AUM (`cr) 26,566
Inception Date Nov 1999 Exit Load Nil on 10% of units within 1Y and 1% for more than 10% of units within 1Y, Nil after 1Y
Fund Manager Sankaran Naren, Atul Patel Expense Ratio 1.95%
Fund Basic Details
-2.0
11.7
15.7
2.7
11.312.9
1 Year 3 Years 5 YearsFund Benchmark
Asset Allocation It is an equity-oriented balanced fund, which does tacticalallocation between debt and equity based on the marketoutlook to ensure optimal risk reward.
The fund increases its exposure in debt when the equitymarket is overvalued and increases its allocation to equitywhen it is undervalued.
As of November 2018, the fund had invested ~68% of AUMin equity, ~20% was allocated to debt and ~10% (~`2,733cr)was in cash. The fund had invested ~60% of the AUM inlarge-cap stocks, while ~8% was invested in mid-cap andsmall-cap stocks.
Investors who want to follow balanced approach i.e. 65%equity and ~35% debt, can invest in the scheme to createwealth in the long term.
Returns (%)
60%
5%3%
20%
12% Large Cap
Mid Cap
Small Cap
Debt
Others
Returns less than 1 year are absolute; Returns greater than 1 year are CAGR.Portfolio as on: November 2018; Returns as on December 28, 2018 Source: ACE MF

31
Axis BlueChip Fund
Fund Benchmark NIFTY 50 - TRI AUM (` cr) 3,295
Inception Date Jan 2010 Exit Load Nil on 10% of units within 1Y and 1% for more than 10% of units within 1Y, Nil after 1Y
Fund Manager Shreyash Devalkar Expense Ratio 2.30%
Fund Basic Details
Asset Allocation It is an equity fund which primarily invests in top 100 stocks
by market capitalization. The fund invests in companieswhich have significant market share and are leaders in theirrespective industries.
The fund’s strategy is to invest in quality companies withcredible management, sustainable profit growth & cashflow, and having a clean balance sheet.
As of November 2018, the fund had invested ~80% of AUMin large-cap stocks and ~15% (~`511cr) in cash. The fundhad highest allocation to Private Banks (~25%), followed byIT (~8.5%), and NBFC (~6.8%).
Investors who want to primarily invest in diversifiedportfolio of large-cap stocks can invest in this fund to createwealth in the long term.
Returns (%)
79%
1%
20% Large Cap
Mid Cap
Others
6.5
12.714.6
4.6
12.7 12.9
1 Year 3 Years 5 YearsFund Benchmark
Returns less than 1 year are absolute; Returns greater than 1 year are CAGR.Portfolio as on: November 2018; Returns as on December 28, 2018 Source: ACE MF

32
Tata Equity P/E Fund
Fund Benchmark S&P BSE Sensex - TRI AUM (`cr) 5,021
Inception Date June 2004 Exit Load Nil upto 12% of investments and 1% for remaining investments on or before 18M, Nil after 18M
Fund Manager Sonam Udasi, Amey Sathe Expense Ratio 2.08%
Fund Basic Details
Asset Allocation It is a value-conscious equity fund that aims to invest 70-100% of its AUM in stocks whose 12-month rolling PE ratiois lower than the 12-month rolling PE ratio of the BSESensex. The remaining AUM is allocated to other equityand debt instruments.
As of November 2018, the fund had invested ~61% of AUMin large-cap stocks, ~23% was allocated to mid-cap andsmall-cap stocks, and ~16% (~`832cr) in cash. The fund hadthe highest allocation to HFC (~9.8%), followed by PrivateBanks (~7.0%) and IT (~6.2%).
Investors who are value conscious and want to invest inlarge cap and mid cap stocks can invest in the fund tocreate wealth in the long term.
Returns (%)
61%15%
8%
16% Large Cap
Mid Cap
Small Cap
Others
-7.2
14.8
20.9
7.3
13.1 12.8
1 Year 3 Years 5 YearsFund Benchmark
Returns less than 1 year are absolute; Returns greater than 1 year are CAGR.Portfolio as on: November 2018; Returns as on December 28, 2018 Source: ACE MF

33
Franklin India Prima Fund
Fund Benchmark Nifty Midcap 150 - TRI AUM (` cr) 6,374
Inception Date Dec 1993 Exit Load 1% on or before 1Y, Nil after 1Y
Fund Manager R. Srinivasan, Hari Shyamsunder Expense Ratio 2.05%
Fund Basic Details
Asset Allocation It predominantly invests in small-cap and midcap stocks,which tend to exhibit higher growth than large-cap stocks.
It aims to identify and invest in companies which are at anearly stage of the business life cycle, as they have anenormous potential to grow.
As of November 2018, the fund had invested ~65% of AUMin mid-cap stocks, ~16% was in large-cap stocks and ~11%was allocated to small-cap stocks. The fund had the highestallocation to Private Banks (~12.7%), followed by Bearings(~4.7%) and Engineering - Industrial Equipments (~4.4%).
Investors who want to primarily invest in midcap stocks caninvest in this fund to create wealth in long term.
Returns (%)
16%
65%
11%
8% Large Cap
Mid Cap
Small Cap
Others
-9.8
11.1
21.2
-13.1
13.2
21.0
1 Year 3 Years 5 YearsFund Benchmark
Returns less than 1 year are absolute; Returns greater than 1 year are CAGR.Portfolio as on: November 2018; Returns as on December 28, 2018 Source: ACE MF

34
IDFC Tax Advt (ELSS) Fund
Fund Benchmark S&P BSE 200 - TRI AUM (`cr) 1,689
Inception Date Dec 2008 Exit Load NIL
Fund Manager Daylynn Pinto Expense Ratio 2.22%
Fund Basic Details
Asset Allocation This fund is a tax saving fund i.e. ELSS which invests acrossmarket cap. The fund manager follows a blend of growthand value style of investing and uses bottom-up approachto select its stocks.
As of November 2018, ~46% of its AUM was invested inlarge-cap stocks, ~26% was allocated to small-cap stocksand ~20% was in mid-cap stocks. The fund had highestallocation to Private Banks (~15.2%), followed by IT (~8.6%)and Retailing (~5.9%).
Investors who want to save tax and invest in diversifiedportfolio across different market caps can invest in this fundto create wealth in the long term.
Returns (%)
46%
20%
26%
8% Large Cap
Mid Cap
Small Cap
Others
-9.7
11.916.2
0.7
12.9 14.5
1 Year 3 Years 5 YearsFund Benchmark
Returns less than 1 year are absolute; Returns greater than 1 year are CAGR.Portfolio as on: November 2018; Returns as on December 28, 2018 Source: ACE MF
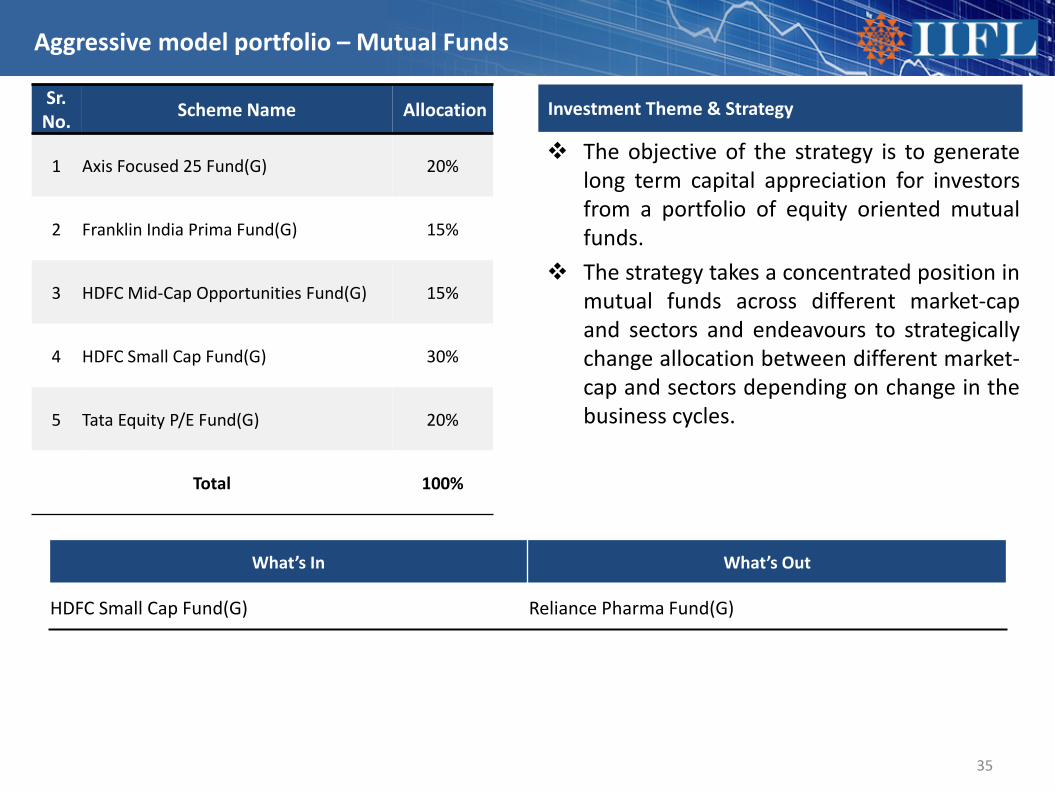
Aggressive Model Portfolio The objective of the strategy is to generatelong term capital appreciation for investorsfrom a portfolio of equity oriented mutualfunds.
The strategy takes a concentrated position inmutual funds across different market-capand sectors and endeavours to strategicallychange allocation between different market-cap and sectors depending on change in thebusiness cycles.
35
Aggressive model portfolio – Mutual Funds
Investment Theme & StrategySr. No. Scheme Name Allocation
1 Axis Focused 25 Fund(G) 20%
2 Franklin India Prima Fund(G) 15%
3 HDFC Mid-Cap Opportunities Fund(G) 15%
4 HDFC Small Cap Fund(G) 30%
5 Tata Equity P/E Fund(G) 20%
Total 100%
What’s In What’s Out
HDFC Small Cap Fund(G) Reliance Pharma Fund(G)

36
Aggressive model portfolio – Mutual Funds
Market Cap Allocation
Large Cap30%
Mid Cap28%
Small Cap29%
Other13%
Top 5 Sectors (%)
Top 5 AMC Wise Holdings
4.3
4.3
4.9
5.5
8.8
Pharma
Finance - Housing
Chemicals
IT - Software
Bank - Private
HDFC MF45%
Axis MF20%
Tata MF20%
Franklin India MF15%
Top 10 Stocks (%)
1.3
1.4
1.4
1.4
1.4
1.5
2.0
2.1
3.1
3.3
Aurobindo Pharma Ltd.
Balkrishna Industries Ltd.
SKF India Ltd.
Tata Consultancy Services Ltd.
Bajaj Finance Ltd.
Maruti Suzuki India Ltd.
Clearing Corporation Of India Ltd.
Kotak Mahindra Bank Ltd.
HDFC Bank Ltd.
HDFC Ltd.

Aggressive model portfolio – Mutual Funds
No. Scheme Name Rationale
1 Axis Focused 25 Fund(G)It is a focused fund that invests in high conviction stocks, maximum 25 stocks, from top 200 stocks bymarket capitalization. The fund’s strategy is to invest in quality companies with crediblemanagement, sustainable profit growth and cash flow, and having clean balance sheet.
2 Franklin India Prima Fund(G)
It predominantly invests in small-cap and mid-cap stocks, which tend to exhibit higher growth thanlarge-cap stocks. It aims to identify and invest in companies which are at an early stage of thebusiness life cycle, as they have an enormous potential to grow.
3 HDFC Mid-Cap Opportunities Fund(G)
This fund predominantly invests in a diversified portfolio of mid-cap companies which havereasonable growth prospects, sound financial strength, sustainable business models and acceptablevaluation.
4 HDFC Small Cap Fund(G)It is a small cap fund that invests at least 65% in small cap companies. The fund’s strategy is to investin companies operating in niche environment with strong financials and sustainable growthprospects.
5 Tata Equity P/E Fund(G)It is a value-conscious equity fund that aims to invest 70-100% of its AUM in stocks whose 12-monthrolling PE ratio is lower than the 12-month rolling PE ratio of the BSE Sensex. The remaining AUM isallocated to other equity and debt instruments.
37

Aggressive model portfolio – Mutual Funds
38
Absolute % Returns CAGR % Return Quant's
Sr. No Scheme Name Allocation
(%) 6 M 1 Yr 2 Yr 3 Yr PE Beta NAV
1 Axis Focused 25 Fund(G) 20.0 -1.5 1.7 22.1 15.5 41.6 0.9 26.8
2 Franklin India Prima Fund(G) 15.0 0.2 -8.9 13.3 11.2 35.1 0.7 923.6
3 HDFC Mid-Cap Opportunities Fund(G) 15.0 -1.5 -11.3 12.8 11.7 29.7 0.8 53.2
4 HDFC Small Cap Fund(G) 30.0 -1.0 -8.2 22.3 15.5 21.2 0.6 42.3
5 Tata Equity P/E Fund(G) 20.0 -1.6 -6.7 14.9 14.7 22.8 0.9 130.9
Total 100.0
Mutual Funds Performance
Returns and quants as on December 28, 2018

Aggressive Model Portfolio The objective of the strategy is to generatelong term capital appreciation for investorsfrom a portfolio of equity oriented mutualfunds.
The strategy takes a concentrated position inmutual funds across different market-capand sectors and endeavours to strategicallychange allocation between different market-cap and sectors depending on change in thebusiness cycles.
39
Moderate model portfolio – Mutual Funds
Investment Theme & StrategySr. No. Scheme Name Allocation
1 Axis Bluechip Fund(G) 30%
2 Axis Focused 25 Fund(G) 20%
3 Franklin India Prima Fund(G) 15%
4 HDFC Mid-Cap Opportunities Fund(G) 15%
5 Tata Equity P/E Fund(G) 20%
Total 100%
What’s In What’s Out
Axis Bluechip Fund(G) DSP Equity & Bond Fund(G)
Franklin India Prima Fund(G) ICICI Pru Equity & Debt Fund(G)

40
Moderate model portfolio – Mutual Funds
Market Cap Allocation
Large Cap53%
Mid Cap25%
Small Cap8%
Other14%
Top 5 Sectors (%)
Top 5 AMC Wise Holdings
Axis MF50%
Tata MF20%
HDFC MF15%
Franklin India MF15%
Top 10 Stocks (%)
1.8
2.0
2.4
2.9
3.3
3.5
4.4
4.6
6.4
7.7
Bajaj Finserv Ltd.
Reliance Industries Ltd.
Avenue Supermarts Ltd.
Tata Consultancy Services Ltd.
Maruti Suzuki India Ltd.
Bajaj Finance Ltd.
Kotak Mahindra Bank Ltd.
HDFC Ltd.
HDFC Bank Ltd.
Clearing Corporation Of India Ltd.
5.5
5.8
6.1
9.9
16.4
Finance - Housing
Finance - NBFC
IT - Software
Finance - Investment
Bank - Private
Moderate model portfolio – Mutual Funds
No. Scheme Name Rationale
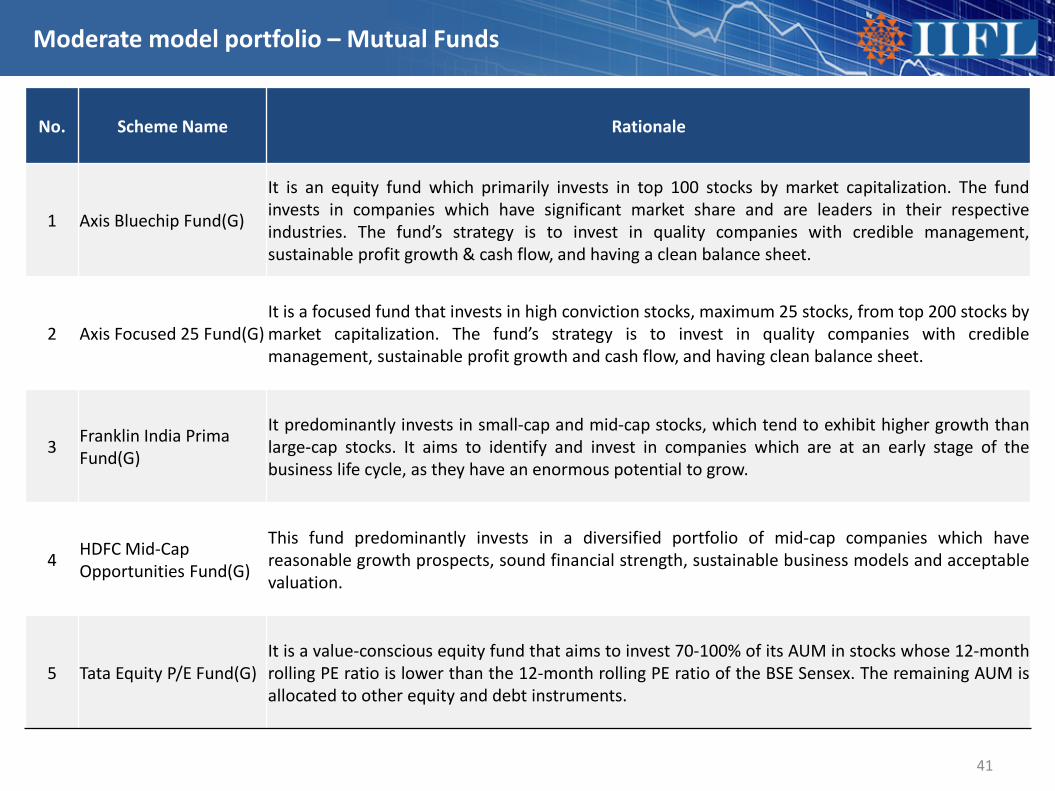
1 Axis Bluechip Fund(G)
It is an equity fund which primarily invests in top 100 stocks by market capitalization. The fundinvests in companies which have significant market share and are leaders in their respectiveindustries. The fund’s strategy is to invest in quality companies with credible management,sustainable profit growth & cash flow, and having a clean balance sheet.
2 Axis Focused 25 Fund(G)It is a focused fund that invests in high conviction stocks, maximum 25 stocks, from top 200 stocks bymarket capitalization. The fund’s strategy is to invest in quality companies with crediblemanagement, sustainable profit growth and cash flow, and having clean balance sheet.
3 Franklin India Prima Fund(G)
It predominantly invests in small-cap and mid-cap stocks, which tend to exhibit higher growth thanlarge-cap stocks. It aims to identify and invest in companies which are at an early stage of thebusiness life cycle, as they have an enormous potential to grow.
4 HDFC Mid-Cap Opportunities Fund(G)
This fund predominantly invests in a diversified portfolio of mid-cap companies which havereasonable growth prospects, sound financial strength, sustainable business models and acceptablevaluation.
5 Tata Equity P/E Fund(G)It is a value-conscious equity fund that aims to invest 70-100% of its AUM in stocks whose 12-monthrolling PE ratio is lower than the 12-month rolling PE ratio of the BSE Sensex. The remaining AUM isallocated to other equity and debt instruments.
41

Moderate model portfolio – Mutual Funds
42
Absolute % Returns CAGR % Return Quant's
Sr. No Scheme Name Allocation
(%) 6 M 1 Yr 2 Yr 3 Yr PE Beta NAV
1 Axis Bluechip Fund(G) 30% 0.5 7.1 22.2 12.7 42.7 0.9 27.0
2 Axis Focused 25 Fund(G) 20% -1.5 1.7 22.1 15.5 41.6 0.9 26.8
3 Franklin India Prima Fund(G) 15% 0.2 -8.9 13.3 11.2 35.1 0.7 923.6
4 HDFC Mid-Cap Opportunities Fund(G) 15% -1.5 -11.3 12.8 11.7 29.7 0.8 53.2
5 Tata Equity P/E Fund(G) 20% -1.6 -6.7 14.9 14.7 22.8 0.9 130.9
Total 100.0
Mutual Funds Performance
Returns and quants as on December 28, 2018

Aggressive Model Portfolio The objective of the strategy is to generatelong term capital appreciation for investorsfrom a portfolio of equity oriented mutualfunds.
The strategy takes a concentrated position inmutual funds across different market-capand sectors and endeavours to strategicallychange allocation between different market-cap and sectors depending on change in thebusiness cycles.
43
Conservative model portfolio – Mutual Funds
Investment Theme & StrategySr. No. Scheme Name Allocation
1 Axis Bluechip Fund(G) 30%
2 DSP Equity & Bond Fund(G) 15%
3 HDFC Equity Savings Fund(G) 20%
4 ICICI Pru Equity & Debt Fund(G) 15%
5 Kotak Equity Savings Fund(G) 20%
Total 100%
What’s In What’s Out
HDFC Equity Savings Fund(G) HDFC Short Term Debt Fund(G)
Kotak Equity Savings Fund(G) Tata Equity P/E Fund(G)

44
Conservative model portfolio – Mutual Funds
Market Cap Allocation
Large Cap59%
Mid Cap8%
Small Cap5%
Debt14%
Other14%
Top 5 Sectors (%)
Top 5 AMC Wise Holdings
Axis MF30%
HDFC MF20%
Kotak MF20%
DSP MF15%
ICICI Pru MF15%
Top 10 Stocks (%)
2.1
2.3
2.3
2.6
2.7
3.2
3.3
3.9
5.6
6.7
Reliance Industries Ltd.
Maruti Suzuki India Ltd.
Tata Consultancy Services Ltd.
Infosys Ltd.
Kotak Mahindra Bank Ltd.
HDFC Ltd.
Bajaj Finance Ltd.
ICICI Bank Ltd.
Clearing Corporation Of India Ltd.
HDFC Bank Ltd.
5.5
6.7
7.4
8.9
21.0
Finance - Housing
IT - Software
Finance - Investment
Finance - NBFC
Bank - Private

Conservative model portfolio – Mutual Funds
No. Scheme Name Rationale
1 Axis Bluechip Fund(G)
It is an equity fund which primarily invests in top 100 stocks by market capitalization. The fundinvests in companies which have significant market share and are leaders in their respectiveindustries. The fund’s strategy is to invest in quality companies with credible management,sustainable profit growth & cash flow, and having a clean balance sheet.
2 DSP Equity & Bond Fund(G)
It invests in equity for potential high-return and to curtain the volatility it invests in fixed incomeinstruments. Fund manages a well-diversified equity portfolio. It invests in Large-cap stocks, whichare expected to benefit from economic recovery and applies bottom-up approach to invest inmid/small cap stocks to generate alpha. In debt portfolio, it maintains high quality fixed incomeportfolio and actively manages duration through long dated government bonds.
3 HDFC Equity Savings Fund(G)
It invests in equity and equity related instruments, arbitrage opportunities, and in debt and moneymarket instruments to provide capital appreciation and income distribution. In equity investing, itfollows a multi cap strategy. In fixed income portfolio, it invests in corporate bonds, bank perpetualbonds and GILTS. The maturity profile of debt portion depends on interest rate outlook. Modifiedduration as on November, 2018 was 1.46 years.
4 ICICI Pru Equity & Debt Fund(G)
It is an equity-oriented balanced fund, which does tactical allocation between debt and equity basedon the market outlook to ensure optimal risk reward. The fund increases its exposure in debt whenthe equity market is overvalued and increases its allocation to equity when it is undervalued.
5 Kotak Equity Savings Fund(G)
It invests in equity, arbitrage opportunities, and in debt and money market instruments to providecapital appreciation and income distribution. Broadly, it invests 20-40% in equity bases on themarket valuations and sentiments. It primarily invest in large cap stocks. In fixed income, it followsaccrual portfolio strategy and invested in low maturity and high quality assets.
45

Conservative model portfolio – Mutual Funds
46
Absolute % Returns CAGR % Return Quant's
Sr. No Scheme Name Allocation
(%) 6 M 1 Yr 2 Yr 3 Yr PE Beta NAV
1 Axis Bluechip Fund(G) 30% 0.5 7.1 22.2 12.7 42.7 0.9 27.0
2 DSP Equity & Bond Fund(G) 15% 1.1 -5.2 10.7 9.4 38.7 -- 143.1
3 HDFC Equity Savings Fund(G) 20% 2.8 1.0 8.8 10.2 25.2 0.0 35.5
4 ICICI Pru Equity & Debt Fund(G) 15% 4.2 -1.7 11.3 11.6 32.6 -- 127.9
5 Kotak Equity Savings Fund(G) 20% 2.6 4.3 9.4 8.1 24.1 0.0 13.8
Total 100.0
Mutual Funds Performance
Returns and quants as on December 28, 2018

Mutual Fund investments are subject to market risks, read all scheme related documents carefully.Nothing in this document constitutes investment, legal, accounting or tax advice or a representation that any investment or strategy is suitable or appropriate to the investor's specificcircumstances. The details included are based on information obtained from public sources and sources believed to be reliable, but no independent verification has been made nor isits accuracy or completeness guaranteed.Investors should consult their financial advisers if in doubt about whether the product is suitable for them. The fund may or may not be suitable for all investors, who must make theirown investment decisions, based on their own investment objectives, financial positions and needs. This document may not be taken in substitution for the exercise of independentjudgment by any investor. The investor should independently evaluate the investment risks.India Infoline Ltd. or any of its director/s or principal officer/employees and associate companies (IIFL) does not assure/give guarantee for accuracy of any of the facts/interpretations inthis document, and shall not be liable to any person including the beneficiary for any claim or demand for damages or otherwise in relation to this opinion or its contents.The aimed returns mentioned anywhere in this document are purely indicative and are not promised or guaranteed in any manner. Returns are dependent on prevalent market factors,liquidity and credit conditions. Instrument returns depicted are in the current context and may be significantly different in the future.The group company of India Infoline Limited, IIFL Wealth Management Limited is the Sponsor of IIFL Mutual Fund and holding company of the Investment Manager & Trustee Companyof IIFL Mutual Fund.IIFL or its subsidiaries & affiliates may be holding all or any of the units of the scheme(s), referred in the document. The information contained herein is strictly confidential and meantsolely for the selected recipient and may not be altered in any way, transmitted to, copied or distributed, in part or in whole, to any other person or to the media or reproduced in anyform, without prior written consent of IIFL. While due care has been taken in preparing this document, IIFL and its affiliates accept no liabilities for any loss or damage of any kindarising out of any inaccurate, delayed or incomplete information nor for any actions taken in reliance thereon.This document is not directed or intended for distribution to, or use by, any person or entity who is a citizen or resident of or located in any locality, state, country or other jurisdiction,where such distribution, publication, availability or use would be contrary to law, regulation or which would subject IIFL or its affiliates to any registration or licensing requirementwithin such jurisdiction. IIFL and/or its associates receive compensation/ commission for distribution of Mutual Funds from various Asset Management Companies (AMCs).IIFL hosts the details of the commission rates earned by IIFL from Mutual Fund houses on our website https://ttweb.indiainfoline.com/trade/downloads/brokerage%20file.pdf. Hence,IIFL or its associates may have received compensation from AMCs whose funds are mentioned in the report during the period preceding twelve months from the date of this report fordistribution of Mutual Funds or for providing marketing advertising support to these AMCs. IIFL group, associate and subsidiary companies are engaged in providing various financialservices and for the said services (including the service for acquiring and sourcing the units of the fund) may earn fees or remuneration in form of arranger fees, referral fees, advisoryfees, management fees, trustee fees, Commission, brokerage, transaction charges, underwriting charges, issue management fees and other fees.Please refer to http://www.indiainfoline.com/research/disclaimer and http://www.indiainfoline.com/mf/disclaimer for additional recommendation parameter, analyst disclaimer andother disclosures.Please refer to http://www.indiainfoline.com/research/disclaimer for recommendation parameter, analyst disclaimer and other disclosures.IIFL Securities Limited (Formerly ‘India Infoline Limited’), CIN No.: U99999MH1996PLC132983, Corporate Office – IIFL Centre, Kamala City, Senapati Bapat Marg, Lower Parel, Mumbai –400013 Tel: (91-22) 4249 9000 .Fax: (91-22) 40609049, Regd. Office – IIFL House, Sun Infotech Park, Road No. 16V, Plot No. B-23, MIDC, Thane Industrial Area, Wagle Estate, Thane –400604 Tel: (91-22) 25806650. Fax: (91-22) 25806654 E-mail: [email protected] Website: www.indiainfoline.com, Refer www.indiainfoline.com for detail of Associates.Stock Broker SEBI Regn.: INZ000164132, PMS SEBI Regn. No. INP000002213, IA SEBI Regn. No. INA000000623, SEBI RA Regn.:- INH000000248For Research related queries, write at [email protected] Sales and Account related information, write to customer care: [email protected] or call on 91-22 4007 1000
47
Disclosure