
Redondo Beach Real Estate Market Conditions - September 2015
Upload
hhc-south-bay-real-estate-agentsCategory
view
21download
1
Table of
Contents
Key Statistics for December
Sales 2014 Residential Sales Stats Year-to-Year Total Sales by Map Area Median 2014 Median Sales Stats Year-to-Year Median Sales by Map Area Listings 2014 Active Listings by Map Area 2014 Total Active Listings vs. Total Sales Year-to-Year Active Listings by Map Area Inventory 2014 Months of Inventory by Map Area Year-to-Year Months of Inventory
Outlook for January
About Hady Chahine Contact Information
Key Statistics for December
Back to Table of Contents
= trending positive = trending positive
= trending negative = trending negative
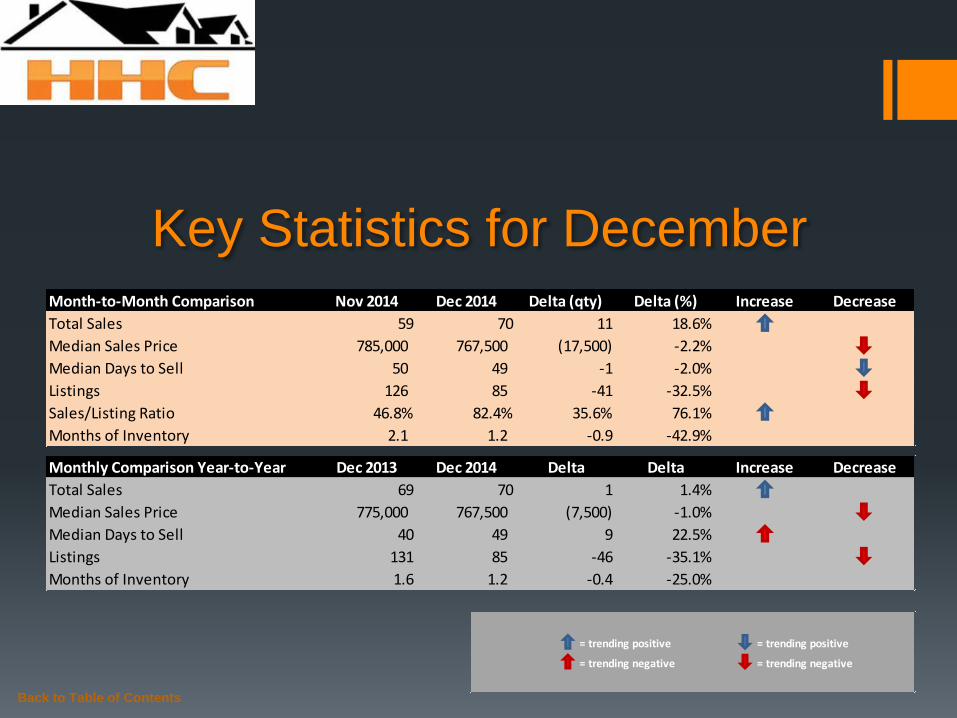
Month-to-Month Comparison Nov 2014 Dec 2014 Delta (qty) Delta (%) Increase Decrease
Total Sales 59 70 11 18.6%
Median Sales Price 785,000 767,500 (17,500) -2.2%
Median Days to Sell 50 49 -1 -2.0%
Listings 126 85 -41 -32.5%
Sales/Listing Ratio 46.8% 82.4% 35.6% 76.1%
Months of Inventory 2.1 1.2 -0.9 -42.9%
Monthly Comparison Year-to-Year Dec 2013 Dec 2014 Delta Delta Increase Decrease
Total Sales 69 70 1 1.4%
Median Sales Price 775,000 767,500 (7,500) -1.0%
Median Days to Sell 40 49 9 22.5%
Listings 131 85 -46 -35.1%
Months of Inventory 1.6 1.2 -0.4 -25.0%
Back to Table of Contents
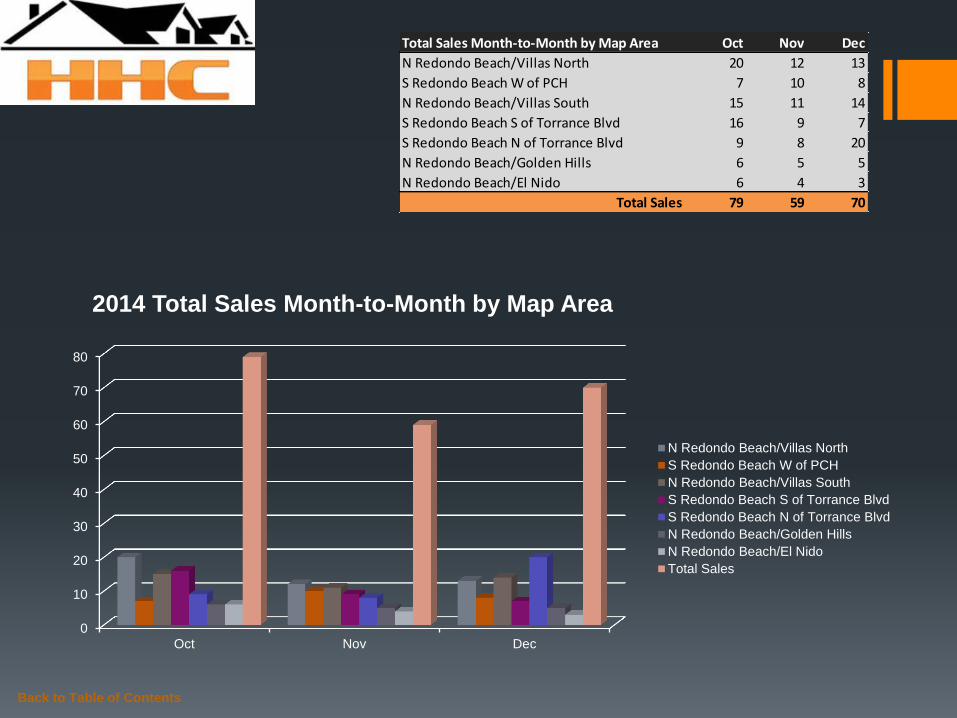
Total Sales Month-to-Month by Map Area Oct Nov Dec
N Redondo Beach/Villas North 20 12 13
S Redondo Beach W of PCH 7 10 8
N Redondo Beach/Villas South 15 11 14
S Redondo Beach S of Torrance Blvd 16 9 7
S Redondo Beach N of Torrance Blvd 9 8 20
N Redondo Beach/Golden Hills 6 5 5
N Redondo Beach/El Nido 6 4 3
Total Sales 79 59 70
0
10
20
30
40
50
60
70
80
Oct Nov Dec
2014 Total Sales Month-to-Month by Map Area
N Redondo Beach/Villas North
S Redondo Beach W of PCH
N Redondo Beach/Villas South
S Redondo Beach S of Torrance Blvd
S Redondo Beach N of Torrance Blvd
N Redondo Beach/Golden Hills
N Redondo Beach/El Nido
Total Sales

Back to Table of Contents
Total Sales Year-to-Year by Map Area 2012 2013 2014
N Redondo Beach/Villas North 15 17 13
S Redondo Beach W of PCH 7 12 8
N Redondo Beach/Villas South 13 13 14
S Redondo Beach S of Torrance Blvd 7 6 7
S Redondo Beach N of Torrance Blvd 10 9 20
N Redondo Beach/Golden Hills 6 8 5
N Redondo Beach/El Nido 6 4 3
Total Sales 64 69 70
0
10
20
30
40
50
60
70
2012 2013 2014
Total Sales Year-to-Year by Map Area: December
N Redondo Beach/Villas North
S Redondo Beach W of PCH
N Redondo Beach/Villas South
S Redondo Beach S of Torrance Blvd
S Redondo Beach N of Torrance Blvd
N Redondo Beach/Golden Hills
N Redondo Beach/El Nido
Total Sales

Back to Table of Contents
Median Sales Price Month-to-Month by Map Area Oct Nov Dec
N Redondo Beach/Villas North 702,500 775,000 750,000
S Redondo Beach W of PCH 1,060,000 857,750 957,000
N Redondo Beach/Villas South 808,000 759,000 650,000
S Redondo Beach S of Torrance Blvd 925,000 1,000,000 830,000
S Redondo Beach N of Torrance Blvd 1,167,007 732,500 870,000
N Redondo Beach/Golden Hills 852,000 850,000 765,000
N Redondo Beach/El Nido 726,500 712,500 750,000
Market Median Sales Price 810,000 785,000 767,500
-
200,000
400,000
600,000
800,000
1,000,000
1,200,000
Oct Nov Dec
2014 Median Sales Price Month-to-Month by Map Area
N Redondo Beach/Villas North
S Redondo Beach W of PCH
N Redondo Beach/Villas South
S Redondo Beach S of Torrance Blvd
S Redondo Beach N of Torrance Blvd
N Redondo Beach/Golden Hills
N Redondo Beach/El Nido
Market Median Sales Price

Back to Table of Contents
Median Sales Price Year-to-Year by Map Area 2012 2013 2014
N Redondo Beach/Villas North 661,000 690,000 750,000
S Redondo Beach W of PCH 542,000 815,000 957,000
N Redondo Beach/Villas South 661,000 660,000 650,000
S Redondo Beach S of Torrance Blvd 1,329,000 798,750 830,000
S Redondo Beach N of Torrance Blvd 632,000 917,500 870,000
N Redondo Beach/Golden Hills 684,000 785,250 765,000
N Redondo Beach/El Nido 579,500 780,000 750,000
Market Median Sales Price 661,000 775,000 767,500
-
200,000
400,000
600,000
800,000
1,000,000
1,200,000
1,400,000
2012 2013 2014
Median Sales Price Year-to-Year by Map Area: December
N Redondo Beach/Villas North
S Redondo Beach W of PCH
N Redondo Beach/Villas South
S Redondo Beach S of Torrance Blvd
S Redondo Beach N of Torrance Blvd
N Redondo Beach/Golden Hills
N Redondo Beach/El Nido
Market Median Sales Price

Back to Table of Contents
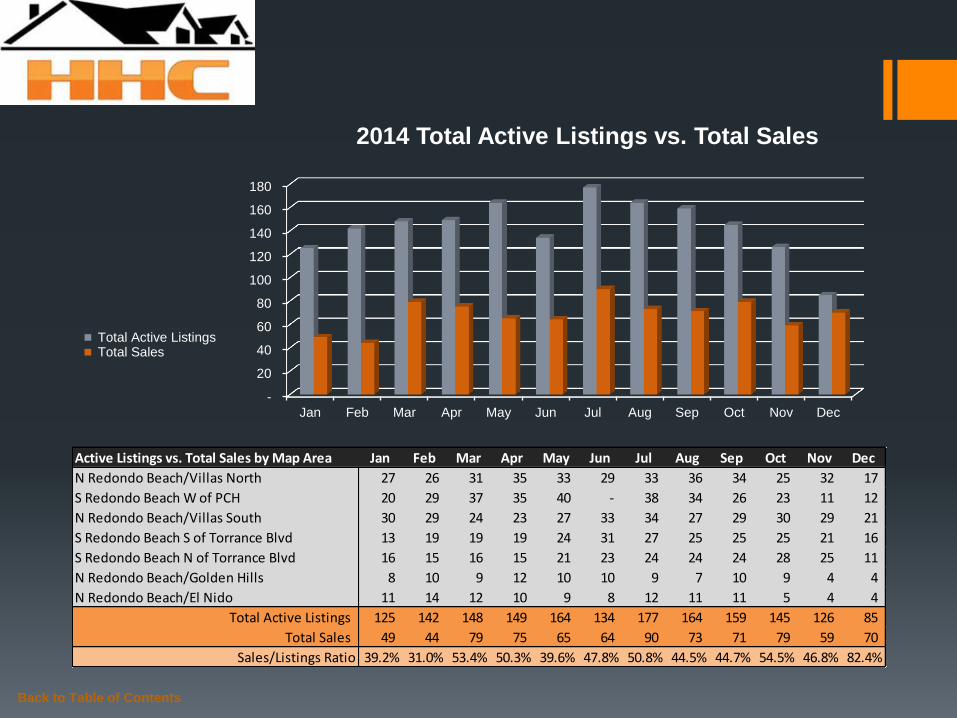
Active Listings vs. Total Sales by Map Area Jan Feb Mar Apr May Jun Jul Aug Sep Oct Nov Dec
N Redondo Beach/Villas North 27 26 31 35 33 29 33 36 34 25 32 17
S Redondo Beach W of PCH 20 29 37 35 40 - 38 34 26 23 11 12
N Redondo Beach/Villas South 30 29 24 23 27 33 34 27 29 30 29 21
S Redondo Beach S of Torrance Blvd 13 19 19 19 24 31 27 25 25 25 21 16
S Redondo Beach N of Torrance Blvd 16 15 16 15 21 23 24 24 24 28 25 11
N Redondo Beach/Golden Hills 8 10 9 12 10 10 9 7 10 9 4 4
N Redondo Beach/El Nido 11 14 12 10 9 8 12 11 11 5 4 4
Total Active Listings 125 142 148 149 164 134 177 164 159 145 126 85
-
5
10
15
20
25
30
35
40
Jan Feb Mar Apr May Jun Jul Aug Sep Oct Nov Dec
2014 Active Listings by Map Area
N Redondo Beach/Villas North
S Redondo Beach W of PCH
N Redondo Beach/Villas South
S Redondo Beach S of Torrance Blvd
S Redondo Beach N of Torrance Blvd
N Redondo Beach/Golden Hills
N Redondo Beach/El Nido
Back to Table of Contents
Active Listings vs. Total Sales by Map Area Jan Feb Mar Apr May Jun Jul Aug Sep Oct Nov Dec
N Redondo Beach/Villas North 27 26 31 35 33 29 33 36 34 25 32 17
S Redondo Beach W of PCH 20 29 37 35 40 - 38 34 26 23 11 12
N Redondo Beach/Villas South 30 29 24 23 27 33 34 27 29 30 29 21
S Redondo Beach S of Torrance Blvd 13 19 19 19 24 31 27 25 25 25 21 16
S Redondo Beach N of Torrance Blvd 16 15 16 15 21 23 24 24 24 28 25 11
N Redondo Beach/Golden Hills 8 10 9 12 10 10 9 7 10 9 4 4
N Redondo Beach/El Nido 11 14 12 10 9 8 12 11 11 5 4 4
Total Active Listings 125 142 148 149 164 134 177 164 159 145 126 85
Total Sales 49 44 79 75 65 64 90 73 71 79 59 70
Sales/Listings Ratio 39.2% 31.0% 53.4% 50.3% 39.6% 47.8% 50.8% 44.5% 44.7% 54.5% 46.8% 82.4%
-
20
40
60
80
100
120
140
160
180
Jan Feb Mar Apr May Jun Jul Aug Sep Oct Nov Dec
2014 Total Active Listings vs. Total Sales
Total Active Listings Total Sales

Back to Table of Contents
Active Listings Year-to-Year by Map Area 2012 2013 2014
N Redondo Beach/Villas North 21 24 17
S Redondo Beach W of PCH 30 23 12
N Redondo Beach/Villas South 24 20 21
S Redondo Beach S of Torrance Blvd 15 17 16
S Redondo Beach N of Torrance Blvd 20 26 11
N Redondo Beach/Golden Hills 8 11 4
N Redondo Beach/El Nido 8 10 4
Total Active Listings 126 131 85
0
20
40
60
80
100
120
140
2012 2013 2014
Active Listings Year-to-Year by Map Area: December
N Redondo Beach/Villas North
S Redondo Beach W of PCH
N Redondo Beach/Villas South
S Redondo Beach S of Torrance Blvd
S Redondo Beach N of Torrance Blvd
N Redondo Beach/Golden Hills
N Redondo Beach/El Nido
Total Active Listings

Back to Table of Contents
Months of Inventory by Map Area Jan Feb Mar Apr May Jun Jul Aug Sep Oct Nov Dec
N Redondo Beach/Villas North 3.4 4.3 1.6 2.1 3.3 1.8 3.3 2.3 2.3 1.3 2.7 1.3
S Redondo Beach W of PCH 2.9 5.8 5.3 3.5 4.0 - 1.7 2.4 2.4 3.3 1.1 1.5
N Redondo Beach/Villas South 2.7 2.4 1.2 1.3 2.3 3.3 1.4 2.1 2.2 2.0 2.6 1.5
S Redondo Beach S of Torrance Blvd 1.4 2.7 3.8 1.9 4.0 2.8 2.5 1.9 3.6 1.6 2.3 2.3
S Redondo Beach N of Torrance Blvd 4.0 1.3 1.3 1.9 2.1 1.8 2.2 2.7 1.9 3.1 3.1 0.6
N Redondo Beach/Golden Hills 1.0 - 0.8 2.0 1.0 0.9 0.9 1.0 2.5 1.5 0.8 0.8
N Redondo Beach/El Nido 5.5 7.0 3.0 1.7 1.3 2.7 6.0 11.0 1.4 0.8 1.0 1.3
-
2.0
4.0
6.0
8.0
10.0
12.0
Jan Feb Mar Apr May Jun Jul Aug Sep Oct Nov Dec
2014 Months of Inventory by Map Area
N Redondo Beach/Villas North
S Redondo Beach W of PCH
N Redondo Beach/Villas South
S Redondo Beach S of Torrance Blvd
S Redondo Beach N of Torrance Blvd
N Redondo Beach/Golden Hills
N Redondo Beach/El Nido
Back to Table of Contents
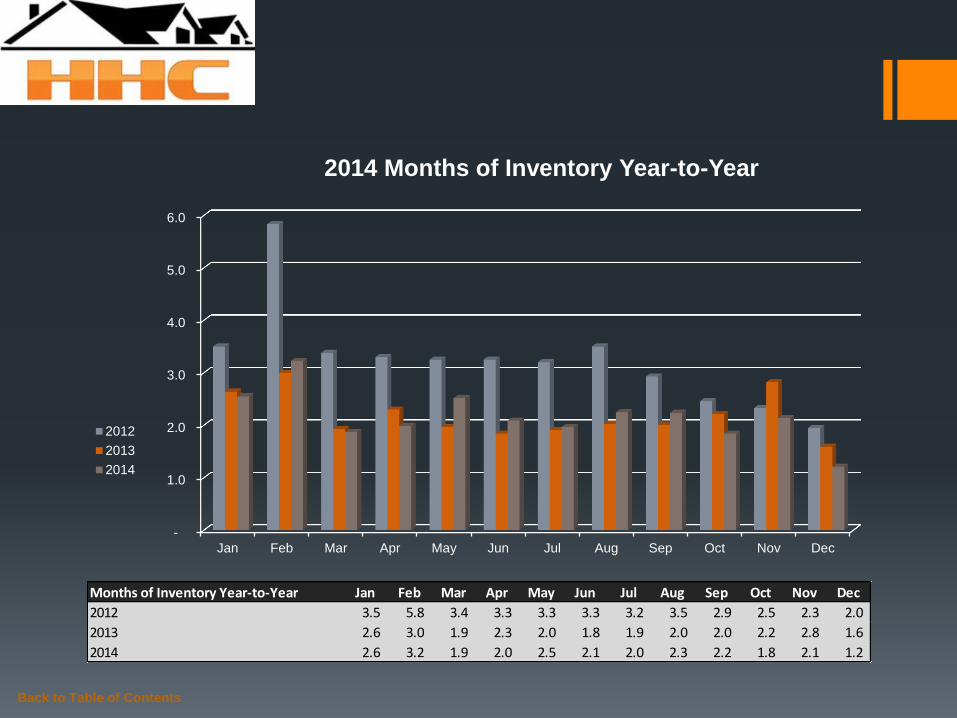
Months of Inventory Year-to-Year Jan Feb Mar Apr May Jun Jul Aug Sep Oct Nov Dec
2012 3.5 5.8 3.4 3.3 3.3 3.3 3.2 3.5 2.9 2.5 2.3 2.0
2013 2.6 3.0 1.9 2.3 2.0 1.8 1.9 2.0 2.0 2.2 2.8 1.6
2014 2.6 3.2 1.9 2.0 2.5 2.1 2.0 2.3 2.2 1.8 2.1 1.2
-
1.0
2.0
3.0
4.0
5.0
6.0
Jan Feb Mar Apr May Jun Jul Aug Sep Oct Nov Dec
2014 Months of Inventory Year-to-Year
2012
2013
2014
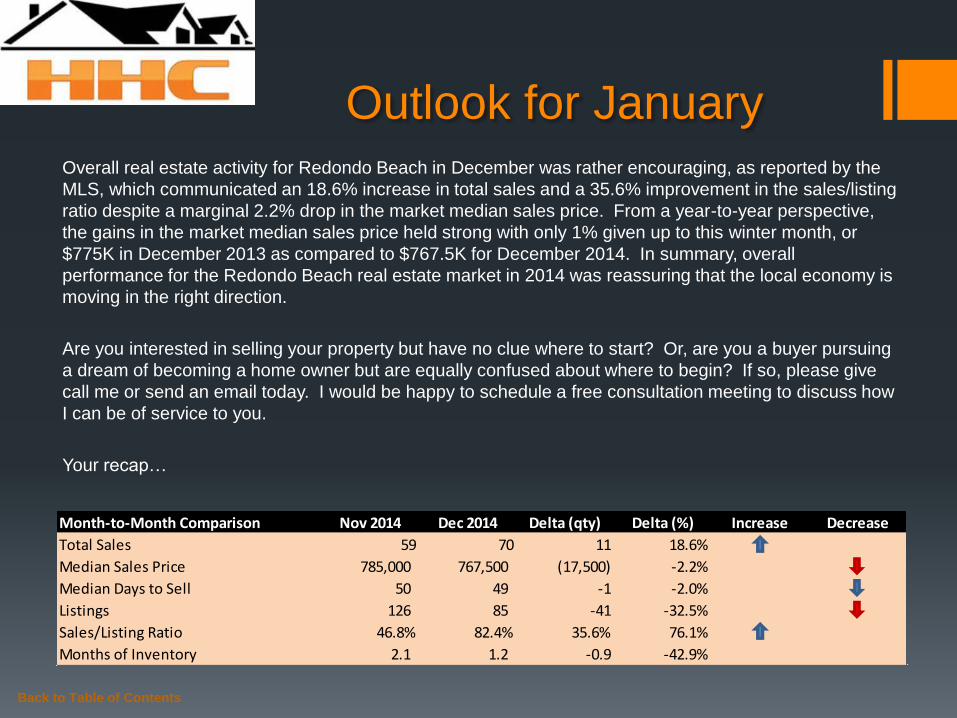
Outlook for January Overall real estate activity for Redondo Beach in December was rather encouraging, as reported by the
MLS, which communicated an 18.6% increase in total sales and a 35.6% improvement in the sales/listing
ratio despite a marginal 2.2% drop in the market median sales price. From a year-to-year perspective,
the gains in the market median sales price held strong with only 1% given up to this winter month, or
$775K in December 2013 as compared to $767.5K for December 2014. In summary, overall
performance for the Redondo Beach real estate market in 2014 was reassuring that the local economy is
moving in the right direction.
Are you interested in selling your property but have no clue where to start? Or, are you a buyer pursuing
a dream of becoming a home owner but are equally confused about where to begin? If so, please give
call me or send an email today. I would be happy to schedule a free consultation meeting to discuss how
I can be of service to you.
Your recap…
Back to Table of Contents
Month-to-Month Comparison Nov 2014 Dec 2014 Delta (qty) Delta (%) Increase Decrease
Total Sales 59 70 11 18.6%
Median Sales Price 785,000 767,500 (17,500) -2.2%
Median Days to Sell 50 49 -1 -2.0%
Listings 126 85 -41 -32.5%
Sales/Listing Ratio 46.8% 82.4% 35.6% 76.1%
Months of Inventory 2.1 1.2 -0.9 -42.9%

Serving South Bay Home Buyers and Sellers Since 2001
RE/MAX Top 4 Team in California – 2012
RE/MAX 100% Club - 2011
Shorewood Realtors Top 5% in Overall Sales 2001-2006, 2008-2010
Back to Table of Contents
About
Hady Chahine…

The information being provided by CARETS (CLAW, CRISNet MLS, DAMLS, CRMLS, i-Tech MLS, and/or VCRDS) is for the visitor’s personal, non-commercial use and may not be used for
any purpose other than to identify prospective properties visitor may be interested in purchasing. Any information relating to a property referenced on this web site comes from the Internet
Data Exchange (IDX) program of CARETS. This web site may reference real estate listing(s) held by a brokerage firm other than the broker and/or agent who owns this web site. The accuracy
of all information, regardless of source, including but not limited to square footages and lot sizes, is deemed reliable but not guaranteed and should be personally verified through personal
inspection by and/or with the appropriate professionals.
Back to Table of Contents
Listings MLS BLOG Website