December 2014 Quarterly - Home - Gloucester City Council Spending/08... · December 2014 City...
39
December 2014 Gloucester City Council Council Plan 2014-17 Performance Monitoring Quarterly
Transcript of December 2014 Quarterly - Home - Gloucester City Council Spending/08... · December 2014 City...

1 | P a g e
December 2014
Gloucester
City
Council
Council Plan 2014-17
Performance Monitoring
Qu
arte
rly

2 | P a g e
CONTENTS
Monthly Measures .............................................................................................................................................................................. 5
Growing Gloucester’s economy .......................................................................................................................................................... 5
A City with skills and job opportunities........................................................................................................................................... 5
JSA claimant rate ......................................................................................................................................................................... 5
Creating pride in our City and improving our environment ................................................................................................................ 7
A greener Gloucester ...................................................................................................................................................................... 7
Household refuse & recycling ..................................................................................................................................................... 7
Fly tipping .................................................................................................................................................................................... 9
A distinctive cultural offer for the City .......................................................................................................................................... 12
Visitors to the Guildhall............................................................................................................................................................. 12
Visitors to the City and Folk Museums ..................................................................................................................................... 14
Visitors to the Tourist Information Centre ................................................................................................................................ 16
Visitors to Robinswood Hill Country Park ................................................................................................................................. 17
Affordable and decent housing for all .......................................................................................................................................... 18
Homelessness prevention ......................................................................................................................................................... 18
Sound finances and strong performance .......................................................................................................................................... 20
Sound finances .............................................................................................................................................................................. 20
Council tax collection ................................................................................................................................................................ 20
Business rates (NNDR) collection .............................................................................................................................................. 21
Improving performance ................................................................................................................................................................ 22
Customer calls resolved at point of contact ............................................................................................................................. 22
Customer payment channelling ................................................................................................................................................ 24
GCC employee sickness rate ..................................................................................................................................................... 26
Complaints received ................................................................................................................................................................. 28
Quarterly Measures .......................................................................................................................................................................... 30
Growing Gloucester’s Economy ........................................................................................................................................................ 30
A City with skills and job opportunities......................................................................................................................................... 30
NEET rate .................................................................................................................................................................................. 30
A thriving centre and regeneration of the City ............................................................................................................................. 32
The number of empty retail units in the City Centre ................................................................................................................ 32

3 | P a g e
The number of licensed food retailers in the City Centre ......................................................................................................... 34
Listening to our residents ............................................................................................................................................................. 36
Followers to GCC’s twitter account........................................................................................................................................... 36
Sound finances and strong performance .......................................................................................................................................... 37
Sound finances .............................................................................................................................................................................. 37
The net income received from the city council’s investment property .................................................................................... 37
Biannual Measures ........................................................................................................................................................................... 38
Growing Gloucester’s economy ........................................................................................................................................................ 38
Attracting investment ................................................................................................................................................................... 38
A thriving centre and regeneration of the City ............................................................................................................................. 38
Working with our communities ........................................................................................................................................................ 38
Listening to our residents ............................................................................................................................................................. 38
An active, healthy and safe City for all to enjoy ............................................................................................................................ 38
A City for everyone ....................................................................................................................................................................... 38
Creating pride in our City and improving our environment .............................................................................................................. 38
A greener Gloucester .................................................................................................................................................................... 38
Affordable and decent housing for all .......................................................................................................................................... 38
Annual Measures .............................................................................................................................................................................. 39
Growing Gloucester’s economy ........................................................................................................................................................ 39
Attracting investment ................................................................................................................................................................... 39
A City with skills and job opportunities......................................................................................................................................... 39
A thriving centre and regeneration of the City ............................................................................................................................. 39
Working with our communities ........................................................................................................................................................ 39
Listening to our residents ............................................................................................................................................................. 39
An active, healthy and safe City for all to enjoy ............................................................................................................................ 39
Creating pride in our City and improving our environment .............................................................................................................. 39
A greener Gloucester .................................................................................................................................................................... 39
Sound finances and strong performance .......................................................................................................................................... 39
Sound finances .............................................................................................................................................................................. 39
Improving performance ................................................................................................................................................................ 39
4 | P a g e
FOREWORD
This report has been designed to track the Council’s progress against the Priorities, Key Actions and Projects highlighted in the
Council Plan 2014-17. A monthly report will be produced and include updates for those measures which are to be reported upon
every single month; these typically include performance tracking of ‘business as usual’. For projects and priorities which are
more long term in nature Quarterly, Biannual and Annual reports will also be produced, and will include the wider suite of
measures.
RAG REPORTING
Where performance measures have accompanying targets, they will be reported utilizing a RAG (red, amber, green) system.
Unless otherwise stated, measures are awarded a ‘Green’ status where performance exceeds the target by at least 10%. Where
performance is 10% or more below target, a ‘Red’ status is awarded. ‘Amber’ status is awarded where performance is within the
10% window of margin either side of the target.
‘UPDATE-ONLY’ MEASURES
Some performance measures attached to the Council Plan do not have accompanying targets and are scheduled to be
commentary-only updates.

5 | P a g e
MONTHLY MEASURES
GROWING GLOUCESTER’S ECONOMY
A CITY WITH SKILLS AND JOB OPPORTUNITIES
JSA CLAIMANT RATE
The percentage of working age adults in Gloucester claiming jobs seeker’s allowance
(lower is better)
Nov Dec YTD Average
Claimant Rate 2.10% 2.00% 2.51% Target 3.10% 3.00% 3.62%
RAG GREEN GREEN GREEN
2.00%
2.50%
3.00%
3.50%
4.00%
4.50%
Apr May Jun Jul Aug Sep Oct Nov Dec Jan Feb Mar
Claimant Rate Target / 2013-14

6 | P a g e
Nov-14
The claimant rate for Gloucester in November 2014 was 2.1%. This was a decrease of 0.1% on the October 2014 figure. The county rate also decreased by 0.1% to 1.2%. We have had a total of 29 expressions of interest for growth accelerator grants from city businesses going through the Government's Growth Accelerator programme, which works to double the size of a company within three years. To date we have approved 16 grants and issued a total of £13,300. The ED team is also continuing to support Enterprise Clubs with Gloucestershire Enterprise Limited and Gloucester Entrepreneurs with Adult Education - which offer advice and training on entering self employment. Attendees on these courses receive information on grant opportunities and other support on offer from the City Council as they take the next steps to start their business.
Dec-14
Gloucester's claimant rate in December was 2.0%. (In November Gloucester’s claimant rate was 2.1%). This compares to a county rate of 1.2% and is the same as the UK average of 2.0%. The average claimant rate in Gloucester for Q3 (September–December) 2014 was 2.1%. The corresponding average count for Q3 2013 was 3.13%. Therefore, in comparison to the same period a year ago the city’s claimant rate is over 1% lower. Supporting local businesses to grow Export - Officers have been working with various organisations including UK Trade and Investment (UKTI), Join in China and Gloucestershire & Republic of Korea Amity (GROK) to explore ways that the City Council can assist businesses in Gloucester to access markets in China, India and South Korea. Supporting city centre businesses World Host Training - In preparation for Gloucester hosting the Rugby World Cup in 2015, the city successfully secured funding to deliver WorldHost accredited customer service and ambassador training for 600 front of house staff across Gloucester. Training will be rolled out from November 2014. The aim is for Gloucester to become an accredited WorldHost destination city. The programme is a collaboration between Gloucester City Council’s Economic Development Service, GFirst LEP, SERCO and Marketing Gloucester and funded by the European Union through the European Social Fund. The training will, amongst others, be offered to Gloucester’s hospitality industry. The training will up skill employees making them more competitive in the job market should they look to move employers, as well as providing the overall improvement in customer services the project is seeking to deliver.

7 | P a g e
CREATING PRIDE IN OUR CITY AND IMPROVING OUR ENVIRONMENT
A GREENER GLOUCESTER
HOUSEHOLD REFUSE & RECYCLING
The volume in tonnes of the refuse and recycling collected through household collections
0
500
1,000
1,500
2,000
2,500
Apr May Jun Jul Aug Sep Oct Nov Dec Jan Feb Mar
Food Waste Dry Recyclates Garden Waste Refuse

8 | P a g e
Nov Dec YTD
Food Waste 164.76 173.88 1,572.36 Dry Recyclates 594.88 611.16 5,496.50 Garden Waste 336.02 320.52 5,637.94
Refuse 1,922.20 1,922.20 19,156.74 % Recycled 36.31% 33.26% 39.71%
Annual Forecast KG Refuse / HH 464.60 467.06 - Target KG Refuse / HH 397.00 397.00 -
RAG AMBER RED RED
Nov-14 This month the total amount of residual waste collected has fallen by 301 tonnes. Work carried out by the team on waste reduction is showing results as we strengthen our waste audit policies and
5%
18%
10%
67%
Food Waste
Dry Recyclates
Garden Waste
Refuse

9 | P a g e
carry out educational visits to residents presenting excess waste. Further work is planned throughout 2015 to further reduce the residual waste per household. Bin hangers are being delivered by Amey during the 1st week of December which will inform residents about the Christmas collection arrangements, the new food waste service, the addition of cartons and aerosols to the kerbside service from March 2015 and the upgraded bring back recycling sites (at supermarkets) which allow residents to recycle all their yogurt pots, butter tubs, meat trays and plastic punnets. In addition we have promoted recycling on our website, on facebook, twitter and on the back cover of the City Life Winter edition.
Dec-14
Dry recycling rates are up in December by 29 tonnes on the November figure and 31 tonnes up on the same month last year. Food waste has also seen an increase this month and is also up on December 2013 figures. This can be attributed to the number of waste audits carried out by the Environmental Projects team in November and December, where educational work with residents and the removal of extra waste capacity is encouraging recycling. Green waste as expected dropped to 320 tonnes and will attribute to the overall recycling percentage being lower this month. However the main contributing factor is the rise in residual waste by 296 tonnes since last month and 266 tonnes on the same month last year. Further work is programmed to take place in 2015 across the city to reduce the amount of household waste by increasing recycling.
FLY TIPPING
Fly tipping incidents reported to the Council by GCC Officers and by members of the public
(lower is better)
Nov Dec YTD
Officer Reported Incidents 10 18 217 Public reported (no evidence) 168 207 1,090
Public reported (possible evidence) 15 10 226 Grand Total 193 235 1,533
Public reported Total 183 217 1,316 Target (Public reported) 91 104 897
RAG RED RED RED
0
50
100
150
200
250
Apr May Jun Jul Aug Sep Oct Nov Dec Jan Feb Mar
Public Reported (no evidence) Public Reported (possible evidence)
Officer Reported Incidents Target (publicly reported)

10 | P a g e

11 | P a g e
Nov-14
Following an increase in complaints relating to trade waste in and around Barton Street from October through November a project has been developed targeting Barton Street businesses to assist them in meeting their legal obligations in respect of trade waste. The project will involve written communication followed up by visits as we seek to support businesses through to compliance. All fly-tipping cases investigated during November did not give rise to a level of evidence that would allow us to pursue an investigation. Processes continue to be reviewed however to ensure that those cases with a realistic prospect of enforcement action are acted upon quickly by officers.
Dec-14
December showed a significant increase in reported fly-tips which can be linked to excess Christmas waste being disposed of as side waste mainly on the highway. During late November we suffered several fly-tips of builders material which investigation has revealed is linked to one individual. This individual is being pursued with a view to being prosecuted. A 2nd fly-tipping prosecution is being prepared in respect of fly-tipping and 2 more are pending where property landlords have failed to meet their duty of care in respect of waste by passing waste onto individuals who are not registered waste carriers with the waste subsequently being fly-tipped.
Quarterly fly tipping enforcement commentary
Q2
A positive feature of Quarter 2 has been the individual cases that have been investigated and pursued through to a resolution. Our tri-signs continue to have a positive short term effect where they are erected and similarly so does our CCTV camera. It is however disappointing that fly-tip numbers have increased month on month and this re-enforces the need for an innovative fly-tip strategy to be developed as many of the fly-tips are those that have no evidence connected to them so are unable to be pursued. The important thing with these cases is to clear them quickly for the benefit of our communities.
Q3
A positive feature of Quarter 3 has been the work carried out in respect of Trade Waste. Individual cases have been pursued and enforcement action taken, the City Centre Trade Waste Collection Policy has been developed for implementation in January 2015 and in doing so the profile of issues relating to Trade Waste have been raised. On the back of several current investigations a number of prosecutions will be taken in Spring 2015 relating to domestic fly-tips that were reported during November & December 2014 as we look to send a strong message out regarding fly-tipping.

12 | P a g e
A DISTINCTIVE CULTURAL OFFER FOR THE CITY
VISITORS TO THE GUILDHALL
The number of visitors to the Guildhall’s cinema, workshops, and events programme
0
500
1,000
1,500
2,000
2,500
3,000
3,500
Apr May Jun Jul Aug Sep Oct Nov Dec Jan Feb Mar
Events Attendees Events Target
Cinema Visitors Cinema Target
Workshop Attendees Workshop Target
0
500
1,000
1,500
2,000
2,500
3,000
3,500
Apr May Jun Jul Aug Sep Oct Nov Dec Jan Feb Mar
Events Attendees Cinema Visitors Workshop Attendees
13 | P a g e
Nov Dec YTD
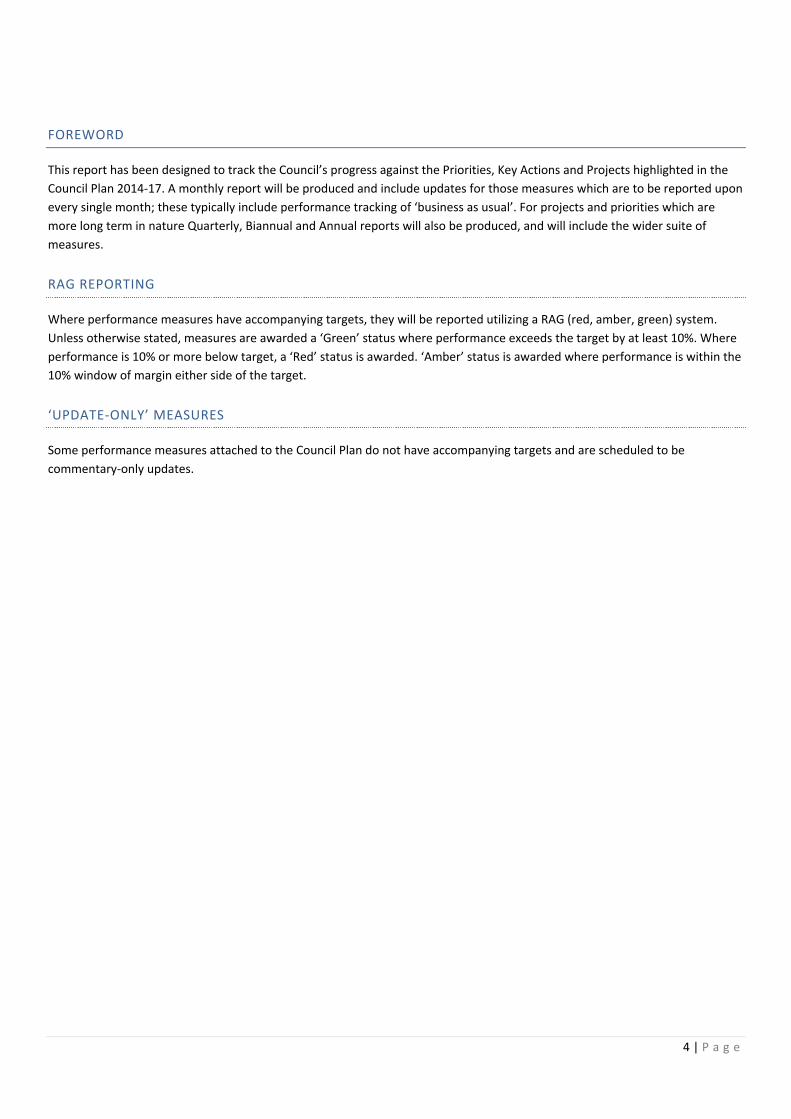
Events attendees 1,836 2,091 10,628 Events target 3,332 962 13,147
Events RAG RED GREEN RED
Cinema visitors 812 435 6,692 Cinema target 506 289 5,226
Cinema RAG GREEN GREEN GREEN
Workshop attendees 410 221 3,430 Workshop target 557 214 2,869
Workshop RAG RED AMBER GREEN
Total visitors counted 3,058 2,747 20,750 Total visitor target 4,395 1,465 21,242
Total visitor RAG RED GREEN AMBER
Nov-14
In terms of live events, the footfall figures are somewhat misleading. The data is tracked from our box office sales, of which a number of events this month weren't included as they hadn't sold tickets, they'd been private parties or similar. The Hall was as busy as the previous year so income would be a similar level, but the tracked footfall will appear smaller. We also held a number of theatre productions this month, that meant smaller audience figures for those ticketed events. Workshops were slightly lower this month as a block theatre booking meant there was a gap in their schedule for a week, hence the proportional drop in attendance. Cinema however, has continued to maintain more positive audience figures which we are hoping to build upon with tweaks to the programme based on the feedback from customers.
Dec-14
December was a popular month for live events; with 5 live band performances, a Northern Soul event in conjunction with the Cinema and a week of pantomime performances, footfall in this month was very strong. Cinema has again been popular and with the introduction of more interactive events i.e the Northern Soul event, it should entice more new audiences to the venue, especially with the introduction of live screenings in the new year. Workshops attendance was up slightly in this month, but due to terms ending and breaking up for Christmas it didn't vary much from last year.

14 | P a g e
VISITORS TO THE CITY AND FOLK MUSEUMS
The number of visitors to the City Museum and Folk Museum
0
500
1,000
1,500
2,000
2,500
3,000
3,500
4,000
Apr May Jun Jul Aug Sep Oct Nov Dec Jan Feb Mar
City Museum Footfall City Target 2013/14 City Museum Footfall
0
200
400
600
800
1,000
1,200
1,400
1,600
Apr May Jun Jul Aug Sep Oct Nov Dec Jan Feb Mar
Folk Museum Footfall Folk Target 2013/14 Folk Museum Footfall

15 | P a g e
Nov Dec YTD
City Museum visitors 768 251 10,056 Target 717 248 9,311
RAG AMBER AMBER AMBER
Folk Museum visitors 1,129 291 8,228 Events target 787 644 8,531
RAG GREEN RED AMBER
City Museum Commentary
Nov-14 The WOW exhibition was replaced by 'Visual Impact', a photography exhibition by Aleks Gjika, and is already proving popular attracting a lot of visitors.
Dec-14
The City Museum was open for two and a half weeks in December. The 3rd December was the most successful day with Art Club, Culture Club and Sewing Circle, and attracted 83 visitors. The second and third weeks were quiet and uptake for the workshops held on 10th December was low.
Folk Museum Commentary
Nov-14
The Museums took part in the Victorian Christmas Market was gave us plenty of opportunity to tell people what was on and encourage them to visit us, and this undoubtedly encouraged more visitors. The candlelit tours were successful as always, with 77 people taking part.
Dec-14 The Folk Museum was open for two and a half weeks in December and was very quiet particularly after the first week. Christmas activities were provided for children but uptake was low.

16 | P a g e
VISITORS TO THE TOURIST INFORMATION CENTRE
The number of visitors to the City’s TIC office
Nov Dec YTD
TIC visitors 10,546 7,060 86,680 Target 12,217 12,178 95,117
RAG RED RED AMBER
Nov-14
Footfall in November was down by 9% compared to the same period last year. Although footfall has decreased, income has remained on par. The TIC team attended the Victorian Christmas Market and over a 4 day period, spoke to a significant number of visitors and also sold over £5000 of Rugby World Cup 2015 merchandise. Retail sales were up by 312% compared to November 2013. Tickets sales were down slightly due to the BBC Radio Gloucestershire Christmas Celebrations tickets going on sale at a much later date. We expect to see an increase in December’s sales. The TIC staff are now responsible for the leaflet rack at Gloucester Railway Station where visitors now have information readily available upon arrival.
Dec-14
Footfall in December 2014 was down compared to the same period last year. In 2013, the Tourist Information Centre was the main ticket agent for the pantomime at Blackfriars. In 2014, the pantomime was held at Gloucester Guildhall where they managed the tickets for the event. Total income was slightly down however there were some notable achievements where retail sales were up by 128% with the average spend per user up by 31%.
0
2,000
4,000
6,000
8,000
10,000
12,000
14,000
16,000
Apr May Jun Jul Aug Sep Oct Nov Dec Jan Feb Mar
TIC Visitors Target

17 | P a g e
VISITORS TO ROBINSWOOD HILL COUNTRY PARK
A count of the number of vehicles using the car parking facilities at Robinswood Hill Country Park. Please note this counter does
not account for foot traffic and may be distorted by peaks and troughs in maintenance operations.
Nov Dec YTD
Vehicle count 2,574 2,881 58,049 Target 5,141 4,722 68,760
RAG RED RED RED
Nov-14
Allowing for 'double counting' as previously explained, November figures are up about 6% on the 9 year November average of 2430 (4860/2). Weather has been mild, although damp with slippery ground conditions.
Dec-14
There were 2881 recorded visits to the Park during December despite generally wet conditions. This was well above the average monthly figure of 2036. Visitor access has been improved following the recent surfacing of the access road.
0
2,000
4,000
6,000
8,000
10,000
12,000
Apr May Jun Jul Aug Sep Oct Nov Dec Jan Feb Mar
Visitors to Robinswood Hill Target
18 | P a g e
AFFORDABLE AND DECENT HOUSING FOR ALL
HOMELESSNESS PREVENTION
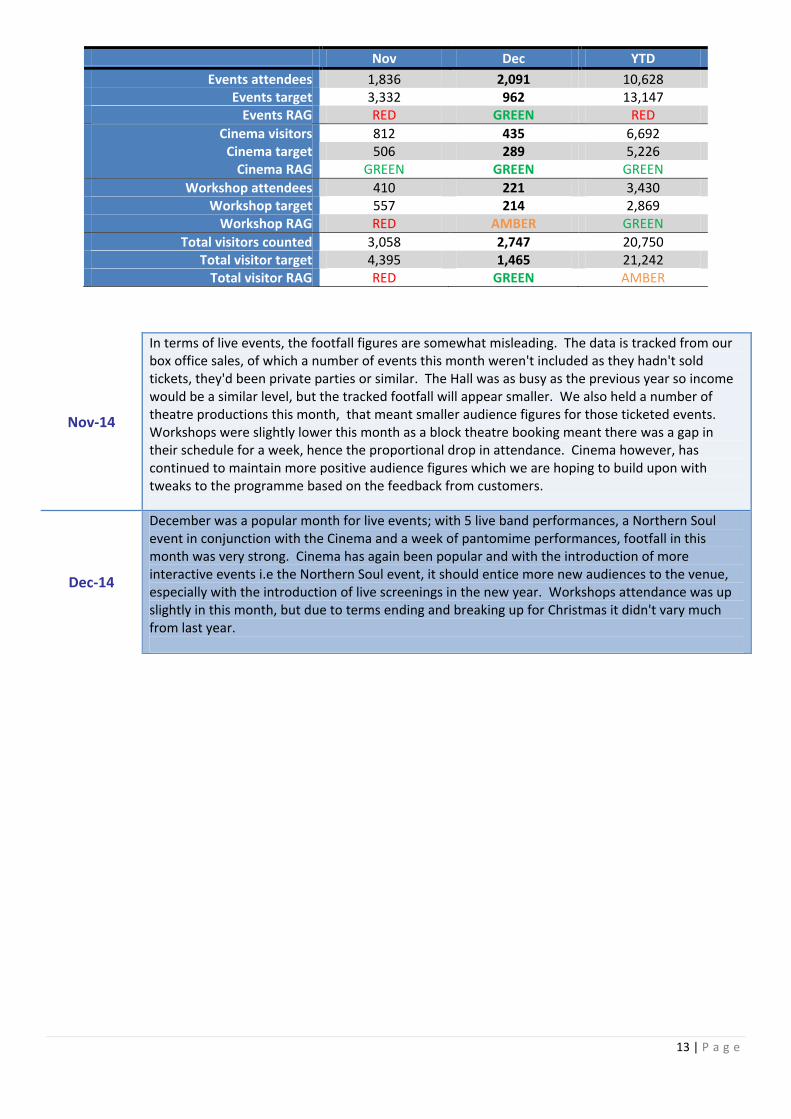
Providing an overview of the quantity and success rate of preventative action taken by GCC to avoid homelessness, in context
with the number of cases where GCC accepts a homeless duty of care –preventative action provides assistance to residents who
are likely to become homeless, the impact is not only a better outcome for the customer than if GCC provided assistance after the
customer had become homeless, but also has a smaller financial impact to the Council than resolving homelessness.
RAG Score = +/- 5% from target
Successful intervention rate = % of interventions that successfully avoided homelessness
(% of intervention action that was successful)
Prevention rate = The number of successful prevention cases shown as a % of successful cases + cases where GCC accepts a
homeless duty of care.
(% of homelessness avoided)
Intervention action may typically consist of assisting with rent payments, finding alternative accommodation, providing rent in
advance, negotiation with the landlord on behalf of the tenant, or payment of rent arrears.
50%
55%
60%
65%
70%
75%
80%
85%
90%
95%
100%
Apr May Jun Jul Aug Sep Oct Nov Dec Jan Feb Mar
Successful intervention Rate Successful intervention target rate
Homelessness Prevention rate Target Prevention Rate

19 | P a g e
Nov Dec YTD
Successful interventions 41 44 391 Unsuccessful interventions 2 3 47
Successful intervention rate 95% 94% 89% Target success rate 85% 85% 85%
RAG GREEN GREEN GREEN
Homeless cases accepted 27 21 147 Successful prevention rate 60% 68% 72%
Target prevention rate 75% 75% 75% RAG RED RED AMBER
Nov-14
375 homeless applications have been completed from April'14 to November '14, an increase of 3% compared to the same period the previous year, although the number of Households where the main homelessness duty had been accepted reduced by 3.8%. The number of single person households accommodated in Emergency B&B at the end of November was 20, compared to 18 the previous year, a high percentage of which are awaiting accommodation in the supported housing provision.
Dec-14
391 Households have been prevented from becoming homeless from April '14 to December '14. The number of successful preventions this financial year has reduced compared to the two previous years, due to the lack of affordable homes in the private rented sector and increasing waiting times for accommodation in the supported housing provision. The private sector procurement officer is running an advertising campaign commencing in January '15 to promote the council's private sector scheme to prevent homelessness.

20 | P a g e
SOUND FINANCES AND STRONG PERFORMANCE
SOUND FINANCES
COUNCIL TAX COLLECTION
Progress towards the annual collection of Council Tax
RAG Score = +/- 0.5% from previous year’s performance
Nov Dec
Council tax collected 74.71% 84.13% Last year 75.09% 84.53%
RAG AMBER AMBER
Nov-14 Current year collection is 0.29% below target and .38% below last year. We continue to monitor this, but at this stage expect to be caught up by year end
Dec-14 Current year collection is 0.37% below target, and 0.4% below last year’s actual figure.
0.00%
10.00%
20.00%
30.00%
40.00%
50.00%
60.00%
70.00%
80.00%
90.00%
100.00%
Apr May Jun Jul Aug Sep Oct Nov Dec Jan Feb Mar
Council Tax Collected Last Year

21 | P a g e
BUSINESS RATES (NNDR) COLLECTION
Progress towards the annual collection of Business Rates
RAG Score = +/- 0.5% from previous year’s performance
Nov Dec
Business rates collected 73.54% 82.60% Last year 79.74% 88.49%
RAG GREEN GREEN
Nov-14
Performance this month is 0.54% above the profile. The shift in tax payers being able to pay by 12 statutory installments is affecting the comparison of performance to 2013/14. The profile has been adjusted to accommodate this shift
Dec-14
Performance this month is 0.54% above the profile. The shift in tax payers being able to pay by 12 statutory installments is affecting the comparison of performance to 2013/14. The profile has been adjusted to accommodate this shift
0.00%
10.00%
20.00%
30.00%
40.00%
50.00%
60.00%
70.00%
80.00%
90.00%
100.00%
Apr May Jun Jul Aug Sep Oct Nov Dec Jan Feb Mar
Actual Last Year

22 | P a g e
IMPROVING PERFORMANCE
CUSTOMER CALLS RESOLVED AT POINT OF CONTACT
An overview of customer telephone calls to the contact centre where customer service officers are able to resolve the customer’s
query
0
1000
2000
3000
4000
5000
6000
7000
8000
9000
Apr May Jun Jul Aug Sep Oct Nov Dec Jan Feb Mar
Calls Resolved at 1st POC Calls Not Resolved at 1st POC
60%
65%
70%
75%
80%
85%
Apr May Jun Jul Aug Sep Oct Nov Dec Jan Feb Mar
% Resolved at 1st POC Target

23 | P a g e
Nov Dec YTD
Call resolved at POC 4,970 5,751 47,653 Calls not resolved at POC 2,292 2,234 17,683
% resolved at POC 68% 72% 73% Target 70% 70% 70%
RAG AMBER AMBER AMBER
Calls resulting from customers being unable
to access CIVICA services 569 452 5,485
(Calls resulting from customers being unable to access CIVICA services are excluded from the ‘resolved at POC’ statistics)
Nov-14
We did see a further increase this month in calls received for officers in the back office where we had to take a message because they were not available to take calls. Apart from these calls there was no significant problems identified.
Dec-14
A small increase in calls this month relating to the Christmas collections where some properties did not receive the bin hangers or City Life. There were also additional calls where clarification of the Christmas collection dates were requested and missed collections reported.

24 | P a g e
CUSTOMER PAYMENT CHANNELLING
An overview of our customers’ chosen route to pay for Council services. Note outstation services (e.g. Guildhall, Museums,
Cemetery & Crematorium, etc.) are excluded.
Self Service (distance) = Self-service website payments + Touchtone telephone + Direct Debits
Tel = MOTO tel + PAYE tel (officer assisted telephone payment)
Cashier = Cash + Cheque payments received by cashier services
In Person = Payments made in person at the Council Offices via the kiosk
RAG Score = +\- 3% from target
35000
37000
39000
41000
43000
45000
47000
49000
51000
Apr May Jun Jul Aug Sep Oct Nov Dec Jan Feb Mar
Self Service (distance) TOTAL Tel TOTAL Cashier TOTAL In Person
88.00%
89.00%
90.00%
91.00%
92.00%
93.00%
94.00%
Apr May Jun Jul Aug Sep Oct Nov Dec Jan Feb Mar
Self Service distance payments Target (Self Service Distance)

25 | P a g e
Nov Dec YTD
Kiosk payments 703 816 8,392 Web self-service 3,330 2,792 29,585
Touchtone self-service 2,633 2,203 25,444 Direct Debit 35,536 35,444 315,984
Self Service TOTAL 41,499 40,439 371,013
MOTO 185 62 2,160 PAYE 908 957 9,586
Tel TOTAL 1,093 1,019 11,746 Cash 464 242 2,637
Cheques 982 971 10,955 Cashier TOTAL 1,446 1,213 13,592
Self-service (distance) % 92.75% 92.99% 91.67% Target % 90.00% 90.00% 90.00%
RAG GREEN GREEN AMBER
Nov-14 Continuing technical system problems during November have meant that not all methods of payment have been available to customers. As a result we have seen an increase in cash payments.
Dec-14 No significant problems or issues arose this month.
Kiosk 2%
Self Service
(distance) 93%
Telephone 2%
Cashier 3%
Payment route overview
Cash 20%
Cheques 80%
Cashier Payments
26 | P a g e
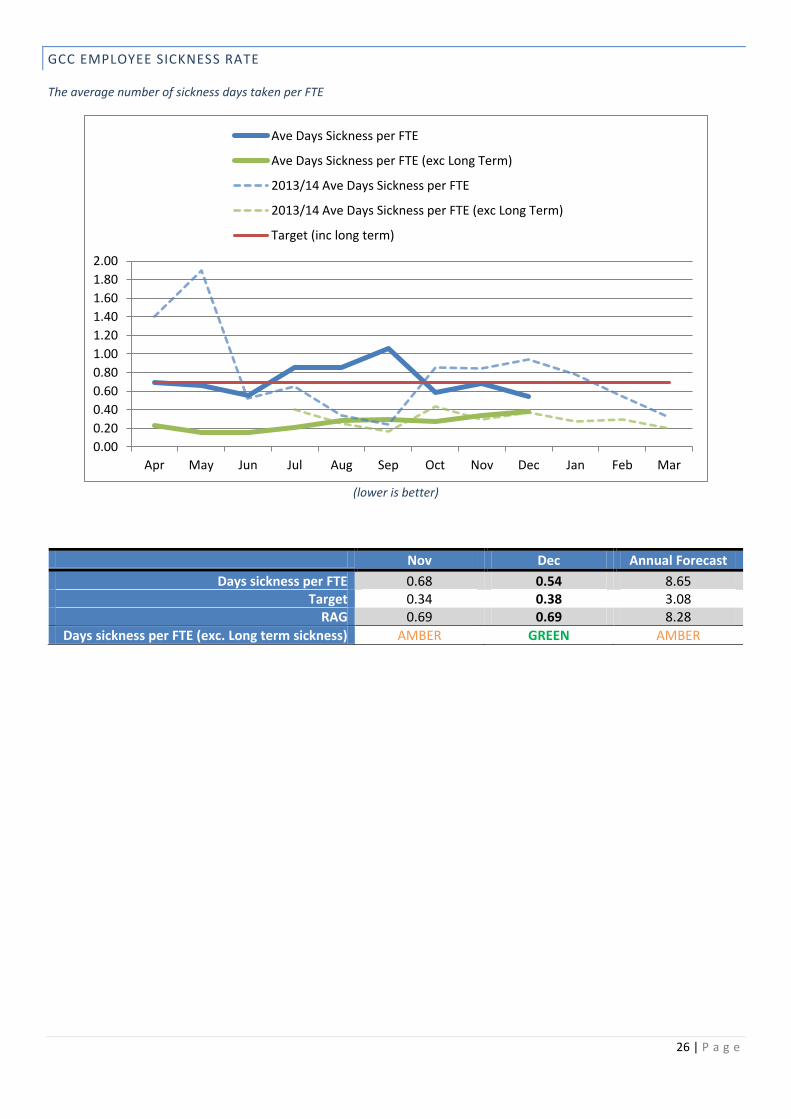
GCC EMPLOYEE SICKNESS RATE
The average number of sickness days taken per FTE
(lower is better)
Nov Dec Annual Forecast
Days sickness per FTE 0.68 0.54 8.65 Target 0.34 0.38 3.08
RAG 0.69 0.69 8.28
Days sickness per FTE (exc. Long term sickness) AMBER GREEN AMBER
0.00
0.20
0.40
0.60
0.80
1.00
1.20
1.40
1.60
1.80
2.00
Apr May Jun Jul Aug Sep Oct Nov Dec Jan Feb Mar
Ave Days Sickness per FTE
Ave Days Sickness per FTE (exc Long Term)
2013/14 Ave Days Sickness per FTE
2013/14 Ave Days Sickness per FTE (exc Long Term)
Target (inc long term)
27 | P a g e
Nov-14
The short-term absence figure has increased slightly in November from 71.5 to 89.5 days, although this increase is mainly due to the impact of particular infections that have been prevalent in the workforce. In addition, there were four specific cases that exceeded 3 days' duration due to complicating factors. Most of the short-term absences are due to seasonal, self-limiting illnesses and 91% lasted for 3 days or less and 75% for 1 or 2 days only. The number of short-term episodes also increased significantly from 34 in October to 45 in November. The average length of short-term absences in the month has fallen back, from 2.1 to 1.99 days, despite the upward impact of the 4 episodes over 3 days' duration. As before, all short-term absences are being actively managed and improvements in the absence rates are expected to be demonstrated through a strong focus on case resolution. Reviews of individual absence records will be conducted in conjunction with line managers. Where appropriate support will be provided including referrals to Occupational Health and the counselling service, as well as letters of concern and action plans to address any issues identified.
Dec-14
The short-term absence figure has increased significantly in December from 89.5 days to 100.5, mainly due to the impact of seasonal infections within the workforce. In addition, there were four specific cases that exceeded three days' duration. Most of the short-term absences were self-limiting and 61% lasted for 3 days or less and 76% for 1 or 2 days only. The number of short-term episodes fell marginally from 45 in November to 44 in December. The average length of short-term absences in the month has increased from 1.99 days to 2.3 days due the upward impact of seven episodes of more than three days' duration. As before, all short-term absences are being actively managed and improvements in the absence rates are expected to be demonstrated through a strong focus on case resolution. Reviews of individual absence records will be conducted in conjunction with line managers. Where appropriate support will be provided including referrals to Occupational Health and the counselling service, as well as letters of concern and action plans to address any issues identified.

28 | P a g e
COMPLAINTS RECEIVED
An overview of the number of complaints received by GCC (including in relation to our Partner organisations) and the percentage
of those which were resolved within 10 working days
(lower is better)
RAG Score = +\- 5% from target
RAG Score = +\- 5% from target
0
20
40
60
80
100
120
140
160
180
Apr May Jun Jul Aug Sep Oct Nov Dec Jan Feb Mar
Total Complaints Received by Contact Centre (inc Partner Organisations)
Target
70%
75%
80%
85%
90%
95%
100%
Apr May Jun Jul Aug Sep Oct Nov Dec Jan Feb Mar
% Resolved within 10 days % Resolved target

29 | P a g e
Nov Dec YTD
Total complaints received 78 103 987 Target 80 80 720
RAG AMBER RED RED
% resolved within 10 working days 92% 95% 93% Target 90% 90% 90%
RAG AMBER GREEN AMBER
Nov-14
We had 2 complaints that are still outstanding this month where the managers have been chased. Of the completed complaints 6 took longer than expected to resolve and were therefore not resolved within the 10 days timescale. The report has been sent through to senior managers for discussion and review.
Dec-14
All complaint from this month have been closed. We had 5 complaints that were not resolved within the 10 working days. This was due to the nature of the complaints where further investigation was needed in order to issue the response. We had a slight increase in complaints this month due to non delivery of bins and boxes over the Christmas period and problems with the Christmas collections.

30 | P a g e
QUARTERLY MEASURES
GROWING GLOUCESTER’S ECONOMY
A CITY WITH SKILLS AND JOB OPPORTUNITIES
NEET RATE *
The percentage of 16 to 18 year olds living in Gloucester who are not in employment, education or training
(lower is better)
Q2 Q3 YTD Average
NEET rate 3.50% 3.57% 4.12% Target 3.40% 4.10% 4.66%
RAG AMBER GREEN GREEN
0.00%
1.00%
2.00%
3.00%
4.00%
5.00%
6.00%
Apr May Jun Jul Aug Sep Oct Nov Dec Jan Feb Mar
NEET rate Target / Last Year

31 | P a g e
Q2
Gloucester's NEET count in Sept ‘14 was 178, 11.25% higher than the previous month. The total number of NEET in the county was 518 (an increase of 23.6% on the previous month). All districts in the county saw an increase in their NEET figures compared to August 2014. The County NEET rate was 5.4%, representing an increase of 1.9% on the previous month. Gloucester's NEET rate was 3.5%, 0.9% lower than the previous month. The city's rate is below the county average, though it has the largest proportion (27.2%) of the NEET cohort in the county. The average NEET rate in Gloucester for Q2 2014 was 4.1%. The corresponding average count for Q2 2013 was 4.6%. Therefore, compared to the same period in 2013 the city’s rate is 0.5% lower. Actions: The ED team is working with the Head Teachers from the G15 Partnership of schools/colleges in Gloucester City to encourage enterprise in local schools. The funding application to Gloucestershire County Council’s “Grow Gloucestershire” fund was successful and will now be used to deliver the ‘Inspiring Enterprise’ programme. The ‘Inspiring Enterprise’ programme aims to: Give students access to a unique learning experience using GLIC’s ‘state of the art’ facilities Increase students’ understanding of entrepreneurship, intrapreneurship and develop their employability skills Increase the students’ knowledge and understanding of the world of work Introduce students to employers and business leaders who can give them first hand information or direct experience of the world of work including self employment The programme comprises of 6 sessions: Session One: Here’s to the Entrepreneur! - Inspirational introduction to ideas and entrepreneurship Session Two: Innovation, Inspiration, Imagination – A ‘can do’ approach to thinking Session Three: A Roadmap to Success – Introduction to business planning. Session Four: The Big Sell - Marketing, Sales and Finance Session Five: Act the Part! Make a pitch! Session Six: Dragons Den Each session will be delivered by an innovative and inspirational business person who will give an engaging talk and also participate in the tasks and activities. They are looking for 30 students drawn from across G15 to be part of the programme.
Q3
Gloucester's NEET count in Dec ‘14 was 171, 0.5% lower than the previous month. The total number of NEET in the county was 564 (a decrease of 6.5% on the previous month). One district saw their NEET figures increase and five districts saw a decrease compared to Nov ‘14. The County NEET rate was 3.72%, representing a decrease of 0.26% on the previous month. Gloucester's NEET rate was 3.57%, 0.13% lower than the previous month. The city's NEET rate is below the county average, though it has the largest proportion (28.34%) of the NEET cohort in the county. The average NEET rate in Gloucester for Q3 2014 was 3.59%. The corresponding average count for Q3 2013 was 4.37%. Therefore, in comparison to the same period in 2013 0.78% lower. Actions: The ED team has been working to progress the ‘Inspiring Enterprise’ programme. ‘Inspiring Enterprise’ brings together secondary schools across Gloucester in partnership with Gloucester City Council, Gloucestershire Enterprise Ltd, GLIC and funded by Gloucestershire County Council. The project aims to: Increase students’ understanding of enterprise, entrepreneurship, intrapreneurship and to develop their employability skills Widen the students’ knowledge and understanding of the world of work Introduce students to Gloucestershire employers, entrepreneurs and business leaders who can provide first hand information or direct experience of the world of work including self employment. The programme comprising 6 x 2 hour sessions from 4 – 6pm has now been finalised and is taking place from January to March 2015. 17 students will be taking part.

32 | P a g e
A THRIVING CENTRE AND REGENERATION OF THE CITY
THE NUMBER OF EMPTY RETAIL UNITS IN THE CITY CENTRE
The number of empty retail units within the primary retail area
(lower is better)
Q2 Q3 YTD Average
Empty retail units 35 26 33.7 Target 38 38 38.0
RAG AMBER GREEN GREEN
25
30
35
40
45
50
Q1 Q2 Q3 Q4
Number of vacant retail units in the City Centre Target 2013/14

33 | P a g e
Q2
The average number of empty units in the city's Primary Shopping Area for Q2 2014 was 37 (an average rate of 12.0%). The corresponding average count for Q2 2013 was 39 (an average rate of 12.9%). Therefore, in comparison to the same period in 2013, two more units within the Primary Shopping Area have been occupied. In September 2014, eight of the 35 empty units are not available for lease. Reasons include units being refurbished in readiness for a new incoming tenant, or the lease contract for the units is in the hands of administrators for companies no longer trading. Actions Meet and Greet Scheme: Updated figures show that in the period January to August 2014 the scheme welcomed 548 coaches into the city - conveying a total of 20,316 passengers. 146 of these coaches were visiting Gloucester for the first time due to meet and greet publicity, resulting in an additional 5,858 visitors to the city. Gloucester Supports Business Grant Scheme: To date 57 businesses have been supported with grants, creating over 170 jobs. We currently have a number of businesses going through the grants paperwork process. The new City Centre Manager started with the City Council on 26.08.14. The CCM’s key tasks include business liaison and ensuring all city centre businesses are aware of all available avenues of business support and assistance from the City Council and its partners. Shop Tidy Project: The city centre is a key priority for the City Council, and the ED team has been working hard to introduce initiatives to target and reduce the number of vacant units which encouragingly is lower than last year. We are keen to work with businesses, property owners and commercial agents to do more. In order to improve the image of the city centre and salability or vacant units, the ED team targeted some of the worst looking vacant city centre units and wrote to their landlords and agents asking them to “spruce up” their units. In addition, we wrote to all landlords and agents of vacant city centre units asking for permission to put posters in their shop window advertising various city council business support mechanisms. The council’s new City Centre Manager is currently liaising with agents to gain access to premises to put up the posters.
Q3
The average number of empty units in the city's Primary Shopping Area for Q3 2014 was 31 (an average rate of 10.4%). The corresponding average count for Q2 2013 was 36 (an average rate of 11.8%). Therefore, in comparison to the same period in 2013, five more units within the Primary Shopping Area have been occupied. In December 2014, five of the 26 empty units were not available for lease. Reasons include units being refurbished in readiness for a new incoming tenant, or the lease contract for the unit is in the hands of administrators for companies no longer trading. Actions The ED team has been supporting the new landlord of 24 Westgate Street (the former Santander building), who is looking to convert the building into a deli / café and utilise the upper floors for residential accommodation, and create a business ‘area’ within the unit for home working businesses to meet and share ideas. Plans are currently progressing through the planning service with an anticipated opening in Spring 2015. Gloucester Supports Business Grant Scheme: To date 61 businesses have been supported with grants, creating over 225 jobs. We currently have a number of businesses going through the grants paperwork process.

34 | P a g e
THE NUMBER OF LICENSED FOOD RETAILERS IN THE CITY CENTRE
The number of restaurants and food retailers within the primary retail area
Q2 Q3 YTD Average
Food establishments 110 114 111.3 Target 110 110 109.7
RAG AMBER AMBER AMBER
80
85
90
95
100
105
110
115
120
Q1 Q2 Q3 Q4
Number of food establishments Target 2013/14

35 | P a g e
Q2
Information is being emailed to prospective investors, followed up and positive replies referred to commercial agents as appropriate on an ongoing basis as part of the ED team’s inward investment activity. We are currently working with a number of new investors looking to open new restaurants in the city. Local Alcohol Action Area (LAAA) Project – The LAAA programme identified a number of initiatives that aim to diversify the evening economy offer. Actions achieved to date include: - 50 independent restaurants, wine bars and similar evening operators contacted. Following this investment targeting the ED team showed three prospective restaurants around the city. This has resulted so far in one restaurant agreeing terms to locate within the city centre, whilst we are in discussions with two others to locate within Gloucester - 17 businesses have expressed an interest in the Evening Vitality Grants to date with one application received - Positive discussions have taken place with GFirst LEP to develop a funding bid to provide customer service and ambassadorial training, which will, amongst others, be offered to Gloucester’s hospitality industry
Q3
Information is being emailed to prospective investors, followed up and positive replies referred to commercial agents as appropriate on an ongoing basis as part of the ED team’s inward investment activity. We have worked with a number of new investors looking to open new restaurants in the city. New restaurants recently opened in the city centre include Bella Roma, Westgate Street, Sahara Lounge, Brunswick Road and Fat Toni’s Pizzeria, St Aldate Street. 19 businesses have expressed an interest in the Evening Vitality Grants to date with two applications received and currently going through the application process. The ED team has also been working with Marketing Gloucester to develop an eating out guide for the city centre due to be released Spring/Summer 2015. In preparation for Gloucester hosting the Rugby World Cup in 2015, the city successfully secured funding to deliver WorldHost accredited customer service and ambassador training for 600 front of house staff across Gloucester. Training will be rolled out from November 2014. The training will, amongst others, be offered to Gloucester’s hospitality industry.

36 | P a g e
LISTENING TO OUR RESIDENTS
FOLLOWERS TO GCC’S TWITTER ACCOUNT
The number people following Gloucester City Council on Twitter
Q2 Q3
Twitter followers 4,271 4,498 Target 3,500 3,650
RAG GREEN GREEN
Q2
We are seeing daily increases in our Twitter followers as we are increasing our Digital Communications across the authority. We have exceeded our target and hope to grow further over the coming months.
Q3 We are well on our way to achieving our 5,000 follower target seeing new followers daily. Our use of Twitter within the authority is growing - being active helps to encourage new followers.
3000
3200
3400
3600
3800
4000
4200
4400
4600
Q1 Q2 Q3 Q4
Twitter Followers Target

37 | P a g e
SOUND FINANCES AND STRONG PERFORMANCE
SOUND FINANCES
THE NET INCOME RECEIVED FROM THE CITY COUNCIL’S INVESTMENT PROPERTY
Overview of the revenue and expenditure associated with the Council’s investment property portfolio
Q2 Q3 YTD
Revenue £553,049.13 £366,920.00 £1,270,917.73 Expenditure £33,014.50 £30,397.57 £110,059.31 Net Income £520,034.63 £336,522.43 £1,160,858.42
Target (YTD Net Income) - - £934,965.00 RAG - - GREEN
Q2
We have continued to try and drive down revenue expenditure on repairs and maintenance whilst striking a happy balance of not allowing the stock to further degrade. Weather conditions were favourably dry and there were few unexpected or emergency repairs. Income is up but whilst this is encouraging and reflects well on our management practices, it may be skewed as we enjoy the rewards of both the 24th June and 29th September quarter days (rent due dates) in this period.
Q3
Following the rent received from September invoicing the portfolio income has balanced and is on track and in line with budget expectation. Further rent invoices will have been issued at the end of December and the majority of money receivable will come in during periods 10 and 11. There remains very little void property and we have made good progress in teasing out opportunities to increase income where possible.
£0.00
£200,000.00
£400,000.00
£600,000.00
£800,000.00
£1,000,000.00
£1,200,000.00
£1,400,000.00
Q1 Q2 Q3 Q4
YTD NET Income Target (Budget)

38 | P a g e
BIANNUAL MEASURES
Reported in September
GROWING GLOUCESTER’S ECONOMY
ATTRACTING INVESTMENT
The Growth Hub The City Centre Investment Fund Growth Sectors
A THRIVING CENTRE AND REGENERATION OF THE CITY
The Townscape Heritage Initiative Scheme Purple Flag evening economy New Indoor Market Kings Quarter Development
WORKING WITH OUR COMMUNITIES
LISTENING TO OUR RESIDENTS
Customer feedback received through GovMetric Key Consultations Community asset transfers Councillor’s Community Fund
AN ACTIVE, HEALTHY AND SAFE CITY FOR ALL TO ENJOY
CCTV upgrades The Heart City Project Sports Hub for the South of the City The Rugby World Cup 2015 Green Flag Playing Pitch Strategy
A CITY FOR EVERYONE
Community Builders Families First Initiative Employee Volunteer Scheme Community Grant funding Community Legacy funding
CREATING PRIDE IN OUR CITY AND IMPROVING OUR ENVIRONMENT
A GREENER GLOUCESTER
Flood alleviation
AFFORDABLE AND DECENT HOUSING FOR ALL
Housing stock transfer Empty homes Affordable housing The City Plan

39 | P a g e
ANNUAL MEASURES
Reported in March
GROWING GLOUCESTER’S ECONOMY
ATTRACTING INVESTMENT
NET Business growth
A CITY WITH SKILLS AND JOB OPPORTUNITIES
Apprenticeships
A THRIVING CENTRE AND REGENERATION OF THE CITY
Nighttime crime in the City Centre
WORKING WITH OUR COMMUNITIES
LISTENING TO OUR RESIDENTS
Budget consultation
AN ACTIVE, HEALTHY AND SAFE CITY FOR ALL TO ENJOY
General crime levels Public perception of ASB Trees planted
CREATING PRIDE IN OUR CITY AND IMPROVING OUR ENVIRONMENT
A GREENER GLOUCESTER
CO2 emissions
SOUND FINANCES AND STRONG PERFORMANCE
SOUND FINANCES
Five Year Money Plan Shared Service delivery
IMPROVING PERFORMANCE
Service standards included in Business Plans Annual Staff Survey