DECEMBER 2014 Health Service · New KPI 2014 99,973 99,973 ... % of medical patients who are...
108
Management Data Report Management Data Report Management Data Report Management Data Report Health Service DECEMBER 2014 DECEMBER 2014 DECEMBER 2014 DECEMBER 2014 1 1
Transcript of DECEMBER 2014 Health Service · New KPI 2014 99,973 99,973 ... % of medical patients who are...

Management Data ReportManagement Data ReportManagement Data ReportManagement Data Report
Health Service
DE
CE
MB
ER
2014
DE
CE
MB
ER
2014
DE
CE
MB
ER
2014
DE
CE
MB
ER
2014
11

CONTENTSCONTENTSCONTENTSCONTENTS
Divisions Page FINANCE Page HUMAN RESOURCES Page
Acute Division 3 Finance Overview 71 Human Resources Overview 99
National Cancer Control Programme 8 Detailed Finance Report 72 Service Delivery Overview - HR 101
Inpatient Discharges 11 Service Delivery Overview - Finance 73 Hospital Addendum 102
Day Cases 15 Agency Costs 74 Absence Rates 104
Emergency Admissions 18 Summary by Regional Area 76
Elective Admissions 21 Sumary by Regional Area - Statutory and Voluntary System 77
Emergency Care - all Emergency Presentations 24 Summary by Region within Cost Category 78
Outpatient Attendances 27 DML - Expenditure by Statutory/Voluntary Provider and LHO 79
Outpatient Waiting List 31 DNE - Expenditure by Statutory/Voluntary Provider and LHO 81
OPD: Patients Waiting by Speciality 34 South - Expenditure by Statutory/Voluntary Provider and LHO 82
Births 38 West - Expenditure by Statutory/Voluntary Provider and LHO 83
Adult Waiting Lists Inpatient and Day Case 40 Ambulance Service - Expenditure by Area 84
Child Waiting Lists Inpatient and Day Case 43 Expenditure by Support Function 85
Inpatient Profiles 46 Expenditure by Schemes 86
Palliative Care Services 49 Net Expenditure – Summary by Region 87
National Ambulance Service 51 Net Expenditure – Summary Other 88
Heath & Wellbeing Division 55 Income Summary 89
Primary Care Division 58 Expenditure by Hospital Group 91
Primary Care Division - PCRS 61 Acute Finance & HR Detail 93
Primary Care Division - Social Inclusion 62 Gross Debtors Day 95
Social Care - Disability Services 64 Capital Vote 96
Social Care - Services for Older People 66 Dec Vote 97
Mental Health Division 69
2

Full Year YTD Oct-14 Nov-14 Dec-14Reported
Actual YTD
% var YTD v
Tgt / EA YTD
Discharges Activity
Inpatient
M 592,683 591,699 591,699 51,215 47,894 50,472 592,878 0.2%
Day Case
M 838,922 797,328 797,329 71,351 67,045 60,884 808,365 1.4%
Emergency Care
- New ED attendances
M 1,064,849 1,093,187 1,093,187 91,706 88,234 89,287 1,097,938 0.4%
- Return ED attendances
M 90,558 89,371 89,370 7,457 6,921 7,345 84,904 -5.0%
- Other emergency presentations
M 120,483 108,490 108,490 7,762 6,923 7,085 89,314 -17.7%
No. of emergency admissions
M 390,322 402,202 402,202 33,467 32,000 34,471 396,936 -1.3%
Elective Inpatient Admissions
M
New KPI
2014 99,973 99,973 9,098 8,847 7,143 101,126 1.2%
No. of outpatient attendances
M
New KPI
2014 2,571,115 2,571,115 286,587 261,213 238,363 3,212,906 25.0%
Outpatient Attendances - New : Return Ratio
M 1 : 2 1 : 2 1 : 2.6 1 : 2.6 1 : 2.6 1 : 2.6 -30.0%
Births
Total no. of births
M 67,959 67,899 67,899 5,991 5,369 5,607 67,347 -0.8%
Inpatient and Day Case Waiting Times
No. of adults waiting > 8 months for an elective
procedure (inpatient) M 4 0 0 3,898 4,212 4,454 4,454
No. of adults waiting > 8 months for an elective
procedure (day case) M 0 0 0 7,738 8,328 8,961 8,961
No. of children waiting > 20 weeks for an elective
procedure (inpatient) M 179 0 0 1,256 1,342 1,378 1,378
No. of children waiting > 20 weeks for an elective
procedure (day case) M 14 0 0 802 892 904 904
Colonoscopy / Gastrointestinal Service
Year to dateAcute DivisionData
Timing
Outturn
2013
Target/Expected
Activity2014
3

Full Year YTD Oct-14 Nov-14 Dec-14Reported
Actual YTD
% var YTD v
Tgt / EA YTD
Year to dateAcute DivisionData
Timing
Outturn
2013
Target/Expected
Activity2014
No. of people waiting > 4 weeks for an urgent
colonoscopy M 0 0 0 9 15 21 21
No. of people waiting > 13 weeks following a
referral for routine colonoscopy or OGD M 96 0 0 4,744 4,879 4,850 4,850
Emergency Care
% of all attendees at ED who are discharged or
admitted within 6 hours of registration M 66.3% 95% 95.0% 70.4% 68.4% 68.2% 67.6% -28.8%
% of all attendees at ED who are discharged or
admitted within 9 hours of registration M 80.8% 100% 100.0% 82.9% 81.6% 81.9% 81.3% -18.7%
Reduction of trolley waits
M
New KPI
2014 10% 10% -35.7% -41.2% -46.6 -6.1% -161.0%
HIQA Tallaght Report
No. of patients who re-attend the ED with the same
clinical condition within 7 daysQ
New KPI
2014 <5% <5%
No. of patients being cared for in inappropriate care
Q
New KPI
2015 <5% <5%
% of ED patients who leave before completion of
treatment Q <5% <5% <5% 4.4% 3.7% 4.2% 4.4% 11.7%
Outpatients (OPD)
No. of people waiting longer than 52 weeks for OPD
appointment M 4,937 0 0 51,286 55,733 61,400 61,400
Acute Medical Patient Processing
% of medical patients who are discharged or
admitted from AMAU within 6 hours AMAU
registration M 95% 95.0% 65.6% 65.9% 73.8% 63.7% -32.9%
Average Length of Stay
ALOS for all inpatients
M 5.6 5.6 5.1 5.2 5.3 5.3 5.4%
ALOS for all inpatient discharges excluding LOS
over 30 days M 4.5 4.5 4.4 4.6 4.4 4.5 0.0%
Medical patient average length of stay
M 5.8 5.8 6.5 6.8 6.7 6.9 -19.0%
Surgical patient average length of stay
M 5.3 5.3 4.9 4.9 5 5.3 0.0%
KPI in development. Data Not yet available
KPI in development. Data Not yet available
4

Full Year YTD Oct-14 Nov-14 Dec-14Reported
Actual YTD
% var YTD v
Tgt / EA YTD
Year to dateAcute DivisionData
Timing
Outturn
2013
Target/Expected
Activity2014
Stroke
% of patients with confirmed acute ischaemic stroke
in whom thrombolysis is not contraindicated who
receive thrombolysis Q 9% 9% 11.8% 11.8% 31.1%
% of hospital stay for acute stroke patients in stroke
unit who are admitted to an acute or combined
stroke unit Q 50% 50% 61.5% 61.5% 23.0%
Acute Coronary Syndrome
% STEMI patients (without contraindication to
reperfusion therapy) who get PPCI Q 70% 70% 84.1% 84.1% 20.1%
Surgery
% of elective surgical inpatients who had principal
procedure conducted on day of admission M 85% 85% 65% 65% 65% 65% -23.5%
% of surgical re-admissions to the same hospital
within 30 days of discharge M <3% <3% 2.0% 2.0% 2.0% 2.0% 33.3%
% of emergency hip fracture surgery carried out
within 48 hours (pre-op LOS: 0, 1 or 2)M 95% 95.0% 85.0% 82.0% 85.0% 82.0% -13.7%
Emergency Care
% of emergency re-admissions for acute medical
conditions to the same hospital within 28 days of
discharge M 9.6% 9.6% 10.0% 10.0% 9.0% 11.0% -14.6%
Medication Management
% of medication errors causing harm / no harm /
death reported to CIS – as a % of bed days or
population
Q
New KPI
2014
Hospital
Variance with
National
Baseline
Hospital
Variance with
National
Baseline 0.1390% 0.1390%
Delayed Discharges
Reduction in bed days lost through delayed
discharges M 10% Reduction 219,055 23,935 23,212 22,763 236,774 -8.1%
Reduction in no. of people subject to delayed
discharges M 10% Reduction 602 782 835 719 719 -19.4%
5

Full Year YTD Oct-14 Nov-14 Dec-14Reported
Actual YTD
% var YTD v
Tgt / EA YTD
Year to dateAcute DivisionData
Timing
Outturn
2013
Target/Expected
Activity2014
Health Care Associated Infections
Rate of MRSA bloodstream infections in acute
hospital per 1,000 bed days used (Quarterly) Q in arrears < 0.057 < 0.057 Data not available 100.0%
Rate of new cases of Clostridium Difficile
associated diarrhoea in acute hospitals per 10,000
bed days used Q in arrears < 2.5 < 2.5 2.2 16% 93.6%
Median hospital total antibiotic consumption rate
(defined daily dose per 100 bed days) per hospital
Bi-Annual 83
79.5
4.2%
Alcohol Hand Rub consumption (litres per 1,000
bed days used) Bi-Annual 2527.1
8.4%
% compliance of hospital staff with the World Health
Organisation’s (WHO) 5 moments of hand hygiene
using the national hand hygiene audit tool
Bi-Annual 90%
85.6%
4.20%
Patient Experience
% of hospitals conducting annual patient experience
surveys amongst representative samples of their
patient population A
New KPI
2014 100% #DIV/0!
HR – Compliance with EWTD
< 24 hour shift
M
New KPI
2014 100% 100%data not available data not available -100%
< 48 hour working week
M
New KPI
2014 100% 100%data not available data not available -100%National Early Warning Score (NEWS)
% of Hospitals with full implementation of NEWS in
all clinical areas of acute Hospitals and single
specialty hospitals Q
New KPI
2014 95% 95% 98% 98.0% 3%
% of all clinical staff who have been trained in the
COMPASS programme Q
New KPI
2014 > 95% > 95% Data Not Yet AvailableNational Standards
% of Hospitals who have commenced first
assessment against the NSSBH Q
New KPI
2014 95% 95%
% of Hospitals who have completed first
assessment against the NSSBH
Q
New KPI
2014 95% 95%
New KPI for 2014 which is still in development
data not yet available
New KPI for 2014 which is still in development
data not yet available
6

Full Year YTD Oct-14 Nov-14 Dec-14Reported
Actual YTD
% var YTD v
Tgt / EA YTD
Year to dateAcute DivisionData
Timing
Outturn
2013
Target/Expected
Activity2014
MFTP
% of HIPE coding episodes completed within 30
days of discharge M
New KPI
2014 > 95% > 95% 95% 96% 95% 95% 0.0%
7

Activity
YTD
SPLY
% var
YTD
2014 v
YTD
2013
No. % No. % No. % No. % No. % No. % No. %
No. & % of attendances
whose referrals were triaged
as urgent by the cancer
centre and adhered to the
HIQA standard of 2 weeks
for urgent referrals (No and
% offered an appointment
that falls within 2 weeks)
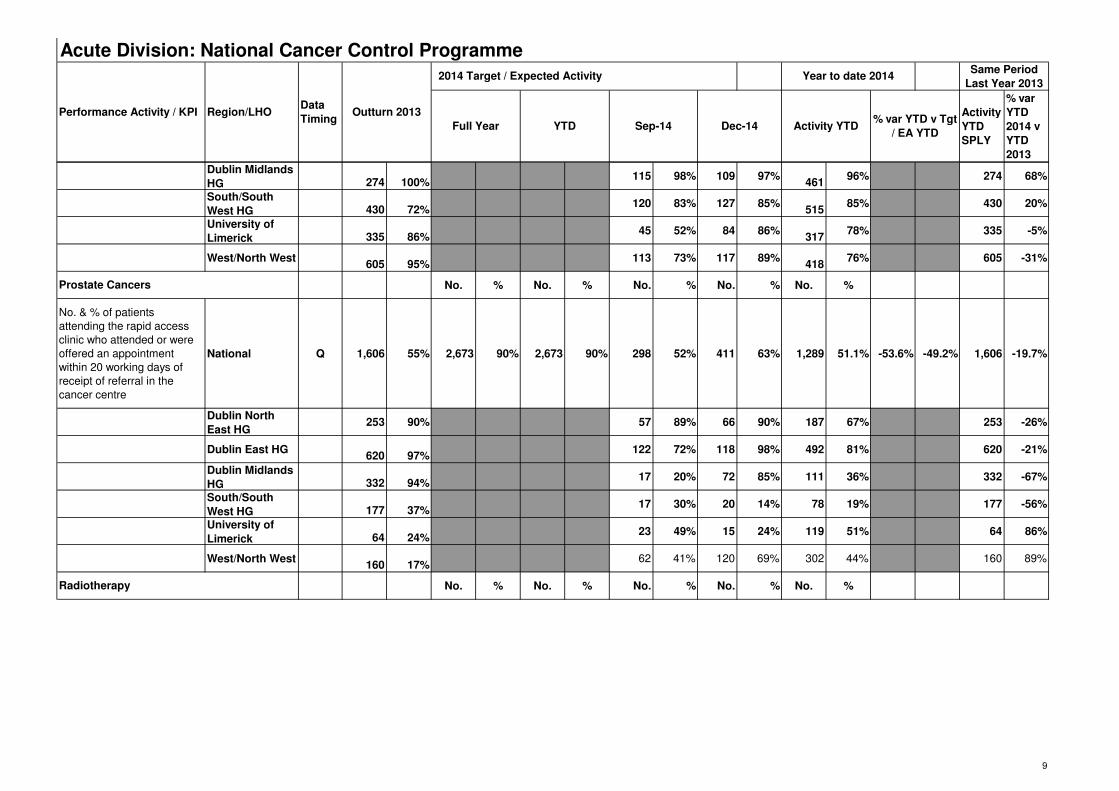
National Q 14,680 98% 13,200 95% 13,200 95.0% 3,639 96% 3,474 92% 14,882 94% 18.3% -1.7% 14,680 1%
Dublin North
East HG1,969 100% 499 100% 470 100% 2,080 100% 1,969 6%
Dublin East HG4,386 100%
1079 100% 1097 100% 4,741 100% 4,386 8%
Dublin Midlands
HG 1,564 100%356 100% 345 100% 1,445 100% 1,564 -8%
South/South
West HG3,617 96%
886 100% 750 77% 3,394 84% 3,617 -6%
University of
Limerick 1,217 94%316 97% 355 100% 1,368 98% 1,217 12%
West/North West1,927 98%
503 96% 457 86% 1,854 89% 1,927 -4%
No. % No. % No. % No. % No. %
No & % of patients attending
the rapid access clinic who
attended or were offered an
appointment within 10
working days of receipt of
referral in the cancer centre
National Q 2,637 91% 2,565 95% 2,565 95.0% 642 85% 671 92% 2,691 88% 17% -5.4% 2,637 2%
Dublin North
East HG429 100% 92 100% 95 100% 377 99% 429 -12%
Dublin East HG564 100%
157 95% 139 99%603
96% 564 7%
Year to date 2014
Symptomatic Breast Cancer Services
2014 Target / Expected Activity
Lung Cancers
Acute Division: National Cancer Control Programme
Performance Activity / KPI Region/LHOData
TimingOutturn 2013
Same Period
Last Year 2013
Full Year YTD% var YTD v Tgt
/ EA YTDSep-14 Dec-14 Activity YTD
8
Activity
YTD
SPLY
% var
YTD
2014 v
YTD
2013
Year to date 20142014 Target / Expected Activity
Acute Division: National Cancer Control Programme
Performance Activity / KPI Region/LHOData
TimingOutturn 2013
Same Period
Last Year 2013
Full Year YTD% var YTD v Tgt
/ EA YTDSep-14 Dec-14 Activity YTD
Dublin Midlands
HG 274 100%115 98% 109 97%
46196% 274 68%
South/South
West HG 430 72%120 83% 127 85%
51585% 430 20%
University of
Limerick 335 86%45 52% 84 86%
31778% 335 -5%
West/North West605 95%
113 73% 117 89%418
76% 605 -31%
No. % No. % No. % No. % No. %
No. & % of patients
attending the rapid access
clinic who attended or were
offered an appointment
within 20 working days of
receipt of referral in the
cancer centre
National Q 1,606 55% 2,673 90% 2,673 90% 298 52% 411 63% 1,289 51.1% -53.6% -49.2% 1,606 -19.7%
Dublin North
East HG253 90% 57 89% 66 90% 187 67% 253 -26%
Dublin East HG620 97%
122 72% 118 98% 492 81% 620 -21%
Dublin Midlands
HG 332 94%17 20% 72 85% 111 36% 332 -67%
South/South
West HG 177 37%17 30% 20 14% 78 19% 177 -56%
University of
Limerick 64 24%23 49% 15 24% 119 51% 64 86%
West/North West160 17%
62 41% 120 69% 302 44% 160 89%
No. % No. % No. % No. % No. %Radiotherapy
Prostate Cancers
9

Activity
YTD
SPLY
% var
YTD
2014 v
YTD
2013
Year to date 20142014 Target / Expected Activity
Acute Division: National Cancer Control Programme
Performance Activity / KPI Region/LHOData
TimingOutturn 2013
Same Period
Last Year 2013
Full Year YTD% var YTD v Tgt
/ EA YTDSep-14 Dec-14 Activity YTD
No & % of patients
undergoing radical
radiotherapy treatment who
commenced treatment within
15 working days of being
deemed ready to treat by the
radiation oncologist
(palliative care patients not
included)
National Q 3,181 81% 4,546 90% 4,546 90% 919 88% 875 82% 3,612 87.6% -18.5% 1.8% 3,181 13.5%
SLRON2,057 80%
519 85% 514 80% 2,145 94% 2,057 4%
Cork University
Hospital 590 83%235 90% 221 86% 862 89% 590 46%
Galway
University
Hospital 534 80%
165 92% 140 85% 605 87% 534 13%
PLEASE NOTE:
PROSTATE:Q4 2014 data does not include November, December figures for The Mater as this was not available at the time
RADIATION ONCOLOGY: Radiation Oncology Q1 2013 data for CUH was not available
10
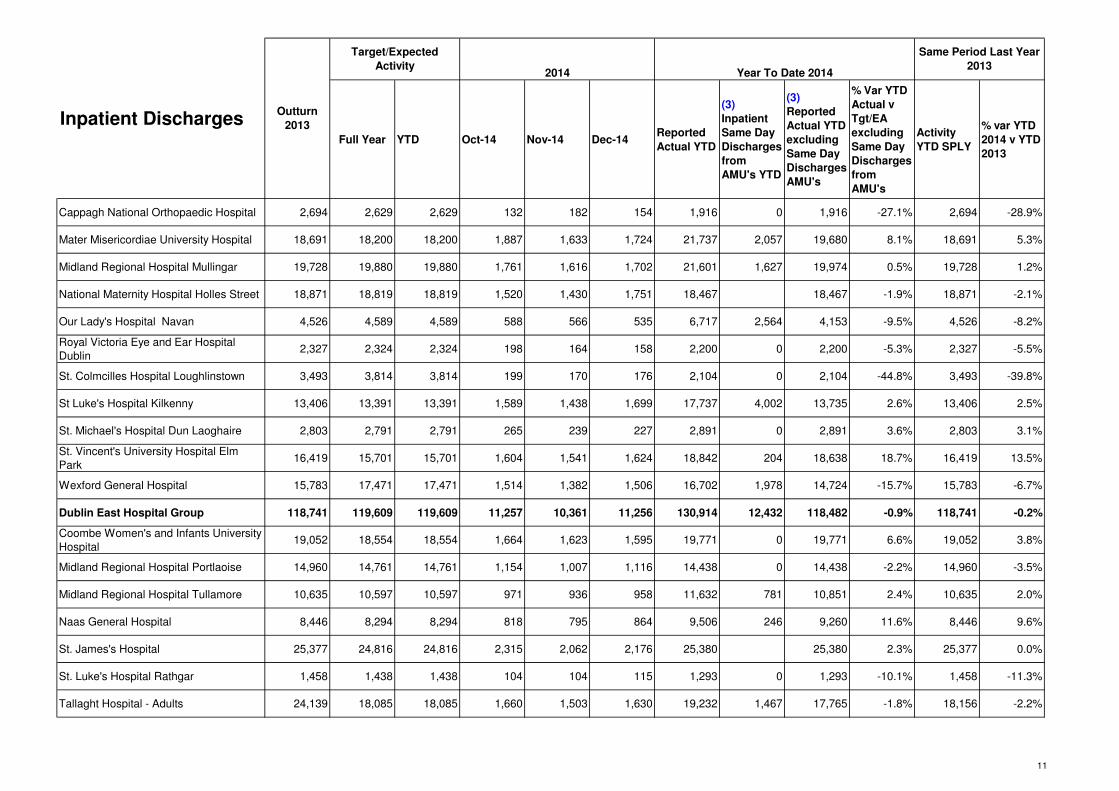
Full Year YTD Oct-14 Nov-14 Dec-14Reported
Actual YTD
(3)
Inpatient
Same Day
Discharges
from
AMU's YTD
(3)
Reported
Actual YTD
excluding
Same Day
Discharges
AMU's
% Var YTD
Actual v
Tgt/EA
excluding
Same Day
Discharges
from
AMU's
Activity
YTD SPLY
% var YTD
2014 v YTD
2013
Cappagh National Orthopaedic Hospital 2,694 2,629 2,629 132 182 154 1,916 0 1,916 -27.1% 2,694 -28.9%
Mater Misericordiae University Hospital 18,691 18,200 18,200 1,887 1,633 1,724 21,737 2,057 19,680 8.1% 18,691 5.3%
Midland Regional Hospital Mullingar 19,728 19,880 19,880 1,761 1,616 1,702 21,601 1,627 19,974 0.5% 19,728 1.2%
National Maternity Hospital Holles Street 18,871 18,819 18,819 1,520 1,430 1,751 18,467 18,467 -1.9% 18,871 -2.1%
Our Lady's Hospital Navan 4,526 4,589 4,589 588 566 535 6,717 2,564 4,153 -9.5% 4,526 -8.2%
Royal Victoria Eye and Ear Hospital
Dublin2,327 2,324 2,324 198 164 158 2,200 0 2,200 -5.3% 2,327 -5.5%
St. Colmcilles Hospital Loughlinstown 3,493 3,814 3,814 199 170 176 2,104 0 2,104 -44.8% 3,493 -39.8%
St Luke's Hospital Kilkenny 13,406 13,391 13,391 1,589 1,438 1,699 17,737 4,002 13,735 2.6% 13,406 2.5%
St. Michael's Hospital Dun Laoghaire 2,803 2,791 2,791 265 239 227 2,891 0 2,891 3.6% 2,803 3.1%
St. Vincent's University Hospital Elm
Park16,419 15,701 15,701 1,604 1,541 1,624 18,842 204 18,638 18.7% 16,419 13.5%
Wexford General Hospital 15,783 17,471 17,471 1,514 1,382 1,506 16,702 1,978 14,724 -15.7% 15,783 -6.7%
Dublin East Hospital Group 118,741 119,609 119,609 11,257 10,361 11,256 130,914 12,432 118,482 -0.9% 118,741 -0.2%
Coombe Women's and Infants University
Hospital19,052 18,554 18,554 1,664 1,623 1,595 19,771 0 19,771 6.6% 19,052 3.8%
Midland Regional Hospital Portlaoise 14,960 14,761 14,761 1,154 1,007 1,116 14,438 0 14,438 -2.2% 14,960 -3.5%
Midland Regional Hospital Tullamore 10,635 10,597 10,597 971 936 958 11,632 781 10,851 2.4% 10,635 2.0%
Naas General Hospital 8,446 8,294 8,294 818 795 864 9,506 246 9,260 11.6% 8,446 9.6%
St. James's Hospital 25,377 24,816 24,816 2,315 2,062 2,176 25,380 25,380 2.3% 25,377 0.0%
St. Luke's Hospital Rathgar 1,458 1,438 1,438 104 104 115 1,293 0 1,293 -10.1% 1,458 -11.3%
Tallaght Hospital - Adults 24,139 18,085 18,085 1,660 1,503 1,630 19,232 1,467 17,765 -1.8% 18,156 -2.2%
Inpatient DischargesOutturn
2013
Target/Expected
Activity2014 Year To Date 2014
Same Period Last Year
2013
11

Full Year YTD Oct-14 Nov-14 Dec-14Reported
Actual YTD
(3)
Inpatient
Same Day
Discharges
from
AMU's YTD
(3)
Reported
Actual YTD
excluding
Same Day
Discharges
AMU's
% Var YTD
Actual v
Tgt/EA
excluding
Same Day
Discharges
from
AMU's
Activity
YTD SPLY
% var YTD
2014 v YTD
2013
Inpatient DischargesOutturn
2013
Target/Expected
Activity2014 Year To Date 2014
Same Period Last Year
2013
Dublin Midlands Hospital Group 104,067 96,545 96,545 8,686 8,030 8,454 101,252 2,494 98,758 2.3% 98,084 0.7%
Beaumont Hospital (2) 23,815 23,223 23,223 2,018 1,898 1,923 24,702 680 24,022 3.4% 23,815 0.9%
Cavan General Hospital 14,819 14,823 14,823 1,447 1,448 1,471 17,272 3,378 13,894 -6.3% 14,819 -6.2%
Connolly Hospital Blanchardstown 10,486 10,899 10,899 1,302 1,189 1,253 13,376 1,866 11,510 5.6% 10,486 9.8%
Louth County Hospital 214 232 232 12 10 7 149 149 -35.8% 214 -30.4%
Our Lady of Lourdes Hospital Drogheda 24,597 24,262 24,262 2,416 2,332 2,333 28,621 4,738 23,883 -1.6% 24,597 -2.9%
Rotunda Hospital 15,556 15,401 15,401 1,297 1,132 1,168 15,009 0 15,009 -2.5% 15,556 -3.5%
Dublin North East Hospital Group 89,487 88,840 88,840 8,492 8,009 8,155 99,129 10,662 88,467 -0.4% 89,487 -1.1%
Bantry General Hospital 1,908 1,955 1,955 372 298 388 4,204 2,038 2,166 10.8% 1,908 13.5%
Cork University Hospital 30,846 30,596 30,596 2,817 2,648 2,784 32,867 2,536 30,331 -0.9% 30,846 -1.7%
Cork University Maternity Hospital 14,702 14,645 14,645 1,292 1,113 1,121 14,469 0 14,469 -1.2% 14,702 -1.6%
Kerry General Hospital 13,198 13,331 13,331 1,232 1,279 1,343 15,134 1,565 13,569 1.8% 13,198 2.8%
Lourdes Orthopaedic Hospital Kilcreene 987 954 954 73 78 58 836 0 836 -12.4% 987 -15.3%
Mallow General Hospital 2,499 2,327 2,327 403 352 410 4,633 2,448 2,185 -6.1% 2,499 -12.6%
Mercy University Hospital Cork 11,291 10,928 10,928 1,030 944 953 11,738 830 10,908 -0.2% 11,291 -3.4%
South Infirmary University Hospital Cork 8,190 7,979 7,979 1,005 1,007 852 10,515 0 10,515 31.8% 8,190 28.4%
South Tipperary General Hospital 12,378 12,378 12,378 985 973 1,039 12,957 1,971 10,986 -11.2% 12,378 -11.2%
Waterford Regional Hospital 20,042 19,991 19,991 1,967 1,878 2,060 23,388 953 22,435 12.2% 20,042 11.9%
South/South West Hospital Group 116,041 115,084 115,084 11,176 10,570 11,008 130,741 12,341 118,400 2.9% 116,041 2.0%
12

Full Year YTD Oct-14 Nov-14 Dec-14Reported
Actual YTD
(3)
Inpatient
Same Day
Discharges
from
AMU's YTD
(3)
Reported
Actual YTD
excluding
Same Day
Discharges
AMU's
% Var YTD
Actual v
Tgt/EA
excluding
Same Day
Discharges
from
AMU's
Activity
YTD SPLY
% var YTD
2014 v YTD
2013
Inpatient DischargesOutturn
2013
Target/Expected
Activity2014 Year To Date 2014
Same Period Last Year
2013
Croom Hospital 1,865 1,830 1,830 142 149 147 1,847 1,847 0.9% 1,865 -1.0%
Ennis Hospital 2,846 2,890 2,890 343 312 320 4,104 1,944 2,160 -25.3% 2,846 -24.1%
Nenagh Hospital 1,660 1,544 1,544 176 169 180 2,052 279 1,773 14.8% 1,660 6.8%
St. John's Hospital 4,293 3,887 3,887 547 507 452 5,607 1,651 3,956 1.8% 4,293 -7.8%
University Hospital, Limerick 26,414 28,472 28,472 2,283 2,149 2,336 26,029 2,000 24,029 -15.6% 26,414 -9.0%
University Maternity Hospital, Limerick 7,829 7,898 7,898 709 649 652 7,887 0 7,887 -0.1% 7,829 0.7%
University of Limerick Hospital Group 44,907 46,521 46,521 4,200 3,935 4,087 47,526 5,874 41,652 -10.5% 44,907 -7.2%
Galway University Hospitals 36,242 35,877 35,877 3,342 2,974 3,109 38,353 2,399 35,954 0.2% 36,242 -0.8%
Letterkenny General Hospital 19,153 19,094 19,094 1,847 1,775 1,927 21,136 805 20,331 6.5% 19,153 6.2%
Mayo General Hospital 16,254 16,232 16,232 1,583 1,525 1,605 19,051 2,796 16,255 0.1% 16,254 0.0%
Portiuncula Hospital General & Maternity 11,685 11,648 11,648 1,177 1,054 1,117 13,084 1,166 11,918 2.3% 11,685 2.0%
Roscommon County Hospital 1,636 1,649 1,649 138 164 131 1,979 420 1,559 -5.5% 1,636 -4.7%
Sligo General Hospital 17,147 17,711 17,711 1,556 1,441 1,534 17,729 1,048 16,681 -5.8% 17,147 -2.7%
West/ North West 102,117 102,211 102,211 9,643 8,933 9,423 111,332 8,634 102,698 0.5% 102,117 0.6%
Children's University Hospital Temple
Street7,541 7,294 7,294 650 611 632 7,815 0 7,815 7.1% 7,541 3.6%
Our Lady's Hospital for Sick Children
Crumlin9,782 9,612 9,612 915 838 968 10,510 0 10,510 9.3% 9,782 7.4%
Tallaght Hospital - Children 5,983 5,983 571 582 577 6,096 0 6,096 1.9% 5,983 1.9%
Children's Hospital Group 17,323 22,889 22,889 2,136 2,031 2,177 24,421 0 24,421 6.7% 23,306 4.8%
National Total 592,683 591,699 591,699 55,590 51,869 54,560 645,315 52,437 592,878 0.2% 592,683 0.03%
13

Full Year YTD Oct-14 Nov-14 Dec-14Reported
Actual YTD
(3)
Inpatient
Same Day
Discharges
from
AMU's YTD
(3)
Reported
Actual YTD
excluding
Same Day
Discharges
AMU's
% Var YTD
Actual v
Tgt/EA
excluding
Same Day
Discharges
from
AMU's
Activity
YTD SPLY
% var YTD
2014 v YTD
2013
Inpatient DischargesOutturn
2013
Target/Expected
Activity2014 Year To Date 2014
Same Period Last Year
2013
Notes:
1. All 49 Acute Hospitals who provide Inpatient Services are included in thIs report.
2. Beaumont Hospial data is inclusive of activity carried out in St.Joseph's Hospital, Raheny.
3. As per Acute Medicine Programme guidelines, all patients presenting to AMU/AMAU/MAU are to be registered as an Inpatient as opposed to an Emergency attendance at the hospital. This will
lead to an increase in inpatient discharges being recorded from 2013 onwards compared to previous years. In order to keep continuity with comparisons to target (2014 targets based on pre AMP
guidelines) and previous years data the table above shows not only the total number of inpatient discharges reported by hospitals each month and YTD inclusive 'Same Day Discharges' from
AMU/AMAU/MAU but also the YTD numbers excluding Same Day Discharges from AMU/AMAU/MAU's.
14
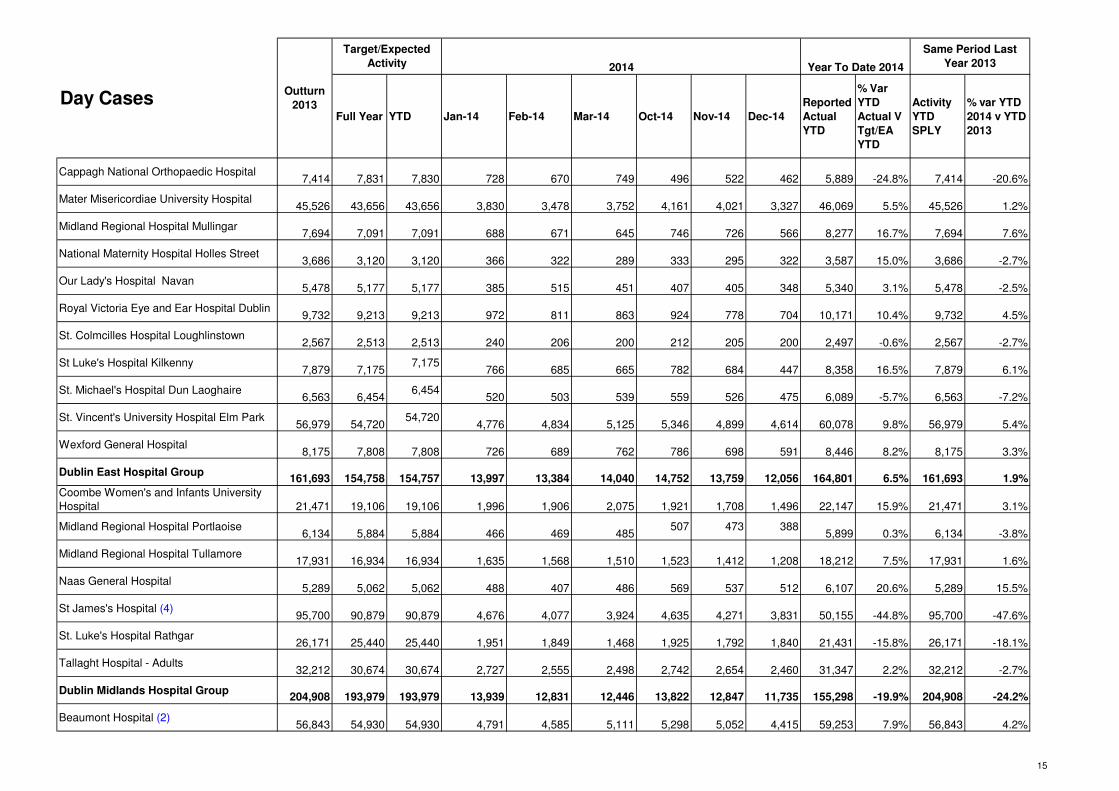
Full Year YTD Jan-14 Feb-14 Mar-14 Oct-14 Nov-14 Dec-14
Reported
Actual
YTD
% Var
YTD
Actual V
Tgt/EA
YTD
Activity
YTD
SPLY
% var YTD
2014 v YTD
2013
Cappagh National Orthopaedic Hospital7,414 7,831 7,830 728 670 749 496 522 462 5,889 -24.8% 7,414 -20.6%
Mater Misericordiae University Hospital45,526 43,656 43,656 3,830 3,478 3,752 4,161 4,021 3,327 46,069 5.5% 45,526 1.2%
Midland Regional Hospital Mullingar7,694 7,091 7,091 688 671 645 746 726 566 8,277 16.7% 7,694 7.6%
National Maternity Hospital Holles Street3,686 3,120 3,120 366 322 289 333 295 322 3,587 15.0% 3,686 -2.7%
Our Lady's Hospital Navan5,478 5,177 5,177 385 515 451 407 405 348 5,340 3.1% 5,478 -2.5%
Royal Victoria Eye and Ear Hospital Dublin9,732 9,213 9,213 972 811 863 924 778 704 10,171 10.4% 9,732 4.5%
St. Colmcilles Hospital Loughlinstown2,567 2,513 2,513 240 206 200 212 205 200 2,497 -0.6% 2,567 -2.7%
St Luke's Hospital Kilkenny7,879 7,175
7,175766 685 665 782 684 447 8,358 16.5% 7,879 6.1%
St. Michael's Hospital Dun Laoghaire6,563 6,454
6,454520 503 539 559 526 475 6,089 -5.7% 6,563 -7.2%
St. Vincent's University Hospital Elm Park56,979 54,720
54,7204,776 4,834 5,125 5,346 4,899 4,614 60,078 9.8% 56,979 5.4%
Wexford General Hospital8,175 7,808 7,808 726 689 762 786 698 591 8,446 8.2% 8,175 3.3%
Dublin East Hospital Group161,693 154,758 154,757 13,997 13,384 14,040 14,752 13,759 12,056 164,801 6.5% 161,693 1.9%
Coombe Women's and Infants University
Hospital 21,471 19,106 19,106 1,996 1,906 2,075 1,921 1,708 1,496 22,147 15.9% 21,471 3.1%
Midland Regional Hospital Portlaoise6,134 5,884 5,884 466 469 485
507 473 3885,899 0.3% 6,134 -3.8%
Midland Regional Hospital Tullamore17,931 16,934 16,934 1,635 1,568 1,510 1,523 1,412 1,208 18,212 7.5% 17,931 1.6%
Naas General Hospital5,289 5,062 5,062 488 407 486 569 537 512 6,107 20.6% 5,289 15.5%
St James's Hospital (4)95,700 90,879 90,879 4,676 4,077 3,924 4,635 4,271 3,831 50,155 -44.8% 95,700 -47.6%
St. Luke's Hospital Rathgar26,171 25,440 25,440 1,951 1,849 1,468 1,925 1,792 1,840 21,431 -15.8% 26,171 -18.1%
Tallaght Hospital - Adults32,212 30,674 30,674 2,727 2,555 2,498 2,742 2,654 2,460 31,347 2.2% 32,212 -2.7%
Dublin Midlands Hospital Group204,908 193,979 193,979 13,939 12,831 12,446 13,822 12,847 11,735 155,298 -19.9% 204,908 -24.2%
Beaumont Hospital (2)56,843 54,930 54,930 4,791 4,585 5,111 5,298 5,052 4,415 59,253 7.9% 56,843 4.2%
Day CasesOutturn
2013
Target/Expected
Activity 2014 Year To Date 2014
Same Period Last
Year 2013
15
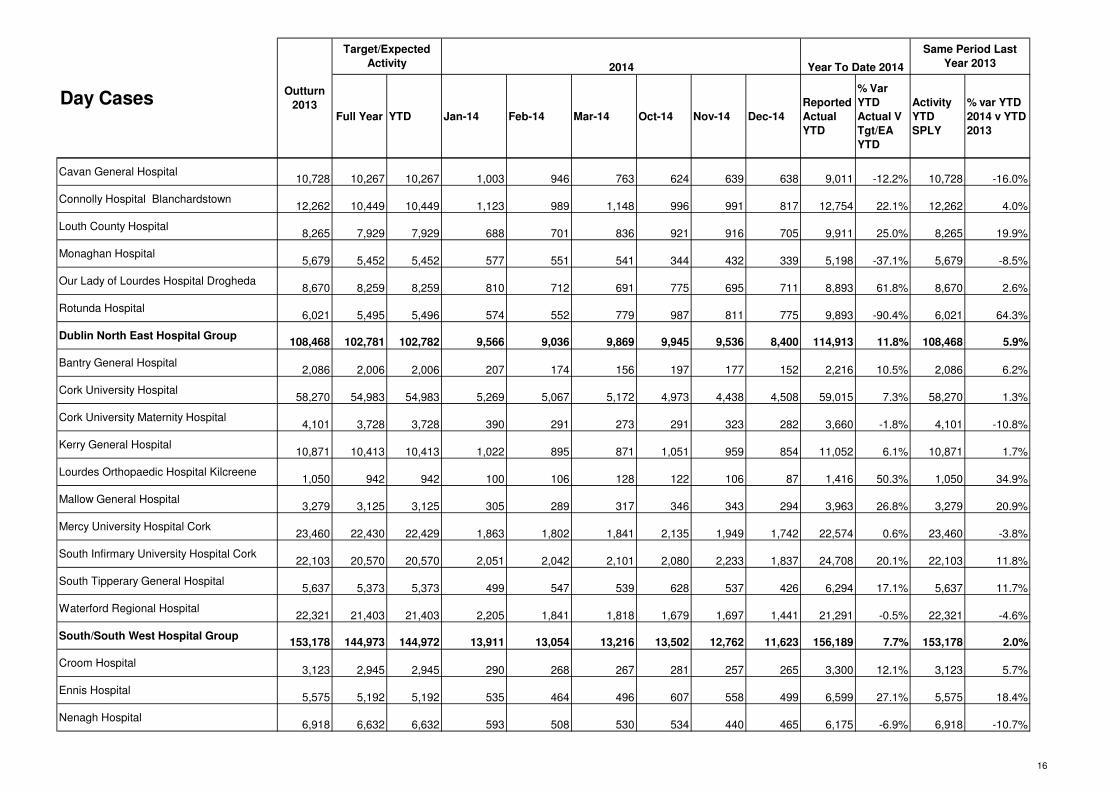
Full Year YTD Jan-14 Feb-14 Mar-14 Oct-14 Nov-14 Dec-14
Reported
Actual
YTD
% Var
YTD
Actual V
Tgt/EA
YTD
Activity
YTD
SPLY
% var YTD
2014 v YTD
2013
Day CasesOutturn
2013
Target/Expected
Activity 2014 Year To Date 2014
Same Period Last
Year 2013
Cavan General Hospital10,728 10,267 10,267 1,003 946 763 624 639 638 9,011 -12.2% 10,728 -16.0%
Connolly Hospital Blanchardstown12,262 10,449 10,449 1,123 989 1,148 996 991 817 12,754 22.1% 12,262 4.0%
Louth County Hospital8,265 7,929 7,929 688 701 836 921 916 705 9,911 25.0% 8,265 19.9%
Monaghan Hospital5,679 5,452 5,452 577 551 541 344 432 339 5,198 -37.1% 5,679 -8.5%
Our Lady of Lourdes Hospital Drogheda8,670 8,259 8,259 810 712 691 775 695 711 8,893 61.8% 8,670 2.6%
Rotunda Hospital6,021 5,495 5,496 574 552 779 987 811 775 9,893 -90.4% 6,021 64.3%
Dublin North East Hospital Group108,468 102,781 102,782 9,566 9,036 9,869 9,945 9,536 8,400 114,913 11.8% 108,468 5.9%
Bantry General Hospital2,086 2,006 2,006 207 174 156 197 177 152 2,216 10.5% 2,086 6.2%
Cork University Hospital58,270 54,983 54,983 5,269 5,067 5,172 4,973 4,438 4,508 59,015 7.3% 58,270 1.3%
Cork University Maternity Hospital4,101 3,728 3,728 390 291 273 291 323 282 3,660 -1.8% 4,101 -10.8%
Kerry General Hospital10,871 10,413 10,413 1,022 895 871 1,051 959 854 11,052 6.1% 10,871 1.7%
Lourdes Orthopaedic Hospital Kilcreene1,050 942 942 100 106 128 122 106 87 1,416 50.3% 1,050 34.9%
Mallow General Hospital3,279 3,125 3,125 305 289 317 346 343 294 3,963 26.8% 3,279 20.9%
Mercy University Hospital Cork23,460 22,430 22,429 1,863 1,802 1,841 2,135 1,949 1,742 22,574 0.6% 23,460 -3.8%
South Infirmary University Hospital Cork22,103 20,570 20,570 2,051 2,042 2,101 2,080 2,233 1,837 24,708 20.1% 22,103 11.8%
South Tipperary General Hospital5,637 5,373 5,373 499 547 539 628 537 426 6,294 17.1% 5,637 11.7%
Waterford Regional Hospital22,321 21,403 21,403 2,205 1,841 1,818 1,679 1,697 1,441 21,291 -0.5% 22,321 -4.6%
South/South West Hospital Group153,178 144,973 144,972 13,911 13,054 13,216 13,502 12,762 11,623 156,189 7.7% 153,178 2.0%
Croom Hospital3,123 2,945 2,945 290 268 267 281 257 265 3,300 12.1% 3,123 5.7%
Ennis Hospital5,575 5,192 5,192 535 464 496 607 558 499 6,599 27.1% 5,575 18.4%
Nenagh Hospital6,918 6,632 6,632 593 508 530 534 440 465 6,175 -6.9% 6,918 -10.7%
16

Full Year YTD Jan-14 Feb-14 Mar-14 Oct-14 Nov-14 Dec-14
Reported
Actual
YTD
% Var
YTD
Actual V
Tgt/EA
YTD
Activity
YTD
SPLY
% var YTD
2014 v YTD
2013
Day CasesOutturn
2013
Target/Expected
Activity 2014 Year To Date 2014
Same Period Last
Year 2013
St. John's Hospital6,203 5,741 5,741 555 477 447 531 557 405 5,810 1.2% 6,203 -6.3%
University Hospital, Limerick20,192 19,539 19,540 1,793 1,687 1,738 1,860 1,588 1,479 21,047 7.7% 20,192 4.2%
University Maternity Hospital, Limerick42 51 51 0 -100.0% 42 -100.0%
University of Limerick Hospital Group42,053 40,100 40,101 3,766 3,404 3,478 3,813 3,400 3,113 42,931 7.1% 42,053 2.1%
Galway University Hospitals71,385 67,999 67,999 6,292 6,117 6,031 6,580 6,335 6,324 75,785 11.5% 71,385 6.2%
Letterkenny General Hospital17,657 16,341 16,341 1,443 1,319 1,387 1,734 1,527 1,442 17,686 8.2% 17,657 0.2%
Mayo General Hospital13,618 13,230 13,230 1,230 1,129 1,123 1,278 1,291 1,065 14,033 6.1% 13,618 3.0%
Portiuncula Hospital General & Maternity8,293 7,943 7,943 690 676 702 688 712 582 8,424 6.1% 8,293 1.6%
Roscommon County Hospital5,337 5,244 5,244 499 573 360 518 521 516 6,129 16.9% 5,337 14.8%
Sligo General Hospital25,331 23,960 23,960 2,352 2,077 2,073 2,290 2,054 1,978 25,015 4.4% 25,331 -1.2%
West/ North West Hospital Group141,621 134,717 134,717 12,506 11,891 11,676 13,088 12,440 11,907 147,072 9.2% 141,621 3.8%
Children's University Hospital Temple
Street 6,613 6,377 6,377 547 576 581 576 566 400 6,597 3.4% 6,613 -0.2%
Our Lady's Hospital for Sick Children
Crumlin 17,595 16,988 16,988 1,507 1,354 1,407 1,573 1,478 1,449 17,650 3.9% 17,595 0.3%
Tallaght Hospital - Children2,793 2,656 2,656 212 248 241 280 257 201 2,914 9.7% 2,793 4.3%
Children's Hospital Group27,001 26,021 26,021 2,266 2,178 2,229 2,429 2,301 2,050 27,161 4.4% 27,001 0.6%
National Total838,922 797,329 797,329 69,951 65,778 66,954 71,351 67,045 60,884 808,365 1.4% 838,922 -3.6%
Notes:
1. All 50 Acute Hospitals who provide Day Case Services are included in thIs report.
2. Dialysis treatments are not included in this report.
3. Beaumont Hospial data is inclusive of activity carried out in St.Joseph's Hospital, Raheny.
4. St. James's Hospital has reclassified day cases in 2014 leading to a reduction in numbers reported
5. While nationally, day care attendances have decreased by 3.8% and remain 1.3% ahead of target, the coding reclassification in St. James’s Hospital has led to less day care activity being
reported in 2014 which skews the national data. Excluding St. James’s from the National profile day case attendances are up 2% on same period last year and down 4.9% ahead of expected levels.
17

Full Year YTD Oct-14 Nov-14 Dec-14Reported
Actual YTD
(3)
Inpatient
Same Day
Discharges
from
AMU's YTD
(3)
Reported
Actual YTD
excluding
Same Day
Discharges
AMU's
% Var YTD
Actual V
Tgt/EA
YTD
Activity
YTD SPLY
% var YTD
2014 v YTD
2013
Mater Misericordiae University Hospital 15,354 15,116 15,116 1,451 1,309 1,387 17,778 2,057 15,721 4.0% 15,354 2.4%
Midland Regional Hospital Mullingar 13,095 13,223 13,223 1,529 1,270 1,287 17,832 1,627 16,205 22.6% 13,095 23.7%
Our Lady's Hospital Navan 3,492 3,551 3,551 474 474 465 5,629 2,564 3,065 -13.7% 3,492 -12.2%
St. Colmcilles Hospital Loughlinstown 3,277 3,494 3,494 199 170 176 2,063 0 2,063 -41.0% 3,277 -37.0%
St Luke's Hospital Kilkenny 10,236 11,594 11,594 1,423 1,336 1,586 15,539 4,002 11,537 -0.5% 10,236 12.7%
St. Michael's Hospital Dun Laoghaire 1,537 1,538 1,538 144 123 138 1,689 0 1,689 9.8% 1,537 9.9%
St. Vincent's University Hospital Elm Park 12,572 12,089 12,089 1,263 1,194 1,329 14,904 204 14,700 21.6% 12,572 16.9%
Wexford General Hospital (6) 12,158 14,308 14,308 1,235 1,135 1,285 14,231 1,978 12,253 -14.4% 12,158 0.8%
Dublin East Hospital Group 71,721 74,913 74,913 7,718 7,011 7,653 89,665 12,432 77,233 3.1% 71,721 7.7%
Midland Regional Hospital Portlaoise 14,375 14,198 14,198 985 840 994 12,523 0 12,523 -11.8% 14,375 -12.9%
Midland Regional Hospital Tullamore 8,211 8,245 8,245 684 725 798 9,201 781 8,420 2.1% 8,211 2.5%
Naas General Hospital 8,102 8,498 8,498 783 780 808 9,103 246 8,857 4.2% 8,102 9.3%
St. James's Hospital 20,031 19,924 19,924 1,810 1,659 1,760 19,983 19,983 0.3% 20,031 -0.2%
Tallaght Hospital - Adults 15,432 15,561 15,561 1,367 1,286 1,326 16,462 1,467 14,995 -3.6% 15,432 -2.8%
Dublin Midlands Hospital Group 66,151 66,426 66,426 5,629 5,290 5,686 67,272 2,494 64,778 -2.5% 66,151 -2.1%
Beaumont Hospital (2) 18,154 18,012 18,012 1,463 1,408 1,413 18,733 680 18,053 0.2% 18,154 -0.6%
Cavan General Hospital 10,988 11,097 11,097 1,138 1,125 1,164 13,666 3,378 10,288 -7.3% 10,988 -6.4%
Connolly Hospital Blanchardstown 9,498 9,428 9,428 1,254 1,078 1,110 12,745 1,866 10,879 15.4% 9,498 14.5%
Our Lady of Lourdes Hospital Drogheda 21,613 21,371 21,371 2,068 2,070 2,084 25,345 4,738 20,607 -3.6% 21,613 -4.7%
Emergency AdmissionsOutturn
2013
Target/Expected
Activity 2014 Year To Date 2014
Same Period Last Year
2013
18

Full Year YTD Oct-14 Nov-14 Dec-14Reported
Actual YTD
(3)
Inpatient
Same Day
Discharges
from
AMU's YTD
(3)
Reported
Actual YTD
excluding
Same Day
Discharges
AMU's
% Var YTD
Actual V
Tgt/EA
YTD
Activity
YTD SPLY
% var YTD
2014 v YTD
2013
Emergency AdmissionsOutturn
2013
Target/Expected
Activity 2014 Year To Date 2014
Same Period Last Year
2013
Dublin North East Hospital Group 60,253 59,908 59,908 5,923 5,681 5,771 70,489 10,662 59,827 -0.1% 60,253 -0.7%
Bantry General Hospital 1,852 1,874 1,874 380 304 412 4,302 2,038 2,264 20.8% 1,852 22.2%
Cork University Hospital 25,163 25,292 25,292 2,338 2,236 2,341 27,482 2,536 24,946 -1.4% 25,163 -0.9%
Kerry General Hospital 10,150 10,364 10,364 921 990 1,046 11,718 1,565 10,153 -2.0% 10,150 0.0%
Mallow General Hospital 2,057 2,058 2,058 366 330 390 4,367 2,448 1,919 -6.8% 2,057 -6.7%
Mercy University Hospital Cork 8,018 8,137 8,137 771 700 730 8,856 830 8,026 -1.4% 8,018 0.1%
South Tipperary General Hospital 9,438 11,213 11,213 741 729 829 10,476 1,971 8,505 -24.2% 9,438 -9.9%
Waterford Regional Hospital 14,667 14,657 14,657 1,447 1,400 1,628 17,727 953 16,774 14.4% 14,667 14.4%
South/South West Hospital Group 71,345 73,595 73,595 6,964 6,689 7,376 84,928 12,341 72,587 -1.4% 71,345 1.7%
Ennis Hospital 2,202 2,697 2,697 318 282 277 3,729 1,944 1,785 -33.8% 2,202 -18.9%
Nenagh Hospital 1,202 1,846 1,846 135 131 101 1,291 279 1,012 -45.2% 1,202 -15.8%
St. John's Hospital 2,055 2,238 2,238 299 276 285 3,112 1,651 1,461 -34.7% 2,055 -28.9%
University Hospital, Limerick 19,807 22,725 22,725 1,795 1,769 1,892 21,027 2,000 19,027 -16.3% 19,807 -3.9%
University of Limerick Hospital Group 25,266 29,506 29,506 2,547 2,458 2,555 29,159 5,874 23,285 -21.1% 25,266 -7.8%
Galway University Hospitals 26,278 26,161 26,161 2,427 2,224 2,414 28,807 2,399 26,408 0.9% 26,278 0.5%
Letterkenny General Hospital 17,602 17,456 17,456 1,693 1,692 1,846 19,702 805 18,897 8.3% 17,602 7.4%
Mayo General Hospital 13,945 13,972 13,972 1,374 1,366 1,438 17,081 2,796 14,285 2.2% 13,945 2.4%
Portiuncula Hospital General & Maternity 7,705 7,757 7,757 796 773 779 9,356 1,166 8,190 5.6% 7,705 6.3%
Roscommon County Hospital 1,045 1,073 1,073 76 67 74 1,402 420 982 -8.5% 1,045 -6.0%
19

Full Year YTD Oct-14 Nov-14 Dec-14Reported
Actual YTD
(3)
Inpatient
Same Day
Discharges
from
AMU's YTD
(3)
Reported
Actual YTD
excluding
Same Day
Discharges
AMU's
% Var YTD
Actual V
Tgt/EA
YTD
Activity
YTD SPLY
% var YTD
2014 v YTD
2013
Emergency AdmissionsOutturn
2013
Target/Expected
Activity 2014 Year To Date 2014
Same Period Last Year
2013
Sligo General Hospital 12,972 15,731 15,731 1,194 1,135 1,234 13,978 1,048 12,930 -17.8% 12,972 -0.3%
West/ North West Hospital Group 79,547 82,150 82,150 7,560 7,257 7,785 90,326 8,634 81,692 -0.6% 79,547 2.7%
Children's University Hospital Temple Street 5,097 4,952 4,952 419 441 502 5,303 0 5,303 7.1% 5,097 4.0%
Our Lady's Hospital for Sick Children
Crumlin5,725 5,551 5,551 555 567 640 6,551 0 6,551 18.0% 5,725 14.4%
Tallaght Hospital - Children 5,217 5,201 5,201 527 581 591 5,680 0 5,680 9.2% 5,217 8.9%
Children's Hospital Group 16,039 15,704 15,704 1,501 1,589 1,733 17,534 0 17,534 11.7% 16,039 9.3%
National Total 390,322 402,202 402,202 37,842 35,975 38,559 449,373 52,437 396,936 -1.3% 390,322 1.7%
Notes:
1. 37 out of the 48 Acute Hospitals who provide data on Inpatient Emergency Admissions are included in main table
2. Beaumont Hospial data is inclusive of activity carried out in St.Joseph's Hospital, Raheny.
3. As per Acute Medicine Programme guidelines, all patients presenting to AMU/AMAU/MAU are to be registered as an Inpatient as opposed to an attendances at the hospital. This will lead to an
increase in Emergency Admissions being reported from 2013 compared to previous years. In order to keep continuity with comparisons to target (2014 targets based on pre AMP guidelines) and
previous years data the table above shows not only the total number of Emergency Admissions reported by hospitals each month and YTD inclusive 'Same Day Discharges' from AMU/AMAU/MAU
but also the YTD numbers excluding Same Day Discharges from AMU/AMAU/MAU's.
4. Maternity and Single Specialty Hospitals are excluded from this report
5. Percentage Variances are based on the variance excluding Same Day AMU/AMAU/MAU discharges.
20

Full Year YTD Oct-14 Nov-14 Dec-14Reported
Actual YTD
% Var YTD
Actual V
Tgt/EA
YTD
Activity
YTD SPLY
% var YTD
2014 v YTD
2013
Cappagh National Orthopaedic Hospital 2,679 2,647 2,647 125 205 127 1,915 -27.7% 2,679 -28.5%
Mater Misericordiae University Hospital 3,278 3,159 3,159 420 338 297 3,990 26.3% 3,278 21.7%
Midland Regional Hospital Mullingar 1,957 1,958 1,958 131 286 309 1,695 -13.4% 1,957 -13.4%
National Maternity Hospital Holles Street 796 763 763 62 59 64 789 3.4% 796 -0.9%
Our Lady's Hospital Navan 1,054 1,045 1,045 96 107 58 1,070 2.4% 1,054 1.5%
Royal Victoria Eye and Ear Hospital Dublin 1,608 1,587 1,587 143 122 100 1,594 0.4% 1,608 -0.9%
St. Colmcilles Hospital Loughlinstown 245 237 237 3 -98.7% 245 -98.8%
St Luke's Hospital Kilkenny 681 1,270 1,270 80 70 48 716 -43.6% 681 5.1%
St. Michael's Hospital Dun Laoghaire 1,582 1,508 1,508 121 121 83 1,318 -12.6% 1,582 -16.7%
St. Vincent's University Hospital Elm Park 3,905 3,748 3,748 325 370 263 4,007 6.9% 3,905 2.6%
Wexford General Hospital 1,081 291 291 61 45 29 672 130.9% 1,081 -37.8%
Dublin East Hospital group 18,866 18,213 18,213 1,564 1,723 1,378 17,769 -2.4% 18,866 -5.8%
Coombe Women's and Infants University Hospital 4,720 1,415 1,415 62 63 42 828 -41.5% 4,720 -82.5%
Midland Regional Hospital Portlaoise 571 560 560 51 55 31 670 19.6% 571 17.3%
Midland Regional Hospital Tullamore 2,404 2,335 2,335 252 227 153 2,417 3.5% 2,404 0.5%
Naas General Hospital 707 691 691 41 34 46 463 -33.0% 707 -34.5%
St. James's Hospital 5,334 5,029 5,029 481 488 383 5,649 12.3% 5,334 5.9%
St. Luke's Hospital Rathgar 1,384 1,399 1,399 116 90 96 1,251 -10.6% 1,384 -9.6%
Tallaght Hospital - Adults 2,788 2,681 2,681 259 249 217 2,755 2.8% 2,788 -1.2%
Dublin Midlands Hospital Group 17,908 14,110 14,110 1,262 1,206 968 14,033 -0.5% 17,908 -21.6%
Beaumont Hospital (3) 5,689 5,500 5,500 550 507 402 5,987 8.9% 5,689 5.2%
Elective Admissions (2)Outturn
2013
Target/Expected
Activity 2014 Year To Date 2014
Same Period Last Year
2013
21

Full Year YTD Oct-14 Nov-14 Dec-14Reported
Actual YTD
% Var YTD
Actual V
Tgt/EA
YTD
Activity
YTD SPLY
% var YTD
2014 v YTD
2013
Elective Admissions (2)Outturn
2013
Target/Expected
Activity 2014 Year To Date 2014
Same Period Last Year
2013
Cavan General Hospital 1,023 988 988 85 89 78 923 -6.6% 1,023 -9.8%
Connolly Hospital Blanchardstown 1,582 1,528 1,528 178 166 117 1,691 10.7% 1,582 6.9%
Louth County Hospital 215 236 236 11 10 7 148 -37.3% 215 -31.2%
Our Lady of Lourdes Hospital Drogheda 1,481 1,402 1,402 142 142 96 1,658 18.3% 1,481 12.0%
Rotunda Hospital 670 816 816 35 42 38 397 -51.3% 670 -40.7%
Dublin North East Hospital Group 10,660 10,470 10,470 1,001 956 738 10,804 3.2% 10,660 1.4%
Bantry General Hospital 144 172 172 6 2 2 47 -72.7% 144 -67.4%
Cork University Hospital 6,319 6,046 6,046 505 482 419 5,853 -3.2% 6,319 -7.4%
Cork University Maternity Hospital 1,256 1,337 1,337 119 61 45 1,330 -0.5% 1,256 5.9%
Kerry General Hospital 1,347 1,289 1,289 146 133 129 1,533 18.9% 1,347 13.8%
Lourdes Orthopaedic Hospital Kilcreene 966 956 956 81 78 45 844 -11.7% 966 -12.6%
Mallow General Hospital 379 479 479 24 34 21 285 -40.5% 379 -24.8%
Mercy University Hospital Cork 3,229 3,192 3,192 238 257 176 2,831 -11.3% 3,229 -12.3%
South Infirmary University Hospital Cork 7,369 7,152 7,152 922 947 737 9,701 35.6% 7,369 31.6%
South Tipperary General Hospital 1,022 1,066 1,066 111 116 73 1,329 24.7% 1,022 30.0%
Waterford Regional Hospital 2,706 2,543 2,543 258 246 152 2,941 15.7% 2,706 8.7%
South/South West Hospital Group 24,737 24,232 24,232 2,410 2,356 1,799 26,694 10.2% 24,737 7.9%
Croom Hospital 1,869 1,858 1,858 100 107 100 1,480 -20.3% 1,869 -20.8%
Ennis Hospital 646 624 624 29 32 30 373 -40.2% 646 -42.3%
Nenagh Hospital 448 380 380 39 34 42 477 25.5% 448 6.5%
St. John's Hospital 2,280 2,139 2,139 248 231 170 2,528 18.2% 2,280 10.9%
22

Full Year YTD Oct-14 Nov-14 Dec-14Reported
Actual YTD
% Var YTD
Actual V
Tgt/EA
YTD
Activity
YTD SPLY
% var YTD
2014 v YTD
2013
Elective Admissions (2)Outturn
2013
Target/Expected
Activity 2014 Year To Date 2014
Same Period Last Year
2013
University Hospital, Limerick 6,517 6,347 6,347 487 464 425 5,464 -13.9% 6,517 -16.2%
University Maternity Hospital, Limerick 11 57 57 7 6 3 44 -22.8% 11 300.0%
University of Limerick Hospital Group 11,771 11,405 11,405 910 874 770 10,366 -9.1% 11,771 -11.9%
Galway University Hospitals 7,957 7,701 7,701 776 652 598 7,959 3.4% 7,957 0.0%
Letterkenny General Hospital 1,261 1,202 1,202 103 94 70 1,241 3.2% 1,261 -1.6%
Mayo General Hospital 2,062 2,046 2,046 167 148 127 1,678 -18.0% 2,062 -18.6%
Portiuncula Hospital General & Maternity 807 774 774 97 74 46 786 1.6% 807 -2.6%
Roscommon County Hospital 593 578 578 56 94 58 579 0.2% 593 -2.4%
Sligo General Hospital 1,904 1,787 1,787 149 164 161 2,025 13.3% 1,904 6.4%
West/ North West Hospital Group 14,584 14,088 14,088 1,348 1,226 1,060 14,268 1.3% 14,584 -2.2%
Children's University Hospital Temple Street 2,357 2,224 2,224 209 181 114 2,508 12.8% 2,357 6.4%
Our Lady's Hospital for Sick Children Crumlin 4,043 4,114 4,114 337 298 294 3,986 -3.1% 4,043 -1.4%
Tallaght Hospital - Children 1,052 1,117 1,117 57 27 22 698 -37.5% 1,052 -33.7%
Children's Hospital Group 7,452 7,455 7,455 603 506 430 7,192 -3.5% 7,452 -3.5%
National Total 105,978 99,973 99,973 9,098 8,847 7,143 101,126 1.2% 105,978 -4.6%
Notes:
1. All Acute Hospitals who provide Inpatient Services are included in thIs report.
2. Elective Admissions in this report do not include Obstetric Elective Admissions
3. Beaumont Hospial data is inclusive of activity carried out in St.Joseph's Hospital, Raheny.
23
Full Year YTD Oct-14 Nov-14 Dec-14Reported
Actual YTD
% Var YTD
Actual V
Tgt/EA
YTD
Activity
YTD SPLY
% var YTD
2014 v YTD
2013
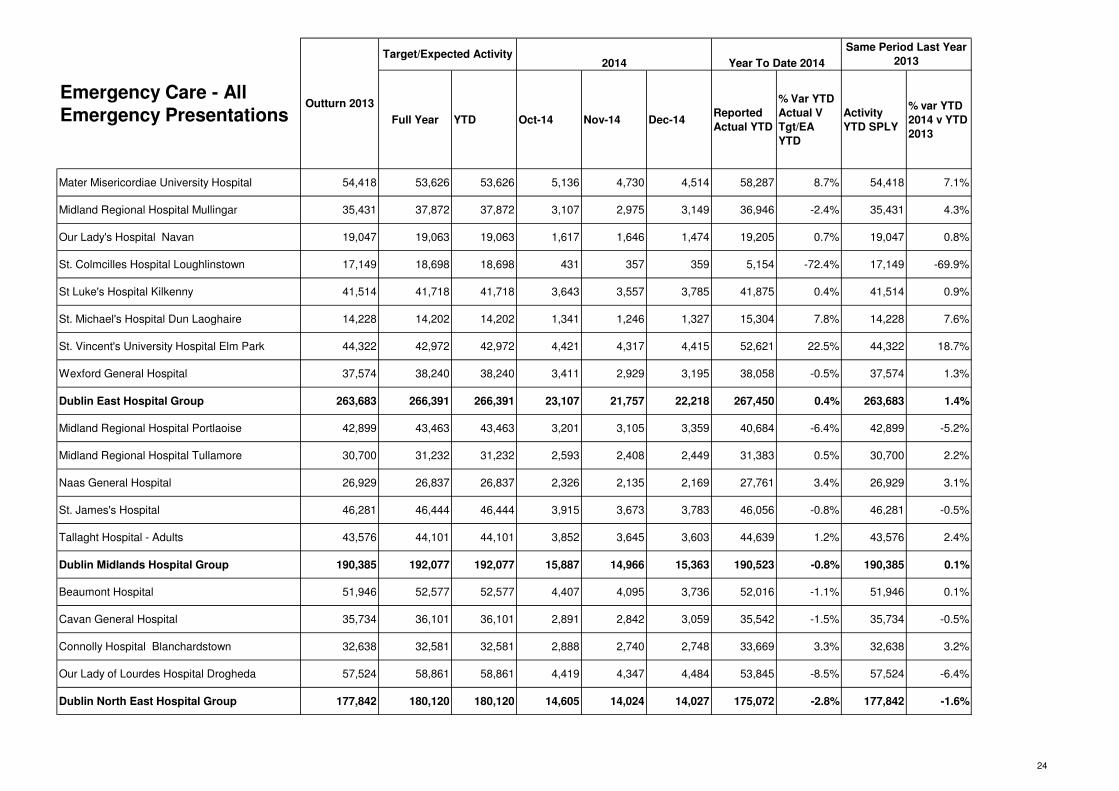
Mater Misericordiae University Hospital 54,418 53,626 53,626 5,136 4,730 4,514 58,287 8.7% 54,418 7.1%
Midland Regional Hospital Mullingar 35,431 37,872 37,872 3,107 2,975 3,149 36,946 -2.4% 35,431 4.3%
Our Lady's Hospital Navan 19,047 19,063 19,063 1,617 1,646 1,474 19,205 0.7% 19,047 0.8%
St. Colmcilles Hospital Loughlinstown 17,149 18,698 18,698 431 357 359 5,154 -72.4% 17,149 -69.9%
St Luke's Hospital Kilkenny 41,514 41,718 41,718 3,643 3,557 3,785 41,875 0.4% 41,514 0.9%
St. Michael's Hospital Dun Laoghaire 14,228 14,202 14,202 1,341 1,246 1,327 15,304 7.8% 14,228 7.6%
St. Vincent's University Hospital Elm Park 44,322 42,972 42,972 4,421 4,317 4,415 52,621 22.5% 44,322 18.7%
Wexford General Hospital 37,574 38,240 38,240 3,411 2,929 3,195 38,058 -0.5% 37,574 1.3%
Dublin East Hospital Group 263,683 266,391 266,391 23,107 21,757 22,218 267,450 0.4% 263,683 1.4%
Midland Regional Hospital Portlaoise 42,899 43,463 43,463 3,201 3,105 3,359 40,684 -6.4% 42,899 -5.2%
Midland Regional Hospital Tullamore 30,700 31,232 31,232 2,593 2,408 2,449 31,383 0.5% 30,700 2.2%
Naas General Hospital 26,929 26,837 26,837 2,326 2,135 2,169 27,761 3.4% 26,929 3.1%
St. James's Hospital 46,281 46,444 46,444 3,915 3,673 3,783 46,056 -0.8% 46,281 -0.5%
Tallaght Hospital - Adults 43,576 44,101 44,101 3,852 3,645 3,603 44,639 1.2% 43,576 2.4%
Dublin Midlands Hospital Group 190,385 192,077 192,077 15,887 14,966 15,363 190,523 -0.8% 190,385 0.1%
Beaumont Hospital 51,946 52,577 52,577 4,407 4,095 3,736 52,016 -1.1% 51,946 0.1%
Cavan General Hospital 35,734 36,101 36,101 2,891 2,842 3,059 35,542 -1.5% 35,734 -0.5%
Connolly Hospital Blanchardstown 32,638 32,581 32,581 2,888 2,740 2,748 33,669 3.3% 32,638 3.2%
Our Lady of Lourdes Hospital Drogheda 57,524 58,861 58,861 4,419 4,347 4,484 53,845 -8.5% 57,524 -6.4%
Dublin North East Hospital Group 177,842 180,120 180,120 14,605 14,024 14,027 175,072 -2.8% 177,842 -1.6%
Emergency Care - All
Emergency PresentationsOutturn 2013
Target/Expected Activity2014 Year To Date 2014
Same Period Last Year
2013
24

Full Year YTD Oct-14 Nov-14 Dec-14Reported
Actual YTD
% Var YTD
Actual V
Tgt/EA
YTD
Activity
YTD SPLY
% var YTD
2014 v YTD
2013
Emergency Care - All
Emergency PresentationsOutturn 2013
Target/Expected Activity2014 Year To Date 2014
Same Period Last Year
2013
Bantry General Hospital 4,091 4,675 4,675 375 314 293 4,170 -10.8% 4,366 -4.5%
Cork University Hospital 64,830 65,121 65,121 5,576 5,175 5,156 64,929 -0.3% 64,830 0.2%
Kerry General Hospital 36,517 37,199 37,199 2,775 2,811 2,791 36,541 -1.8% 36,517 0.1%
Mallow General Hospital 5,446 7,540 7,540 433 367 333 4,942 -34.5% 5,446 -9.3%
Mercy University Hospital Cork 30,950 31,011 31,011 2,712 2,532 2,557 32,189 3.8% 30,950 4.0%
South Tipperary General Hospital 36,654 36,916 36,916 3,069 2,949 3,340 37,887 2.6% 36,654 3.4%
Waterford Regional Hospital 53,453 55,081 55,081 4,220 4,044 4,003 50,584 -8.2% 53,453 -5.4%
South/South West Hospital Group 231,941 237,543 237,543 19,160 18,192 18,473 231,242 -2.7% 232,216 -0.4%
Ennis Hospital 11,614 12,976 12,976 755 687 569 8,638 -33.4% 11,614 -25.6%
Nenagh Hospital 7,319 7,586 7,586 760 631 603 7,729 1.9% 7,373 4.8%
St. John's Hospital 12,423 13,624 13,624 865 714 627 9,568 -29.8% 12,423 -23.0%
University Hospital, Limerick 61,153 61,619 61,619 5,028 4,844 5,000 59,979 -2.7% 61,153 -1.9%
University of Limerick Hospital Group 92,509 95,805 95,805 7,408 6,876 6,799 85,914 -10.3% 92,563 -7.2%
Galway University Hospitals 65,292 65,737 65,737 5,327 4,977 5,068 63,612 -3.2% 65,292 -2.6%
Letterkenny General Hospital 37,312 37,309 37,309 3,361 3,132 3,297 39,547 6.0% 37,312 6.0%
Mayo General Hospital 35,203 35,760 35,760 2,807 2,734 2,836 34,840 -2.6% 35,203 -1.0%
Portiuncula Hospital General & Maternity 23,833 24,228 24,228 1,947 1,830 1,973 23,795 -1.8% 23,833 -0.2%
Roscommon County Hospital 4,261 3,728 3,728 400 337 304 4,613 23.7% 4,261 8.3%
Sligo General Hospital 39,645 38,089 38,089 3,468 3,332 3,351 40,885 7.3% 39,645 3.1%
West/ North West Hospital Group 205,546 204,851 204,851 17,310 16,342 16,829 207,292 1.2% 205,546 0.8%
25
Full Year YTD Oct-14 Nov-14 Dec-14Reported
Actual YTD
% Var YTD
Actual V
Tgt/EA
YTD
Activity
YTD SPLY
% var YTD
2014 v YTD
2013
Emergency Care - All
Emergency PresentationsOutturn 2013
Target/Expected Activity2014 Year To Date 2014
Same Period Last Year
2013
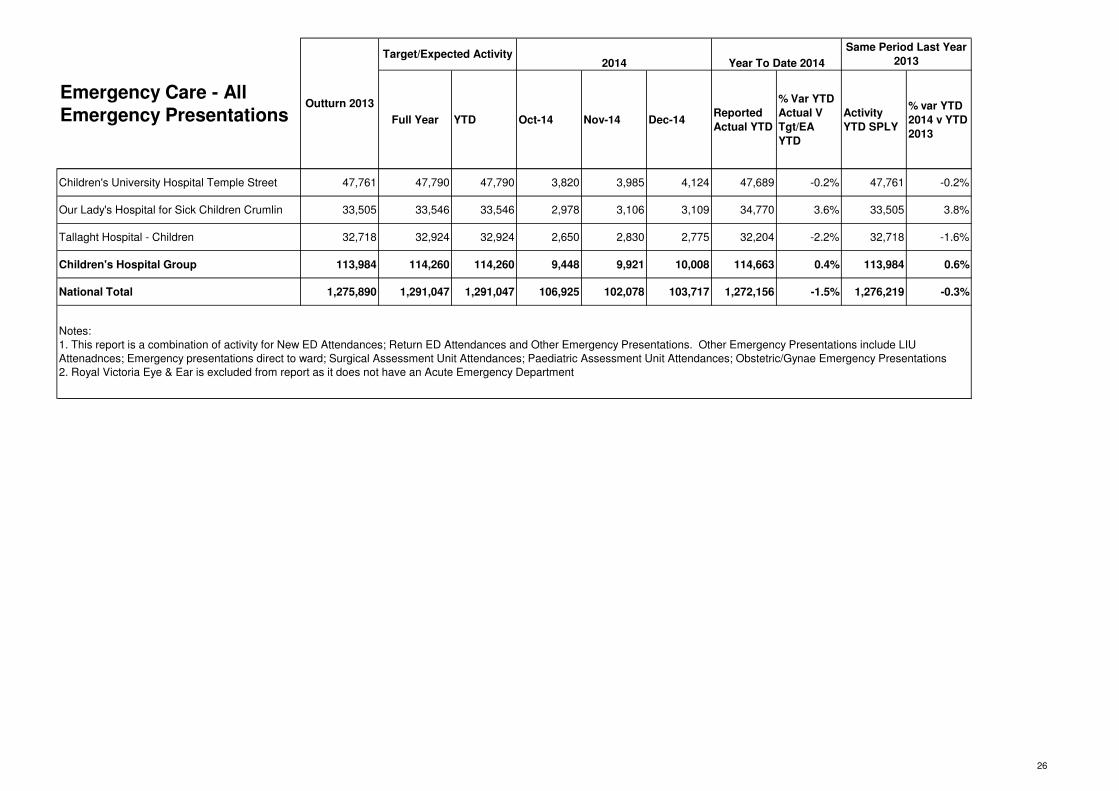
Children's University Hospital Temple Street 47,761 47,790 47,790 3,820 3,985 4,124 47,689 -0.2% 47,761 -0.2%
Our Lady's Hospital for Sick Children Crumlin 33,505 33,546 33,546 2,978 3,106 3,109 34,770 3.6% 33,505 3.8%
Tallaght Hospital - Children 32,718 32,924 32,924 2,650 2,830 2,775 32,204 -2.2% 32,718 -1.6%
Children's Hospital Group 113,984 114,260 114,260 9,448 9,921 10,008 114,663 0.4% 113,984 0.6%
National Total 1,275,890 1,291,047 1,291,047 106,925 102,078 103,717 1,272,156 -1.5% 1,276,219 -0.3%
Notes:
1. This report is a combination of activity for New ED Attendances; Return ED Attendances and Other Emergency Presentations. Other Emergency Presentations include LIU
Attenadnces; Emergency presentations direct to ward; Surgical Assessment Unit Attendances; Paediatric Assessment Unit Attendances; Obstetric/Gynae Emergency Presentations
2. Royal Victoria Eye & Ear is excluded from report as it does not have an Acute Emergency Department
26

Outpatient AttendancesNew
Attendances
Return
Attendances
New : Return
Ratio (2)New DNA Return DNA
New DNA
Rate
Return DNA
Rate
Cappagh National Orthopaedic Hospital135 362 2.7 9 27 6.3% 6.9%
Mater Misericordiae University Hospital5,760 10,667 1.9 784 1,587 12.0% 13.0%
Midland Regional Hospital Mullingar741 2,791 3.8 126 609 14.5% 17.9%
National Maternity Hospital Holles Street3,253 6,316 1.9 451 1,123 12.2% 15.1%
Our Lady's Hospital Navan610 1,982 3.2 83 249 12.0% 11.2%
Royal Victoria Eye and Ear Hospital Dublin513 2,382 4.6 65 240 11.2% 9.2%
St. Colmcilles Hospital Loughlinstown252 695 2.8 51 124 16.8% 15.1%
St Luke's Hospital Kilkenny565 1,596 2.8 113 322 16.7% 16.8%
St. Michael's Hospital Dun Laoghaire474 866 1.8 61 103 11.4% 10.6%
St. Vincent's University Hospital Elm Park2,345 7,487 3.2 224 840 8.7% 10.1%
Wexford General Hospital916 1,974 2.2 126 301 12.1% 13.2%
Dublin East Hospital Group15,564 37,118 2.4 2,093 5,525 11.9% 13.0%
Coombe Women's and Infants University Hospital2,665 6,093 2.3 343 715 11.4% 10.5%
Midland Regional Hospital Portlaoise418 2,343 5.6 70 288 14.3% 10.9%
Midland Regional Hospital Tullamore1,334 3,738 2.8 169 492 11.2% 11.6%
Naas General Hospital721 1,786 2.5 100 342 12.2% 16.1%
St. James's Hospital3,917 10,247 2.6 726 2,774 15.6% 21.3%
St. Luke's Hospital Rathgar250 1,067 4.3 16 170 6.0% 13.7%
Tallaght Hospital - Adults3,550 12,566 3.5 886 2,678 20.0% 17.6%
December 2014 Outpatient (OPD) Attendances
27

Outpatient AttendancesNew
Attendances
Return
Attendances
New : Return
Ratio (2)New DNA Return DNA
New DNA
Rate
Return DNA
Rate
December 2014 Outpatient (OPD) Attendances
Dublin Midlands Hospital Group12,855 37,840 2.9 2,310 7,459 15.2% 16.5%
Beaumont Hospital2,538 7,483 2.9 599 1,438 19.1% 16.1%
Cavan General Hospital617 1,942 3.1 41 247 6.2% 11.3%
Connolly Hospital Blanchardstown1,067 2,666 2.5 277 760 20.6% 22.2%
Louth County Hospital527 962 1.8 41 172 7.2% 15.2%
Monaghan Hospital279 562 2.0 34 75 10.9% 11.8%
Our Lady of Lourdes Hospital Drogheda1,676 4,538 2.7 222 672 11.7% 12.9%
Rotunda Hospital2,728 6,015 2.2 448 808 14.1% 11.8%
Dublin North East Hospital Group9,432 24,168 2.6 1,662 4,172 15.0% 14.7%
Bantry General Hospital136 499 3.7 24 55 15.0% 9.9%
Cork University Hospital3,295 8,925 2.7 420 1,127 11.3% 11.2%
Cork University Maternity Hospital835 2,464 3.0 85 102 9.2% 4.0%
Kerry General Hospital1,082 3,196 3.0 125 350 10.4% 9.9%
Lourdes Orthopaedic Hospital Kilcreene37 159 4.3 6 20 14.0% 11.2%
Mallow General Hospital253 553 2.2 52 110 17.0% 16.6%
28

Outpatient AttendancesNew
Attendances
Return
Attendances
New : Return
Ratio (2)New DNA Return DNA
New DNA
Rate
Return DNA
Rate
December 2014 Outpatient (OPD) Attendances
Mercy University Hospital Cork482 2,225 4.6 59 218 10.9% 8.9%
South Infirmary University Hospital Cork1,866 3,262 1.7 379 491 16.9% 13.1%
South Tipperary General Hospital642 1,459 2.3 92 254 12.5% 14.8%
Waterford Regional Hospital2,757 8,403 3.0 467 1,358 14.5% 13.9%
South/South West Hospital Group11,385 31,145 2.7 1,709 4,085 13.1% 11.6%
Croom Hospital215 588 2.7 24 43 10.0% 6.8%
Ennis Hospital209 671 3.2 49 157 19.0% 19.0%
Nenagh Hospital202
4912.4 24 59 10.6% 10.7%
St. John's Hospital224 373 1.7 56 85 20.0% 18.6%
University Hospital, Limerick2,929 8,893 3.0 409 1,360 12.3% 13.3%
University Maternity Hospital432 1,664 3.9 30 122 6.5% 6.8%
University of Limerick Hospital Group4,211 12,680 3.0 592 1,826 12.3% 12.6%
Galway University Hospitals4,674 11,697 2.5 557 1,902 10.6% 14.0%
Letterkenny General Hospital1,223 3,167 2.6 114 432 8.5% 12.0%
Mayo General Hospital1,402 3,121 2.2 271 676 16.2% 17.8%
Portiuncula Hospital General & Maternity1,183 2,321 2.0 44 285 3.6% 10.9%
Roscommon County Hospital272 855 3.1 38 152 12.3% 15.1%
Sligo General Hospital1,453 3,647 2.5 307 464 17.4% 11.3%
West/ North West Hospital Group10,207 24,808 2.4 1,331 3,911 11.5% 13.6%
29
Outpatient AttendancesNew
Attendances
Return
Attendances
New : Return
Ratio (2)New DNA Return DNA
New DNA
Rate
Return DNA
Rate
December 2014 Outpatient (OPD) Attendances
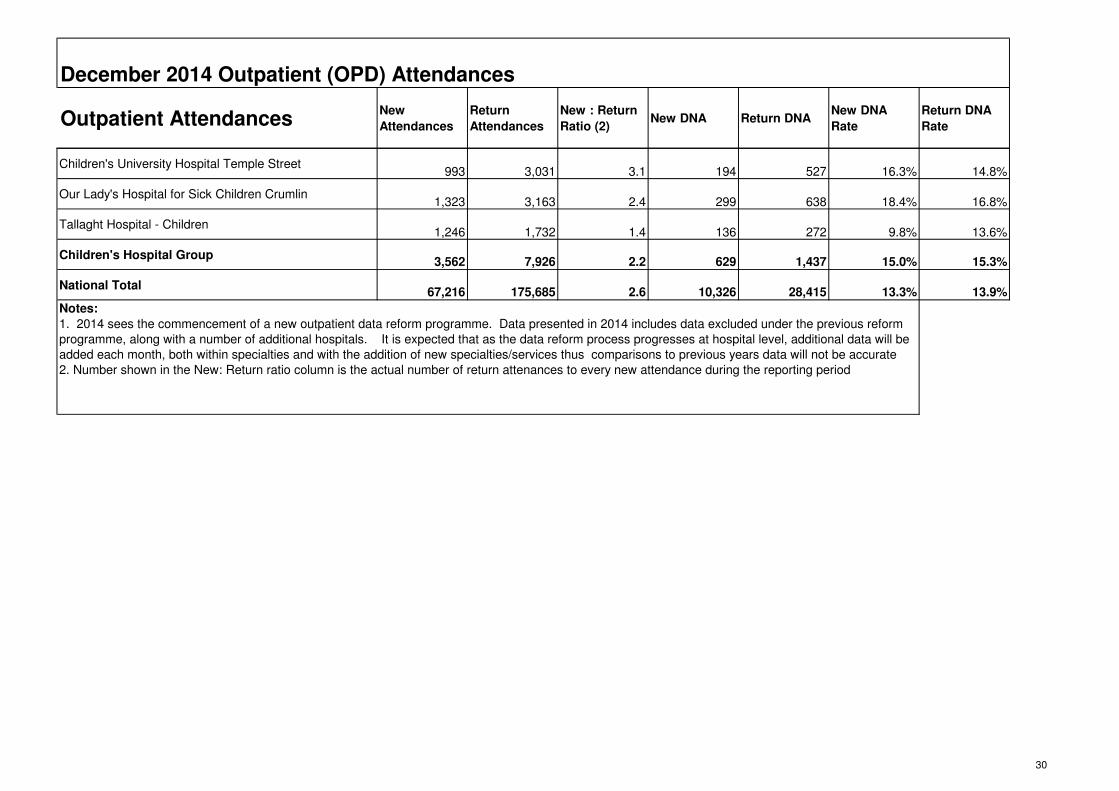
Children's University Hospital Temple Street993 3,031 3.1 194 527 16.3% 14.8%
Our Lady's Hospital for Sick Children Crumlin1,323 3,163 2.4 299 638 18.4% 16.8%
Tallaght Hospital - Children1,246 1,732 1.4 136 272 9.8% 13.6%
Children's Hospital Group3,562 7,926 2.2 629 1,437 15.0% 15.3%
National Total67,216 175,685 2.6 10,326 28,415 13.3% 13.9%
Notes:
1. 2014 sees the commencement of a new outpatient data reform programme. Data presented in 2014 includes data excluded under the previous reform
programme, along with a number of additional hospitals. It is expected that as the data reform process progresses at hospital level, additional data will be
added each month, both within specialties and with the addition of new specialties/services thus comparisons to previous years data will not be accurate
2. Number shown in the New: Return ratio column is the actual number of return attenances to every new attendance during the reporting period
30

Outpatient Waiting List
December 20140 -1 Month
1 - 2
Months
2 - 3
Months 3-6 Months
6-12
Months
12-24
Months
24-36
Months
36-48
Months
48+
Months Total
Cappagh National Orthopaedic Hospital 179 207 186 375 492 1,439
Mater Misericordiae University Hospital 3,643 3,352 2,970 5,262 4,588 1,675 1 21,491
Midland Regional Hospital Mullingar 1,197 976 814 1,580 1,176 516 9 6,268
Our Lady's Hospital Navan 758 621 499 1,143 849 32 3,902
Royal Victoria Eye and Ear Hospital Dublin 845 666 704 1,592 2,202 2,517 106 8,632
St. Colmcilles Hospital Loughlinstown 325 269 247 413 526 301 11 1 2,093
St Luke's Hospital Kilkenny 792 429 278 438 414 50 2,401
St. Michael's Hospital Dun Laoghaire 454 442 312 557 481 35 2,281
St. Vincent's University Hospital Elm Park 2,958 2,370 1,764 3,687 2,242 132 13,153
Wexford General Hospital 633 486 334 547 568 15 2,583
Dublin East Hospital Group 11,784 9,818 8,108 15,594 13,538 5,273 127 1 64,243
Midland Regional Hospital Portlaoise 14 445 405 928 1,174 431 1 3,398
Midland Regional Hospital Tullamore 1,078 1,122 953 2,388 4,018 2,440 33 2 12,034
Naas General Hospital 841 621 585 1,092 1,359 383 4,881
St. James's Hospital 3,103 2,332 1,441 2,479 1,779 203 11,337
Tallaght Hospital - Adults (2) 1,567 2,122 1,818 4,417 6,029 5,923 1,103 123 4 23,106
Dublin Midlands Hospital Group 6,603 6,642 5,202 11,304 14,359 9,380 1,137 125 4 54,756
Beaumont Hospital 2,920 3,075 2,629 5,193 6,620 2,156 22,593
Cavan General Hospital 806 838 820 1,792 2,218 885 7,359
Connolly Hospital Blanchardstown 1,545 1,285 1,194 1,880 2,573 655 9,132
Louth County Hospital 424 401 226 480 412 38 1,981
Our Lady of Lourdes Hospital Drogheda 1,431 1,299 1,212 2,733 3,484 439 10,598
31

Outpatient Waiting List
December 20140 -1 Month
1 - 2
Months
2 - 3
Months 3-6 Months
6-12
Months
12-24
Months
24-36
Months
36-48
Months
48+
Months Total
Dublin North East Hospital Group 7,126 6,898 6,081 12,078 15,307 4,173 51,663
Bantry General Hospital 326 343 273 535 153 1,630
Cork University Hospital 3,019 2,504 2,440 4,852 5,948 4,705 234 139 58 23,899
Kerry General Hospital 966 900 822 1,956 2,281 913 3 1 7,842
Mallow General Hospital 334 363 340 548 577 205 59 2,426
Mercy University Hospital Cork 887 780 641 1,216 1,435 464 2 5,425
South Infirmary University Hospital Cork 2,654 1,980 1,769 3,943 5,190 3,405 782 274 15 20,012
South Tipperary General Hospital 551 401 401 799 475 25 2,652
Waterford Regional Hospital 2,154 1,912 1,732 4,169 7,111 7,821 103 131 74 25,207
32

Outpatient Waiting List
December 20140 -1 Month
1 - 2
Months
2 - 3
Months 3-6 Months
6-12
Months
12-24
Months
24-36
Months
36-48
Months
48+
Months Total
South/South West Hospital Group 10,891 9,183 8,418 18,018 23,170 17,538 1,181 547 147 89,093
Croom Hospital 371 446 355 860 1,120 346 3,498
Ennis Hospital 321 262 292 586 979 133 2,573
Nenagh Hospital 382 310 213 308 364 171 1,748
St. John's Hospital 351 300 247 296 143 1,337
University Hospital, Limerick 2,677 1,846 1,683 3,284 4,163 1,418 1 15,072
University of Limerick Hospital Group 4,102 3,164 2,790 5,334 6,769 2,068 1 24,228
Galway University Hospitals 5,441 3,925 2,730 6,222 8,580 5,779 958 290 83 34,008
Letterkenny General Hospital 1,463 1,277 1,229 2,818 4,388 3,178 1,093 351 102 15,899
Mayo General Hospital 1,250 841 566 836 1,164 948 81 41 7 5,734
Portiuncula Hospital General & Maternity 489 414 333 766 844 366 13 3,225
Roscommon County Hospital 503 240 167 368 428 247 96 2,049
Sligo General Hospital 1,577 1,230 1,233 2,385 3,080 2,329 9 4 11,847
West/ North West 10,723 7,927 6,258 13,395 18,484 12,847 2,250 686 192 72,762
Children's University Hospital Temple Street 1,425 1,255 1,244 2,575 2,966 1,404 84 74 11 11,038
Our Lady's Hospital for Sick Children Crumlin 1,946 1,598 1,316 2,574 3,356 1,053 5 1 11,849
Tallaght Hospital - Children (2) 852 658 538 1,171 1,839 1,073 17 1 6,149
Children's Hospital Group 4,223 3,511 3,098 6,320 8,161 3,530 106 76 11 29,036
National Total 55,452 47,143 39,955 82,043 99,788 54,809 4,801 1,435 355 385,781
Notes:
1. Data Source is NTPF
2. All Tallaght data is reported under Tallaght - Adults
33

Outpatient Waiting List
by Specialty December
20140 -1 Month
1 - 2
Months
2 - 3
Months 3-6 Months
6-12
Months
12-24
Months
24-36
Months
36-48
Months 48+ Months Total
Anaesthetics 223 229 190 413 625 379 57 14 2,130
Breast Surgery 574 473 398 348 337 56 2,186
Cardiology 2,032 2,001 1,533 3,239 3,092 806 72 71 10 12,856
Cardio-Thoracic Surgery 87 13 7 5 5 7 124
Chemical Pathology 21 25 7 26 18 1 98
Child/Adolescent Psychiatry 11 17 14 24 29 95
Clinical Immunology 94 114 116 326 333 83 1,066
Clinical (Medical) Genetics 129 36 44 128 43 380
Clinical Neurophysiology 123 175 94 196 162 13 763
Clinical Pharmacology 12 3 4 10 7 36
Dental Surgery 71 48 35 44 2 200
Dermatology 4,137 3,633 3,364 7,609 8,319 4,422 109 129 73 31,795
Diabetes Mellitus 121 119 75 191 303 223 127 118 56 1,333
Endocrinology 826 865 714 1,611 1,785 629 116 19 1 6,566
Gastro-Enterology 1,618 1,373 1,011 1,634 1,721 307 1 1 7,666
Gastro-Intestinal Surgery 82 42 35 88 42 1 290
General Medicine 3,508 2,700 2,344 4,800 5,189 2,041 104 1 20,687
General Surgery 9,042 6,486 4,445 7,323 6,779 3,425 792 288 90 38,670
Geriatric Medicine 471 291 223 225 122 44 1,376
34

Outpatient Waiting List
by Specialty December
20140 -1 Month
1 - 2
Months
2 - 3
Months 3-6 Months
6-12
Months
12-24
Months
24-36
Months
36-48
Months 48+ Months Total
Gynaecology2,809 2,425 2,134 4,433 5,761 2,635 68 22 1 20,288
Haematology 671 584 447 810 749 42 1 3,304
Hepato-Biliary Surgery 5 5 12 8 5 35
Immunology 73 53 27 79 146 41 419
Infectious Diseases 89 36 27 28 17 6 203
Maxillofacial 461 319 281 635 817 303 15 2 2,833
Metabolic Medicine 39 23 14 51 21 148
Neonatology 12 8 3 9 1 33
Nephrology 441 343 221 322 358 222 31 15 4 1,957
Neurology 1,551 1,601 1,558 2,931 3,014 2,201 151 1 1 13,009
Neurosurgery 369 418 389 976 1,290 675 4,117
Obstetrics 100 16 2 118
Oncology 230 29 20 24 9 312
Ophthalmology 3,584 2,870 2,670 5,892 7,489 5,494 13 1 28,013
Oral Surgery 191 128 134 290 664 48 1,455
Orthopaedics 5,419 5,230 4,891 10,589 14,069 8,448 1,406 379 32 50,463
Other 189 99 48 87 118 5 546
Otolaryngology (ENT) 4,410 4,209 3,881 8,778 15,760 11,094 939 59 18 49,148
Paediatric Cardiology 303 257 240 517 919 420 1 2,657
35

Outpatient Waiting List
by Specialty December
20140 -1 Month
1 - 2
Months
2 - 3
Months 3-6 Months
6-12
Months
12-24
Months
24-36
Months
36-48
Months 48+ Months Total
Paediatric Dermatology 46 47 47 89 161 99 489
Paediatric Endocrinology58 79 64 58 29 2 290
Paediatric ENT 129 128 134 334 739 731 12 2,207
Paediatric Gastro-Enterology158 121 78 156 294 96 903
Paediatric- General Surgery 137 57 45 8 6 253
Paediatric Haematology59 20 12 22 5 118
Paediatric Nephrology 44 37 35 72 97 2 287
Paediatric Neurology 39 60 41 63 120 30 353
Paediatric Neurosurgery4 2 2 1 9
Paediatric- Orthopaedics62 5 4 4 3 1 79
Paediatric Respiratory Medicine 81 52 58 99 121 411
Paediatrics 2,165 1,758 1,393 2,689 2,188 242 10,435
Paediatrics Development 70 52 39 104 71 2 1 339
Paed Oncology 2 2
Pain Relief 564 570 513 1,141 1,258 923 85 20 5,074
Palliative Medicine 12 9 21
Pathology 1 1
Plastic Surgery 1,534 1,349 1,294 2,690 2,948 1,504 170 49 35 11,573
Psychiatry 118 42 35 47 3 245
36

Outpatient Waiting List
by Specialty December
20140 -1 Month
1 - 2
Months
2 - 3
Months 3-6 Months
6-12
Months
12-24
Months
24-36
Months
36-48
Months 48+ Months Total
Radiology 1 1 1 3
Radiotherapy 39 1 40
Rehabilitation Medicine 3 3 4 4 14
Respiratory Medicine 1,091 1,068 866 1,770 2,176 853 1 7,825
Rheumatology 1,499 1,345 1,177 2,483 2,987 1,696 121 49 2 11,359
Tropical 6 2 8
Urology 2,389 2,099 1,781 3,898 4,908 3,334 372 181 30 18,992
Vascular Surgery 1,013 941 684 1,608 1,553 1,223 38 15 1 7,076
37
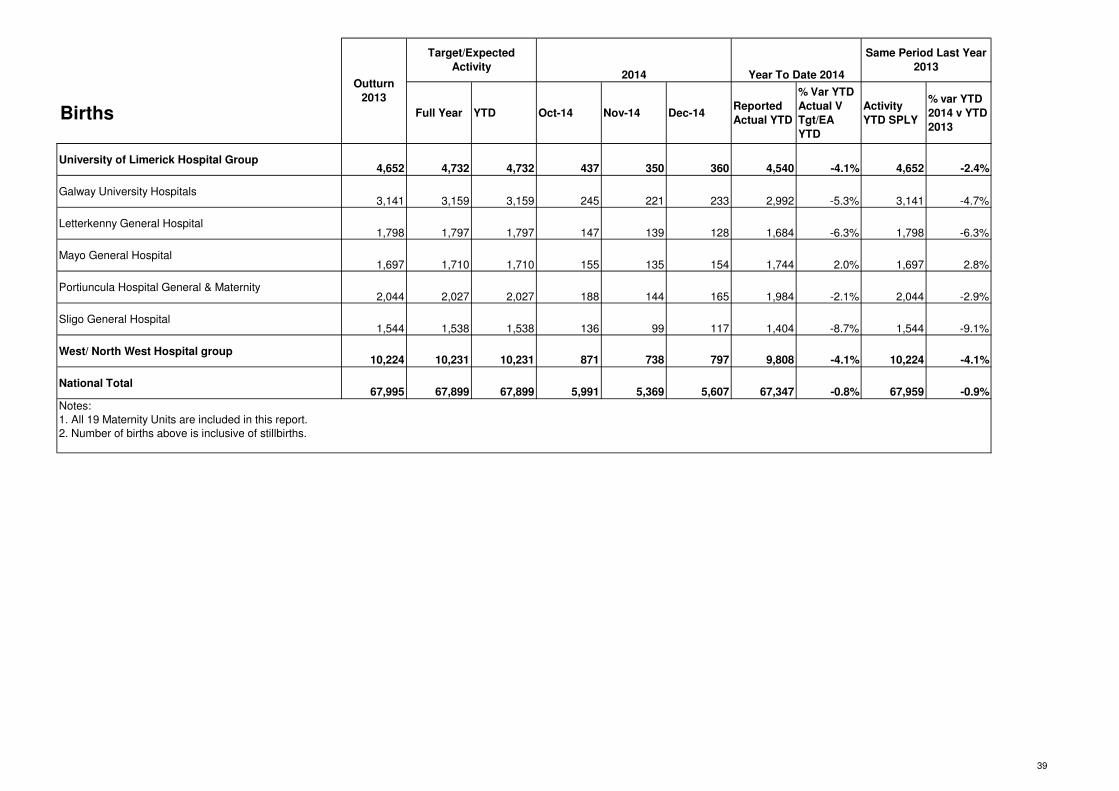
Births Full Year YTD Oct-14 Nov-14 Dec-14Reported
Actual YTD
% Var YTD
Actual V
Tgt/EA
YTD
Activity
YTD SPLY
% var YTD
2014 v YTD
2013
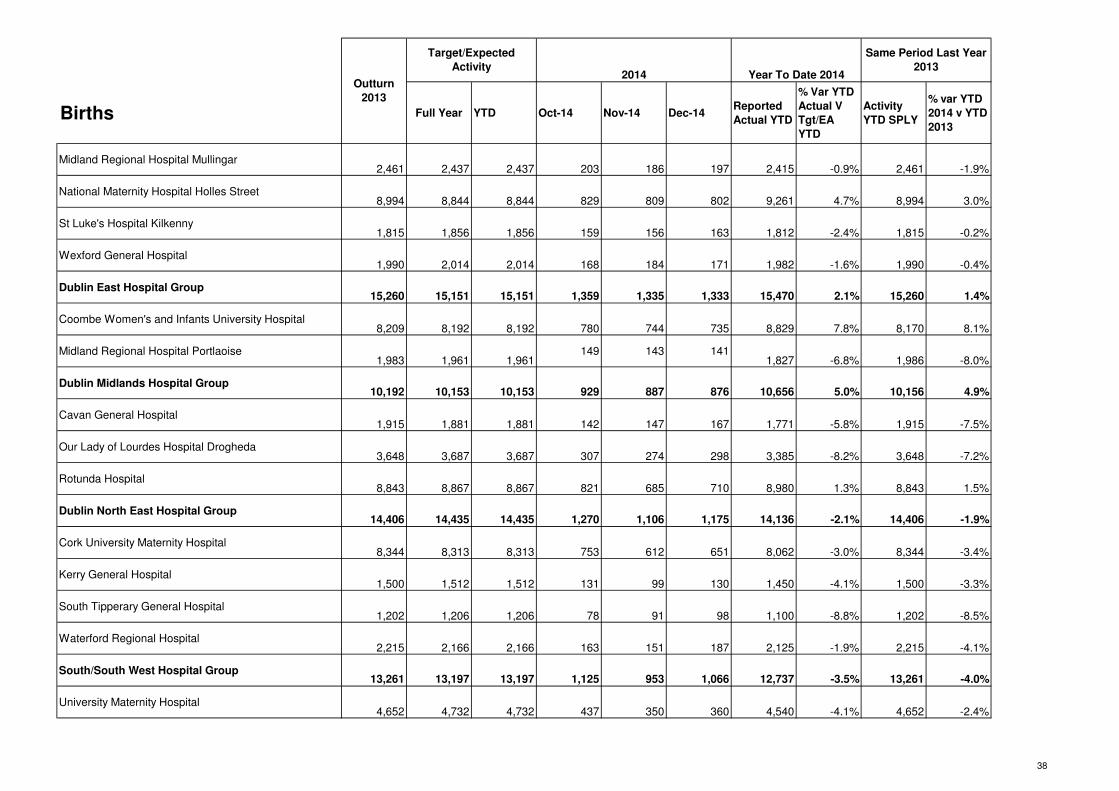
Midland Regional Hospital Mullingar2,461 2,437 2,437 203 186 197 2,415 -0.9% 2,461 -1.9%
National Maternity Hospital Holles Street8,994 8,844 8,844 829 809 802 9,261 4.7% 8,994 3.0%
St Luke's Hospital Kilkenny1,815 1,856 1,856 159 156 163 1,812 -2.4% 1,815 -0.2%
Wexford General Hospital1,990 2,014 2,014 168 184 171 1,982 -1.6% 1,990 -0.4%
Dublin East Hospital Group15,260 15,151 15,151 1,359 1,335 1,333 15,470 2.1% 15,260 1.4%
Coombe Women's and Infants University Hospital8,209 8,192 8,192 780 744 735 8,829 7.8% 8,170 8.1%
Midland Regional Hospital Portlaoise1,983 1,961 1,961
149 143 1411,827 -6.8% 1,986 -8.0%
Dublin Midlands Hospital Group10,192 10,153 10,153 929 887 876 10,656 5.0% 10,156 4.9%
Cavan General Hospital1,915 1,881 1,881 142 147 167 1,771 -5.8% 1,915 -7.5%
Our Lady of Lourdes Hospital Drogheda3,648 3,687 3,687 307 274 298 3,385 -8.2% 3,648 -7.2%
Rotunda Hospital8,843 8,867 8,867 821 685 710 8,980 1.3% 8,843 1.5%
Dublin North East Hospital Group14,406 14,435 14,435 1,270 1,106 1,175 14,136 -2.1% 14,406 -1.9%
Cork University Maternity Hospital8,344 8,313 8,313 753 612 651 8,062 -3.0% 8,344 -3.4%
Kerry General Hospital1,500 1,512 1,512 131 99 130 1,450 -4.1% 1,500 -3.3%
South Tipperary General Hospital1,202 1,206 1,206 78 91 98 1,100 -8.8% 1,202 -8.5%
Waterford Regional Hospital2,215 2,166 2,166 163 151 187 2,125 -1.9% 2,215 -4.1%
South/South West Hospital Group13,261 13,197 13,197 1,125 953 1,066 12,737 -3.5% 13,261 -4.0%
University Maternity Hospital4,652 4,732 4,732 437 350 360 4,540 -4.1% 4,652 -2.4%
Outturn
2013
Target/Expected
Activity2014 Year To Date 2014
Same Period Last Year
2013
38
Births Full Year YTD Oct-14 Nov-14 Dec-14Reported
Actual YTD
% Var YTD
Actual V
Tgt/EA
YTD
Activity
YTD SPLY
% var YTD
2014 v YTD
2013
Outturn
2013
Target/Expected
Activity2014 Year To Date 2014
Same Period Last Year
2013
University of Limerick Hospital Group4,652 4,732 4,732 437 350 360 4,540 -4.1% 4,652 -2.4%
Galway University Hospitals3,141 3,159 3,159 245 221 233 2,992 -5.3% 3,141 -4.7%
Letterkenny General Hospital1,798 1,797 1,797 147 139 128 1,684 -6.3% 1,798 -6.3%
Mayo General Hospital1,697 1,710 1,710 155 135 154 1,744 2.0% 1,697 2.8%
Portiuncula Hospital General & Maternity2,044 2,027 2,027 188 144 165 1,984 -2.1% 2,044 -2.9%
Sligo General Hospital1,544 1,538 1,538 136 99 117 1,404 -8.7% 1,544 -9.1%
West/ North West Hospital group10,224 10,231 10,231 871 738 797 9,808 -4.1% 10,224 -4.1%
National Total67,995 67,899 67,899 5,991 5,369 5,607 67,347 -0.8% 67,959 -0.9%
Notes:
1. All 19 Maternity Units are included in this report.
2. Number of births above is inclusive of stillbirths.
39

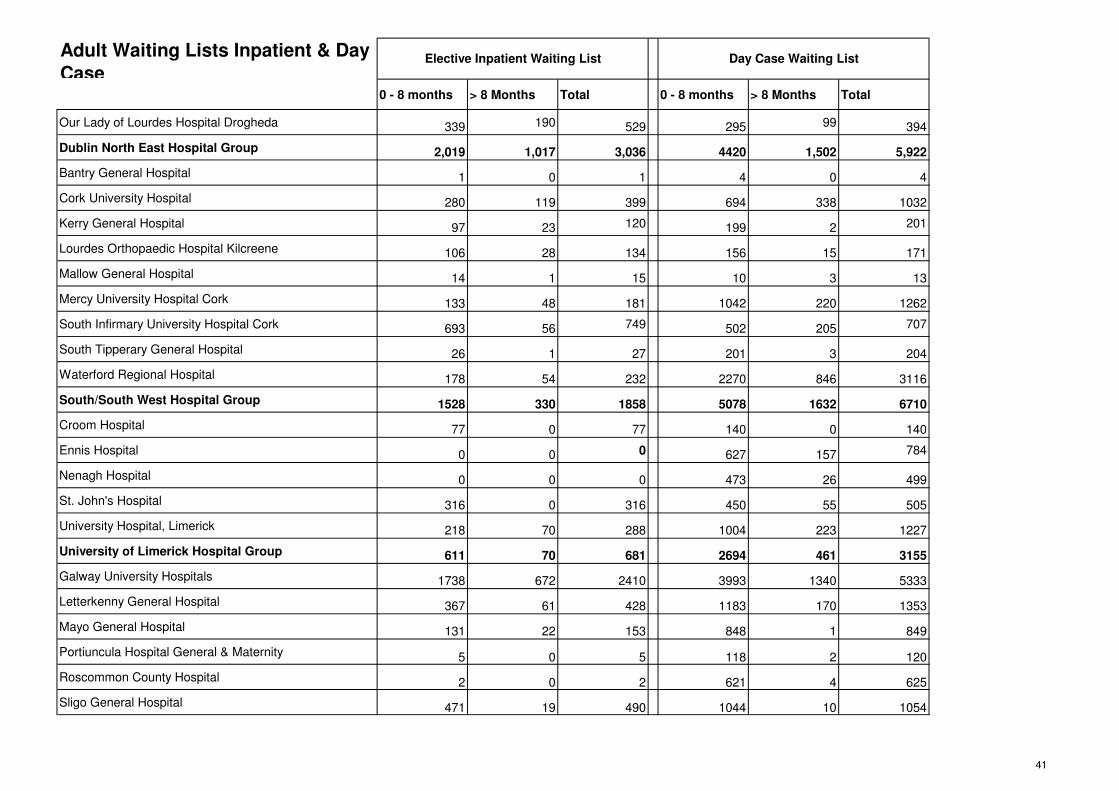
Adult Waiting Lists Inpatient & Day
Case0 - 8 months > 8 Months Total 0 - 8 months > 8 Months Total
Cappagh National Orthopaedic Hospital 1453 640 2093 653 10 663
Mater Misericordiae University Hospital 963 364 1327 2800 1364 4164
Midland Regional Hospital Mullingar 3 12 15 201 32 233
Our Lady's Hospital Navan 237 0 237 111 0 111
Royal Victoria Eye and Ear Hospital Dublin 218 61 279 1229 355 1584
St. Colmcilles Hospital Loughlinstown 1 0 1 69 0 69
St Luke's Hospital Kilkenny 31 24 55 492 81 573
St. Michael's Hospital Dun Laoghaire 0 0 0 0 0 0
St. Vincent's University Hospital Elm Park 581 113 694 848 184 1032
Wexford General Hospital 2 0 2 255 0 255
Dublin East Hospital Group 3,489 1,214 4,703 6658 2,026 8,684
Midland Regional Hospital Portlaoise 217 42 259 48 0 48
Midland Regional Hospital Tullamore 597 385 982 618 82 700
Naas General Hospital 0 0 0 121 9 130
St. James's Hospital 670 307 977 2437 1130 3567
Tallaght Hospital - Adults 502 315 817 1706 592 2298
Dublin Midlands Hospital Group 1,986 1,049 3,035 4930 1,813 6,743
Beaumont Hospital 1260 794 2,054 2789 1,099 3,888
Cavan General Hospital 3 0 3 553 235 788
Connolly Hospital Blanchardstown 417 33 450 366 69 435
Louth County Hospital 0 0 0 417 0 417
Elective Inpatient Waiting List Day Case Waiting List
40
Adult Waiting Lists Inpatient & Day
Case0 - 8 months > 8 Months Total 0 - 8 months > 8 Months Total
Elective Inpatient Waiting List Day Case Waiting List
Our Lady of Lourdes Hospital Drogheda 339 190 529 295 99 394
Dublin North East Hospital Group 2,019 1,017 3,036 4420 1,502 5,922
Bantry General Hospital 1 0 1 4 0 4
Cork University Hospital 280 119 399 694 338 1032
Kerry General Hospital 97 23 120 199 2 201
Lourdes Orthopaedic Hospital Kilcreene 106 28 134 156 15 171
Mallow General Hospital 14 1 15 10 3 13
Mercy University Hospital Cork 133 48 181 1042 220 1262
South Infirmary University Hospital Cork 693 56 749 502 205 707
South Tipperary General Hospital 26 1 27 201 3 204
Waterford Regional Hospital 178 54 232 2270 846 3116
South/South West Hospital Group 1528 330 1858 5078 1632 6710
Croom Hospital 77 0 77 140 0 140
Ennis Hospital 0 0 0 627 157 784
Nenagh Hospital 0 0 0 473 26 499
St. John's Hospital 316 0 316 450 55 505
University Hospital, Limerick 218 70 288 1004 223 1227
University of Limerick Hospital Group 611 70 681 2694 461 3155
Galway University Hospitals 1738 672 2410 3993 1340 5333
Letterkenny General Hospital 367 61 428 1183 170 1353
Mayo General Hospital 131 22 153 848 1 849
Portiuncula Hospital General & Maternity 5 0 5 118 2 120
Roscommon County Hospital 2 0 2 621 4 625
Sligo General Hospital 471 19 490 1044 10 1054
41

Adult Waiting Lists Inpatient & Day
Case0 - 8 months > 8 Months Total 0 - 8 months > 8 Months Total
Elective Inpatient Waiting List Day Case Waiting List
West/ North West Hospital Group 2714 774 3488 7807 1527 9334
Children's University Hospital Temple Street 0 0 0 0 0 0
Our Lady's Hospital for Sick Children Crumlin 0 0 0 0 0 0
Tallaght Hospital - Children 0 0 0 0 0 0
Children's Hospital Group 0 0 0 0 0 0
National Total 12,347 4,454 16,801 31,587 8,961 40,548
Notes:
1. Adult Waiting List data sourced from NTPF.
42

Child Waiting Lists Inpatient & Day
Case0 - 20 Weeks > 20 Weeks Total 0 - 20 Weeks > 20 Weeks Total
Cappagh National Orthopaedic Hospital 5 0 5 2 0 2
Mater Misericordiae University Hospital 0 0 0 0 0 0
Midland Regional Hospital Mullingar 2 0 2 1 0 1
Our Lady's Hospital Navan 0 0 0 4 0 4
Royal Victoria Eye and Ear Hospital Dublin 50 50 100 73 26 99
St. Colmcilles Hospital Loughlinstown 0 0 0 0 0 0
St Luke's Hospital Kilkenny 1 0 1 9 0 9
St. Michael's Hospital Dun Laoghaire 0 0 0 0 0 0
St. Vincent's University Hospital Elm Park 0 0 0 0 0 0
Wexford General Hospital 0 0 0 11 0 11
Dublin East Hospital Group 58 50 108 100 26 126
Midland Regional Hospital Portlaoise 5 0 5 3 0 3
Midland Regional Hospital Tullamore 113 163 276 93 109 202
Naas General Hospital 0 0 0 1 0 1
St. James's Hospital 0 0 0 0 0 0
Tallaght Hospital - Adults 0 0 0 0 0 0
Dublin Midlands Hospital Group 118 163 281 97 109 206
Beaumont Hospital 88 59 147 11 9 20
Cavan General Hospital 0 0 0 51 97 148
Connolly Hospital Blanchardstown 0 0 0 0 0 0
Louth County Hospital 0 0 0 0 0 0
Elective Inpatient Waiting List Day Case Waiting List
43

Child Waiting Lists Inpatient & Day
Case0 - 20 Weeks > 20 Weeks Total 0 - 20 Weeks > 20 Weeks Total
Elective Inpatient Waiting List Day Case Waiting List
Our Lady of Lourdes Hospital Drogheda 26 49 75 119 45 164
Dublin North East Hospital Group 114 108 222 181 151 332
Bantry General Hospital 0 0 0 0 0 0
Cork University Hospital 7 3 10 34 14 48
Kerry General Hospital 21 10 31 1 0 1
Lourdes Orthopaedic Hospital Kilcreene 0 0 0 0 0 0
Mallow General Hospital 0 0 0 0 0 0
Mercy University Hospital Cork 5 6 11 38 8 46
South Infirmary University Hospital Cork 66 6 72 20 23 43
South Tipperary General Hospital 1 0 1 12 0 12
Waterford Regional Hospital 73 100 173 96 75 171
South/South West Hospital Group 173 125 298 201 120 321
Croom Hospital 0 0 0 7 0 7
Ennis Hospital 0 0 0 0 0 0
Nenagh Hospital 0 0 0 17 0 17
St. John's Hospital 0 0 0 1 0 1
University Hospital, Limerick 66 52 118 141 52 193
University of Limerick Hospital Group 66 52 118 166 52 218
Galway University Hospitals 95 104 199 131 93 224
Letterkenny General Hospital 12 0 12 26 3 29
Mayo General Hospital 0 0 0 5 0 5
Portiuncula Hospital General & Maternity 0 0 0 3 0 3
Roscommon County Hospital 0 0 0 0 0 0
Sligo General Hospital 68 15 83 45 2 47
44

Child Waiting Lists Inpatient & Day
Case0 - 20 Weeks > 20 Weeks Total 0 - 20 Weeks > 20 Weeks Total
Elective Inpatient Waiting List Day Case Waiting List
West/ North West Hospital Group 175 119 294 210 98 308
Children's University Hospital Temple Street 239 59 298 167 10 177
Our Lady's Hospital for Sick Children Crumlin 488 699 1,187 748 329 1,077
Tallaght Hospital - Children 107 3 110 66 9 75
Children's Hospital Group 834 761 1595 981 348 1329
National Total 1,538 1,378 2,916 1,936 904 2,840
Notes:
1. Child Waiting List data sourced from NTPF.
45

Inpatient Profiles (Public / Private and Elective / Emergency Mix)
% Public
2013
% Public
2014 % Var
% Private
2013
% Private
2014 % Var
%
Emergen
cy 2013
%
Emergen
cy 2014 % Var
%
Elective
2013
%
Elective
2014 % Var
Cappagh National Orthopaedic Hospital 78.1% 80.4% 2.9% 21.9% 19.6% -10.5% 1.0% 0.9% -10.0% 99.0% 99.1% 0.1%
Mater Misericordiae University Hospital 83.5% 84.1% 0.7% 16.5% 15.9% -3.6% 84.2% 81.7% -3.0% 15.8% 18.3% 15.8%
Midland Regional Hospital Mullingar 89.4% 88.2% -1.3% 10.6% 11.8% 11.3% 69.7% 82.8% 18.8% 30.3% 17.2% -43.2%
National Maternity Hospital Holles Street 65.1% 64.7% -0.6% 34.9% 35.3% 1.1% 22.4% 20.5% -8.5% 77.6% 79.5% 2.4%
Our Lady's Hospital Navan 88.7% 90.1% 1.6% 11.3% 9.9% -12.4% 85.2% 84.0% -1.4% 14.8% 16.0% 8.1%
Royal Victoria Eye and Ear Hospital Dublin 63.6% 61.8% -2.8% 36.4% 38.2% 4.9% 30.9% 27.5% -11.0% 69.1% 72.5% 4.9%
St. Colmcilles Hospital Loughlinstown 99.1% 99.6% 0.5% 0.9% 0.4% -55.6% 93.0% 99.9% 7.4% 7.0% 0.1% -98.6%
St Luke's Hospital Kilkenny 84.0% 81.7% -2.7% 16.0% 18.3% 14.4% 81.2% 86.9% 7.0% 18.8% 13.1% -30.3%
St. Michael's Hospital Dun Laoghaire 100.0% 81.7% -18.3% 0.0% 18.3% 0.0% 49.3% 56.2% 14.0% 50.7% 43.8% -13.6%
St. Vincent's University Hospital Elm Park 79.1% 76.6% -3.2% 20.9% 23.4% 12.0% 76.6% 78.8% 2.9% 23.4% 21.2% -9.4%
Wexford General Hospital 84.0% 84.3% 0.4% 16.0% 15.7% -1.9% 79.3% 84.7% 6.8% 20.7% 15.3% -26.1%
Dublin East Hospital Group 82.0% 80.7% -1.6% 18.0% 19.3% 7.2% 67.9% 71.6% 5.4% 32.1% 28.4% -11.5%
Coombe Women's and Infants University
Hospital 82.7% 77.6% -6.2% 17.3% 22.4% 29.5% 10.7% 95.8% 795.3% 89.3% 4.2% -95.3%
Midland Regional Hospital Portlaoise 87.9% 86.5% -1.6% 12.1% 13.5% 11.6% 96.1% 86.7% -9.8% 3.9% 13.3% 241.0%
Midland Regional Hospital Tullamore 79.6% 78.3% -1.6% 20.4% 21.7% 6.4% 79.7% 79.2% -0.6% 20.3% 20.8% 2.5%
Naas General Hospital 95.4% 78.8% -17.4% 4.6% 21.2% 360.9% 92.6% 95.2% 2.8% 7.4% 4.8% -35.1%
St. James's Hospital 81.9% 80.6% -1.6% 18.1% 19.4% 7.2% 79.0% 78.0% -1.3% 21.0% 22.0% 4.8%
St. Luke's Hospital Rathgar 71.3% 67.8% -4.9% 28.7% 32.2% 12.2% 4.9% 3.8% -22.4% 95.1% 96.2% 1.2%
Tallaght Hospital - Adults 77.4% 78.5% 1.4% 22.6% 21.5% -4.9% 86.1% 85.7% -0.5% 13.9% 14.3% 3.1%
Dublin Midlands Hospital Group 82.8% 79.9% -3.5% 17.2% 20.1% 17.1% 70.6% 84.9% 20.2% 29.4% 15.1% -48.6%
Beaumont Hospital (2) 79.6% 80.6% 1.3% 20.4% 19.4% -4.9% 76.8% 75.8% -1.3% 23.2% 24.2% 4.3%
Cavan General Hospital 84.0% 83.8% -0.2% 16.0% 16.2% 1.3% 77.2% 79.0% 2.3% 22.8% 21.0% -7.9%
Connolly Hospital Blanchardstown 96.5% 92.4% -4.2% 3.5% 7.6% 117.1% 86.9% 88.3% 1.6% 13.1% 11.7% -10.7%
Louth County Hospital 65.0% 73.8% 13.5% 35.0% 26.2% -25.1% 0.0% 0.0% 0.0% 100.0% 100.0% 0.0%
Our Lady of Lourdes Hospital Drogheda 85.5% 86.5% 1.2% 14.5% 13.5% -6.9% 89.8% 88.5% -1.4% 10.2% 11.5% 12.7%
Inpatient Discharges Cumulative Inpatient Admissions Cumulative
46

Inpatient Profiles (Public / Private and Elective / Emergency Mix)
% Public
2013
% Public
2014 % Var
% Private
2013
% Private
2014 % Var
%
Emergen
cy 2013
%
Emergen
cy 2014 % Var
%
Elective
2013
%
Elective
2014 % Var
Inpatient Discharges Cumulative Inpatient Admissions Cumulative
Rotunda Hospital 76.2% 75.9% -0.4% 23.8% 24.1% 1.3% 41.2% 85.2% 106.8% 58.8% 14.8% -74.8%
Dublin North East Hospital Group 83.5% 83.7% 0.2% 16.5% 16.3% -1.2% 76.2% 83.1% 9.1% 23.8% 16.9% -29.0%
Bantry General Hospital 99.8% 100.0% 0.2% 0.2% 0.0% -100.0% 96.0% 98.9% 3.0% 4.0% 1.1% -72.5%
Cork University Hospital 75.7% 73.6% -2.8% 24.3% 26.4% 8.6% 81.5% 82.4% 1.1% 18.5% 17.6% -4.9%
Cork University Maternity Hospital 80.4% 80.4% 0.0% 19.6% 19.6% 0.0% 10.7% 22.7% 112.1% 89.3% 77.3% -13.4%
Kerry General Hospital 74.6% 80.4% 7.8% 25.4% 19.6% -22.8% 76.8% 77.2% 0.5% 23.2% 22.8% -1.7%
Lourdes Orthopaedic Hospital Kilcreene 76.0% 74.4% -2.1% 24.0% 25.6% 6.7% 1.6% 0.9% -43.8% 98.4% 99.1% 0.7%
Mallow General Hospital 70.1% 70.0% -0.1% 29.9% 30.0% 0.3% 90.6% 93.9% 3.6% 9.4% 6.1% -35.1%
Mercy University Hospital Cork 68.3% 67.9% -0.6% 31.7% 32.1% 1.3% 72.3% 75.8% 4.8% 27.7% 24.2% -12.6%
South Infirmary University Hospital Cork 62.5% 64.5% 3.2% 37.5% 35.5% -5.3% 10.0% 7.7% -23.0% 90.0% 92.3% 2.6%
South Tipperary General Hospital 82.4% 83.9% 1.8% 17.6% 16.1% -8.5% 79.1% 80.3% 1.5% 20.9% 19.7% -5.7%
Waterford Regional Hospital 79.2% 81.8% 3.3% 20.8% 18.2% -12.5% 74.7% 78.8% 5.5% 25.3% 21.2% -16.2%
South/South West Hospital Group 76.4% 77.1% 0.9% 23.6% 22.9% -3.0% 65.8% 68.2% 3.6% 34.2% 31.8% -7.0%
Croom Hospital 50.6% 49.1% -3.0% 49.4% 50.9% 3.0% 0.1% 19.2% 0.0% 99.9% 80.8% -19.1%
Ennis Hospital 86.5% 93.9% 8.6% 13.5% 6.1% -54.8% 79.9% 90.9% 13.8% 20.1% 9.1% -54.7%
Nenagh Hospital 78.9% 72.6% -8.0% 21.1% 27.4% 29.9% 76.5% 73.0% -4.6% 23.5% 27.0% 14.9%
St. John's Hospital 66.8% 70.6% 5.7% 33.2% 29.4% -11.4% 53.0% 55.2% 4.2% 47.0% 44.8% -4.7%
University Hospital, Limerick 67.4% 66.9% -0.7% 32.6% 33.1% 1.5% 77.7% 79.4% 2.2% 22.3% 20.6% -7.6%
University Maternity Hospital, Limerick 80.1% 81.5% 1.7% 19.9% 18.5% -7.0% 9.6% 8.2% -14.6% 90.4% 91.8% 1.5%
University of Limerick Hospital Group 70.5% 71.7% 1.7% 29.5% 28.3% -4.1% 61.5% 63.2% 2.8% 38.5% 36.8% -4.4%
Galway University Hospitals 81.7% 80.7% -1.2% 18.3% 19.3% 5.5% 74.1% 75.1% 1.3% 25.9% 24.9% -3.9%
Letterkenny General Hospital 89.2% 88.8% -0.4% 10.8% 11.2% 3.7% 92.4% 93.0% 0.6% 7.6% 7.0% -7.9%
Mayo General Hospital 84.5% 86.0% 1.8% 15.5% 14.0% -9.7% 87.4% 89.6% 2.5% 12.6% 10.4% -17.5%
Portiuncula Hospital General & Maternity 79.7% 81.8% 2.6% 20.3% 18.2% -10.3% 68.3% 71.5% 4.7% 31.7% 28.5% -10.1%
Roscommon County Hospital 82.9% 76.0% -8.3% 17.1% 24.0% 40.4% 70.5% 70.8% 0.4% 29.5% 29.2% -1.0%
47

Inpatient Profiles (Public / Private and Elective / Emergency Mix)
% Public
2013
% Public
2014 % Var
% Private
2013
% Private
2014 % Var
%
Emergen
cy 2013
%
Emergen
cy 2014 % Var
%
Elective
2013
%
Elective
2014 % Var
Inpatient Discharges Cumulative Inpatient Admissions Cumulative
Sligo General Hospital 83.2% 82.1% -1.3% 16.8% 17.9% 6.5% 80.6% 79.2% -1.7% 19.4% 20.8% 7.2%
West/ North West 83.6% 83.4% -0.2% 16.4% 16.6% 1.2% 80.0% 81.1% 1.4% 20.0% 18.9% -5.5%
Children's University Hospital Temple Street 75.6% 86.5% 14.4% 24.4% 13.5% -44.7% 68.4% 67.9% -0.7% 31.6% 32.1% 1.6%
Our Lady's Hospital for Sick Children Crumlin 66.8% 71.6% 7.2% 33.2% 28.4% -14.5% 58.6% 62.2% 6.1% 41.4% 37.8% -8.7%
Tallaght Hospital - Children 68.3% 67.9% -0.6% 31.7% 32.1% 1.4% 83.2% 89.1% 7.1% 16.8% 10.9% -35.0%
Children's Hospital Group 70.1% 75.5% 7.8% 29.9% 24.5% -18.2% 68.3% 70.9% 3.8% 31.7% 29.1% -8.3%
National Total 80.2% 79.9% -0.4% 19.8% 20.1% 1.5% 70.8% 75.8% 7.1% 29.2% 24.2% -17.1%
48

% var
YTD v
YTD
last
year
No. % No. % No. % No. % No. % No. % No. % No. %
No. of patients in receipt of
specialist palliative care in the
community National M 3150 3050 3050 3149 3122 3022 3,022 -1% 3,150 -4%
HSE DML 680 22% 665 22% 665 22% 629 20% 680 22% 682 23% 682 23% 3% 680 22% 0%
HSE DNE 592 19% 587 19% 587 19% 601 19% 604 19% 581 19% 581 19% -1% 592 19% -2%
HSE South 855 27% 848 28% 848 28% 899 29% 866 28% 880 29% 880 29% 4% 855 27% 3%
HSE West 1023 32% 950 31% 950 31% 1020 32% 972 31% 879 29% 879 29% -7% 1,023 32% -14%
Day Care: Number of patients in
receipt of specialist palliative care
services
National M 355 331 331 357 347 309 309 -7% 355 -13%
Paediatric services: Total number
of children in the care of the
childrens outreach service
National M new 2014new 2014new 2014new 2014new 2014new 2014 266 271 281 281 new 2014new 2014
Inpatient Units: Waiting Times. i)
Specialist palliative care inpatient
bed provided within 7 days
National M 2746 95% 94% 2907 94% 272 99% 252 98% 272 97% 2,942 96% 1% 2,746 95% 7%
HSE DML 749 89% 88% 811 88% 70 97% 65 100% 79 99% 876 96% 8% 749 89% 17%
HSE DNE 265 87% 88% 294 88% 36 97% 43 91% 37 95% 265 85% -10% 265 87% 0%
HSE South 527 100% 100% 636 100% 63 100% 54 100% 46 100% 632 99% -1% 527 100% 20%
HSE West 1205 99% 97% 1166 97% 103 99% 90 99% 110 96% 1,169 98% 0% 1,205 99% -3%
Palliative Care Services
Performance Activity / KPI Region / LHOData
Timing
Outturn 2013Target/expecte
d activity 2014
Target/expecte
d Activity YTD
Palliative Care Services
Oct-14 Nov-14 Dec-14Reported
Activity YTD
% var
Activity
YTD v
Target/
expect
ed
activity
YTD
Same period
last year
49
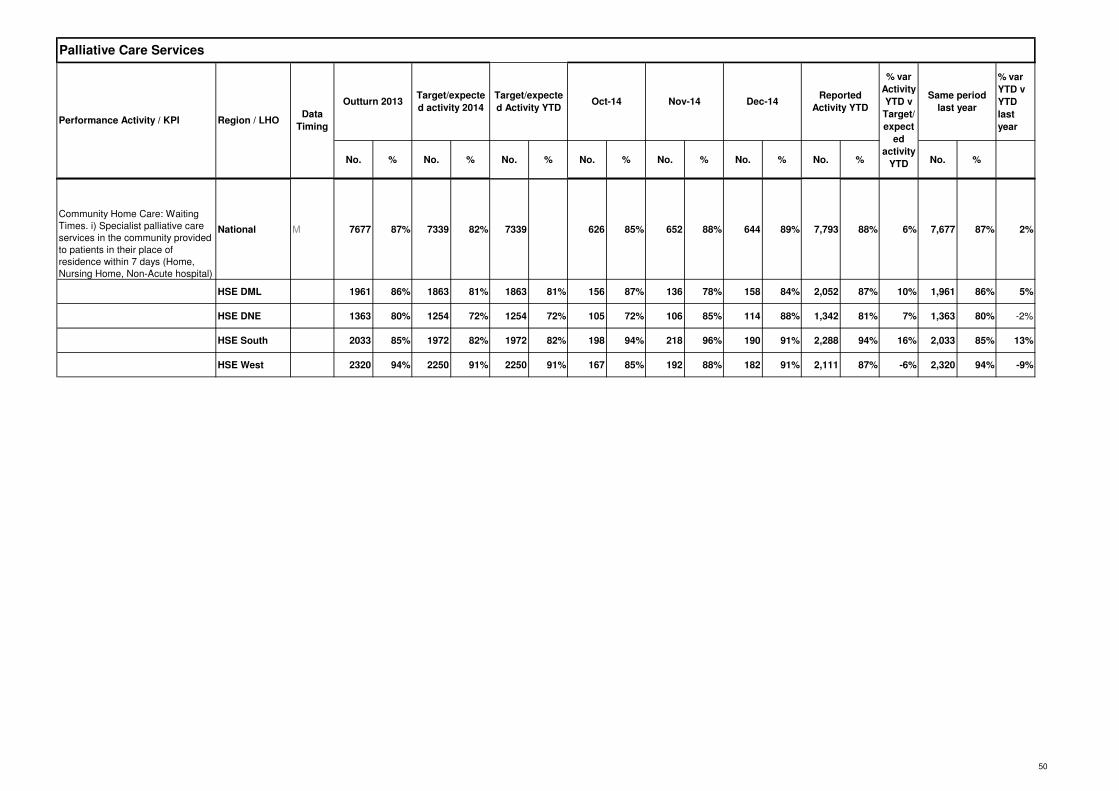
% var
YTD v
YTD
last
year
No. % No. % No. % No. % No. % No. % No. % No. %
Palliative Care Services
Performance Activity / KPI Region / LHOData
Timing
Outturn 2013Target/expecte
d activity 2014
Target/expecte
d Activity YTD
Palliative Care Services
Oct-14 Nov-14 Dec-14Reported
Activity YTD
% var
Activity
YTD v
Target/
expect
ed
activity
YTD
Same period
last year
Community Home Care: Waiting
Times. i) Specialist palliative care
services in the community provided
to patients in their place of
residence within 7 days (Home,
Nursing Home, Non-Acute hospital)
National M 7677 87% 7339 82% 7339 626 85% 652 88% 644 89% 7,793 88% 6% 7,677 87% 2%
HSE DML 1961 86% 1863 81% 1863 81% 156 87% 136 78% 158 84% 2,052 87% 10% 1,961 86% 5%
HSE DNE 1363 80% 1254 72% 1254 72% 105 72% 106 85% 114 88% 1,342 81% 7% 1,363 80% -2%
HSE South 2033 85% 1972 82% 1972 82% 198 94% 218 96% 190 91% 2,288 94% 16% 2,033 85% 13%
HSE West 2320 94% 2250 91% 2250 91% 167 85% 192 88% 182 91% 2,111 87% -6% 2,320 94% -9%
50

Sep-14 Oct-14 Nov-14 Activity YTD% var YTD v
Tgt / EA YTD
Activity YTD
SPLY
% var YTD 2014
v YTD 2013
Emergency Response Times
Total AS1 and AS2 (Emergency Ambulance)
callsNational 281,003 24,018 24,782 24,087 266,013 255,700 4.0%
North Leinster 89,929 7,759 8,197 7,965 86,985 81,859 6.3%
Dublin Fire Brigade 73,1986,178 5,948 6,066
65,454 66,627 -1.8%
South 55,950 5,066 5,246 5,153 57,353 50,754 13.0%
West 61,926 5,015 5,391 4,903 56,221 56,460 -0.4%
Number of Clinical Status 1 ECHO calls -
activated National 2,923 233 273 267 2,841 2,665 7%
North Leinster 912 71 87 78 816 853 -4.3%
Dublin Fire Brigade 1,00176 88 76
925 915 1.1%
South 494 41 48 59 561 440 27.5%
West 516 45 50 54 539 457 17.9%
ADJUSTMENT August 2014 - Number of
Clinical Status 1 ECHO calls - arrived at
scene (excludes those stood down en route)
National 219 252 255 975
North Leinster 64 73 76 278
Dublin Fire Brigade 74 86 71 304
South 41 46 55 202
West 40 47 53 191
Total number of Clinical Status 1 ECHO
incidents responded to by a patient-carrying
vehicle in 18 minutes and 59 seconds or less
National 2,026 172 191 188 2,114 1,848 14.4%
North Leinster 720 54 57 57 595 675 -11.9%
National Ambulance Service
Performance Activity / KPI Region Outturn 2013
Year to date 2014 Same Period Last Year
51

Sep-14 Oct-14 Nov-14 Activity YTD% var YTD v
Tgt / EA YTD
Activity YTD
SPLY
% var YTD 2014
v YTD 2013
National Ambulance Service
Performance Activity / KPI Region Outturn 2013
Year to date 2014 Same Period Last Year
Dublin Fire Brigade 581 56 66 55 747 516 44.8%
South 367 29 35 44 405 337 20.2%
West 358 33 33 32 367 320 14.7%
* % of Clinical Status 1 ECHO incidents
responded to by a patient-carrying vehicle in
18 minutes and 59 seconds or less
National 69.3% 78.5% 76% 74% 76.2% 5.8% 69.3% 10.0%
North Leinster 78.9% 84.4% 78% 75% 76% -4.0% 79.1% -4.2%
Dublin Fire Brigade 58.0% 75.7% 77% 77% 82% 2.0% 56.4% 44.9%
South 74.3% 70.7% 76% 80% 74% -6.0% 76.6% -3.7%
West 69.4% 82.5% 70% 60% 70% -10.0% 70.0% -0.2%
52

Sep-14 Oct-14 Nov-14 Activity YTD% var YTD v
Tgt / EA YTD
Activity YTD
SPLY
% var YTD 2014
v YTD 2013
National Ambulance Service
Performance Activity / KPI Region Outturn 2013
Year to date 2014 Same Period Last Year
Number of Clinical Status 1 DELTA calls -
activated National 86,050 8,059 8,117 7,882 86,077 78,123 10.2%
North Leinster 25,3722339
2,387 2,399 24,945 23,233 7.4%
Dublin Fire Brigade 30,7472729
2,702 2,580 28,528 28,001 1.9%
South 14,6591563
1,558 1,537 16,931 13,148 28.8%
West 15,2721428
1,470 1,366 15,673 13,741 14.1%
ADJUSTMENT August 2014 - Number of
Clinical Status 1 DELTA calls - arrived at
scene (excludes those stood down en route)
National 7,659 7,774 7,672 30,480
North Leinster 2,236 2,269 2,348 8,908
Dublin Fire Brigade 2,557 2,576 2,504 10,013
South 1,525 1,517 1,477 6,031
West 1,341 1,412 1,343 5,528
Total number of Clinical Status 1 DELTA
incidents responded to by a patient-carrying
vehicle in 18 minutes and 59 seconds or less
National 54,807 5,307 5,199 4,970 55,299 50,102 10.4%
North Leinster 17,206 1,591 1,598 1,643 16,796 15,964 5.2%
Dublin Fire Brigade 19,795 1,810 1,702 1,493 18,605 18,134 2.6%
South 8,806 1,038 1,017 1,003 10,811 7,880 37.2%
West 9,000 868 882 831 9,087 8,124 11.9%
* % of Clinical Status 1 DELTA incidents
responded to by a patient-carrying vehicle in
18 minutes and 59 seconds or less
National 63.7% 69.3% 67% 65% 65% -15.0% 64.1% 1.7%
North Leinster 67.8% 71.2% 70% 70% 68% -12.0% 68.7% -0.6%
53

Sep-14 Oct-14 Nov-14 Activity YTD% var YTD v
Tgt / EA YTD
Activity YTD
SPLY
% var YTD 2014
v YTD 2013
National Ambulance Service
Performance Activity / KPI Region Outturn 2013
Year to date 2014 Same Period Last Year
Dublin Fire Brigade 64.4% 70.8% 66% 60% 66% -14.0% 64.8% 2.6%
South 60.1% 68.1% 67% 68% 65% -15.0% 59.9% 7.9%
West 58.9% 64.7% 62.5% 62% 59% -21.0% 59.1% -0.4%
* The calcuation of response times was changed in August to reflect only those emergency ambulances which arrived at the scene.
54

Data Timing Full Year YTD Oct-14 Nov-14 Dec-14Activity
YTD
% var
YTD v
Tgt / EA
YTD
Activity
YTD
SPLY
% var
YTD 2014
v YTD
2013
Cancer Screening
No. of women who attend for breast screening National 144,656 Q 140,000 140,000 13,956 11,537 8,802 138,779 -0.9% 144,656 -4.1%
Tobacco Control
No. of smokers who received intensive cessation
support from a cessation counsellor National 10,525 M 9,000 9,000 927 772 493 9,309 3.4% 10,537 -11.7%
HSE DML 3,000 3,000 293 227 117 2,978 -0.7%
HSE DNE 3,100 3,100 276 255 153 3,037 -2.0%
HSE South 1,200 1,200 88 96 86 1,112 -7.3%
HSE West 1,200 1,200 112 111 74 1,332 11.0%
Quitline
National
Service
500 500 158 83 63 850 70.0%
No. of frontline healthcare staff trained in brief
intervention smoking cessationNational 1,395 M 1,350 1,350 68 142 100 1,303 -3.5% 1,395 -6.6%
HSE DML 377 375 375 9 25 15 307 -18.1% 377 -18.6%
HSE DNE 396 370 370 25 18 43 404 9.2% 396 2.0%
HSE South 255 285 285 30 25 0 240 -15.8% 255 -5.9%
HSE West 367 320 320 4 74 42 352 10.0% 367 -4.1%
Food Safety
No. of planned surveillance inspections of food
businessesNational
New PI
2014Q 33,000 33,000 8,680 34,720 5.2%
Health and Wellbeing
Performance Activity / KPI Region/LHOOutturn
2013
2014 Target /
Expected Activity2014 Year to date 2014
Same Period Last
Year 2013
55

Data Timing Full Year YTD Oct-14 Nov-14 Dec-14Activity
YTD
% var
YTD v
Tgt / EA
YTD
Activity
YTD
SPLY
% var
YTD 2014
v YTD
2013
Health and Wellbeing
Performance Activity / KPI Region/LHOOutturn
2013
2014 Target /
Expected Activity2014 Year to date 2014
Same Period Last
Year 2013
Immunisations Q3 2014Q1-Q3 YTD Q1 2013
% of children 24 months of age who have received the
MMR vaccineNational 92.6% Q in arrears 95% 95% 93.1% 93.0% -2.1% 92.4% 0.6%
HSE DML 93.7% 95% 95% 94.2% 93.8% -1.2% 93.5% 0.4%
HSE DNE 90.7% 95% 95% 90.9% 91.1% -4.1% 90.1% 1.1%
HSE South 93.0% 95% 95% 93.6% 93.5% -1.6% 93.0% 0.5%
HSE West 93.1% 95% 95% 93.4% 93.3% -1.8% 92.7% 0.6%
% children 12 months of age who have received the 6-in-
1 vaccineNational 91.2% Q in arrears 95% 95% 91.9% 92.0% -3.1% 91.0% 1.1%
HSE DML 92.8% 95% 95% 93.2% 93.1% -2.0% 92.6% 0.5%
HSE DNE 88.1% 95% 95% 89.9% 90.6% -4.7% 87.3% 3.8%
HSE South 90.6% 95% 95% 91.4% 91.3% -3.9% 90.7% 0.7%
HSE West 93.1% 95% 95% 93.0% 93.0% -2.1% 93.2% -0.2%
% children 24 months of age who have received 3rd
dose of MenCNational 86.7% Q in arrears 95% 95% 88.3% 87.8% -7.6% 86.3% 1.8%
HSE DML 87.7% 95% 95% 89.3% 88.5% -6.8% 87.2% 1.5%
HSE DNE 84.5% 95% 95% 86.1% 85.7% -9.8% 83.7% 2.4%
HSE South 86.6% 95% 95% 88.4% 88.0% -7.4% 86.7% 1.5%
HSE West 87.8% 95% 95% 89.3% 88.9% -6.4% 87.4% 1.7%
School academic year 2013/14
56

Data Timing Full Year YTD Oct-14 Nov-14 Dec-14Activity
YTD
% var
YTD v
Tgt / EA
YTD
Activity
YTD
SPLY
% var
YTD 2014
v YTD
2013
Health and Wellbeing
Performance Activity / KPI Region/LHOOutturn
2013
2014 Target /
Expected Activity2014 Year to date 2014
Same Period Last
Year 2013
% first year girls who have received third dose of HPV
vaccine by August 2014National 84.1% A 80% 80% 83.6% 83.6% 4.5%
HSE DML 85.9% 80% 80% 82.9% 82.9% 3.6%
HSE DNE 77.8% 80% 80% 82.6% 82.6% 3.2%
HSE South 85.6% 80% 80% 83.3% 83.3% 4.1%
HSE West 86.1% 80% 80% 85.6% 85.6% 7.0%
Child Health
% newborn babies visited by a PHN within 48 hours of
hospital dischargeNational 84.2% Q 95% 95% 85.7% 85.7% -9.8% 84.2% 1.8%
HSE DML 87.3% 95% 95% 87.3% 87.7% -7.7% 87.3% 0.5%
HSE DNE 74.7% 95% 95% 78.3% 78.5% -17.4% 74.7% 5.1%
HSE South 88.9% 95% 95% 89.2% 90.1% -5.2% 88.9% 1.4%
HSE West 86.2% 95% 95% 87.9% 86.5% -8.9% 86.2% 0.3%
% of children reaching 10 months who have had their
child development health screening before 10 months National 88.1% M 95% 95% 91.7% 92.6% 94.0% 92.1% -3.1% 88.1% 4.5%
HSE DML 90.2% 95% 95% 90.5% 91.8% 92.7% 91.2% -4.0% 90.2% 1.1%
HSE DNE 92.8% 95% 95% 91.5% 93.2% 94.8% 94.2% -0.8% 92.8% 1.5%
HSE South 92.7% 95% 95% 94.2% 93.2% 95.7% 93.7% -1.4% 92.7% 1.1%
HSE West 75.8% 95% 95% 90.8% 92.3% 92..9% 89.2% -6.1% 75.8% 17.7%
57

% var YTD
v Tgt / EA
YTD
% var
YTD
2014 v
YTD
No. % No. % No. % No. % % No. %
Community Intervention
Team Activity by Source 1,263 1,273 1,314 14,689
ED / Hospital avoidance National
M 5,976 5,976 790 809 847 9,169 53.4%
HSE DML 1,496 1,496 371 401 409 4,847 >100%
HSE DNE 2,008 2,008 136 109 114 1,510 -24.8%
HSE South 456 456 154 159 193 1,513 >100%
HSE West 2,016 2,016 129 140 131 1,299 -35.6%
Early discharge National
M 6,104 6,104 196 230 254 3,099 -49.2%
HSE DML 3,624 3,624 34 47 48 899 -75.2%
HSE DNE 1,252 1,252 59 65 79 866 -30.8%
HSE South 264 264 42 53 56 555 >100%
HSE West 964 964 61 65 71 779 -19.2%
GP referrals National
M 2,140 2,140 176 148 119 1,484 -30.7%
HSE DML 320 320 - - - - -100.0%
HSE DNE 1,200 1,200 114 105 95 1,198 -0.2%
HSE South 392 392 33 31 18 192 -51.0%
HSE West 228 228 29 12 6 94 -58.8%
Community Referrals National
M 600 600 101 86 94 937 56.2%
HSE DML 268 268 - - - - -100.0%
HSE DNE 72 72 18 15 16 167 >100%
HSE South 76 76 21 12 24 127 67.1%
Dec-14
Primary Care
Performance Activity / KPI Region/LHOData
Timing
Outturn 2013
2014 Target / Expected Activity Year to date 2014 Same Period Last
Year 2013
Full Year Oct-14 Nov-14YTD Activity YTDActivity YTD
SPLY
58

% var YTD
v Tgt / EA
YTD
% var
YTD
2014 v
YTD
No. % No. % No. % No. % % No. %
Dec-14
Primary Care
Performance Activity / KPI Region/LHOData
Timing
Outturn 2013
2014 Target / Expected Activity Year to date 2014 Same Period Last
Year 2013
Full Year Oct-14 Nov-14YTD Activity YTDActivity YTD
SPLY
HSE West 184 184 62 59 54 643 >100%
No. of existing primary care
diabetes initiatives aligned to National Q
New
2014 10 10 0 0 -100.0%
HSE DML 3 3 0 0 -100.0%
HSE DNE 2 2 0 0 -100.0%
HSE South 1 1 0 0 -100.0%
HSE West 4 4 0 0 -100.0%
Occupational Therapy – No.
of patients waiting over 16
weeks for an assessment
National M
8,511
7,660 7,660 8,063 7,910 8,141 8,141 -6.3%
HSE DML 2,495
2,246 2,246 2,129 2,113 1,968 1,968 12.4%
HSE DNE 1,227
1,104 1,104 1,019 1,001 1,086 1,086 1.6%
HSE South 3,539
3,185 3,185 3,316 3,257 3,502 3,502 -10.0%
HSE West 1,250
1,125 1,125 1,599 1,539 1,585 1,585 -40.9%
Physiotherapy – No. of
patients waiting over 12
weeks for an assessment
National M
7,181
6,463 6,463 6,087 6,029 7,433 7,433 -15.0%
HSE DML 1,187
1,068 1,068 706 755 1,219 1,219 -14.1%
HSE DNE 1,109
998 998 881 862 1,115 1,115 -11.7%
Chronic Disease – Diabetes
Physiotherapy and Occupational Therapy Wait List Management
59

% var YTD
v Tgt / EA
YTD
% var
YTD
2014 v
YTD
No. % No. % No. % No. % % No. %
Dec-14
Primary Care
Performance Activity / KPI Region/LHOData
Timing
Outturn 2013
2014 Target / Expected Activity Year to date 2014 Same Period Last
Year 2013
Full Year Oct-14 Nov-14YTD Activity YTDActivity YTD
SPLY
HSE South 2,283
2,055 2,055 1,254 1,094 1,311 1,311 36.2%
HSE West 2,602
2,342 2,342 3,246 3,318 3,788 3,788 -61.8%
Reduce waiting times of
those waiting for
assessment (New PI 2014) -
No and % on waiting list for
assessment 0-12 months
National QNew
201490% 90% 5,805 96.5% 5,805 96.5% 7.2%
HSE DML 90% 90% 1,697 100.0% 1,697 100.0% 11.1%
HSE DNE 90% 90% 950 100.0% 950 100.0% 11.1%
HSE South 90% 90% 1,624 98.1% 1,624 98.1% 9.0%
HSE West 90% 90% 1,534 94.4% 1,534 94.4% 4.9%
Reduce the proportion of
patients on the treatment
waiting list longer than 4
years (grade 4 and 5) <5%
National QNew
2014<5% 5% 877 5.0% 877 5.0% 0.0%
HSE DML <5% 5% 156 1.9% 156 1.9% 62.0%
HSE DNE <5% 5% 637 19.1% 637 19.1% >-100%
HSE South <5% 5% 24 1.0% 24 1.0% 80.0%
HSE West <5% 5% 60 0.9% 60 0.9% 82.0%
Orthodontics
60

Full Year YTD Oct-14 Nov-14 Dec-14 Activity YTD
% var
YTD v
Tgt / EA
YTD
Activity YTD
SPLY
% var
YTD 2014
v YTD
2013
No. persons covered by medical
cards as at 31st DecemberNational M 1,849,380 1,875,707 1,875,707 1,777,762 1,771,368 1,768,700 1,768,700 -5.7% 1,849,380 -4.4%
No. persons covered by GP visit
cards as at 31st DecemberNational M 125,426 402,138 161,096 157,444 157,913 159,576 159,576 -0.9% 125,426 27.2%
% of properly completed medical /
GP visit card applications processed
within the 15 day turnaround
National M 97.8% 95.0% 95.0% 95.5% 97.2% 96.4% 96.4% 1.5% 97.8% -1.4%
No. of claims National M 927,505 944,288 944,288 127,259 135,420 131,976 1,294,001 37.0% 927,505 39.5%
No. of items National M 3,009,905 3,059,492 3,059,492 447,619 475,253 465,334 4,451,918 45.5% 3,009,905 47.9%
No. of prescriptions National M 20,108,450 21,639,388 21,639,388 1,614,510 1,629,750 1,529,980 19,144,298 -11.5% 20,108,450 -4.8%
No. of items National M 62,062,813 66,432,920 66,432,920 4,906,939 4,959,250 4,644,106 58,831,655 -11.4% 62,062,813 -5.2%
No. of claims – Special items of
ServiceNational M 923,774 946,957 946,957 254,612 134,040 68,152 942,033 -0.5% 923,774 2.0%
No. of claims – Special Type
ConsultationsNational M 1,231,685 1,242,077 1,242,077 86,257 85,169 91,019 1,098,129 -11.6% 1,231,685 -10.8%
No. of treatments – DTSS (routine) National M 1,256,216 1,354,079 1,354,079 94,240 106,958 96,262 1,248,650 -7.8% 1,256,216 -0.6%
No. of treatments – DTSS (complex) National M 65,903 68,338 68,338 5,701 6,429 6,201 67,666 -1.0% 65,903 2.7%
Primary Care - PCRS
Performance Activity / KPIRegion/L
HO
Data
TimingOutturn 2013
2014 Target / Expected
Activity2014 Year to date 2014 Same Period Last Year
2013
DTSS
GMS
Medical Cards
GP Visit Cards
Medical / GP Visit Cards
Long Term Illness
61

% var
YTD v
YTD
last
year
No. % No. % No. % No. % No. % No. % No. % No. %
No. of clients in opioid
substitute treatment (outside
prisons) (monthly target)
National M/arrears 9,100 9,100 9,442 9,312 9,339 9,339 3%
HSE DML 4,920 4,920 5089 54% 5084 55% 5076 54% 5,076 54% 3%
HSE DNE 3,265 3,265 3192 34% 3152 34% 3166 34% 3,166 34% -3%
HSE South 576 576 729 8% 716 8% 736 8% 736 7% 28%
HSE West 339 339 432 5% 360 4% 361 4% 361 4% 6%
No. of clients in opioid
substitute treatment (prisons)
(monthly target)
National M/arrears 500 500 479 497 483 483 -3%
No. of individuals attending
pharmacy needle exchange
per month
National
M data
reported Q
in arrears
1073 700 700 1,329 1,450 1,401 1,401 100% 1,141 23%
HSE DML 92 40 40 139 151 156 156 290% 86 81%
HSE DNE 171 70 70 217 194 241 241 244% 149 62%
HSE South 529 340 340 620 719 573 573 69% 563 2%
HSE West 281 250 250 353 386 431 431 72% 343 26%
No. and % of substance
misusers (over 18 years) for
whom treatment has
commenced within one
calendar month following
assessment
National Q in
arrears1188 97% 1,260 100% 1,260 100% 1,109 97% 1,109 97% -12% 1,081 93% 3%
HSE DML 215 90% 300 100% 300 100% 269 97% 269 97% -10% 253 81% 6%
HSE DNE 146 100% 210 100% 210 100% 117 100% 117 100% -44% 157 100% -25%
HSE South 622 99% 550 100% 550 100% 566 99% 566 99% 3% 527 97% 7%
Social Inclusion
New KPI
New
KPI
Oct-14 Nov-14 Dec-14Reported
Activity YTD
% var
Activity
YTD v
Target
YTD
Same period
last year
Social Inclusion
Performance Activity / KPIRegion /
LHO
Data
Timing
Outturn 2013 Target 2014 Target YTD
62

% var
YTD v
YTD
last
year
No. % No. % No. % No. % No. % No. % No. % No. %
Social Inclusion
Oct-14 Nov-14 Dec-14Reported
Activity YTD
% var
Activity
YTD v
Target
YTD
Same period
last year
Social Inclusion
Performance Activity / KPIRegion /
LHO
Data
Timing
Outturn 2013 Target 2014 Target YTD
HSE West 205 96% 200 100% 200 100% 157 88% 157 88% -22% 144 97% 9%
No. and % of substance
misusers (under 18 years) for
whom treatment has
commenced within one week
following assessment
National Q in
arrears86 99% 105 100% 105 100% 67 97% 67 97% -36% 56 100% 20%
HSE DML 21 100% 25 100% 25 100% 20 100% 20 100% -20% 14 100% 43%
HSE DNE 7 100% 15 100% 15 100% 4 100% 4 100% -73% 5 100% -20%
HSE South 35 97% 40 100% 40 100% 26 93% 26 93% -35% 28 100% -7%
HSE West 23 100% 25 100% 25 100% 17 100% 17 100% -32% 9 100% 89%
No. and % of individual
service users admitted to
homeless emergency
accommodation hostels /
facilities whose health needs
have been assessed as part
of a Holistic Needs
Assessment (HNA) within two
weeks of admission
National Q 1266 66% 1,700 85% 1,700 85% 1,357 68% 1,357 68% -20% 1,266 66% 7%
HSE DML 69 19% 354 85% 354 85% 340 54% 340 54% -4% 69 19% 393%
HSE DNE 147 71% 284 85% 284 85% 84 53% 84 53% -70% 147 71% -43%
HSE South 615 78% 595 85% 595 85% 547 74% 547 74% -8% 615 78% -11%
HSE West 435 80% 467 85% 467 85% 386 84% 386 84% -17% 435 80% -11%
63
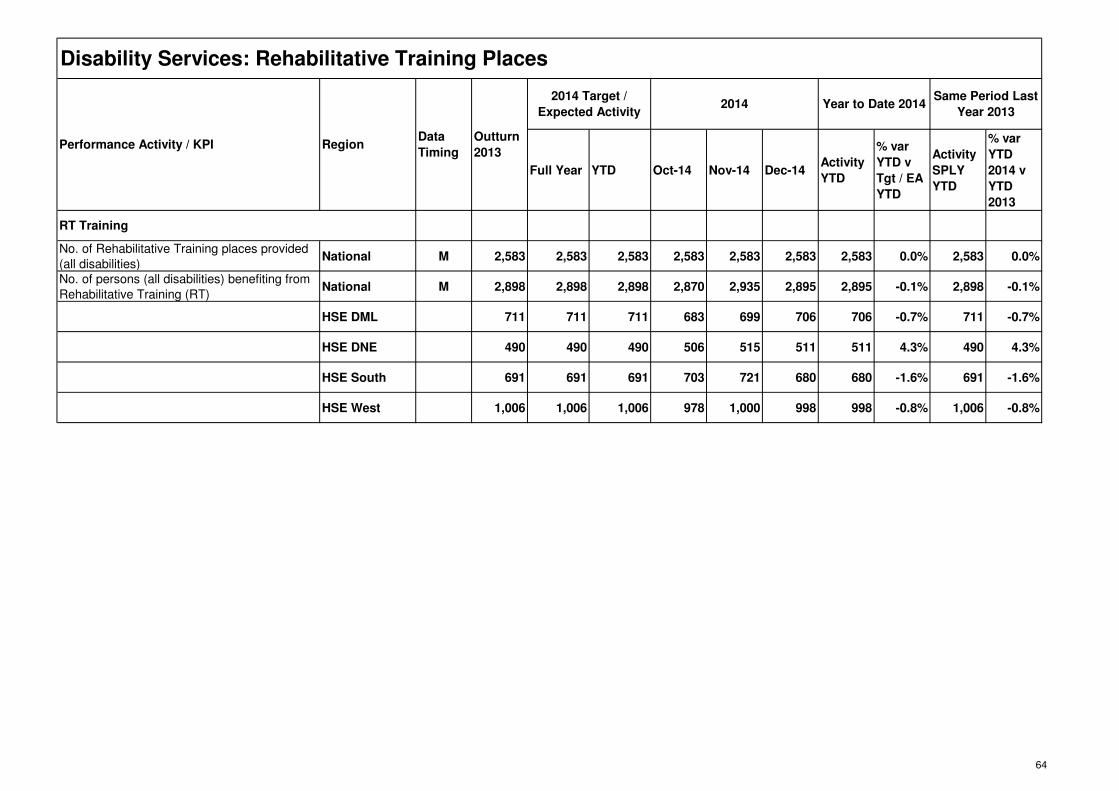
Full Year YTD Oct-14 Nov-14 Dec-14Activity
YTD
% var
YTD v
Tgt / EA
YTD
Activity
SPLY
YTD
% var
YTD
2014 v
YTD
2013
No. of Rehabilitative Training places provided
(all disabilities)National M 2,583 2,583 2,583 2,583 2,583 2,583 2,583 0.0% 2,583 0.0%
No. of persons (all disabilities) benefiting from
Rehabilitative Training (RT)National M 2,898 2,898 2,898 2,870 2,935 2,895 2,895 -0.1% 2,898 -0.1%
HSE DML 711 711 711 683 699 706 706 -0.7% 711 -0.7%
HSE DNE 490 490 490 506 515 511 511 4.3% 490 4.3%
HSE South 691 691 691 703 721 680 680 -1.6% 691 -1.6%
HSE West 1,006 1,006 1,006 978 1,000 998 998 -0.8% 1,006 -0.8%
RT Training
Disability Services: Rehabilitative Training Places
Performance Activity / KPI RegionData
Timing
Outturn
2013
2014 Target /
Expected Activity2014 Year to Date 2014
Same Period Last
Year 2013
64

No. % No. % No. %
National 1,348 1,006 681 67.7% 650 125 775 277 35.7% 541 334 61.7%
HSE DML 432 318 299 94.0% 310 49 359 94 26.2% 240 116 48.3%
HSE DNE 303 170 133 78.2% 136 18 154 53 34.4% 112 78 69.6%
HSE South 414 352 86 24.4% 106 30 136 33 24.3% 85 53 62.4%
HSE West 199 166 163 98.2% 98 28 126 97 77.0% 104 87 83.7%
Disability Act Compliance (Q4 2014)
No. of
requests for
assessments
received
No. of
assessments
commenced
as provided
for in the
regulations
Assessments commenced
within the timelines as
provided for in the
regulations
Applicants
deemed to
have a
disability
Applicants
deemed to
not have a
disability
No. of
assessments
completed as
provided for
in the
regulations
Assessments completed
within the timelines as
provided for in the
regulations
No. of
service
statements
completed
Service statements
completed within the
timelines as provided for in
the regulations
65

Full Year YTD Oct-14 Nov-14 Dec-14Activity
YTD
% var YTD v
Tgt / EA YTD
Activity YTD
SPLY
% var YTD
2014 v YTD
2013
Home Care Packages
Total no. of persons in
receipt of a HCPNational M 11,873 10,870 10,870 13,093 13,139 13,199 13,199 21.4% 11,875 11.1%
HSE
DML3,266 2,662 2,662 3530 3533 3559 3559 33.7% 3,266 9.0%
HSE
DNE4,299 3,545 3,545 4,886 4,897 4951 4951 39.7% 4,299 15.2%
HSE
South2,088 2,425 2,425 2216 2229 2218 2218 -8.5% 2,088 6.2%
HSE
West2,220 2,238 2,238 2,461 2480 2471 2471 10.4% 2222 11.2%
Intensive Home Care
Packages
Number of Persons in
receipt of an intensive HCP National M
New KPI
2014190 30 1 3 7 15 -50.0% New KPI 2014
New KPI
2014
HSE
DML
New KPI
20147 0 0 0 0 0%
HSE
DNE
New KPI
20147 0 0 0 3 -55.9%
HSE
South
New KPI
20147 0 0 0 0 0.0%
HSE
West
New KPI
20147 1 3 7 12 76.5%
Home Help Hours
Services for Older People
Performance Activity /
KPIRegion
Data
Timing
Outturn
2013
2014 Target / Expected
Activity2014 Year to date 2014
Same Period Last Year
2013
66
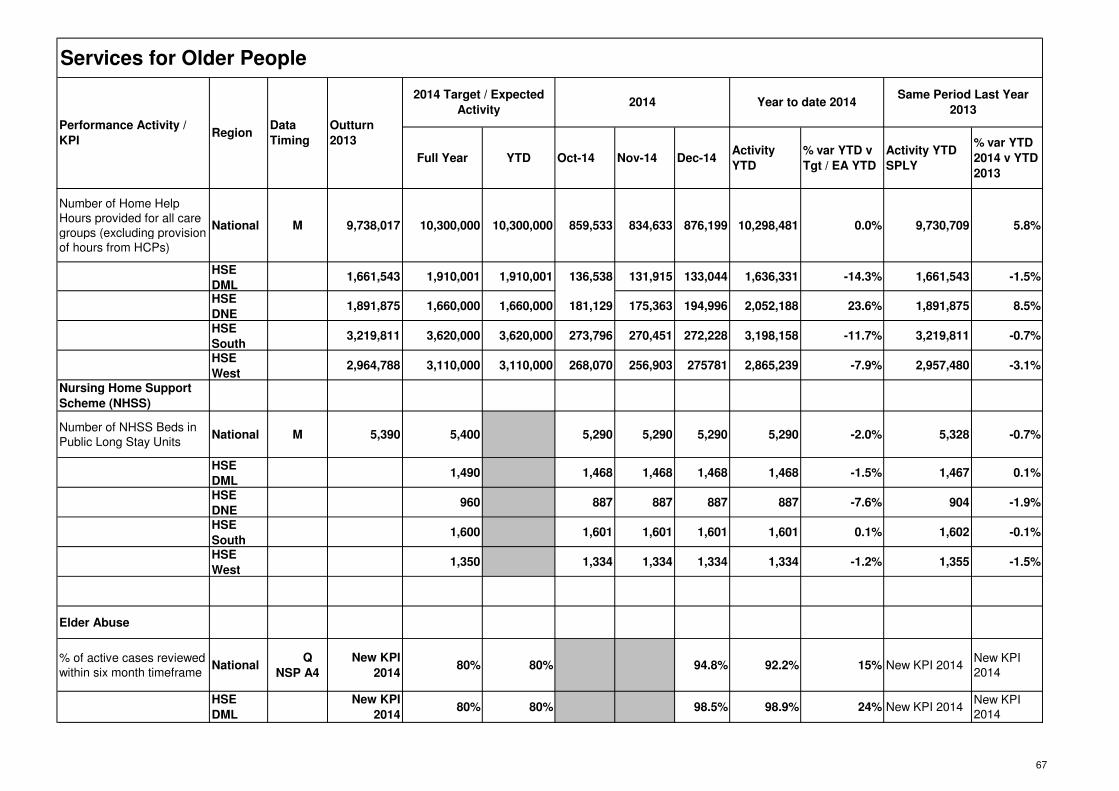
Full Year YTD Oct-14 Nov-14 Dec-14Activity
YTD
% var YTD v
Tgt / EA YTD
Activity YTD
SPLY
% var YTD
2014 v YTD
2013
Services for Older People
Performance Activity /
KPIRegion
Data
Timing
Outturn
2013
2014 Target / Expected
Activity2014 Year to date 2014
Same Period Last Year
2013
Number of Home Help
Hours provided for all care
groups (excluding provision
of hours from HCPs)
National M 9,738,017 10,300,000 10,300,000 859,533 834,633 876,199 10,298,481 0.0% 9,730,709 5.8%
HSE
DML1,661,543 1,910,001 1,910,001 136,538 131,915 133,044 1,636,331 -14.3% 1,661,543 -1.5%
HSE
DNE1,891,875 1,660,000 1,660,000 181,129 175,363 194,996 2,052,188 23.6% 1,891,875 8.5%
HSE
South3,219,811 3,620,000 3,620,000 273,796 270,451 272,228 3,198,158 -11.7% 3,219,811 -0.7%
HSE
West2,964,788 3,110,000 3,110,000 268,070 256,903 275781 2,865,239 -7.9% 2,957,480 -3.1%
Nursing Home Support
Scheme (NHSS)
Number of NHSS Beds in
Public Long Stay Units National M 5,390 5,400 5,290 5,290 5,290 5,290 -2.0% 5,328 -0.7%
HSE
DML1,490 1,468 1,468 1,468 1,468 -1.5% 1,467 0.1%
HSE
DNE960 887 887 887 887 -7.6% 904 -1.9%
HSE
South1,600 1,601 1,601 1,601 1,601 0.1% 1,602 -0.1%
HSE
West1,350 1,334 1,334 1,334 1,334 -1.2% 1,355 -1.5%
Elder Abuse
% of active cases reviewed
within six month timeframeNational
Q
NSP A4
New KPI
201480% 80% 94.8% 92.2% 15% New KPI 2014
New KPI
2014
HSE
DML
New KPI
201480% 80% 98.5% 98.9% 24% New KPI 2014
New KPI
2014
67

Full Year YTD Oct-14 Nov-14 Dec-14Activity
YTD
% var YTD v
Tgt / EA YTD
Activity YTD
SPLY
% var YTD
2014 v YTD
2013
Services for Older People
Performance Activity /
KPIRegion
Data
Timing
Outturn
2013
2014 Target / Expected
Activity2014 Year to date 2014
Same Period Last Year
2013
HSE
DNE
New KPI
201480% 80% 97.9% 88.2% 10% New KPI 2014
New KPI
2014
HSE
South
New KPI
201480% 80% 90.9% 88.2% 10% New KPI 2014
New KPI
2014
HSE
West
New KPI
201480% 80% 94.5% 92.0% 15% New KPI 2014
New KPI
2014
68

% YTD % % % %
% var YTD
v Tgt / EA
YTD
No. %
% var
YTD
2014 v
YTD
2013
% of General Adult Community
Mental Health Teams serving a
population of circa 50,000
(range of 45,000 to 60,000) as
recommended in Vision
National >60% 60% 39% 39% -35%
HSE DML >60% 60% 45% 45% -24%
HSE DNE >60% 60% 24% 24% -59%
HSE South >60% 60% 43% 43% -28%
HSE West >60% 60% 42% 42% -31%
% of accepted referrals / re-
referrals offered first
appointment and seen within
12 weeks / 3 months by
General Adult Community
Mental Health Teams
National 99% >75% 75% 76% 76% 75% 74% -1%
HSE DML 100% >75% 75% 71% 72% 68% 69% -7%
HSE DNE 100% >75% 75% 71% 67% 71% 67% -11%
HSE South 97% >75% 75% 77% 79% 81% 77% 3%
HSE West 100% >75% 75% 81% 82% 80% 79% 6%
% of accepted referrals / re-
referrals offered first
appointment and seen within
12 weeks / 3 months by
Psychiatry of Old Age
Community Mental Health
Teams
National 100% >95% 95% 96% 97% 96% 96% 1%
HSE DML 100% >95% 95% 99% 99% 98% 98% 3%
MENTAL HEALTH SERVICES
Performance Activity / KPI Region / LHO% Data
Returned
Adult Mental Health Services
Oct-14 Nov-14 Dec-142014 Target / Expected
ActivityYear to date 2014
Same period last year
2013
69

% YTD % % % %
% var YTD
v Tgt / EA
YTD
No. %
% var
YTD
2014 v
YTD
2013
MENTAL HEALTH SERVICES
Performance Activity / KPI Region / LHO% Data
Returned
Adult Mental Health Services
Oct-14 Nov-14 Dec-142014 Target / Expected
ActivityYear to date 2014
Same period last year
2013
HSE DNE 100% >95% 95% 95% 97% 96% 95% 0%
HSE South 100% >95% 95% 95% 92% 99% 94% -1%
HSE West 100% >95% 95% 96% 98% 93% 96% 1%
Admissions of children to Child
and Adolescent Acute Inpatient
Units as a % of the total
number of admissions of
children to mental health acute
inpatient units.
National 100% >75% 75% 76% 69% 81% 69% -8%
HSE DML
HSE DNE
HSE South
HSE West
% of accepted referrals / re-
referrals offered first
appointment and seen within
12 weeks / 3 months by Child
and Adolescent Community
Mental Health Teams
National 97% >75% 75% 69% 70% 73% 67% -10% 70% -4%
HSE DML 89% >75% 75% 62% 67% 67% 61% -18% 63% -3%
HSE DNE 100% >75% 75% 60% 68% 75% 61% -19% 61% 0%
HSE South 100% >75% 75% 64% 58% 59% 67% -11% 73% -9%
HSE West 100% >75% 75% 84% 83% 92% 77% 3% 80% -4%
Child and Adolescent Community Mental Health Services
70

Key Performance Measurement
Approved Allocation
€000 Actual YTD €000 Budget YTD €000 Variance YTD €000 % Var Act v Tar
Dublin Mid Leinster2,484,238 2,488,542 2,484,238 4,304 0.2%
Dublin North East1,545,817 1,554,657 1,545,817 8,840 0.6%
Louth Meath Hospital Group198,448 201,361 198,448 2,913 1.5%
South1,697,596 1,687,666 1,697,596 -9,930 -0.6%
West1,867,128 1,869,200 1,867,128 2,072 0.1%
Corporate Divisions87,124 52,891 87,124 -34,233 -39.3%
Health & Wellbeing206,723 182,739 206,723 -23,984 -11.6%
ISD Regional Sub Total8,087,073 8,037,055 8,087,073 -50,018 -0.6%
Primary Care Reimbursement Service2,286,166 2,286,532 2,286,166 366 0.0%
Local Schemes217,514 222,146 217,514 4,632 2.1%
Corporate Services & Pensions484,238 500,443 484,238 16,205 3.3%
National Services321,808 291,314 321,808 -30,494 -9.5%
Fair Deal816,143 815,495 816,143 -648 -0.1%
Held Funds0 0 0 0.0%
Total HSE12,212,942 12,152,985 12,212,942 -59,957 -0.5%
Finance Overview
71

Approved Allocation
€000
Actual YTD €000 Budget YTD €000 Variance YTD €000 % Var Act v Tar
Acute Hospital Services 4,045,662 4,050,807 4,045,662 5,145 0.1%
Primary & Community 3,747,564 3,750,619 3,747,564 3,054 0.1%
Corporate Divisions 87,124 52,891 87,124 (34,233 ) -39.3%
Health & Wellbeing 206,723 182,739 206,723 (23,984 ) -11.6%
ISD Total 8,087,073 8,037,056 8,087,073 (50,018 ) -0.6%
Primary Care Reimbursement Service 2,286,166 2,286,532 2,286,166 366 0.0%
Local Schemes 217,514 222,146 217,514 4,632 2.1%
Corporate Services and Pensions 484,238 500,443 484,238 16,205 3.3%
National Services 321,808 291,314 321,808 (30,494 ) -9.5%
Fair Deal 816,143 815,495 816,143 (648 ) -0.1%
Held Funds - - - 0.0%
Total HSE 12,212,942 12,152,985 12,212,942 (59,957 ) -0.5%
*The acute hospital services budget reported above includes budget for acute regional services
Note: Stated before the application of accelerated income collection target which reduces available cash entitlement to €11,540,942
Actual Plan Variance
€'000s €'000s €'000s €'000s
Disability Services 1,440,067 1,436,012 1,440,067 (4,055 )
Mental Health 734,802 723,458 734,802 (11,343 )
Multi Care Group Services 131,369 142,117 131,369 10,747
Older Persons (Including subvention and
contract beds) 659,907 672,257 659,907 12,351
Palliative Care & Chronic Illness 69,361 69,224 69,361 (137 )
Primary Care 571,984 576,775 571,984 4,791
Social Inclusion 131,154 124,985 131,154 (6,170 )
Other Regional Services 8,920 5,791 8,920 (3,130 )
Total 3,747,564 3,750,619 3,747,564 3,054
YTD €000s YTD €000s YTD €000s
Actual Plan Variance
Social Care 38,363 30,079 38,363 (8,284 )
Mental Health 20,026 11,706 20,026 (8,319 )
Primary Care 23,388 9,427 23,388 (13,961 )
Palliative Care 750 - 750 (750 )
Acute Hospitals 4,597 1,678 4,597 (2,919 )
Total Corporate Divisions 87,124 52,891 87,124 (34,233 )
Expenditure by Division - National Approved Allocation
Detailed Finance Report
Expenditure by Division Approved Allocation
YTD
72

Region Actual €000 Budget €000 Variance €'000 % Var
DML Total 2,488,542 2,484,238 4,304 0.2%
Acute 1,383,121 1,381,959 1,163 0.1%
Non Acute 1,105,420 1,102,279 3,141 0.3%
DNE Total 1,756,018 1,744,265 11,753 0.7%
Acute 728,349 729,484 -1,135 -0.2%
Louth Meath Hospital Group 201,361 198,448 2,913 1.5%
Non Acute 826,308 816,333 9,975 1.2%
South Total 1,687,666 1,697,596 -9,930 -0.6%
Acute 813,174 811,192 1,982 0.2%
Non Acute 874,491 886,403 -11,912 -1.3%
West Total 1,869,200 1,867,128 2,072 0.1%
Acute 924,801 924,579 222 0.0%
Non Acute 944,399 942,549 1,850 0.2%
Total Regions 7,801,425 7,793,226 8,199 0.1%
Service Delivery Overview - FinanceBudget
73

Current Year
Approved
Agency
Allocation
December 2014
Actual Agency
Expenditure
December 2014
Agency Budget
December 2014
Variance
2014 YTD Actual
Agency
Expenditure
2014 YTD
Agency Budget
2014 YTD
Variance
€'000 €'000 €'000 €'000 €'000 €'000 €'000
Statutory Service Providers 656,847 3,795,250 50,673 3,744,577 38,218,540 656,847 37,561,693
Non Statutory Service Providers 32,681,322 6,662,173 4,780,993 1,881,181 70,362,821 32,681,322 37,681,499
Total - HSE Dublin Mid Leinster 33,338,169 10,457,423 4,831,666 5,625,758 108,581,361 33,338,169 75,243,192
Statutory Service Providers 43,832,189 7,601,448 3,787,692 3,813,757 79,904,566 43,832,189 36,072,377
Non Statutory Service Providers 0 2,195,202 0 2,195,202 21,310,399 1 21,310,399
Total - HSE Dublin North East 43,832,189 9,796,650 3,787,692 6,008,959 101,214,965 43,832,190 57,382,776
Statutory Service Providers 22,838,119 5,085,247 1,933,517 3,151,730 56,731,310 22,838,119 33,893,190
Non Statutory Service Providers 0 535,644 0 535,644 5,662,581 0 5,662,581
Total - HSE South 22,838,119 5,620,891 1,933,517 3,687,374 62,393,891 22,838,119 39,555,771
Statutory Service Providers 33,795,010 5,956,536 19,945,425 -13,988,889 60,441,393 33,795,010 26,646,383
Non Statutory Service Providers 0 142,378 0 142,378 1,491,408 0 1,491,408
Total - HSE West 33,795,010 6,098,914 19,945,425 -13,846,511 61,932,801 33,795,010 28,137,791
Agency Costs - Comparison of monthly 2014 versus 2013 Agency Costs
Medical/Dental Nurses
Care Assistants,
Porters, etc Paramedical Central Support Total
€000 €000 €000 €000 €000 €000
January 2014 cost 7,823 7,921 5,711 2,323 1,166 24,943
February 2014 cost 8,356 7,701 5,536 2,536 1,123 25,252
March 2014 cost 9,003 8,819 6,214 2,632 1,120 27,787
April 2014 cost 9,144 8,363 6,269 2,648 1,323 27,746
May 2014 cost 10,173 9,033 6,330 2,274 1,534 29,345
June 2014 cost 10,778 8,310 5,887 2,343 1,427 28,746
July 2014 cost 10,902 8,868 6,659 2,720 1,385 30,535
August 2014 cost 9,840 8,259 6,510 2,462 1,617 28,688
September 2014 cost 10,153 8,171 6,621 2,484 1,539 28,969
October 2014 cost 9,748 8,806 6,589 2,118 1,627 28,888
November 2014 cost 12,378 8,538 5,237 2,355 1,913 30,421
December 2014 cost 8,539 9,040 7,039 2,847 1,820 29,285
Year to Date Total 2014 116,838 101,829 74,602 29,741 17,594 340,604
Average monthly cost 2014 9,736 8,486 6,217 2,478 1,466 28,384
January 2013 cost 3,853 7,370 4,362 1,754 672 18,011
February 2013 cost 3,585 6,977 4,307 1,608 699 17,177
March 2013 cost 3,016 7,254 4,291 1,447 748 16,756
April 2013 cost 3,586 7,457 4,868 1,802 658 18,371
May 2013 cost 3,918 7,740 4,831 2,032 869 19,391
June 2013 cost 4,545 7,723 4,865 2,021 792 19,947
July 2013 cost 5,627 7,780 5,167 2,183 704 21,461
August 2013 cost 6,077 7,442 5,822 2,378 907 22,627
September 2013 cost 6,553 7,908 5,592 2,293 795 23,142
October 2013 cost 6,538 8,384 5,085 2,288 860 23,155
November 2013 cost 7,115 6,371 6,863 2,488 1,543 24,380
December 2013 cost 7,243 8,417 5,278 2,068 1,476 24,480
Year to Date Total 2013 61,655 90,824 61,333 24,363 10,723 248,898
Average monthly cost 2013 to date 5,138 7,569 5,111 2,030 894 20,741
Total Cost 2013 61,655 90,824 61,333 24,363 10,723 248,898
Change - YTD Dec 2014 vs YTD Dec 2013 90% 12% 22% 22% 64% 37%
Current Month & Year to Date Actual versus Budgeted Expenditure on Agency Personnel
Statutory & Non Statutory Service Providers (excluding
National Services & Childcare)
74
Agency Costs - Comparison of monthly 2014 versus 2013 Agency Costs
Medical/Dental Nurses
Care Assistants,
Porters, etc Paramedical Central Support Total
€000 €000 €000 €000 €000 €000
Note: Agency costs for 2013 & 2014 exclude childcare
75

Summary by Regional Area
Budget 2014 Actual Budget Variance Actual Budget Variance
€000s €000s €000s €000s €000s €000s €000s
Dublin / Mid Leinster Region
Hospitals 1,381,959 120,757 176,711 -55,953 1,383,121 1,381,959 1,163
Community 1,102,279 96,554 123,769 -27,216 1,105,420 1,102,279 3,141
Total 2,484,238 217,311 300,480 -83,169 2,488,542 2,484,238 4,304
Dublin North East Region
Louth Meath Hospitals Group 198,448 17,793 33,395 -15,602 201,361 198,448 2,913
Dublin North East Hospitals 729,484 67,292 106,044 -38,752 728,349 729,484 -1,135
Hospitals Total 927,932 85,085 139,439 -54,354 929,710 927,932 1,778
Community 816,333 75,370 87,830 -12,460 826,308 816,333 9,975
Total 1,744,265 160,455 227,269 -66,813 1,756,018 1,744,265 11,753
South Region
Hospitals 811,192 78,584 130,286 -51,702 813,174 811,192 1,982
Community 886,403 63,959 88,483 -24,525 874,491 886,403 -11,912
Total 1,697,596 142,542 218,769 -76,227 1,687,666 1,697,596 -9,930
West Region
Hospitals 924,579 79,907 154,867 -74,960 924,801 924,579 222
Community 942,549 86,111 91,109 -4,998 944,399 942,549 1,850
Total 1,867,128 166,018 245,976 -79,958 1,869,200 1,867,128 2,072
Corporate Divisions 87,124 18,751 41,439 -22,688 52,891 87,124 -34,233
Health & Well Being 206,723 16,189 20,087 -3,898 182,739 206,723 -23,984
Total 8,087,073 721,266 1,054,020 -332,753 8,037,055 8,087,073 -50,018
National Services / Other
Primary Care Reimbursement Service & Local Schemes2,286,166 186,758 239,342 -52,584 2,286,532 2,286,166 366
Local Schemes 217,514 19,563 59,280 -39,717 222,146 217,514 4,632
Corporate Services & Pensions 484,238 43,317 89,828 -46,511 500,443 484,238 16,205
National Services 321,808 25,889 67,597 -41,709 291,314 321,808 -30,494
Fair Deal (Excluding subvention and contract beds) 816,143 66,122 76,970 -10,848 815,495 816,143 -648
Held Funding 0 0 0 0 0
Total HSE Budget 12,212,942 1,062,916 1,587,037 -524,121 12,152,985 12,212,942 -59,957
HSE Income 1,042,708
Accelerated Income 0
Gross Budget / Gross Expenditure 13,255,650
HSE NET EXPENDITURE
Current Month Year to Date
76

HSE Net Expenditure – Summary – by Regional Area/Statutory & Voluntary SystemCurrent Month Year to Date
Budget 2014 Actual Budget Variance Actual Budget Variance
€000s €000s €000s €000s €000s €000s €000s
Hospitals by Region
Dublin Mid Leinster 1,381,959 120,757 176,711 -55,953 1,383,121 1,381,959 1,163
Louth Meath Hospitals Group 198,448 17,793 33,395 -15,602 201,361 198,448 2,913
Dublin North East Hospitals 729,484 67,292 106,044 -38,752 728,349 729,484 -1,135
Dublin North East 927,932 85,085 139,439 -54,354 929,710 927,932 1,778
South 811,192 78,584 130,286 -51,702 813,174 811,192 1,982
West 924,579 79,907 154,867 -74,960 924,801 924,579 222
Total 4,045,662 364,333 601,302 -236,970 4,050,807 4,045,662 5,145
Community Services by Region
Dublin Mid Leinster 1,102,279 96,554 123,769 -27,216 1,105,420 1,102,279 3,141
Dublin North East 816,333 75,370 87,830 -12,460 826,308 816,333 9,975
South 886,403 63,959 88,483 -24,525 874,491 886,403 -11,912
West 942,549 86,111 91,109 -4,998 944,399 942,549 1,850
Total 3,747,564 321,994 391,191 -69,198 3,750,618 3,747,564 3,054
Grand total Hospital/Community 7,793,226 686,327 992,494 -306,167 7,801,425 7,793,226 8,199
Corporate Divisions 87,124 18,751 41,439 -22,688 52,891 87,124 -34,233
Primary Care Reimbursement Service 2,286,166 186,758 239,342 -52,584 2,286,532 2,286,166 366
Local Schemes 217,514 19,563 59,280 -39,717 222,146 217,514 4,632
Health & Wellbeing 206,723 16,189 20,087 -3,898 182,739 206,723 -23,984
Total 10,590,753 927,587 1,352,642 -425,054 10,545,733 10,590,753 -45,021
Statutory Services
Dublin Mid Leinster 1,092,620 94,403 130,543 -36,140 1,093,567 1,092,620 947
Dublin North East 1,035,003 96,102 138,113 -42,011 1,049,050 1,035,003 14,047
South 1,579,653 131,265 193,531 -62,265 1,568,835 1,579,653 -10,818
West 1,847,080 163,939 241,486 -77,547 1,849,250 1,847,080 2,170
Total 5,554,356 485,709 703,672 -217,964 5,560,702 5,554,356 6,346
Voluntary Services
Dublin Mid Leinster 1,391,618 122,908 169,937 -47,029 1,394,975 1,391,618 3,357
Dublin North East 709,262 64,353 89,155 -24,802 706,967 709,262 -2,294
South 117,943 11,277 25,239 -13,962 118,831 117,943 888
West 20,047 2,079 4,490 -2,411 19,950 20,047 -98
Total 2,238,870 200,618 288,821 -88,204 2,240,723 2,238,870 1,853
Grand Total Statutory/Voluntary Services 7,793,226 686,327 992,494 -306,167 7,801,425 7,793,226 8,199
HSE NET EXPENDITURE
77

Total Expenditure – Summary by Region within Cost CategoryYear to Date
Budget
€ '000 € '000 € '000 € '000
Pay (Regions Only)
Dublin Mid Leinster 1,998,521 1,951,107 47,414 1,951,107
Dublin North East 1,337,021 1,336,049 972 1,336,049
South 1,230,984 1,231,668 -684 1,231,668
West 1,289,341 1,277,554 11,787 1,277,554
Total Pay 5,855,867 5,796,378 59,489 5,796,378
Non-Pay (Regions Only)
Dublin Mid Leinster 1,014,108 1,042,277 -28,169 1,042,277
Dublin North East 736,066 733,072 2,994 733,072
South 759,375 757,660 1,715 757,660
West 852,284 858,161 -5,876 858,161
Total Non Pay 3,361,833 3,391,170 29,337- 3,391,170
Gross Expenditure 9,217,700 9,187,548 30,152 9,187,548
Income (Regions Only)
Dublin Mid Leinster -524,087 -509,147 -14,940 -509,147
Dublin North East -317,070 -324,856 7,786 -324,856
South -302,693 -291,732 -10,961 -291,732
West -272,426 -268,588 -3,838 -268,588
Total Income -1,416,275 -1,394,322 21,953- -1,394,322
Net Expenditure Regions 7,801,425 7,793,226 8,199 7,793,226
Annual
BudgetProgramme
Year to Date
Actual
Year to Date
Variance
78

Dublin Mid Leinster Area -Expenditure by Statutory/Voluntary Provider and LHO
Actual Budget Variance %
€'000s €'000s €'000s €'000s
Midland Regional Hospital, Mullingar 60,933 61,433 60,933 500 0.8%
Midland Regional Hospital, Tullamore 85,895 84,654 85,895 -1,241 -1.4%
Midland Regional Hospital, Portlaoise 53,482 52,984 53,482 -497 -0.9%
Naas General Hospital 55,530 55,477 55,530 -53 -0.1%
Midland Regional Acute Service 0 0 0 0 0.0%
Adelaide & Meath Hospital, Dublin (Acute Only) 164,208 165,094 164,208 886 0.5%
Adelaide & Meath Hospital, Dublin (Paediatric Only) 16,030 16,095 16,030 65 0.4%
Coombe Women & Infants University Hospital 48,886 48,868 48,886 -18 0.0%
Our Lady's Hospital for Sick Children, Crumlin 116,615 117,768 116,615 1,153 1.0%
St Vincent's University Hospital, Elm Park 208,108 208,559 208,108 451 0.2%
St. Michael's Hospital, Dun Laoghaire 24,344 24,384 24,344 40 0.2%
National Maternity Hospital, Holles Street 46,081 45,782 46,081 -299 -0.6%
St. Lukes Hospital 40,259 40,448 40,259 189 0.5%
Royal Victoria Eye & Ear Hospital, Dublin 23,246 23,237 23,246 -9 0.0%
St. James's Hospital 313,055 313,006 313,055 -49 0.0%
Temple Street, Childrens University Hospital 89,838 89,858 89,838 20 0.0%
St. Columcille's Hospital, Loughlinstown 33,892 34,181 33,892 290 0.9%
Dublin Mid Leinster Hospital Services 1,380,401 1,381,827 1,380,401 1,426 0.1%
LHO Wicklow 71,708 72,040 71,708 331 0.5%
LHO Kildare / West Wicklow 109,344 110,868 109,344 1,523 1.4%
LHO Laois / Offaly 89,751 98,328 89,751 8,577 9.6%
LHO Longford / Westmeath 99,432 99,369 99,432 -63 -0.1%
LHO Dublin South 36,660 37,036 36,660 376 1.0%
LHO Dublin South Central 103,103 86,036 103,103 -17,067 -16.6%
LHO Dublin South City 64,755 74,933 64,755 10,178 15.7%
LHO Dublin South West 38,398 34,825 38,398 -3,573 -9.3%
LHO Dublin West 122,232 117,228 122,232 -5,004 -4.1%
Central Mental Hospital 21,775 23,799 21,775 2,024
Cheeverstown House 21,750 21,770 21,750 20 0.1%
Dublin Dental School and Hospital 5,881 5,888 5,881 7 0.1%
Approved
Allocation
YTD
79

Dublin Mid Leinster Area -Expenditure by Statutory/Voluntary Provider and LHO
Actual Budget Variance %
€'000s €'000s €'000s €'000s
Approved
Allocation
YTD
Kare 15,457 15,443 15,457 -15 -0.1%
Leopardstown Park Hospital Board 4,910 5,240 4,910 330 6.7%
National Rehabilitation Hospital 25,977 25,986 25,977 9 0.0%
Our Lady's Hospital Harold's Cross 23,953 24,001 23,953 49 0.2%
Peaumont Hospital 21,524 21,489 21,524 -35 -0.2%
Sisters of Charity of Jesus and Mary 41,191 41,601 41,191 410 1.0%
St. John of God (Disability Services) 61,763 61,881 61,763 118 0.2%
St. John of God (Mental Health) 22,396 22,499 22,396 103 0.5%
Stewarts Hospital Services 42,346 42,359 42,346 13 0.0%
Sunbeam House Services 19,773 19,768 19,773 -5 0.0%
The Children's Sunshine Home 3,728 3,724 3,728 -3 -0.1%
The Royal Hospital Donnybrook 12,696 12,727 12,696 31 0.2%
East Coast Area Regional Service -389 65 -389 454 -116.8%
South Western Area Regional Services 3,716 5,907 3,716 2,191 59.0%
Dublin Mid Leinster Community Services 1,083,829 1,084,810 1,083,829 980 0.1%
Office of the RDO 20,007 21,905 20,007 1,897 9.5%
Office of the Regional Director 20,007 21,905 20,007 1,897 9.5%
Dublin Mid Leinster Region Total 2,484,237 2,488,542 2,484,237 4,304 0.2%
80

Dublin North East Area -Expenditure by Statutory/Voluntary Provider and Local Health Office
Actual Budget Variance %
€'000s €'000s €'000s €'000s
Our Lady of Lourdes Hospital, Drogheda 135,572 137,951 135,572 2,379 1.8%
Louth County Hospital 19,662 20,196 19,662 534 2.7%
Our Lady's Hospital, Navan 43,214 43,214 43,214 0 0.0%
Louth Meath Hospital Group 198,448 201,361 198,448 2,913 1.5%
Cavan General Hospital 78,841 79,955 78,841 1,114 1.4%
Monaghan General Hospital 7,890 8,087 7,890 197 2.5%
Mater Misericordiae University Hospital 226,521 226,435 226,521 -86 0.0%
Beaumont Hospital 250,060 247,854 250,060 -2,206 -0.9%
Rotunda Hospital 44,987 44,985 44,987 -2 0.0%
Cappagh National Orthopaedic Hospital 25,396 24,961 25,396 -435 -1.7%
Connolly Hospital, Blanchardstown 88,738 89,050 88,738 312 0.4%
Northern Area Regional Acute Services 7,052 7,022 7,052 -30 -0.4%
Dublin North East Hospital Services 729,484 728,349 729,484 -1,135 -0.2%
LHO Cavan Monaghan 81,572 81,866 81,572 294 0.4%
Central Remedial Clinic 13,663 13,645 13,663 -18 -0.1%
Incorporated Orthopaedic Hospital of Ireland 8,979 8,976 8,979 -3 0.0%
Daughters of Charity of St. Vincent de Paul 56,378 56,599 56,378 220 0.4%
St. Michael's House 69,626 69,694 69,626 68 0.1%
St. Vincent's Hospital Fairview 13,652 13,818 13,652 167 1.2%
LHO Louth 105,337 107,259 105,337 1,922 1.8%
LHO Meath 58,271 61,456 58,271 3,185 5.5%
Dublin North West 117,127 121,990 117,127 4,863 4.2%
Dublin North Central 121,054 121,302 121,054 248 0.2%
Dublin North 134,657 135,339 134,657 683 0.5%
Northern Area Regional Services 9,105 5,607 9,105 -3,498 -38.4%
North Eastern Regional Service 20,449 21,323 20,449 874 4.3%
Dublin North East Community Services 809,870 818,875 809,870 9,005 1.1%
Office of the RDO 6,463 7,432 6,463 970 15.0%
Office of the Regional Director 6,463 7,432 6,463 970 15.0%
Dublin North East Region Total 1,744,265 1,756,018 1,744,265 11,753 0.7%
Approved
Allocation
YTD
81

South Region Area - Expenditure by Statutory/Voluntary Provider and Local Health Office
Actual Budget Variance %
€'000s €'000s €'000s €'000s
Waterford Regional Hospital 149,253 149,407 149,253 155 0.1%
St. Luke's Hospital, Kilkenny 55,103 55,685 55,103 582 1.1%
Wexford General Hospital 52,874 54,282 52,874 1,408 2.7%
South Tipperary General Hospital 51,415 51,679 51,415 264 0.5%
Lourdes Kilcreene Orthopaedic Hospital 7,072 6,903 7,072 -169 -2.4%
South Eastern Acute Services 0 0 0 0 0.0%
South Eastern Acute Support 40 40 40 0 0.0%
Cork University Hospital 265,131 265,182 265,131 51 0.0%
Mallow General Hospital 17,536 16,781 17,536 -755 -4.3%
Kerry General Hospital 71,907 71,909 71,907 2 0.0%
Bantry General Hospital 17,020 17,020 17,020 0 0.0%
Mercy University Hospital, Cork 65,387 65,484 65,387 97 0.1%
South Infirmary - Victoria Hospital 50,870 51,212 50,870 343 0.7%
Southern Regional Acute Services 2,280 2,286 2,280 6 0.3%
South Hospital Services 805,887 807,869 805,887 1,982 0.2%
LHO Kerry 78,008 79,373 78,008 1,365 1.8%
LHO West Cork 199,911 204,959 199,911 5,048 2.5%
LHO North Cork 75,082 77,507 75,082 2,425 3.2%
LHO North Lee 70,451 71,798 70,451 1,347 1.9%
LHO South Lee 88,784 87,214 88,784 -1,569 -1.8%
LHO South Tipperary 70,144 69,752 70,144 -392 -0.6%
LHO Waterford 94,512 94,883 94,512 371 0.4%
LHO Wexford 76,732 77,738 76,732 1,006 1.3%
LHO Carlow / Kilkenny 116,315 116,743 116,315 428 0.4%
Cork University Dental Hospital 1,686 2,134 1,686 448 26.6%
South Eastern Regional Services 1,290 825 1,290 -465 -36.1%
Southern Regional Services 10,621 -11,000 10,621 -21,621 -203.6%
South Community Services 883,536 871,927 883,536 -11,609 -1.3%
Office of the RDO 8,173 7,869 8,173 -303 -3.7%
Office of the Regional Director 8,173 7,869 8,173 -303 -3.7%
South Region Total 1,697,596 1,687,666 1,697,596 -9,930 -0.6%
Approved
Allocation
YTD
82
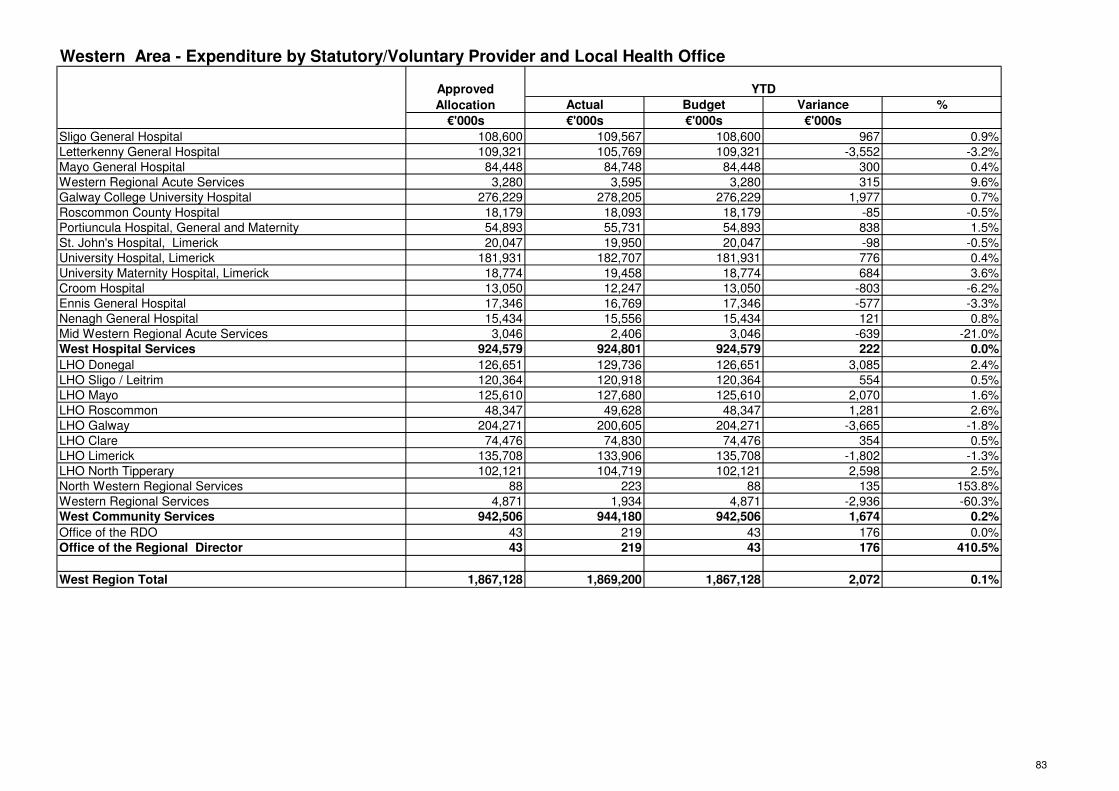
Western Area - Expenditure by Statutory/Voluntary Provider and Local Health Office
Actual Budget Variance %
€'000s €'000s €'000s €'000s
Sligo General Hospital 108,600 109,567 108,600 967 0.9%
Letterkenny General Hospital 109,321 105,769 109,321 -3,552 -3.2%
Mayo General Hospital 84,448 84,748 84,448 300 0.4%
Western Regional Acute Services 3,280 3,595 3,280 315 9.6%
Galway College University Hospital 276,229 278,205 276,229 1,977 0.7%
Roscommon County Hospital 18,179 18,093 18,179 -85 -0.5%
Portiuncula Hospital, General and Maternity 54,893 55,731 54,893 838 1.5%
St. John's Hospital, Limerick 20,047 19,950 20,047 -98 -0.5%
University Hospital, Limerick 181,931 182,707 181,931 776 0.4%
University Maternity Hospital, Limerick 18,774 19,458 18,774 684 3.6%
Croom Hospital 13,050 12,247 13,050 -803 -6.2%
Ennis General Hospital 17,346 16,769 17,346 -577 -3.3%
Nenagh General Hospital 15,434 15,556 15,434 121 0.8%
Mid Western Regional Acute Services 3,046 2,406 3,046 -639 -21.0%
West Hospital Services 924,579 924,801 924,579 222 0.0%
LHO Donegal 126,651 129,736 126,651 3,085 2.4%
LHO Sligo / Leitrim 120,364 120,918 120,364 554 0.5%
LHO Mayo 125,610 127,680 125,610 2,070 1.6%
LHO Roscommon 48,347 49,628 48,347 1,281 2.6%
LHO Galway 204,271 200,605 204,271 -3,665 -1.8%
LHO Clare 74,476 74,830 74,476 354 0.5%
LHO Limerick 135,708 133,906 135,708 -1,802 -1.3%
LHO North Tipperary 102,121 104,719 102,121 2,598 2.5%
North Western Regional Services 88 223 88 135 153.8%
Western Regional Services 4,871 1,934 4,871 -2,936 -60.3%
West Community Services 942,506 944,180 942,506 1,674 0.2%
Office of the RDO 43 219 43 176 0.0%
Office of the Regional Director 43 219 43 176 410.5%
West Region Total 1,867,128 1,869,200 1,867,128 2,072 0.1%
Approved
Allocation
YTD
83
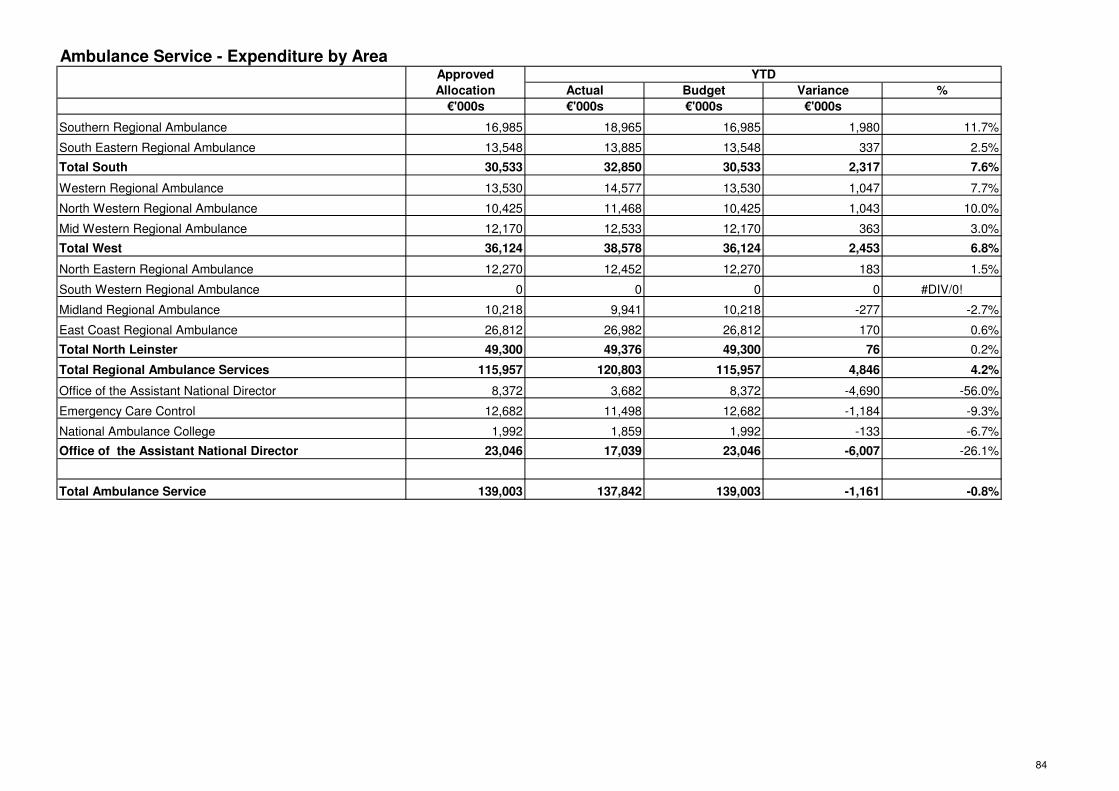
Ambulance Service - Expenditure by Area
Actual Budget Variance %
€'000s €'000s €'000s €'000s
Southern Regional Ambulance 16,985 18,965 16,985 1,980 11.7%
South Eastern Regional Ambulance 13,548 13,885 13,548 337 2.5%
Total South 30,533 32,850 30,533 2,317 7.6%
Western Regional Ambulance 13,530 14,577 13,530 1,047 7.7%
North Western Regional Ambulance 10,425 11,468 10,425 1,043 10.0%
Mid Western Regional Ambulance 12,170 12,533 12,170 363 3.0%
Total West 36,124 38,578 36,124 2,453 6.8%
North Eastern Regional Ambulance 12,270 12,452 12,270 183 1.5%
South Western Regional Ambulance 0 0 0 0 #DIV/0!
Midland Regional Ambulance 10,218 9,941 10,218 -277 -2.7%
East Coast Regional Ambulance 26,812 26,982 26,812 170 0.6%
Total North Leinster 49,300 49,376 49,300 76 0.2%
Total Regional Ambulance Services 115,957 120,803 115,957 4,846 4.2%
Office of the Assistant National Director 8,372 3,682 8,372 -4,690 -56.0%
Emergency Care Control 12,682 11,498 12,682 -1,184 -9.3%
National Ambulance College 1,992 1,859 1,992 -133 -6.7%
Office of the Assistant National Director 23,046 17,039 23,046 -6,007 -26.1%
Total Ambulance Service 139,003 137,842 139,003 -1,161 -0.8%
Approved
Allocation
YTD
84

Expenditure by Support Function
Actual Budget Variance
€'000s €'000s €'000s €'000s
Health Business Services 133,356 137,492 133,356 4,136
Statutory Pensions 424,122 431,378 424,122 7,256
Statutory Pension Levy -222,149 -211,755 -222,149 10,393
Finance 40,373 39,938 40,373 -435
Human Resources 53,963 54,555 53,963 592
Corporate Services 36,322 33,350 36,322 -2,972
Communications 11,574 10,650 11,574 -923
Audit 3,257 2,738 3,257 -519
Office of COO (PBI) 3,420 2,097 3,420 -1,323
Grand Total 484,238 500,443 484,238 16,205
Approved
Allocation
YTD
Note: National Shared Services comprises Estates, Procurement, ICT, Enterprise Resource Planning, Shared Services HR
and Shared Services Finance
85

Expenditure by Scheme
Actual Budget Variance %
€000s €000s €000s €000s
Medical Cards
GP Fees & Allowances 422,812 422,812 422,812 - 0.0%
GMS Pharmacy Fees 200,128 200,128 200,128 - 0.0%
GMS Pharmacy Drugs/ Medicines 771,327 771,319 771,327 8- 0.0%
Drug Target Refund 852 852 852 - 0.0%
EEA Pharmacy Claims 1,237 1,237 1,237 - 0.0%
High Tech Drugs/ Medicines 264,796 264,743 264,796 53- 0.0%
High Tech Patient Care Fees 17,077 17,077 17,077 - 0.0%
Administration of Schemes 11,849 11,849 11,849 - 0.0%
Technical services/HSE registered stationery 23,064 23,064 23,064 - 0.0%
Sub Total 1,713,142 1,713,081 1,713,142 -61 0.0%
Community Drugs Schemes
Drug Payment Scheme 65,971 65,971 65,971 - 0%
Long Term Illness Scheme 130,054 130,054 130,054 - 0%
High Tech 203,734 203,734 203,734 - 0%
Dental Treatment Services 75,000 70,939 75,000 4,061- -5%
Health Amendment Act 1,689 1,689 1,689 - 0%
Community Opthalmic Scheme 31,683 31,683 31,683 - 0%
Methadone Treatment 19,966 19,966 19,966 - 0%
Childhood Immunisation 7,785 7,785 7,785 - 0%
Doctors Fees/ Allowances 6,675 6,675 6,675 - 0%
Hardship Medicine 13,458 13,458 13,458 - 0%
OPAT 5,509 5,509 5,509 - 0%
Oncology Drugs/Medicines 11,500 8,074 11,500 3,426- -30%
HEP C Drugs & Medicines - 3,991 - 3,991 100%
ADHD - 3,923 - 3,923 100%
Sub Total 573,024 573,451 573,024 427 0.1%
Total PCRS 2,286,166 2,286,532 2,286,166 367 0.0%
Approved
Allocation
YTD
86

Net Expenditure – Summary by RegionCurrent Month
Budget
€ '000 € '000 € '000 € '000 € '000 € '000 € '000
173,070 227,540 -54,470 Pay 1,998,521 1,951,107 47,414 1,951,107
93,512 118,293 -24,781 Non-Pay 1,014,108 1,042,277 -28,169 1,042,277
266,582 345,833 -79,251 Gross 3,012,629 2,993,384 19,244 2,993,384
-49,271 -45,353 -3,918 Income -524,087 -509,147 -14,940 -509,147
217,311 300,480 -83,169 Total Dublin Mid Leinster Region 2,488,542 2,484,238 4,304 2,484,238
118,062 164,681 -46,619 Pay 1,337,021 1,336,049 972 1,336,049
70,089 92,595 -22,506 Non-Pay 736,066 733,072 2,994 733,072
188,151 257,276 -69,125 Gross 2,073,087 2,069,121 3,966 2,069,121
-27,696 -30,007 2,311 Income -317,070 -324,856 7,786 -324,856
160,455 227,269 -66,813 Total Dublin North East Region 1,756,018 1,744,265 11,753 1,744,265
109,214 148,056 -38,842 Pay 1,230,984 1,231,668 -684 1,231,668
60,297 72,110 -11,814 Non-Pay 759,375 757,660 1,715 757,660
169,510 220,167 -50,656 Gross 1,990,359 1,989,328 1,031 1,989,328
-26,968 -1,397 -25,571 Income -302,693 -291,732 -10,961 -291,732
142,542 218,769 -76,227 Total South Region 1,687,666 1,697,596 -9,930 1,697,596
112,677 146,399 -33,722 Pay 1,289,341 1,277,554 11,787 1,277,554
84,232 117,733 -33,501 Non-Pay 852,284 858,161 -5,876 858,161
196,909 264,131 -67,223 Gross 2,141,625 2,135,715 5,910 2,135,715
-30,891 -18,156 -12,736 Income -272,426 -268,588 -3,838 -268,588
166,018 245,976 -79,958 Total West Region 1,869,200 1,867,128 2,072 1,867,128
686,326 992,494 -306,167 Grand Total Regions 7,801,425 7,793,226 8,199 7,793,226
Year to Date
Budget
Year to Date
Variance
Annual
Budget
Current Month
Actual
Current Month
Variance Pillar / Cost Category Year to Date Actual
87

Net Expenditure – Summary OtherCurrent Month Year to Date
Budget Budget
€ '000 € '000 € '000 € '000 € '000 € '000 € '000
8,538 9,744 -1,206 Pay 101,249 104,497 -3,248 104,497
3,156 2,937 219 Non-Pay 36,944 34,825 2,119 34,825
11,694 12,681 -987 Gross 138,193 139,322 -1,129 139,322
-18 -27 9 Income -350 -319 -32 -319
11,676 12,654 -978 Total Ambulance 137,842 139,003 -1,161 139,003
978 605 373 Pay 12,416 12,454 -38 12,454
214,853 299,620 -84,767 Non-Pay 2,614,680 2,609,496 5,184 2,609,496
215,830 300,225 -84,394 Gross 2,627,097 2,621,950 5,146 2,621,950
-9,510 -1,603 -7,907 Income -118,419 -118,270 -149 -118,270
206,321 298,622 -92,301 Total Schemes 2,508,678 2,503,680 4,998 2,503,680
76,073 97,214 -21,141 Pay 853,105 848,063 5,042 848,063
117,324 221,692 -104,368 Non-Pay 1,248,447 1,343,404 -94,958 1,343,404
193,397 318,906 -125,509 Gross 2,101,551 2,191,467 -89,916 2,191,467
-34,805 -35,639 834 Income -396,512 -414,434 17,923 -414,434
158,592 283,267 -124,675 Total Other 1,705,040 1,777,033 -71,993 1,777,033
0 0 0 Held Funding 0 0 0 0
1,062,915 1,587,037 -524,121 Grand Total 12,152,985 12,212,942 -59,957 12,212,942
598,612 794,239 -195,627 Pay 6,822,637 6,761,392 61,245 6,761,392
643,462 924,979 -281,517 Non-Pay 7,261,904 7,378,895 -116,991 7,378,895
1,242,074 1,719,218 -477,144 Gross 14,084,541 14,140,287 -55,747 14,140,287
-179,158 -132,181 -46,977 Income -1,931,556 -1,927,345 -4,211 -1,927,345
1,062,915 1,587,037 -524,121 Total 12,152,985 12,212,942 -59,957 12,212,942
0 0 0 Held Funding 0 0 0
1,062,915 1,587,037 -524,121 Grand Total 12,152,985 12,212,942 -59,957 12,212,942
Year to Date
Variance
Annual
Budget
Current Month
Actual
Current Month
Variance Pillar / Cost Category Year to Date Actual
88

Income – Summary
Current Month
Budget
€ '000 € '000 € '000 € '000 € '000 € '000 € '000
(11,809) (8,872) (2,937) Superannuation Income (139,092) (141,352) 2,260 (141,352)
(380) (472) 92 Other Payroll Deductions (5,228) (5,315) 88 (5,315)
(52,917) (38,721) (14,196) Maintenance Charges (570,099) (535,748) (34,351) (535,748)
(1,544) (2,232) 687 In-Patient Charges (19,784) (37,570) 17,786 (37,570)
(1,448) (1,052) (396) Out-Patient Charges (14,211) (14,661) 450 (14,661)
(369) (87) (282) RTA (8,927) (8,992) 65 (8,992)
(1,165) (1,221) 55 Long Stay (12,287) (11,865) (422) (11,865)
(1,745) (5,225) 3,480 Other Patient Charge (13,617) (23,057) 9,439 (23,057)
(991) (540) (451) Agency/Services (8,069) (8,416) 347 (8,416)
(1,512) (1,130) (382) Canteen Receipts (14,352) (13,359) (993) (13,359)
(12,305) 10,646 (22,951) Other Income (80,576) (42,301) (38,275) (42,301)
0 0 0 ESF Grants 0 0 0 0
(216) (391) 175 Other Grants (2,569) (3,038) 468 (3,038)
-86,402 -49,296 -37,107 Total Hospital Income -888,813 -845,674 -43,139 -845,674
(3,892) (4,152) 260 Superannuation Income (45,655) (46,650) 995 (46,650)
(268) (140) (128) Other Payroll Deductions (3,022) (1,651) (1,371) (1,651)
(822) (423) (399) Maintenance Charges (6,236) (5,092) (1,144) (5,092)
(1,162) (137) (1,025) In-Patient Charges (11,693) (10,434) (1,259) (10,434)
(1) (3) 3 Out-Patient Charges (16) (39) 23 (39)
(183) (8) (174) RTA (1,568) (931) (637) (931)
(12,370) (11,680) (690) Long Stay (131,056) (138,846) 7,790 (138,846)
(432) (489) 58 Other Patient Charge (5,082) (5,053) (29) (5,053)
(335) (445) 109 Agency/Services (3,211) (4,786) 1,575 (4,786)
(364) (382) 18 Canteen Receipts (4,291) (4,624) 333 (4,624)
(36,789) (28,348) (8,441) Other Income (420,320) (435,493) 15,173 (435,493)
(14) (25) 11 ESF Grants (206) (300) 95 (300)
(1,305) (1,016) (288) Other Grants (13,330) (13,345) 16 (13,345)
-57,934 -47,247 -10,687 Total Community Income -645,685 -667,245 21,561 -667,245
Year to Date
Budget
Year to Date
Variance
Annual
Budget
Current Month
Actual
Current Month
Variance Pillar / Cost Category
Year to Date
Actual
89

Income – Summary
Current Month
Budget
€ '000 € '000 € '000 € '000 € '000 € '000 € '000
(29,334) (31,555) 2,221 Superannuation Income (359,049) (372,898) 13,848 (372,898)
(1,860) (2,506) 646 Other Payroll Deductions (22,805) (24,290) 1,485 (24,290)
0 17 (17) Maintenance Charges (0) 209 (209) 209
(95) 0 (95) In-Patient Charges (1,035) 0 (1,035) 0
0 (6) 6 Out-Patient Charges 0 (72) 72 (72)
0 0 0 RTA 0 0 0 0
0 0 0 Long Stay (3) 0 (3) 0
(15) 0 (15) Other Patient Charge (15) 0 (15) 0
(270) (295) 25 Agency/Services (3,689) (3,501) (188) (3,501)
(1) (6) 5 Canteen Receipts (6) (73) 67 (73)
(3,162) (1,287) (1,876) Other Income (9,878) (13,696) 3,817 (13,696)
(13) 0 (13) ESF Grants (153) 0 (153) 0
(70) (1) (70) Other Grants (424) (106) (318) (106)
-34,821 -35,638 817 Total Corporate -397,058 -414,426 17,368 -414,426
(45,035) (44,579) (456) Superannuation Income (543,796) (560,899) 17,103 (560,899)
(2,508) (3,118) 609 Other Payroll Deductions (31,054) (31,256) 202 (31,256)
(53,739) (39,127) (14,612) Maintenance Charges (576,336) (540,631) (35,705) (540,631)
(2,802) (2,369) (433) In-Patient Charges (32,512) (48,004) 15,492 (48,004)
(1,449) (1,062) (387) Out-Patient Charges (14,228) (14,772) 544 (14,772)
(552) (95) (457) RTA (10,495) (9,923) (572) (9,923)
(13,535) (12,900) (634) Long Stay (143,347) (150,712) 7,365 (150,712)
(2,192) (5,714) 3,522 Other Patient Charge (18,714) (28,109) 9,395 (28,109)
(1,596) (1,280) (316) Agency/Services (14,969) (16,703) 1,734 (16,703)
(1,877) (1,518) (359) Canteen Receipts (18,649) (18,056) (592) (18,056)
(52,256) (18,988) (33,268) Other Income (510,775) (491,490) (19,284) (491,490)
(27) (25) (2) ESF Grants (359) (300) (58) (300)
(1,591) (1,408) (183) Other Grants (16,323) (16,489) 166 (16,489)
-179,158 -132,181 -46,976 Summary All Income -1,931,556 -1,927,345 -4,210 -1,927,345
Year to Date
Budget
Year to Date
Variance
Annual
Budget
Current Month
Actual
Current Month
Variance Pillar / Cost Category
Year to Date
Actual
90

Actual Budget Variance %
€000 €000 €000 €000
Beaumont Hospital 250,060 247,854 250,060 -2,206 -0.88%
Our Lady's of Lourdes Hospital, Drogheda 135,572 137,951 135,572 2,379 1.75%
Connolly Hospital, Blanchardstown 88,738 89,050 88,738 312 0.35%
Cavan General Hospital 78,841 79,955 78,841 1,114 1.41%
Louth County Hospital 19,662 20,196 19,662 534 2.72%
Monaghan General Hospital 7,890 8,087 7,890 197 2.50%
Rotunda Hospital 44,987 44,985 44,987 -2 0.00%
RCSI Hospital Group Dublin-North East 625,749 628,077 625,749 2,328 0.37%
St. James's Hospital 313,055 313,006 313,055 -49 -0.02%
St. Lukes Hospital, Rathgar 40,259 40,448 40,259 189 0.47%
Tallaght Hospital - AMNCH (Acute Only) 164,208 165,094 164,208 886 0.54%
Midland Regional Hospital, Tullamore 85,895 84,654 85,895 -1,241 -1.45%
Naas General Hospital 55,530 55,477 55,530 -53 -0.10%
Midland Regional Hospital, Portlaoise 53,482 52,984 53,482 -497 -0.93%
Coombe Women & Infants University Hospital 48,886 48,868 48,886 -18 -0.04%
Dublin-Midlands Hospital Group 761,315 760,531 761,315 -784 -0.10%
Mater Misericordiae University Hospital 226,521 226,435 226,521 -86 -0.04%
St Vincent's University Hospital, Elm Park 208,108 208,559 208,108 451 0.22%
Midland Regional Hospital, Mullingar 60,933 61,433 60,933 500 0.82%
St. Luke's Hospital, Kilkenny 55,103 55,685 55,103 582 1.06%
Wexford General Hospital 52,874 54,282 52,874 1,408 2.66%
National Maternity Hospital, Holles Street 46,081 45,782 46,081 -299 -0.65%
Our Lady's Hospital, Navan 43,214 43,214 43,214 0 0.00%
St. Columcilles Hospital, Loughlinstown 33,892 34,181 33,892 290 0.85%
St. Michael's Hospital, Dun Laoghaire 24,344 24,384 24,344 40 0.16%
Cappagh National Orthopaedic Hospital 25,396 24,961 25,396 -435 -1.71%
Royal Victoria Eye & Ear Hospital, Dublin 23,246 23,237 23,246 -9 -0.04%
Dublin-East Hospital Group 799,711 802,153 799,711 2,442 0.31%
Cork University Hospital 265,131 265,182 265,131 51 0.02%
Waterford Regional Hospital 149,253 149,407 149,253 155 0.10%
Kerry General Hospital 71,907 71,909 71,907 2 0.00%
Mercy University Hospital, Cork 65,387 65,484 65,387 97 0.15%
South Tipperary General Hospital 51,415 51,679 51,415 264 0.51%
South Infirmary University Hospital, Cork 50,870 51,212 50,870 343 0.67%
Bantry General Hospital 17,020 17,020 17,020 0 0.00%
Mallow General Hospital 17,536 16,781 17,536 -755 -4.31%
Lourdes Orthopaedic Hospital, Kilcreene 7,072 6,903 7,072 -169 -2.40%
South-South West Hospital Group 695,590 695,577 695,590 -13 0.00%
Galway University Hospitals 276,229 278,205 276,229 1,977 0.72%
Sligo General Hospital 108,600 109,567 108,600 967 0.89%
Expenditure by Statutory / Voluntary Hospital by Hospital Group
Approved
Allocation
YTD
91

Actual Budget Variance %
€000 €000 €000 €000
Expenditure by Statutory / Voluntary Hospital by Hospital Group
Approved
Allocation
YTD
Letterkenny General Hospital 109,321 105,769 109,321 -3,552 -3.25%
Mayo General hospital 84,448 84,748 84,448 300 0.35%
Portiuncula Hospital General and Maternity 54,893 55,731 54,893 838 1.53%
Roscommon County Hospital 18,179 18,093 18,179 -85 -0.47%
Saolta University Health Care Group 651,669 652,113 651,669 444 0.07%
Limerick University Hospital 181,931 182,707 181,931 776 0.43%
Ennis Hospital 17,346 16,769 17,346 -577 -3.33%
Nenagh Hospital 15,434 15,556 15,434 121 0.79%
St. John's Hospital 20,047 19,950 20,047 -98 -0.49%
University Maternity Hospital, Limerick 18,774 19,458 18,774 684 3.64%
Croom Hospital 13,050 12,247 13,050 -803 -6.15%
Mid Western Regional Acute Services 3,046 2,406 3,046 -639 -20.99%
University of Limerick Hospital Group 269,629 269,092 269,629 -537 -0.20%
Temple Street, Children's University Hospital 89,838 89,858 89,838 20 0.02%
Our Lady's Hospital for Sick Children, Crumlin 116,615 117,768 116,615 1,153 0.99%
National Childrens Hospital, Tallaght 16,030 16,095 16,030 65 0.41%
The Children's Hospital Group 222,483 223,720 222,483 1,238 0.56%
Regional and National Services 24,113 21,221 24,113 -2,891 -11.99%
Total Hospital Groups 4,050,258 4,052,485 4,050,258 2,226 0.05%
92
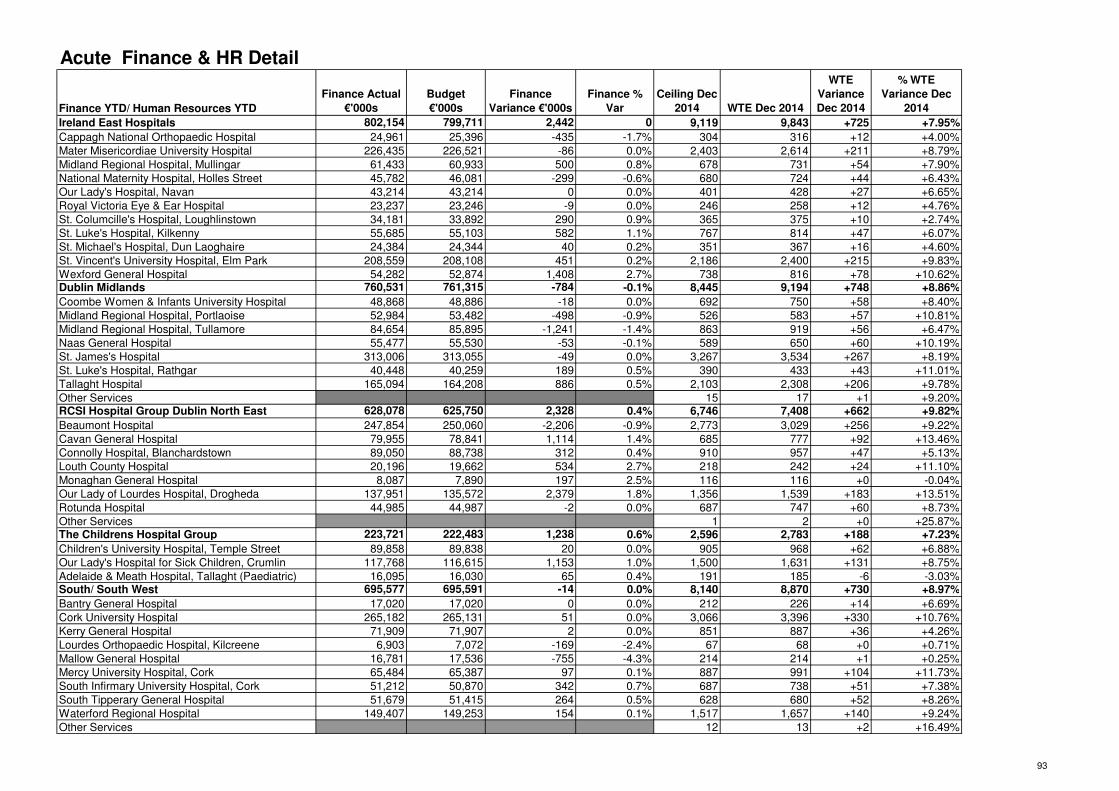
Acute Finance & HR Detail
Finance YTD/ Human Resources YTD
Finance Actual
€'000s
Budget
€'000s
Finance
Variance €'000s
Finance %
Var
Ceiling Dec
2014 WTE Dec 2014
WTE
Variance
Dec 2014
% WTE
Variance Dec
2014
Ireland East Hospitals 802,154 799,711 2,442 0 9,119 9,843 +725 +7.95%
Cappagh National Orthopaedic Hospital 24,961 25,396 -435 -1.7% 304 316 +12 +4.00%
Mater Misericordiae University Hospital 226,435 226,521 -86 0.0% 2,403 2,614 +211 +8.79%
Midland Regional Hospital, Mullingar 61,433 60,933 500 0.8% 678 731 +54 +7.90%
National Maternity Hospital, Holles Street 45,782 46,081 -299 -0.6% 680 724 +44 +6.43%
Our Lady's Hospital, Navan 43,214 43,214 0 0.0% 401 428 +27 +6.65%
Royal Victoria Eye & Ear Hospital 23,237 23,246 -9 0.0% 246 258 +12 +4.76%
St. Columcille's Hospital, Loughlinstown 34,181 33,892 290 0.9% 365 375 +10 +2.74%
St. Luke's Hospital, Kilkenny 55,685 55,103 582 1.1% 767 814 +47 +6.07%
St. Michael's Hospital, Dun Laoghaire 24,384 24,344 40 0.2% 351 367 +16 +4.60%
St. Vincent's University Hospital, Elm Park 208,559 208,108 451 0.2% 2,186 2,400 +215 +9.83%
Wexford General Hospital 54,282 52,874 1,408 2.7% 738 816 +78 +10.62%Dublin Midlands 760,531 761,315 -784 -0.1% 8,445 9,194 +748 +8.86%
Coombe Women & Infants University Hospital 48,868 48,886 -18 0.0% 692 750 +58 +8.40%
Midland Regional Hospital, Portlaoise 52,984 53,482 -498 -0.9% 526 583 +57 +10.81%
Midland Regional Hospital, Tullamore 84,654 85,895 -1,241 -1.4% 863 919 +56 +6.47%
Naas General Hospital 55,477 55,530 -53 -0.1% 589 650 +60 +10.19%
St. James's Hospital 313,006 313,055 -49 0.0% 3,267 3,534 +267 +8.19%
St. Luke's Hospital, Rathgar 40,448 40,259 189 0.5% 390 433 +43 +11.01%
Tallaght Hospital 165,094 164,208 886 0.5% 2,103 2,308 +206 +9.78%
Other Services 15 17 +1 +9.20%RCSI Hospital Group Dublin North East 628,078 625,750 2,328 0.4% 6,746 7,408 +662 +9.82%
Beaumont Hospital 247,854 250,060 -2,206 -0.9% 2,773 3,029 +256 +9.22%
Cavan General Hospital 79,955 78,841 1,114 1.4% 685 777 +92 +13.46%
Connolly Hospital, Blanchardstown 89,050 88,738 312 0.4% 910 957 +47 +5.13%
Louth County Hospital 20,196 19,662 534 2.7% 218 242 +24 +11.10%
Monaghan General Hospital 8,087 7,890 197 2.5% 116 116 +0 -0.04%
Our Lady of Lourdes Hospital, Drogheda 137,951 135,572 2,379 1.8% 1,356 1,539 +183 +13.51%
Rotunda Hospital 44,985 44,987 -2 0.0% 687 747 +60 +8.73%
Other Services 1 2 +0 +25.87%The Childrens Hospital Group 223,721 222,483 1,238 0.6% 2,596 2,783 +188 +7.23%
Children's University Hospital, Temple Street 89,858 89,838 20 0.0% 905 968 +62 +6.88%
Our Lady's Hospital for Sick Children, Crumlin 117,768 116,615 1,153 1.0% 1,500 1,631 +131 +8.75%
Adelaide & Meath Hospital, Tallaght (Paediatric) 16,095 16,030 65 0.4% 191 185 -6 -3.03%South/ South West 695,577 695,591 -14 0.0% 8,140 8,870 +730 +8.97%
Bantry General Hospital 17,020 17,020 0 0.0% 212 226 +14 +6.69%
Cork University Hospital 265,182 265,131 51 0.0% 3,066 3,396 +330 +10.76%
Kerry General Hospital 71,909 71,907 2 0.0% 851 887 +36 +4.26%
Lourdes Orthopaedic Hospital, Kilcreene 6,903 7,072 -169 -2.4% 67 68 +0 +0.71%
Mallow General Hospital 16,781 17,536 -755 -4.3% 214 214 +1 +0.25%
Mercy University Hospital, Cork 65,484 65,387 97 0.1% 887 991 +104 +11.73%
South Infirmary University Hospital, Cork 51,212 50,870 342 0.7% 687 738 +51 +7.38%
South Tipperary General Hospital 51,679 51,415 264 0.5% 628 680 +52 +8.26%
Waterford Regional Hospital 149,407 149,253 154 0.1% 1,517 1,657 +140 +9.24%
Other Services 12 13 +2 +16.49%
93
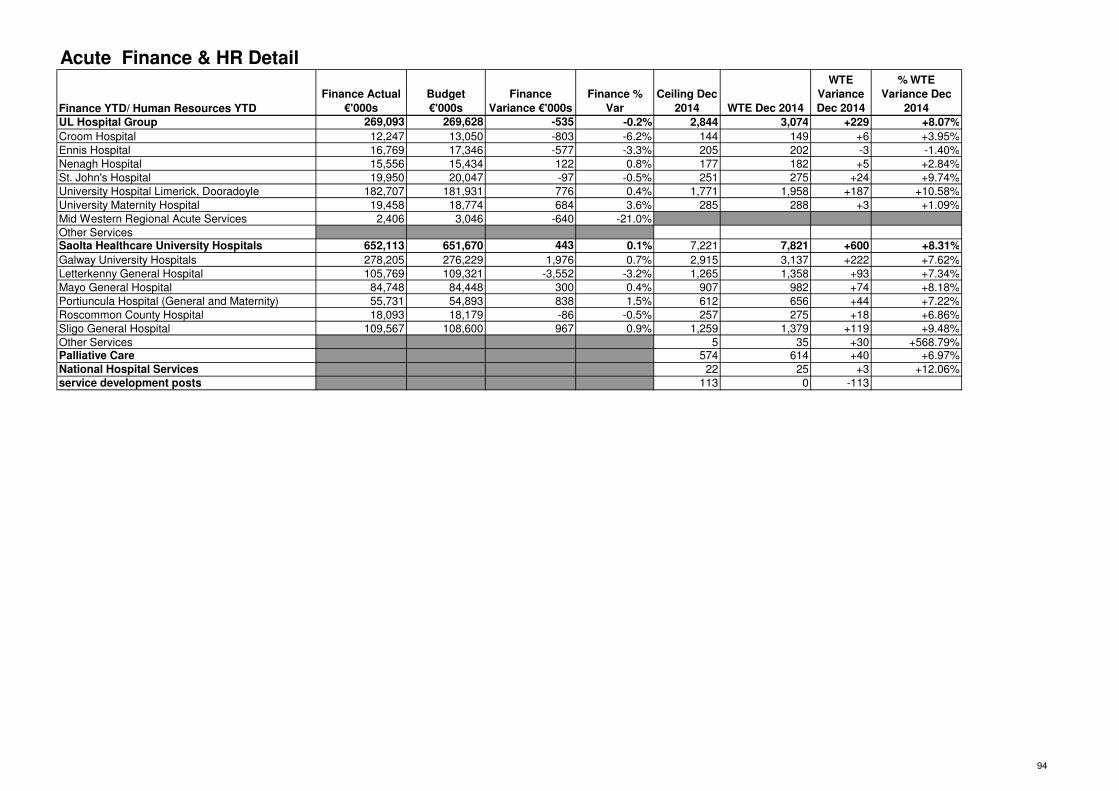
Acute Finance & HR Detail
Finance YTD/ Human Resources YTD
Finance Actual
€'000s
Budget
€'000s
Finance
Variance €'000s
Finance %
Var
Ceiling Dec
2014 WTE Dec 2014
WTE
Variance
Dec 2014
% WTE
Variance Dec
2014
UL Hospital Group 269,093 269,628 -535 -0.2% 2,844 3,074 +229 +8.07%
Croom Hospital 12,247 13,050 -803 -6.2% 144 149 +6 +3.95%
Ennis Hospital 16,769 17,346 -577 -3.3% 205 202 -3 -1.40%
Nenagh Hospital 15,556 15,434 122 0.8% 177 182 +5 +2.84%
St. John's Hospital 19,950 20,047 -97 -0.5% 251 275 +24 +9.74%
University Hospital Limerick, Dooradoyle 182,707 181,931 776 0.4% 1,771 1,958 +187 +10.58%
University Maternity Hospital 19,458 18,774 684 3.6% 285 288 +3 +1.09%
Mid Western Regional Acute Services 2,406 3,046 -640 -21.0%
Other ServicesSaolta Healthcare University Hospitals 652,113 651,670 443 0.1% 7,221 7,821 +600 +8.31%
Galway University Hospitals 278,205 276,229 1,976 0.7% 2,915 3,137 +222 +7.62%
Letterkenny General Hospital 105,769 109,321 -3,552 -3.2% 1,265 1,358 +93 +7.34%
Mayo General Hospital 84,748 84,448 300 0.4% 907 982 +74 +8.18%
Portiuncula Hospital (General and Maternity) 55,731 54,893 838 1.5% 612 656 +44 +7.22%
Roscommon County Hospital 18,093 18,179 -86 -0.5% 257 275 +18 +6.86%
Sligo General Hospital 109,567 108,600 967 0.9% 1,259 1,379 +119 +9.48%
Other Services 5 35 +30 +568.79%Palliative Care 574 614 +40 +6.97%
National Hospital Services 22 25 +3 +12.06%
service development posts 113 0 -113
94

Gross Debtor Days for Private Charges < 12 months Hospital Groups Category Income raised for Gross Debtors <12 Debtor Days at Debtor Days at Variance in Days
Beaumont Hospital Voluntary 34,415,717 19,807,805 180 210 -30
Our Lady of Lourdes Drogheda Statutory 15,521,715 5,454,591 192 128 64
Connolly Memorial Statutory 8,106,582 6,220,609 244 280 -36
Cavan / Monaghan Statutory 7,320,986 2,900,033 142 145 -3
Rotunda Hospital Voluntary 12,559,737 4,931,039 87 143 -56
Louth County Statutory 541,714 253,038 112 170 -59
Dublin North East Total 78,466,451 39,567,115 165 184 -19
St. James's Hospital Voluntary 43,285,170 20,768,543 117 175 -58
Adelaide & Meath Tallaght Voluntary 40,340,645 13,098,039 117 119 -2
Tullamore General Statutory 10,294,401 5,795,670 175 205 -30
Naas General Statutory 3,995,183 2,388,157 137 218 -81
Portlaoise General Statutory 5,713,520 2,858,834 109 183 -74
Coombe Womens Hospital Voluntary 13,098,651 4,818,299 94 134 -40 Dublin Midland Total 116,727,570 49,727,542 119 155 -37
Mater Misericordiae University Voluntary 25,100,976 9,518,580 98 138 -41
St. Vincent's Elm Park Voluntary 24,539,946 7,286,753 97 108 -11
Mullingar General Statutory 7,903,883 4,692,938 176 217 -41
St. Lukes Kilkenny Statutory 8,471,825 5,676,989 205 245 -40
Wexford General Statutory 7,915,972 3,777,620 154 174 -20
National Maternity Holles St. Voluntary 14,515,273 4,638,121 87 117 -30
Our Ladys Navan Statutory 2,269,922 1,070,577 144 172 -28
St Columcilles General Statutory 97,179 64,241 141 241 -101
St. Michael's Dun Laoghaire Voluntary 5,853,715 1,571,641 121 98 23
Cappagh National Orthopaedic Voluntary 1,721,702 541,941 95 115 -20
Royal Victoria Eye & Ear Hospital Voluntary 2,524,479 1,372,650 113 198 -86 Dublin East Total 100,914,871 40,212,051 119 145 -26
Cork University Statutory 55,233,941 23,702,010 122 157 -34
Waterford Regional Statutory 18,863,589 9,225,853 170 179 -9
Kerry General Statutory 9,810,512 5,563,360 168 207 -39
Mercy Voluntary 18,821,141 7,468,417 114 145 -31
St. Josephs Clonmel Statutory 6,884,636 4,003,956 181 212 -31
South Infirmary - Victoria Hospital Voluntary 9,759,259 4,615,271 133 173 -39
Bantry Statutory 767,340 409,553 83 195 -112
Mallow General Statutory 2,409,911 1,599,805 88 242 -154
Kilcreene Statutory 690,733 159,653 175 84 90South / South West Total 123,241,062 56,747,878 137 168 -31
Galway University Hospitals Statutory 37,562,958 22,677,284 183 220 -37
Sligo General Statutory 14,433,340 7,128,015 178 180 -3
Letterkenny General Statutory 6,919,121 2,766,955 147 146 1
Mayo General Statutory 7,580,085 5,230,405 187 252 -64
Portiuncula Acute Statutory 7,119,852 3,872,569 149 199 -50
Roscommon General Statutory 2,636,075 1,399,257 133 194 -61
West / North West Total 76,251,432 43,074,486 172 206 -34
University Hospital Limerick Statutory 32,514,952 17,914,627 184 201 -17
Ennis Hospital Statutory 1,833,563 1,245,297 189 248 -59
Nenagh Hospital Statutory 2,315,405 1,187,206 161 187 -26
St. John's Limerick Voluntary 5,014,729 2,545,543 138 185 -47
University Maternity Hospital Limerick Statutory 5,140,349 2,290,012 169 163 7
Croom Hospital Statutory 3,796,372 924,021 87 89 -2
UL Hospitals Group Total 50,615,369 26,106,706 165 188 -23
Our Lady's Hosp for Sick Children Crumlin Voluntary 15,712,135 8,099,600 124 188 -64
Children's University, Temple Street Voluntary 4,881,006 3,084,780 126 231 -105 Pardiatrics Total 4,881,006 3,084,780 126 231 -105
St. Lukes Hospital, Rathgar Statutory 2,760,628 1,259,972 150 167 -17
NCCP Total 2,760,628 1,259,972 150 167 -17
0 0 0
Grand Total 569,570,524 267,880,129 141 172 -31

2014 Approved
Allocation €000Actual Jan-Dec 2014 Profile Jan-Dec 2014 Variance Jan-Dec 2014
€'000 €'000 €'000 €'000
D1/D2 Building Equipping and Furnishing of Health
Facilities 326,159 326,186 326,159 -27
D3 Information Systems and Related Services for
Health Agencies40,000 39,816 40,000 184
D4 Mental Health and other Health Facilities Funded
from the Sale of Surplus Assets8,000 5,453 8,000 2,547
B15 Children and Families0 0 0 0
A in A (Sales of Surplus Assets)-8,000 -8,184 -8,000 184
Net Capital366,159 363,271 366,159 2,888
Capital Vote 2014
96

9797

9898

Variance from current and target employment
levelsYear-end ceiling Ceiling Dec 2014 WTE Dec 2014
WTE Variance
Dec 2014
WTE Variance
against Year-end
ceiling
% WTE Variance
Dec 2014
% WTE
Variance
against Year-
end ceiling
Total Health Service Employment 94,209 94,209 97,791 +3,582 +3,582 +3.8% +3.8%
Division WTE Nov 2014 Ceiling Dec 2014 WTE Dec 2014 WTE Change
since Nov 2014
WTE Change
from Dec 2013 to
Dec 2014
WTE Variance
Dec 2014
% WTE
Variance Dec
2014
Acute Services 49,478 45,819 49,631 +153 +1,361 +3,812 +8.3%
Mental Health 8,953 9,539 8,967 +14 +51 -572 -6.0%
Primary Care 9,452 9,388 9,485 +33 +69 +97 +1.0%
Social Care 24,232 24,068 24,252 +20 -139 +184 +0.8%
Health & Wellbeing 1,237 1,219 1,233 -4 -33 +14 +1.2%
Ambulance Services 1,626 1,633 1,623 -2 +8 -10 -0.6%
Corporate & HBS 2,596 2,543 2,599 +4 -19 +56 +2.2%
Total 97,574 94,209 97,791 +217 +1,297 +3,582 +3.8%
Staff Category WTE & change since year-end &
previous month to November 2014
WTE Dec 2013 WTE Nov 2014 WTE Dec 2014 WTE change
since Dec 2013
% change since
Dec 2013
WTE change
since Nov 2014
% change
since Nov 2014
Medical/ Dental 8,353 8,789 8,817 +464 +5.56% +28 +0.32%
Nursing 33,735 34,131 34,211 +477 +1.41% +81 +0.24%
Health & Social Care Professionals 13,132 13,587 13,640 +507 +3.86% +52 +0.39%
Management/ Admin 15,038 15,082 15,112 +74 +0.49% +30 +0.20%
General Support Staff 9,648 9,314 9,303 -345 -3.58% -11 -0.11%
Other Patient & Client Care 16,587 16,670 16,708 +120 +0.72% +37 +0.22%
Total Health Service Staffing 96,494 97,574 97,791 +1,297 +1.34% +217 +0.22%
Human Resources Overview
99

Staff Category WTE & change since year-end &
previous month to November 2014WTE Dec 2013 WTE Nov 2014 WTE Dec 2014
WTE change
since Dec 2013
% change since
Dec 2013
WTE change
since Nov 2014
% change
since Nov 2014
Medical/ Dental 8,353 8,789 8,817 +464 +5.56% +28 +0.32%
Nursing 33,735 34,131 34,211 +477 +1.41% +81 +0.24%
Health & Social Care Professionals 13,132 13,587 13,640 +507 +3.86% +52 +0.39%
Management/ Admin 15,038 15,082 15,112 +74 +0.49% +30 +0.20%
General Support Staff 9,648 9,314 9,303 -345 -3.58% -11 -0.11%
Other Patient & Client Care 16,587 16,670 16,708 +120 +0.72% +37 +0.22%
Consultants 2,555 2,629 2,635 +79 +3.10% +5 +0.20%
NCHDs 4,919 5,290 5,304 +385 +7.83% +14 +0.27%
Psychologists & Counsellors 921 1,001 1,007 +86 +9.31% +6 +0.64%Social Workers 944 972 969 +25 +2.60% -3 -0.31%
Therapists (Physio, OT, S&L) 3,594 3,749 3,764 +170 +4.72% +16 +0.42%
100

Division Ceiling Dec 2014 WTE Dec 2014 WTE Variance Dec
2014
% WTE Variance
Dec 2014
Acute Services 45,819 49,631 +3,812 +8.32%
Mental Health 9,539 8,967 -572 -6.00%
Primary Care 9,388 9,485 +97 +1.03%
Social Care 24,068 24,252 +184 +0.77%
Health & Wellbeing 1,219 1,233 +14 +1.18%
Ambulance Services 1,633 1,623 -10 -0.60%
Corporate & HBS 2,543 2,599 +56 +2.22%
Hospital Groups Ceiling Dec 2014 WTE Dec 2014 WTE Variance Dec
2014
% WTE Variance
Dec 2014
Dublin Midlands Hospitals 8,445 9,194 +748 +0.38%
The Children's Hospital Group 2,596 2,783 +188 -0.14%
Ireland East Hospitals 9,119 9,843 +725 +0.21%
RCSI Hospitals 6,746 7,408 +662 +0.22%
Saolta Healthcare University Hospitals 7,221 7,821 +600 +0.26%
South/ South West Hospitals 8,140 8,870 +730 +0.53%
University of Limerick Hospitals 2,844 3,074 +229 +0.65%
Palliative Care Hospitals 574 614 +40 -0.17%
National Services 22 25 +3 -3.43%
Service Delivery Overview - Human ResourcesHuman Resources
101
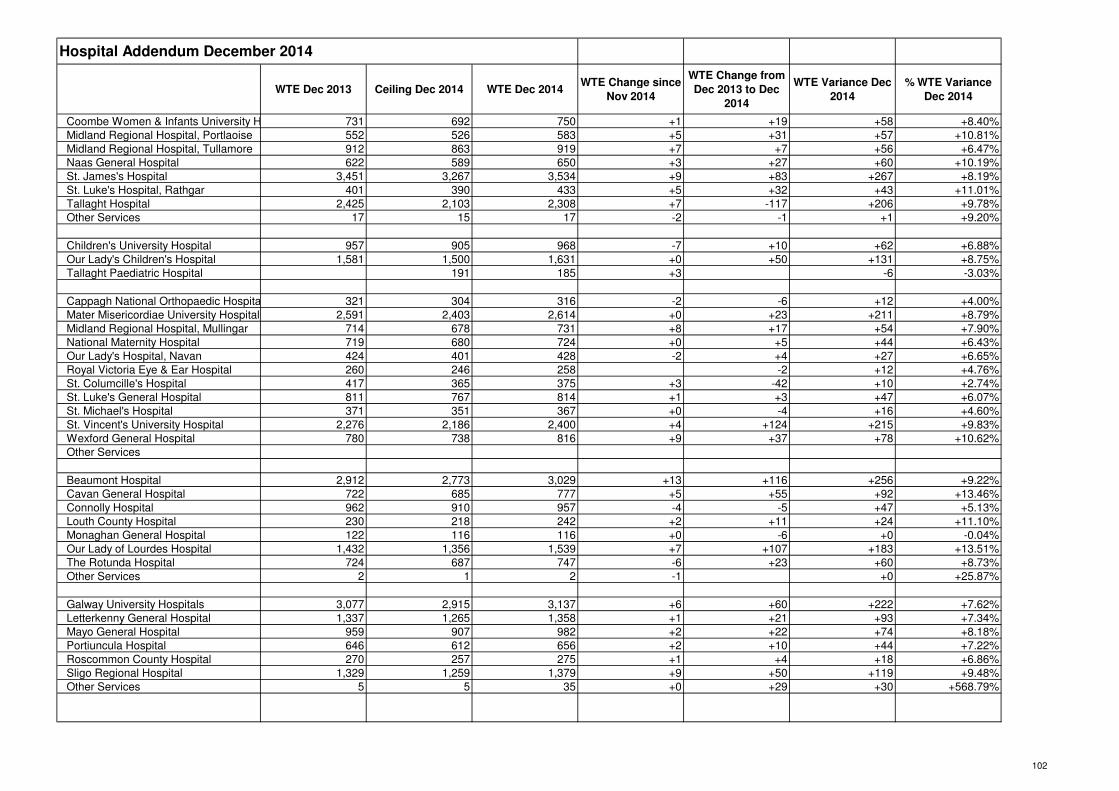
WTE Dec 2013 Ceiling Dec 2014 WTE Dec 2014WTE Change since
Nov 2014
WTE Change from
Dec 2013 to Dec
2014
WTE Variance Dec
2014
% WTE Variance
Dec 2014
Coombe Women & Infants University Hospital 731 692 750 +1 +19 +58 +8.40%
Midland Regional Hospital, Portlaoise 552 526 583 +5 +31 +57 +10.81%
Midland Regional Hospital, Tullamore 912 863 919 +7 +7 +56 +6.47%
Naas General Hospital 622 589 650 +3 +27 +60 +10.19%
St. James's Hospital 3,451 3,267 3,534 +9 +83 +267 +8.19%
St. Luke's Hospital, Rathgar 401 390 433 +5 +32 +43 +11.01%
Tallaght Hospital 2,425 2,103 2,308 +7 -117 +206 +9.78%
Other Services 17 15 17 -2 -1 +1 +9.20%
Dublin Midlands Hospitals 9,112 8,445 9,194 +35 +82 +748 +8.86%
Children's University Hospital 957 905 968 -7 +10 +62 +6.88%
Our Lady's Children's Hospital 1,581 1,500 1,631 +0 +50 +131 +8.75%
Tallaght Paediatric Hospital 191 185 +3 +185 -6 -3.03%
Children's Hospitals 2,539 2,596 2,783 -4 +245 +188 +7.23%
Cappagh National Orthopaedic Hospital 321 304 316 -2 -6 +12 +4.00%
Mater Misericordiae University Hospital 2,591 2,403 2,614 +0 +23 +211 +8.79%
Midland Regional Hospital, Mullingar 714 678 731 +8 +17 +54 +7.90%
National Maternity Hospital 719 680 724 +0 +5 +44 +6.43%
Our Lady's Hospital, Navan 424 401 428 -2 +4 +27 +6.65%
Royal Victoria Eye & Ear Hospital 260 246 258 -2 +12 +4.76%
St. Columcille's Hospital 417 365 375 +3 -42 +10 +2.74%
St. Luke's General Hospital 811 767 814 +1 +3 +47 +6.07%
St. Michael's Hospital 371 351 367 +0 -4 +16 +4.60%
St. Vincent's University Hospital 2,276 2,186 2,400 +4 +124 +215 +9.83%
Wexford General Hospital 780 738 816 +9 +37 +78 +10.62%
Other Services
Ireland East Hospitals 9,684 9,119 9,843 +20 +159 +725 +7.95%
Beaumont Hospital 2,912 2,773 3,029 +13 +116 +256 +9.22%
Cavan General Hospital 722 685 777 +5 +55 +92 +13.46%
Connolly Hospital 962 910 957 -4 -5 +47 +5.13%
Louth County Hospital 230 218 242 +2 +11 +24 +11.10%
Monaghan General Hospital 122 116 116 +0 -6 +0 -0.04%
Our Lady of Lourdes Hospital 1,432 1,356 1,539 +7 +107 +183 +13.51%
The Rotunda Hospital 724 687 747 -6 +23 +60 +8.73%
Other Services 2 1 2 -1 +0 +25.87%
RCSI Hospitals 7,106 6,746 7,408 +16 +302 +662 +9.82%
Galway University Hospitals 3,077 2,915 3,137 +6 +60 +222 +7.62%
Letterkenny General Hospital 1,337 1,265 1,358 +1 +21 +93 +7.34%
Mayo General Hospital 959 907 982 +2 +22 +74 +8.18%
Portiuncula Hospital 646 612 656 +2 +10 +44 +7.22%
Roscommon County Hospital 270 257 275 +1 +4 +18 +6.86%
Sligo Regional Hospital 1,329 1,259 1,379 +9 +50 +119 +9.48%
Other Services 5 5 35 +0 +29 +30 +568.79%
Saolta Healthcare University
Hospitals 7,624 7,221 7,821 +20 +197 +600 +8.31%
Hospital Addendum December 2014
102

WTE Dec 2013 Ceiling Dec 2014 WTE Dec 2014WTE Change since
Nov 2014
WTE Change from
Dec 2013 to Dec
2014
WTE Variance Dec
2014
% WTE Variance
Dec 2014
Hospital Addendum December 2014
Bantry General Hospital 224 212 226 +3 +2 +14 +6.69%
Cork University Hospital 3,270 3,066 3,396 +10 +127 +330 +10.76%
Kerry General Hospital 899 851 887 +4 -13 +36 +4.26%
Lourdes Orthopaedic Hospital 71 67 68 +1 -3 +0 +0.71%
Mallow General Hospital 226 214 214 +2 -12 +1 +0.25%
Mercy University Hospital 937 887 991 +53 +104 +11.73%
South Infirmary-Victoria University Hospital 695 687 738 +6 +43 +51 +7.38%
South Tipperary General Hospital 664 628 680 -2 +16 +52 +8.26%
University Hospital Waterford 1,601 1,517 1,657 +24 +56 +140 +9.24%
Other Services 12 12 13 -1 +1 +2 +16.49%
South/ South West Hospitals 8,600 8,140 8,870 +47 +270 +730 +8.97%
Croom Hospital 152 144 149 +1 -2 +6 +3.95%
Ennis Hospital 217 205 202 +0 -15 -3 -1.40%
Nenagh Hospital 187 177 182 +1 -5 +5 +2.84%
St. John's Hospital 265 251 275 +3 +10 +24 +9.74%
University Maternity Hospital 301 285 288 +0 -13 +3 +1.09%
University Hospital Limerick, Dooradoyle 1,839 1,771 1,958 +12 +119 +187 +10.58%
Other Services 13 12 19 +3 +6 +7 +55.97%
University of Limerick Hospitals 2,974 2,844 3,074 +20 +100 +229 +8.07%
Palliative Care Hospitals 610 574 614 -1 +4 +40 +6.97%
National Services Hospitals 22 22 25 -1 +3 +3 +12.06%
service development posts 113 -113
Total Acute Hospital Services 48,270 45,819 49,631 +153 +1,361 +3,812 +8.32%
103

Health Service Absence Rates by HSE Area (November 2014)
AgencyMedical
/DentalNursing
Health &
Social Care
Professionals
Management
Admin
General
Support Staff
Other Patient
& Client CareTotal Certified
Corporate & HBS [National] 0.00 % 3.01 % 2.22 % 5.07 % 12.27 % 0.00 % 8.41 % 89.48 %
Ennis Hospital 0.00% 6.16% 6.94% 14.49% 15.28% 7.93% 8.14% 99.2%
Incorporated Orthopaedic Hospital 0.00 % 7.98 % 6.21 % 0.00 % 5.69 % 11.07 % 7.69 % 92.69 %
NAS South 22.41% 2.03% 7.27% 7.11% 93.2%
Muiriosa Foundation, Laois/Offaly 0.00% 5.75% 7.61% 10.09% 0.00% 6.19% 6.82% 90.6%
Cheeverstown House 0.84% 5.95% 3.55% 0.69% 10.78% 8.27% 6.59% 90.5%
ISA Cavan/Monaghan 0.78 % 7.59 % 3.94 % 5.07 % 5.69 % 7.64 % 6.55 % 93.85 %
Nenagh Hospital 11.82 % 5.33 % 0.91 % 1.02 % 9.76 % 13.28 % 6.48 % 99.60 %
Croom Hospital 0.00% 5.08% 0.00% 7.22% 0.61% 10.13% 5.86% 99.70%
University Maternity Hospital 3.25 % 6.26 % 0.00 % 4.73 % 6.10 % 4.20 % 5.68 % 99.30 %
ISA Donegal 3.61% 5.85% 4.00% 5.31% 5.33% 6.05% 5.56% 91.5%
St. Patrick's, Kilkenny 0.00% 6.32% 2.38% 0.00% 8.77% 5.34% 5.55% 80.4%
Cavan General Hospital 0.55% 8.23% 1.68% 3.02% 3.69% 7.53% 5.48% 88.5%
ISA Louth/ Meath 1.81% 5.64% 3.93% 5.24% 3.02% 6.83% 5.43% 90.03%
University of Limerick HG 0.69% 4.99% 4.82% 7.15% 7.61% 8.09% 5.42% 99.0%
Bros. of Charity, Limerick 0.00% 3.26% 8.53% 7.71% 11.73% 4.43% 5.41% 99.8%
Central Remedial Clinic 0.00% 6.83% 5.20% 7.79% 0.32% 4.48% 5.35% 83.4%
ISA PCRS 0.00% 5.22% 0.00% 5.22% 82.07%
Bros. of Charity, Roscommon 0.00% 1.09% 8.55% 1.39% 3.83% 5.12% 5.22% 92.6%
University Hospital Limerick, Dooradoyle 0.27 % 4.75 % 5.23 % 7.67 % 7.08 % 8.35 % 5.20 % 99.30 %
Our Lady of Lourdes Hospital 0.65% 7.05% 3.71% 6.59% 6.67% 13.80% 5.16% 85.2%
ISA Sligo-Leitrim/West Cavan 0.32 % 5.24 % 1.99 % 5.54 % 4.80 % 5.37 % 5.14 % 93.89 %
ISA Dublin South West/Kildare 1.18% 5.23% 2.74% 6.29% 6.02% 5.97% 5.12% 90.82%
ISA Mid West 1.28% 5.08% 4.15% 4.75% 6.43% 5.68% 5.05% 98.5%
Muiriosa Foundation, South Kildare 0.00% 4.09% 5.05% 1.82% 2.86% 6.91% 4.99% 90.1%
Louth County Hospital 0.00% 8.23% 3.29% 4.91% 4.27% 2.60% 4.93% 93.3%
104

Health Service Absence Rates by HSE Area (November 2014)
AgencyMedical
/DentalNursing
Health &
Social Care
Professionals
Management
Admin
General
Support Staff
Other Patient
& Client CareTotal Certified
Stewart's Hospital, (Palmerstown) 1.87% 3.81% 6.11% 6.85% 5.91% 4.88% 4.93% 90.7%
ISA Midlands 2.56 % 5.29 % 4.13 % 4.60 % 2.91 % 5.58 % 4.83 % 89.43 %
Midland Regional Hospital, Tullamore 1.27% 4.82% 4.83% 4.47% 3.53% 7.12% 4.75% 86.2%
Daughters of Charity, Limerick 0.00% 2.58% 3.49% 6.95% 8.84% 7.26% 4.72% 95.1%
Daughters of Charity, Roscrea 0.00 % 5.63 % 7.43 % 0.77 % 0.00 % 4.69 % 4.72 % 95.68 %
Midland Regional Hospital, Portlaoise 0.34% 5.84% 2.15% 5.79% 3.46% 5.36% 4.69% 89.6%
NAS West 2.14% 25.00% 4.74% 4.67% 82.1%
Naas General Hospital 1.22 % 4.54 % 1.79 % 2.02 % 1.13 % 11.40 % 4.66 % 87.70 %
St. John of God, Drumcar 0.00% 3.98% 7.37% 7.70% 4.39% 4.18% 4.62% 92.14%
South Tipperary General Hospital 1.31 % 6.42 % 3.69 % 2.62 % 3.38 % 9.93 % 4.61 % 88.00 %
Peamount Hospital (Newcastle) 1.60% 7.52% 1.23% 5.00% 4.83% 3.47% 4.60% 89.18%
Lourdes Orthopaedic Hospital 0.56% 7.75% 0.00% 0.00% 1.33% 0.00% 4.56% 88.4%
St. Luke's General Hospital 1.72 % 5.02 % 4.94 % 4.74 % 3.85 % 11.95 % 4.53 % 89.20 %
Portiuncula Hospital 0.57% 5.67% 1.02% 4.61% 5.81% 5.06% 4.44% 78.10%
NAS North Leinster 0.17% 4.61% 4.43% 85.8%
ISA Dublin South Central 4.15% 4.12% 3.36% 5.03% 4.74% 4.93% 4.37% 86.3%
Mallow General Hospital 0.00% 4.83% 0.51% 6.56% 5.07% 5.07% 4.33% 93.9%
Connolly Hospital 1.22% 4.06% 2.66% 7.25% 5.16% 3.38% 4.32% 94.2%
Cope Foundation 0.00 % 5.63 % 5.13 % 5.24 % 2.90 % 4.60 % 4.32 % 100.00 %
Corporate & HBS [Dublin North-East] 0.00% 5.45% 0.00% 3.59% 5.68% 0.00% 4.31% 95.9%
Sligo Regional Hospital 0.28 % 5.40 % 1.31 % 3.26 % 6.94 % 5.97 % 4.29 % 99.10 %
Our Lady's Children's Hospital 1.88 % 4.69 % 3.16 % 4.63 % 6.42 % 5.31 % 4.28 % 85.30 %
University Hospital Waterford 0.08% 5.48% 3.36% 4.75% 4.67% 8.61% 4.26% 88.1%
ISA Waterford/ Wexford 0.33% 5.59% 2.68% 4.41% 2.42% 4.28% 4.23% 89.66%
RCSI HG 0.75% 5.13% 3.18% 5.22% 4.47% 6.17% 4.17% 88.50%
Letterkenny General Hospital 0.48% 3.67% 2.82% 5.28% 4.33% 2.83% 4.15% 99.3%
105

Health Service Absence Rates by HSE Area (November 2014)
AgencyMedical
/DentalNursing
Health &
Social Care
Professionals
Management
Admin
General
Support Staff
Other Patient
& Client CareTotal Certified
ISA Mayo 3.00 % 5.43 % 4.19 % 1.80 % 1.67 % 3.67 % 4.14 % 93.10 %
Midland Regional Hospital, Mullingar 2.32 % 4.82 % 0.98 % 2.51 % 1.54 % 8.09 % 4.10 % 84.70 %
ISA Carlow/ Kilkenny/ South Tipperary 4.95 % 4.26 % 2.97 % 3.62 % 4.03 % 4.56 % 4.08 % 87.18 %
Mercy University Hospital 0.00 % 6.95 % 0.00 % 2.43 % 4.90 % 5.49 % 4.08 % 88.60 %
ISA Dublin City North 2.66 % 3.81 % 3.36 % 3.89 % 3.55 % 5.83 % 4.06 % 90.16 %
Bros. of Charity, Galway 0.00 % 4.71 % 5.23 % 1.50 % 0.72 % 4.11 % 4.06 % 93.05 %
ISA Dublin North 1.91% 3.34% 1.25% 4.67% 5.66% 6.28% 3.99% 89.34%
Our Lady's Hospital, Navan 0.42% 3.32% 8.06% 3.06% 7.03% 5.64% 3.96% 91.30%
South/ South West HG 0.60% 5.14% 2.53% 3.89% 4.55% 5.27% 3.96% 86.0%
Monaghan General Hospital 0.00% 2.76% 3.28% 5.87% 0.00% 6.82% 3.85% 88.1%
Saolta Healthcare Group HG 0.48% 4.26% 2.91% 3.91% 5.00% 5.68% 3.84% 89.3%
South Infirmary-Victoria University Hospital 0.00% 3.59% 3.25% 3.85% 8.21% 1.33% 3.81% 89.50%
Cork University Hospital 1.13% 4.67% 2.48% 4.34% 4.44% 4.84% 3.80% 83.5%
ISA Cork 2.75 % 4.42 % 2.92 % 2.95 % 3.42 % 4.22 % 3.77 % 92.27 %
Sunbeam House Services 0.00 % 2.79 % 3.39 % 3.64 % 2.44 % 4.63 % 3.77 % 78.26 %
Daughters of Charity, Dublin 0.00 % 3.47 % 3.47 % 3.62 % 4.17 % 3.63 % 3.76 % 84.53 %
ISA Galway/Roscommon 0.70% 4.35% 4.48% 4.30% 1.42% 3.61% 3.75% 93.4%
Bros. of Charity, Southern 0.00% 7.60% 2.75% 4.43% 3.16% 3.24% 3.72% 90.3%
St. John's Hospital 0.00% 3.01% 0.70% 4.92% 9.20% 0.27% 3.70% 94.5%
Children's Hospital Group HG 1.49% 3.79% 4.14% 3.87% 4.74% 4.47% 3.66% 86.7%
Wexford General Hospital 0.20% 4.09% 0.33% 5.05% 4.18% 6.11% 3.63% 86.70%
The Rotunda Hospital 1.15% 4.95% 2.19% 3.24% 3.21% 1.58% 3.61% 89.60%
Kerry General Hospital 0.09 % 4.88 % 3.41 % 3.01 % 3.42 % 3.42 % 3.58 % 81.60 %
Galway University Hospitals 0.44% 4.32% 3.40% 3.51% 3.38% 7.17% 3.56% 84.00%
Kare, Newbridge, Co Kildare 0.00% 2.69% 4.86% 11.41% 0.48% 2.04% 3.54% 87.6%
Tallaght Hospital 1.18% 3.79% 4.58% 3.72% 3.65% 3.87% 3.50% 86.5%
106

Health Service Absence Rates by HSE Area (November 2014)
AgencyMedical
/DentalNursing
Health &
Social Care
Professionals
Management
Admin
General
Support Staff
Other Patient
& Client CareTotal Certified
Roscommon County Hospital 0.67 % 1.28 % 2.46 % 3.28 % 6.53 % 19.01 % 3.45 % 78.30 %
Mayo General Hospital 0.82% 3.16% 4.70% 3.84% 5.92% 5.09% 3.41% 86.1%
Cork Dental Hospital 4.47% 0.00% 1.71% 3.26% 7.73% 2.64% 3.41% 87.0%
St. Vincent's University Hospital 0.01% 3.44% 3.53% 5.01% 4.90% 4.34% 3.38% 87.5%
Ireland East HG 0.97% 3.42% 3.14% 3.99% 4.31% 5.34% 3.38% 87.6%
Beaumont Hospital 0.64% 3.25% 3.56% 5.06% 4.08% 4.67% 3.36% 87.90%
Corporate & HBS [Dublin Mid-Leinster] 1.35 % 0.00 % 2.39 % 2.75 % 13.65 % 3.35 % 89.01 %
Bantry General Hospital 0.00 % 4.00 % 2.37 % 4.57 % 1.66 % 3.56 % 3.34 % 84.10 %
St. Luke's Hospital, Rathgar 2.30 % 4.85 % 2.43 % 2.33 % 4.12 % 4.97 % 3.31 % 80.10 %
Mater Misericordiae University Hospital 1.16% 3.25% 3.38% 3.52% 4.99% 5.21% 3.31% 90.5%
Dublin Dental Hospital 0.20% 0.00% 0.00% 4.17% 5.37% 3.74% 3.31% 95.2%
Dublin Midlands HG 0.48% 3.85% 2.28% 3.14% 3.19% 5.81% 3.29% 84.4%
St. Michael's House, Dublin 0.00 % 3.09 % 3.63 % 2.80 % 1.67 % 4.00 % 3.29 % 91.38 %
Corporate & HBS [West] 0.00% 1.83% 0.98% 3.48% 1.95% 0.00% 3.24% 91.6%
ISA Dublin South East/ Wicklow 4.62 % 2.85 % 2.51 % 4.32 % 3.62 % 3.14 % 3.18 % 85.69 %
Corporate & HBS [South] 0.00 % 4.11 % 0.00 % 2.82 % 4.05 % 4.13 % 3.06 % 97.86 %
Children's University Hospital 1.75 % 2.18 % 4.71 % 3.22 % 5.08 % 5.34 % 3.04 % 90.50 %
Coombe Women & Infants University Hospital 0.21 % 4.27 % 1.90 % 2.55 % 1.97 % 2.81 % 3.03 % 81.50 %
Cappagh National Orthopaedic Hospital 2.59% 1.54% 1.26% 2.38% 9.85% 3.71% 3.03% 87.4%
St. John of God, Kerry 0.00% 5.44% 3.99% 0.00% 2.42% 1.88% 3.00% 89.0%
Muiriosa Foundation, Longford/Westmeath 0.00 % 2.46 % 1.36 % 1.34 % 0.43 % 4.77 % 2.87 % 89.82 %
National Maternity Hospital 0.60 % 2.72 % 2.05 % 4.99 % 2.32 % 5.87 % 2.85 % 84.60 %
St. John of God DML Region 2.71% 2.86% 3.18% 3.37% 2.22% 2.56% 2.85% 87.3%
Royal Victoria Eye & Ear Hospital 4.43% 1.53% 0.82% 5.71% 0.29% 0.76% 2.76% 87.10%
Our Lady's Hospice & Care Services 4.43% 3.69% 1.70% 5.75% 4.02% 6.54% 2.76% 88.7%
Palliative Care HG 4.43% 3.69% 1.70% 5.75% 4.02% 6.54% 2.76% 88.7%
107

Health Service Absence Rates by HSE Area (November 2014)
AgencyMedical
/DentalNursing
Health &
Social Care
Professionals
Management
Admin
General
Support Staff
Other Patient
& Client CareTotal Certified
Our Lady's Hospice & Care Services 4.43 % 3.69 % 1.70 % 5.75 % 4.02 % 6.54 % 2.76 % 88.70 %
ISA Kerry 4.69% 2.67% 1.10% 2.74% 4.05% 2.59% 2.70% 91.6%
Royal Hospital, Donnybrook, Dublin 0.00 % 2.60 % 0.80 % 0.49 % 8.38 % 1.53 % 2.68 % 89.39 %
Bros. of Charity, Waterford 0.00% 3.84% 2.70% 0.34% 5.47% 2.45% 2.56% 83.4%
St. James's Hospital 0.10% 3.00% 1.90% 3.00% 3.60% 3.60% 2.50% 82.3%
National Rehabilitation Hospital 0.91% 3.26% 2.22% 1.70% 0.85% 3.39% 2.46% 73.3%
St. Vincent's, Fairview 0.14 % 2.77 % 7.51 % 2.61 % 1.75 % 2.02 % 2.44 % 87.94 %
Carriglea Cairde Services 0.00 % 6.11 % 0.71 % 0.00 % 0.00 % 1.64 % 2.29 % 93.41 %
Children's Sunshine Home 0.00 % 4.01 % 0.00 % 0.00 % 0.00 % 1.25 % 2.18 % 81.96 %
St. Michael's Hospital 0.55% 2.76% 3.23% 0.49% 2.52% 0.00% 2.00% 81.70%
St. Columcille's Hospital 0.14% 2.00% 1.59% 2.52% 4.21% 0.22% 1.96% 67.40%
Leopardstown Park Hospital 0.00 % 1.76 % 0.54 % 4.86 % 0.23 % 1.16 % 1.51 % 91.48 %
Bros. of Charity, Clare 0.00% 0.00% 1.92% 0.00% 0.00% 1.26% 1.37% 86.0%
Acute Hospital Services, Midlands 0.00% 0.00% 0.00% 0.00% 0.00% 0.00% 0.00%
108