December 2013 MLC - popular charts. 2 This information has been provided by MLC Investments (ABN 30...
17
December 2013 MLC - popular charts
-
Upload
phebe-ward -
Category
Documents
-
view
216 -
download
2
Transcript of December 2013 MLC - popular charts. 2 This information has been provided by MLC Investments (ABN 30...

December 2013
MLC - popular charts
2
This information has been provided by MLC Investments (ABN 30 002 641 661) and MLC Limited (ABN 90 000 000 402), members of the National Australia Bank group of companies, 105–153 Miller Street, North Sydney 2060.
This communication contains general information and may constitute general advice. Any advice in this communication has been prepared without taking account of individual objectives, financial situation or needs. It should not be relied upon as a substitute for financial or other specialist advice. Before making any decisions on the basis of this communication, you should consider the appropriateness of its content having regard to your particular investment objectives, financial situation or individual needs. You should obtain a Product Disclosure Statement or other disclosure document relating to any financial product issued by MLC Investments Limited (ABN 30 002 641 661) and MLC Nominees Pty Ltd (ABN 93 002 814 959) as trustee of The Universal Super Scheme (ABN 44 928 361 101), and consider it before making any decision about whether to acquire or continue to hold the product. A copy of the Product Disclosure Statement or other disclosure document is available upon request by phoning the MLC call centre on 132 652 or on our website at mlc.com.au.
An investment in any product offered by a member company of the National Australia Bank group of companies does not represent a deposit with or a liability of the National Australia Bank Limited ABN 12 004 044 937 or other member company of the National Australia Bank group and is subject to investment risk including possible delays in repayment and loss of income and capital invested. None of the National Australia Bank Limited, MLC Limited, MLC Investments Limited or other member company in the National Australia Bank group guarantees the capital value, payment of income or performance of any financial product referred to in this publication.
Past performance is not indicative of future performance. The value of an investment may rise or fall with the changes in the market. Please note that all performance reported is before management fees and taxes, unless otherwise stated.
Important information

Chart index
3
Chart title Slide Data source
Cash and term deposit rates aren’t always high
5 Term deposit rates over the past 10 years - MLC Investment Management, Reserve Bank of Australia. Data as at 31 December 2013. Based on banks’ 1 year term deposit rates ($10,000)
Shares vs term deposits 6 Income and capital return on an investment of $100,000 in December 1980 – December 2011 - Based on calculations by MLC Investment Management as at 31 December and based on market index data. Shares – represented by the ASX All Ordinaries Accumulation and Price Indices. Income calculated as the difference between the return of the accumulation and price indices, multiplied by capital value. Term Deposit – represented by the Reserve Bank of Australia (RBA) 12 month Banks’ Term Deposits ($10,000), prior to January 1982, the RBA 12 month Term Deposit rate ($5000 - $10,000). All data assumes income is not re-invested.
Growth of an investment in the Australian sharemarket over 20 years
7 Value of $100,000 invested over 20 years (income reinvested) - MLC Investment Management, data as at 31 December 2013. Tick. Australian Shares: ASX All Ordinaries Accumulation Index
Own or loan? 8 Investment of $100,000 in December 1989 - December 2013. Based on data from Reuters, ASX and Reserve Bank of Australia.
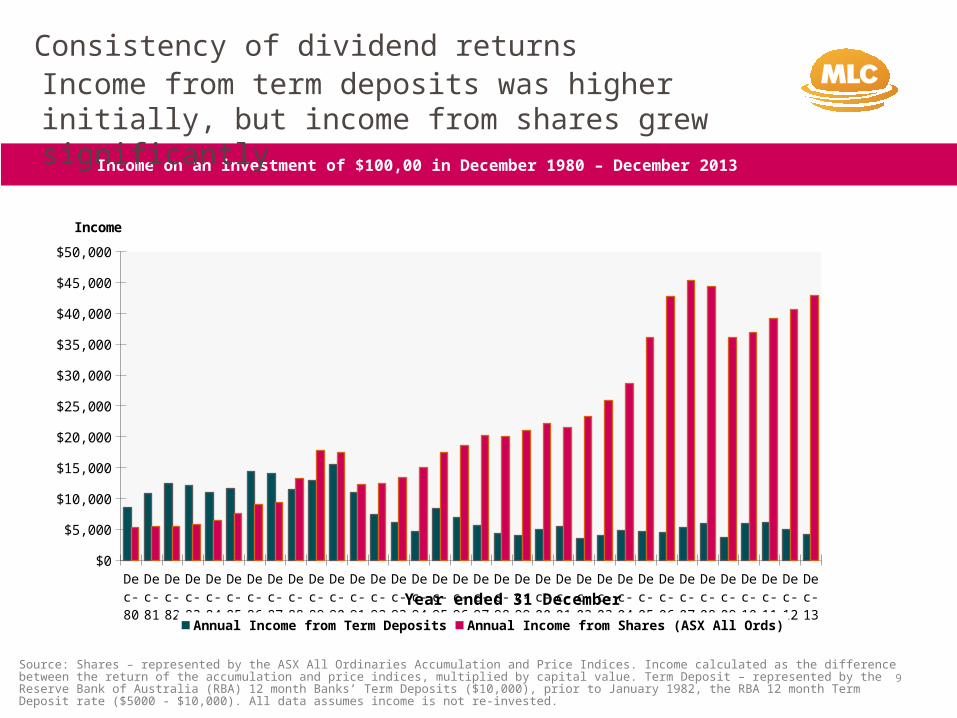
Consistency of dividend returns
9 Income on an investment of $100,000 in December 1980 – December 2013 . Shares – represented by the ASX All Ordinaries Accumulation and Price Indices. Income calculated as the difference between the return of the accumulation and price indices, multiplied by capital value. Term Deposit – represented by the Reserve Bank of Australia (RBA) 12 month Banks’ Term Deposits ($10,000), prior to January 1982, the RBA 12 month Term Deposit rate ($5000 - $10,000). All data assumes income is not re-invested.
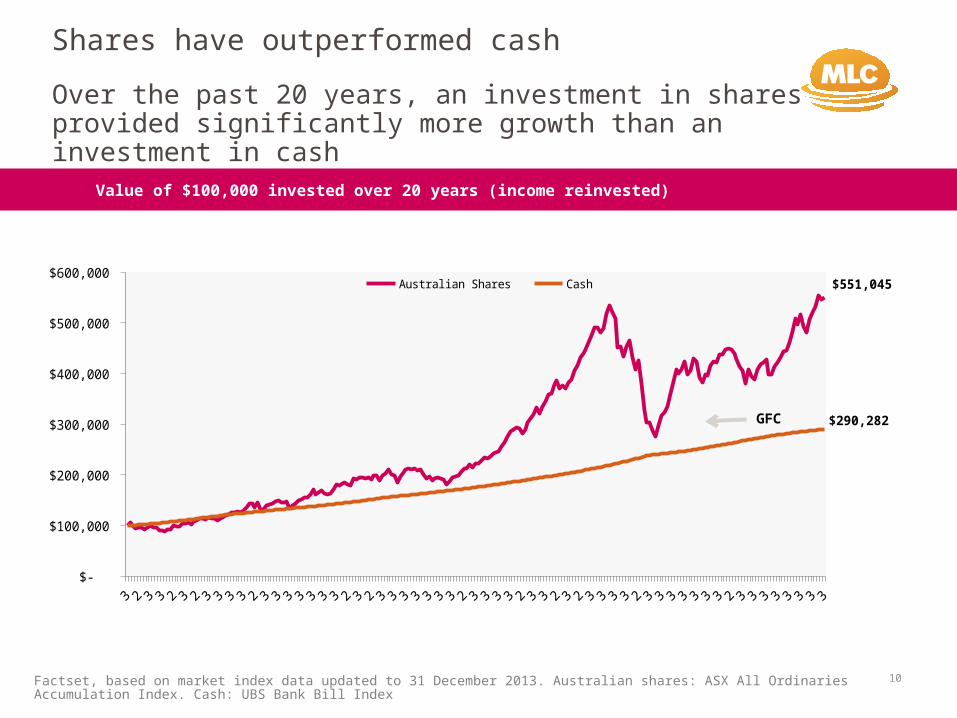
Shares have outperformed cash
10 Value of $100,000 invested over 20 years (income reinvested) - Factset, based on market index data updated to 31 December 2013. Australian shares: ASX All Ordinaries Accumulation Index. Cash: UBS Bank Bill Index
The impact of inflation 11 The value of $1,000 invested for 10 years (taking into account inflation) - Data calculated over 10 year periods by MLC Investment Management using data provided by Global Financial Data, Inc. and Thomson Reuters Datastream.

4
Chart title Slide Data source
Days out of the market will erode your wealth
12 Value of $10,000 invested over 20 years - Calculations by MLC Investment Management using data as at 31 December 2013. The ‘market’ is the Australian share market and is represented by the ASX All Ordinaries Accumulation Index.
Growing your wealth through a regular investment strategy
13 Dollar cost averaging calculations by MLC Investment Management
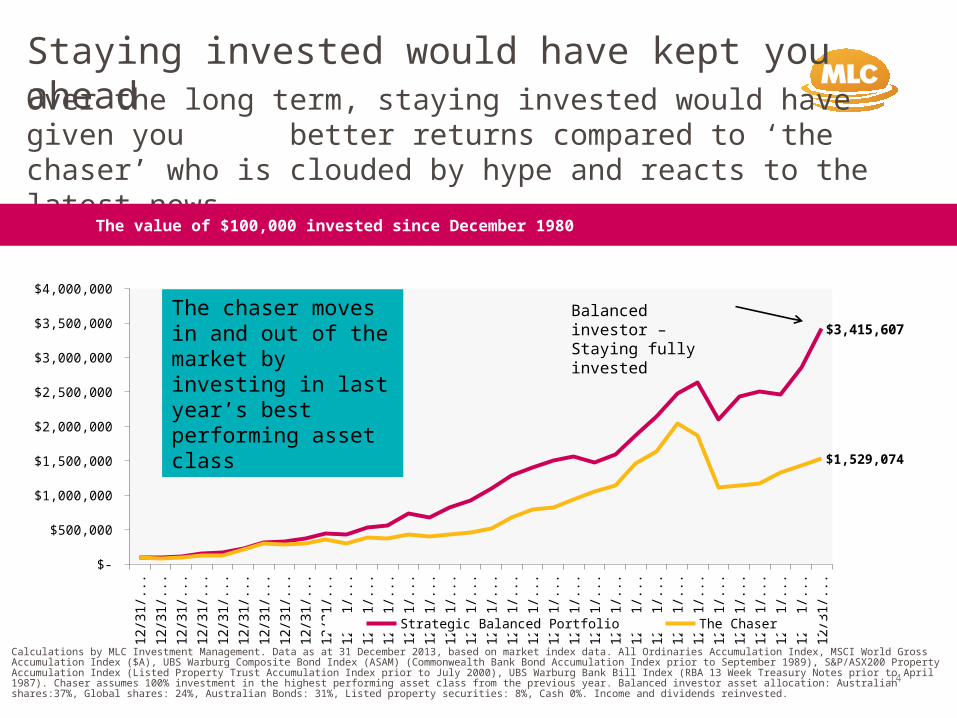
Staying invested would have kept you ahead (‘the chaser’)
14 The value of $100,000 invested in 1980 - Calculations by MLC Investment Management. Data as at 31 December 2013, based on market index data. All Ordinaries Accumulation Index, MSCI World Gross Accumulation Index ($A), UBS Warburg Composite Bond Index (ASAM) (Commonwealth Bank Bond Accumulation Index prior to September 1989), S&P/ASX200 Property Accumulation Index (Listed Property Trust Accumulation Index prior to July 2000), UBS Warburg Bank Bill Index (RBA 13 Week Treasury Notes prior to April 1987). Chaser assumes 100% investment in the highest performing asset class from the previous year. Balanced investor asset allocation: Australian shares:37%, Global shares: 24%, Australian Bonds: 31%, Listed property securities: 8%, Cash 0%. Income and dividends reinvested.
Impact of world events on the Australian sharemarket
15 The value of $100,000 invested 25 years ago - MLC Investment Management, data as at 31 December 2013. Tick marks indicate 1 January. ASX All Ordinaries Accumulation Index.
Following the latest trend – tech boom
16 NASDAQ Composite Index - Value of $10,000 invested in December 1984 (dividend income not included) - Calculations by MLC Investment Management as at 31 December 2013.
Comparison of returns from global shares and term deposits since 2002
17 MLC Investment Management. Data as at 31 December 2013. MSCI World Index (hedged - $A). Term deposits: 1 year bank’s term deposit ($10,000) – Reserve Bank of Australia
Chart index (continued)

Feb-2
002
Jun-
2002
Oct-2
002
Feb-2
003
Jun-
2003
Oct-2
003
Feb-2
004
Jun-
2004
Oct-2
004
Feb-2
005
Jun-
2005
Oct-2
005
Feb-2
006
Jun-
2006
Oct-2
006
Feb-2
007
Jun-
2007
Oct-2
007
Feb-2
008
Jun-
2008
Oct-2
008
Feb-2
009
Jun-
2009
Oct-2
009
Feb-2
010
Jun-
2010
Oct-2
010
Feb-2
011
Jun-
2011
Oct-2
011
Feb-2
012
Jun-
2012
Oct-2
012
Feb-2
013
Jun-
2013
Oct-2
013
0
1
2
3
4
5
6
7
8
9
10
1 yr
One year term deposit rates
Cash and term deposit rates aren’t always high
5MLC Investment Management, Reserve Bank of Australia. Data as at 31 December 2013. Based on banks’ 1 year term deposit rates ($10,000) as at 24 March 2014.
With low term deposit rates you may not get the level of growth and income you need to achieve your goals.
Current RBA interest rate is 2.5% and a 1 year term deposit rate with the National Australia Bank is 3.4%
They rise just as often as they fall
December 2013
Ret
urns
%
8.3% July 2008
3% March 2009

80 81 82 83 84 85 86 87 88 89 90 91 92 93 94 95 96 97 98 99 00 01 02 03 04 05 06 07 08 09 10 11 12 13$0
$5,000
$10,000
$15,000
$20,000
$25,000
$30,000
$35,000
$40,000
$45,000
$50,000
$0
$200,000
$400,000
$600,000
$800,000
$1,000,000
$1,200,000
$1,400,000
Annual Income from Term Deposits Annual Income from Shares (ASX All Ords) Capital Value of Term Deposits
Capital Value of Shares (ASX All Ords)
Year ended 31 December
Income Capital Value
Shares vs term deposits
6Based on calculations by MLC Investment Management as at 31 December and based on market index data. Shares – represented by the ASX All Ordinaries Accumulation and Price Indices. Income calculated as the difference between the return of the accumulation and price indices, multiplied by capital value. Term Deposit – represented by the Reserve Bank of Australia (RBA) 12 month Banks’ Term Deposits ($10,000), prior to January 1982, the RBA 12 month Term Deposit rate ($5000 - $10,000). All data assumes income is not re-invested.
Capital value of term deposit does not grow
Income from shares grows over time
Income and capital return on an investment of $100,000 in December 1980 – December 2013
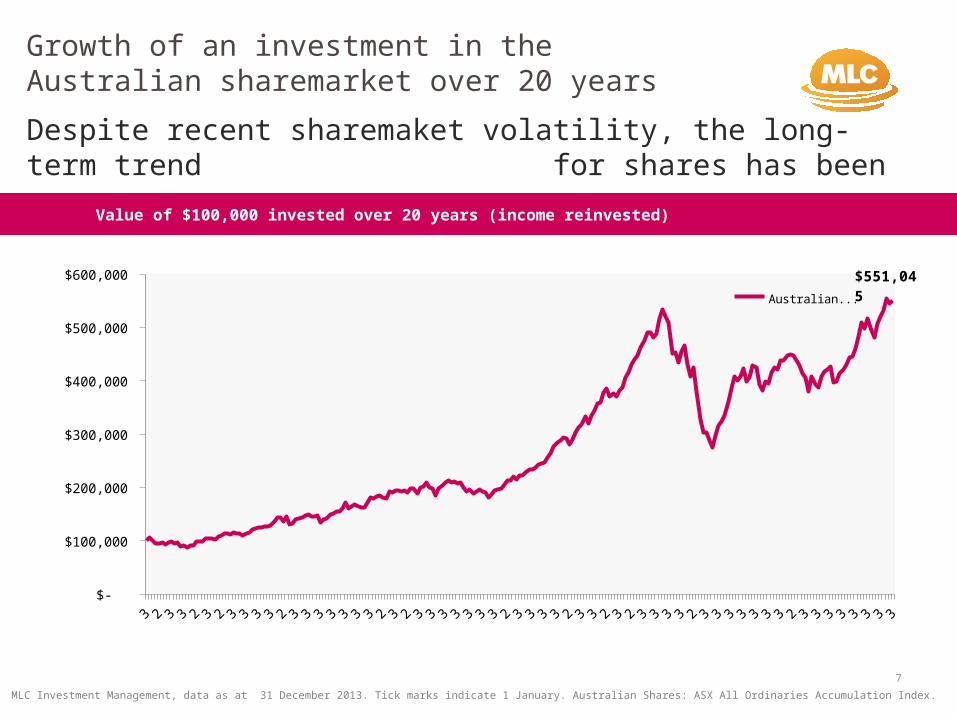
Despite recent sharemaket volatility, the long-term trend for shares has been up
Growth of an investment in the Australian sharemarket over 20 years
MLC Investment Management, data as at 31 December 2013. Tick marks indicate 1 January. Australian Shares: ASX All Ordinaries Accumulation Index.
7
Value of $100,000 invested over 20 years (income reinvested)
$-
$100,000
$200,000
$300,000
$400,000
$500,000
$600,000 Australian Shares
$551,045

Own or loan?
Calculations by MLC Investment Management as at 31 December. Based on data from Reuters, ASX and Reserve Bank of Australia . All data assumes income is not re-invested.
8
Investment of $10,000 in December 1989 – December 2013
Income and growth of a term deposit with NAB vs owning NAB shares
1989
1990
1991
1992
1993
1994
1995
1996
1997
1998
1999
2000
2001
2002
2003
2004
2005
2006
2007
2008
2009
2010
2011
2012
2013
$0
$500
$1,000
$1,500
$2,000
$2,500
$3,000
$3,500
$0
$10,000
$20,000
$30,000
$40,000
$50,000
$60,000
$70,000
$80,000
NAB - Dividends
Linear (NAB - Dividends)
Term Deposits - Interest
Column2
NAB - Capital value
Inte
res
t a
nd
div
ide
nd
s
Cap
ital
val
ue
Consistency of dividend returns
9Source: Shares – represented by the ASX All Ordinaries Accumulation and Price Indices. Income calculated as the difference between the return of the accumulation and price indices, multiplied by capital value. Term Deposit – represented by the Reserve Bank of Australia (RBA) 12 month Banks’ Term Deposits ($10,000), prior to January 1982, the RBA 12 month Term Deposit rate ($5000 - $10,000). All data assumes income is not re-invested.
Income on an investment of $100,00 in December 1980 – December 2013
Income from term deposits was higher initially, but income from shares grew significantly
80 81 82 83 84 85 86 87 88 89 90 91 92 93 94 95 96 97 98 99 00 01 02 03 04 05 06 07 08 09 10 11 12 13$0
$5,000
$10,000
$15,000
$20,000
$25,000
$30,000
$35,000
$40,000
$45,000
$50,000
Annual Income from Term Deposits Annual Income from Shares (ASX All Ords)
Year ended 31 December
Income
Shares have outperformed cash
10Factset, based on market index data updated to 31 December 2013. Australian shares: ASX All Ordinaries Accumulation Index. Cash: UBS Bank Bill Index
Based on an investment of $10,000
Based $10,000
Value of $100,000 invested over 20 years (income reinvested)
$537,412
Over the past 20 years, an investment in shares provided significantly more growth than an investment in cash
$-
$100,000
$200,000
$300,000
$400,000
$500,000
$600,000 $551,045
$290,282
Australian Shares Cash
GFC
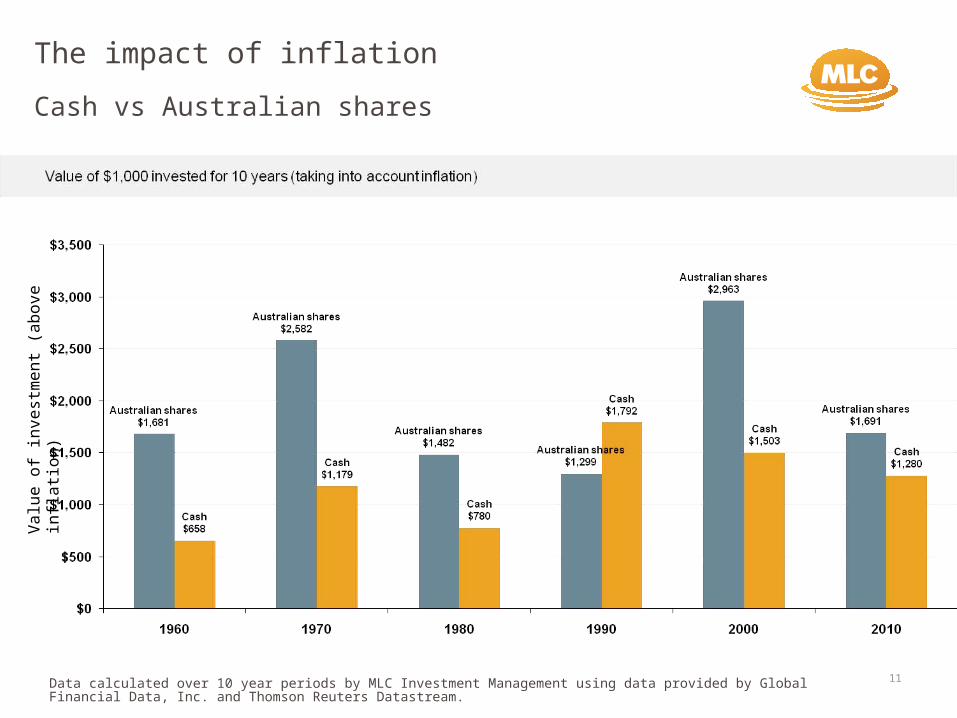
The impact of inflation
Data calculated over 10 year periods by MLC Investment Management using data provided by Global Financial Data, Inc. and Thomson Reuters Datastream.
11
Va
lue
of
inve
stm
en
t (a
bo
ve in
flatio
n)
Cash vs Australian shares

Days out of the market will erode your wealth
Calculations by MLC Investment Management using data as at 31 December 2013. The ‘market’ is the Australian share market and is represented by the ASX All Ordinaries Accumulation Index.
12
0 days out of the market 10 days out of the market $0.00
$10,000.00
$20,000.00
$30,000.00
$40,000.00
$50,000.00
$60,000.00
Missed thebest 10 days
$55,105
$34,419
Remained invested
Value of $10,000 invested over 20 years

This strategy takes the guess work out of when to invest
Growing your wealth through a regular investment strategy ‘dollar cost averaging’
13
Month Monthly investment
Unit price Units purchased
1 $200 $10.00 20
2 $200 $6.66 30
3 $200 $5.00 40
4 $200 $6.66 30
5 $200 $10.00 20
Total $1,000 140
• Dollar cost averaging helps you benefit from short-term market volatility.
• By investing smaller amounts at regular intervals you’ll buy less when the market is up (and prices are high) and more when the market is down (prices are low). You may end up with greater units than if you invested in a lump sum.
Total amount paid for investment = $1,000 Average price paid = $7.14 (ie $1,000/140 units) Investment value at the end of 5 months = $1,400 (ie 140 units at $10 each)
Source: MLC Investment Management.
19
80
19
81
19
82
19
83
19
84
19
85
19
86
19
87
19
88
19
89
19
90
19
91
19
92
19
93
19
94
19
95
19
96
19
97
19
98
19
99
20
00
20
01
20
02
20
03
20
04
20
05
20
06
20
07
20
08
20
09
20
10
20
11
20
12
20
13
$-
$500,000
$1,000,000
$1,500,000
$2,000,000
$2,500,000
$3,000,000
$3,500,000
$4,000,000
$3,415,607
$1,529,074
Strategic Balanced Portfolio The Chaser
Over the long term, staying invested would have given you better returns compared to ‘the chaser’ who is clouded by hype and reacts to the latest news.
Staying invested would have kept you ahead
Calculations by MLC Investment Management. Data as at 31 December 2013, based on market index data. All Ordinaries Accumulation Index, MSCI World Gross Accumulation Index ($A), UBS Warburg Composite Bond Index (ASAM) (Commonwealth Bank Bond Accumulation Index prior to September 1989), S&P/ASX200 Property Accumulation Index (Listed Property Trust Accumulation Index prior to July 2000), UBS Warburg Bank Bill Index (RBA 13 Week Treasury Notes prior to April 1987). Chaser assumes 100% investment in the highest performing asset class from the previous year. Balanced investor asset allocation: Australian shares:37%, Global shares: 24%, Australian Bonds: 31%, Listed property securities: 8%, Cash 0%. Income and dividends reinvested.
14
Balanced investor –Staying fully invested
The value of $100,000 invested since December 1980
The chaser moves in and out of the market by investing in last year’s best performing asset class

Impact of world events on the Australian sharemarket
MLC Investment Management, data as at 31 December 2013. Tick marks indicate 1 January. Australian Shares: ASX All Ordinaries Accumulation Index.
15
The value of $10,000 invested 25 years ago

31-
31-J
...
28-F
...
30-
30-A
...
30-
30-J
...
31-J
...
31-
30-M
...
31-O
...
31-
31-
31-J
...
26-F
...
30-
29-A
...
30-
30-J
...
31-J
...
30-
31-M
...
31-O
...
29-
31-
30-J
...
29-F
...
29-
30-A
...
30-
28-J
...
31-J
...
29-
31-M
...
29-O
...
31-
30-
31-J
...
28-F
...
28-
30-A
...
28-
30-J
...
29-J
...
31-
31-M
...
31-O
...
31-
31-
31-J
...
$0
$50,000
$100,000
$150,000
$200,000
$250,000
Source: Calculations by MLC, based on data from Factset
Following the latest trend – tech boom
Source: FactSet and MLC Investment Management. Technology stocks: NASDAQ Composite Index. 16
Companies began to fold and investors started to panic
The value of $10,000 invested in December 1984 (dividend income not included)
Investors went into a frenzied buying spree. Invested heavily in companies without fully understanding the companies they were investing in.
The impact of the tech boom and media hype

Mar 2002
Sep 2002
Mar 2003
Sep 2003
Mar 2004
Sep 2004
Mar 2005
Sep 2005
Mar 2006
Sep 2006
Mar 2007
Sep 2007
Mar 2008
Sep 2008
Mar 2009
Sep 2009
Mar 2010
Sep 2010
Mar 2011
Sep 2011
Mar 2012
Sep 2012
Mar 2013
Sep 2013$0
$50,000
$100,000
$150,000
$200,000
$250,000
Global shares Term deposit
Lehmans collapse
If you’d remained invested in global shares after Lehman Brothers collapsed you’d have almost $236,909 compared to $136,343 if you moved your money to a term deposit.
Comparison of returns from global shares and term deposits since 2002
MLC Investment Management. Data as at 31 December 2013. MSCI World Index (hedged - $A). Term deposits: 1 year bank’s term deposit ($10,000) – Reserve Bank of Australia
17
$236,909
$136,343