
Using Pathway Student Outcome Charts High School Teachers Council December 8, 2010.

Jeanette Schwarz Young, CFP®, CMT, M.S.
Jordan Young, CMT
83 Highwood Terrace
Weehawken, New Jersey 07086
www.OptnQueen.com
December 14, 2014
The Option Queen Letter
By the Option Royals
The slow to non-existent growth around the globe has caused a genuine decline in the demand
for crude products; this much we know. Expansion demands energy and when we see excess
supply and falling demand, we can assume that expansion is flagging globally. That said, the
strong US Dollar removes the competitive edge that the US may have enjoyed and will impact
companies that rely on exports for much of their earnings.
We looked at a chart of platinum divided by gold and noticed that the spread has become narrow.
This tells us that the demand for platinum has declined, partially owing to the demand for
gasoline and the use of platinum in converting crude to gasoline but also this decline in demand
shows that industrial demand for platinum is on the decline. Global slowdown? We should
also never forget that because these commodities are priced in US Dollars, their price naturally
declines as the value of the US Dollar increases. Once we remove that factor, we see a better
picture of the industrial demand and it seems to be slack.

Energy companies make up 9% of the S&P 500 index stocks, but they account for 30% of capital
expenditures. With crude prices on the decline, it is logical to believe that some of these
expenditures will be reduced. Unfortunately the debt incurred from borrowing money on the
cheap will remain as an expense for the energy companies but we see them cutting costs where
they can and doing so aggressively. This industry contributed to the employment growth seen in
the US in recent months. We wonder what the impact of cutting costs and firings in the oil patch
will have on the future employment reports. The global implications of cheap oil are that it
really hurts countries like Russia, Iraq, Iran, Syria etc. What does OPEC care, the Saudis have
plenty of cash.
Regarding the Fed and interest rates… sorry folk, we do not see the FOMC ratcheting interest
rates high for a very long time. It isn’t as though we agree with their policy, beside who cares
what we think, but it is more the case that the meager recovery seen here in the USA will be
negatively impacted by any increase in interest rates and the Fed will err on the side of stable low
interest rates and hope for growth. As to inflation, according to government measures there is
none. According to our grocery cart, there certainly has been inflation but alas, the government
neither eats nor pays household bills. We also note that there is a cellular war in progress
which, thankfully, will push wireless costs down. The extra savings via both wireless and
gasoline costs reductions should help the average American with their survival and might add
some Christmas Cheer and optimism to those in the middle struggling class of earners. We seem
to be closer to deflation than any inflation at this point.

Although the S&P 500 declined in four of the five sessions this past week, the volume declined
in the Friday session. Some of the action seen in the futures was due to the fact that the
December contract rolled to March on Thursday. This event always adds volatility to the
product, and this past week was no exception. We are also deep into tax-loss selling season and
we suspect that many of the energy related issues were sold in an effort to capture a tax loss.
That said, we would expect to see these same issues bounce in January. The S&P 500 closed
below its 50 day Exponential moving average and is extremely close to the 100 day moving
average. This has not been tested since October. The market lost 1.56% of its value in the
Friday session shedding 31.50 handles (points). The current retreat looks a lot like the retreat
seen in the September to October 2014 retreat….we shall see. We have been cautious on this
market and have advised using tight stops on positions. We cannot tell you when the “big
retreat” will arrive but can tell you that it will arrive. The 5-period exponential moving average
is 2022.21 and, we are below that level. The upper edge of the expanding Bollinger Band is
2084.96 and the lower edge is seen at 2008.56. We are below the lower edge of the Bollinger
Band which tells us that either we will rally back inside that band or, the market will expand to
accommodate the increased volatility. All the indicators that we follow herein are pointing
lower and at oversold levels. The indicators on the weekly and monthly charts are also giving us
sell-signals but these readings are not oversold. We still are above the Ichimoku Clouds for all
time-frames. The heaviest volume, 10.4% of the day’s volume, was seen at 2009.81. The most
frequently traded price was 2020.38. The daily 1% by 3-box point and figure chart continues to
look fine with no recent downtrend lines. The 60 minute 0.1% by 3-box chart tells an entirely
different story with multiple downtrend lines and a downside projection of 1970.83. Proceed
with caution remember we are in tax loss selling season and as we move closer to the holidays,
trading desks will thin out and volume will fade.


The NASDAQ 100 lost 1.02% in the Friday session or 43.00 handles (points). Although for the
longs, the retreat felt awful, it was not as painful as the retreat seen in the S&P 500. The chart
shows that this past week we saw steep declines on Monday and Wednesday followed by a doji-
like candle sticks. The market looks as though it is organized and there is no panic, well as least
so far there isn’t. The downward trending channel lines are 4283.40 and 4182.40. We are above
both the 50 and the 100 day exponential moving averages. The 5-period exponential moving
average is 4233.60. The top of the Bollinger Band is 4348.59 and the lower edge is seen at
4181.25. We note that Friday was a light volume trading day. All the indicators that we follow
herein continue to point lower at near oversold levels. We have sell-signals on the weekly charts
which have just rolled over. We remain above the Ichimoku Clouds for all time-frames. The
most frequently traded price, 4222.17, was also the price with the highest volume for the day and
represented 13.3% of the day’s volume. The 1% by 3-box daily point and figure chart remains
bullish. The 60 minute 0.1% by 3-box chart is negative with a downside target of 4125.67. The
NASDAQ 100 was the best of the bad for the Friday session. Caution is the theme. This is not a
time to “set it and forget it.” Sorry RONKO hand to steal that phrase.


The Russell 2000 lost about 1.21% of its value in the Friday session and lost less than the S&P
500 lost. We saw this small capitalization index lose 13.70 handles (points) on rather heavy
volume. This index has not broken out of its trading range, although it did pierce the lower line,
it closed above that line at 1143.90. The flattish downward trending channel lines are 1179.67
and 1140.47. All the indicators that we follow continue to point lower and do have room to the
downside. The 5-period exponential moving average is 1157.42. The top of the Bollinger Band
is 1192.35 and the lower edge is seen at 1143.04. The heaviest volume, 18.2% of the day’s
volume was seen at the price of 1152.00. The most frequently traded price was 1155.00. From
the Market Profile daily chart, we read that below 1140.70, this index gets into deep trouble.
You have been warned! The 110 by 3-box point and figure chart is not bullish. We believe that
this index has been the source of funds for a tax selling candidates for some time now and that
perhaps it is getting sold out for now. We are not sure about that but are watching this carefully.


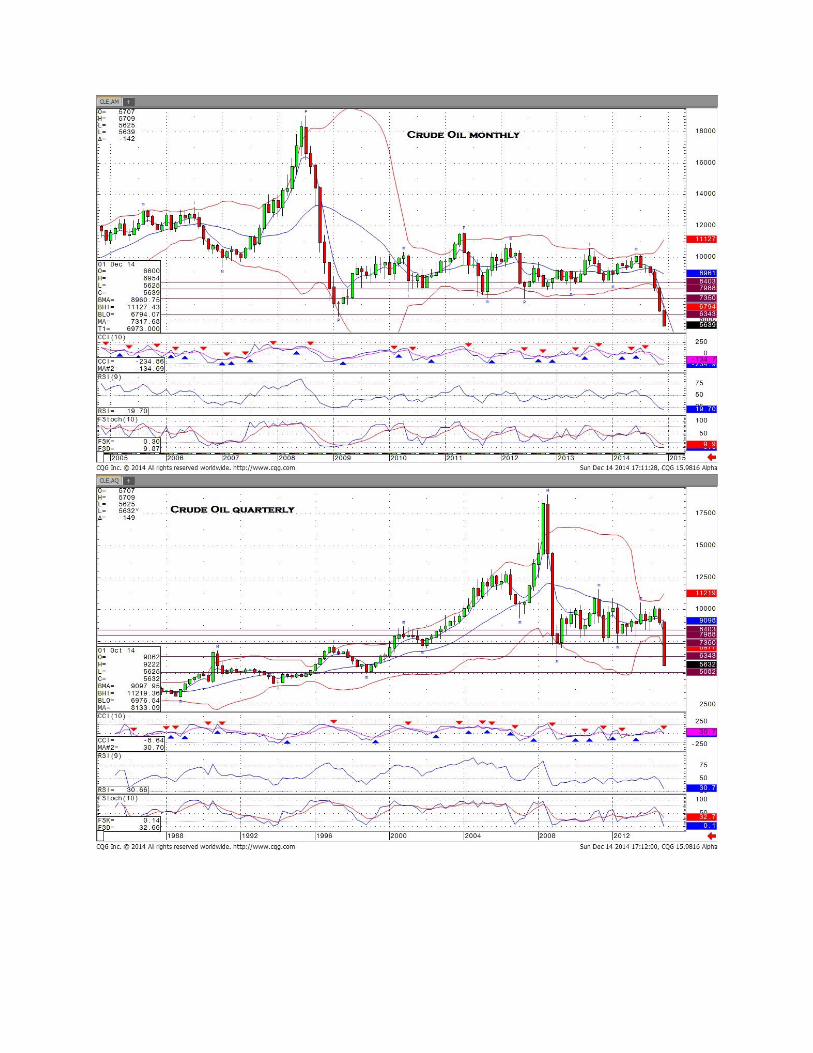
Crude Oil’s chart looks like a waterfall. The slope of this retreat is too steep to continue and we
do expect to see some pause in the selling. The Friday session marked the eight sessions out of
nine sessions that this market sold off. There is little on this chart that looks positive although,
we seem to be losing momentum on the downside. That said, the volume has been strong on this
retreat. The 5-period exponential moving average is 60.64. The top of the Bollinger Band is
81.26 and the lower edge is seen at 57.02. The market seems to be clinging to the lower edge of
the Bollinger Band which is expanding. We closed and traded below the lower edge of the
downward trending channel line, not a good thing. The steeper downward trending channel lines
are 59.72 and 57.34. If and when this market rallies there will be sellers, sitting and waiting to
get out of their positions. This market will be under pressure for some time. The daily 0.9% by
3-box point and figure chart looks dreadful and has a downside target of 52. There is nothing
positive to be seen on this chart. The 60 minute 0.2% by 3-box point and figure chart looks
slightly better than the daily point and figure chart and has a downside target of 56.03. The most
frequently traded price in the Friday session was 59.10. We see that 61.35, should the market
rally to that level, will become a very large obstacle for this market to remove. We would
suggest that trying to find the bottom of this debacle might not be a great idea because trying to
catch a falling knife generally leads to wounds and bleeding. If you are looking to trade from the
long side, please let the market tell you where it is going and remember you are trading against
the trend, so keep your stops extremely tight.


Gold declined 3.50 in the Friday session on lightish volume. The indicators that we follow are
crossing and appear to be signaling a change of direction. At the moment the chart looks like it
is stair-stepping higher. The 5-period exponential moving average is 1220.57. The top of the
narrowish Bollinger Band is 1233.73 and the lower edge is seen at 1170.38. The upward
trending channel lines are 1184.41 and 1242.62. We see strong resistance at 1238.90 and further
resistance at 1255.80. We finally closed above the Ichimoku Clouds for the daily time-frame,
but we are still below the clouds for both the weekly and the monthly time-frames. The 60
minute 0.1% by e-box point and figure chart looks as though gold is consolidating. We continue
to have a downside target of 1195.67 but we see hope with an uptrend line. The daily 1% by 3-
box point and figure chart has some mixed signals. We have an internal uptrend line but a major
downtrend line. This should resolve shortly and the picture will become clearer. We do feel
better about gold, but remember there are some longs out there that bought at much higher levels
that will likely take their tax loss in this product. Also remember that as crude oil retreats,
margin calls are created and gold is always a favorite liquidation for margin clerks.


Although US Dollar Index started the week off by tip toeing above the 89.54 resistance line, it
quickly pulled back to support, closing the Friday session at 88.35. If the past few months of this
index were a song it certainly would be Meatloaf’s “bat out of hell.” The Bollinger Bands are
currently contracting with the upper band at 89.32 and the lower band at 87.29. The 20-period
simple moving average is 88.31, which the index is above, and the 5-period simple moving
average is 88.56, with the index is below. The RSI is currently pointing down and our own
indicator is not issuing a signal. The index is currently resting on a support line around 88.40.
Below this level, 87.47 should act as strong support, with weaker support found at 86.97.
Resistance continues to be at the 89.54 level, which was tested this week. Above this level, we
need to look to the monthly chart where we find 91.22, a level not tested since 2006. The 30
minute .05 x 3 point and figure chart shows that while the index continues to be in an uptrend,
with multiple internal uptrend lines, several internal uptrend lines have been broken and
countertrend internal trend lines have formed. Upside targets of 88.90 and 89.40 have been
achieved and there is a new, activated upside target at 91.30. The downside target of 88.05 has
also been achieved and there is a new, activated downside target that rests just above the uptrend
line at 87.15. All things considered, this index should rest, pulling back to the 88.40, before
making an about face and marching on to 91.22.
Risk Trading Futures, Options on Futures, and retail off-exchange foreign currency transactions
involves substantial risk of loss and is not suitable for all investors. You should carefully

consider whether trading is suitable for you in light of your circumstances, knowledge, and
financial resources. You may lose all or more of your initial investment.


![E book 14 tips to present awesome charts[1]](https://static.fdocuments.net/doc/165x107/555831e4d8b42ac6078b45f9/e-book-14-tips-to-present-awesome-charts1.jpg)


