Decadal Fluctuations in Planetary Wave Forcing Modulate...
9
Decadal Fluctuations in Planetary Wave Forcing Modulate Global Warming in Late Boreal Winter JUDAH COHEN Atmospheric and Environmental Research, Inc., Lexington, Massachusetts MATHEW BARLOW University of Massachusetts—Lowell, Lowell, Massachusetts KAZUYUKI SAITO Frontier Research Center for Global Change, Japan Agency for Marine-Earth Science and Technology, Kanagawa, Japan, and International Arctic Research Center, University of Alaska Fairbanks, Fairbanks, Alaska (Manuscript received 13 November 2008, in final form 5 March 2009) ABSTRACT The warming trend in global surface temperatures over the last 40 yr is clear and consistent with anthro- pogenic increases in greenhouse gases. Over the last 2 decades, this trend appears to have accelerated. In contrast to this general behavior, however, here it is shown that trends during the boreal cold months in the recent period have developed a marked asymmetry between early winter and late winter for the Northern Hemisphere, with vigorous warming in October–December followed by a reversal to a neutral/cold trend in January–March. This observed asymmetry in the cold half of the boreal year is linked to a two-way stratosphere–troposphere interaction, which is strongest in the Northern Hemisphere during late winter and is related to variability in Eurasian land surface conditions during autumn. This link has been demonstrated for year-to-year variability and used to improve seasonal time-scale winter forecasts; here, this coupling is shown to strongly modulate the warming trend, with implications for decadal-scale temperature projections. 1. Introduction Global surface temperatures have been in a general warming trend the entire length of the instrumental record, and much of the warming has been attributed to anthropogenic forcings. Though the record extends at least as far back as the midnineteenth century, most of the observed warming has occurred in the most recent 40 yr (Solomon et al. 2007). Deviations from the general upward trend of temperatures exist not only temporally but spatially as well, with the greatest warming anoma- lies observed over the high-latitude Northern Hemi- sphere (NH) during the boreal cold season. The skewed warming preferably toward the NH high latitudes during winter—polar and winter amplification—has been at- tributed to decreasing snow and ice cover (Graversen et al. 2008; Stine et al. 2009). Observed changes to the climate system have spanned the seasons, including increased snowmelt and early peak river discharge in the spring (Groisman et al. 1994; Rosenzweig et al. 2008), more intense heat waves in the summer (Stott et al. 2004), and a collapse in Arctic sea ice in the fall (Stroeve et al. 2008). Of all the seasons, however, the global climate models (GCMs) predict that winter will experience the greatest warming because of a positive feedback of increased greenhouse gases (GHGs) and a diminished and darker cryosphere (Hansen and Nazarenko 2004). However, news headlines of recent winters (2000/01–present) have been less about the ex- treme warmth and dwindling cryosphere and more about the severity of winter weather and record snow- falls. Most notably, January 2008 was the coldest for the NH landmasses in the past quarter of a century and the snowiest on record, as measured by satellites, lead- ing global warming skeptics to declare that the earth Corresponding author address: Judah Cohen, AER, Inc., 131 Hartwell Avenue, Lexington, MA 02421. E-mail: [email protected] 4418 JOURNAL OF CLIMATE VOLUME 22 DOI: 10.1175/2009JCLI2931.1 Ó 2009 American Meteorological Society
Transcript of Decadal Fluctuations in Planetary Wave Forcing Modulate...

Decadal Fluctuations in Planetary Wave Forcing Modulate GlobalWarming in Late Boreal Winter
JUDAH COHEN
Atmospheric and Environmental Research, Inc., Lexington, Massachusetts
MATHEW BARLOW
University of Massachusetts—Lowell, Lowell, Massachusetts
KAZUYUKI SAITO
Frontier Research Center for Global Change, Japan Agency for Marine-Earth Science and Technology, Kanagawa, Japan,
and International Arctic Research Center, University of Alaska Fairbanks, Fairbanks, Alaska
(Manuscript received 13 November 2008, in final form 5 March 2009)
ABSTRACT
The warming trend in global surface temperatures over the last 40 yr is clear and consistent with anthro-
pogenic increases in greenhouse gases. Over the last 2 decades, this trend appears to have accelerated. In
contrast to this general behavior, however, here it is shown that trends during the boreal cold months in the recent
period have developed a marked asymmetry between early winter and late winter for the Northern Hemisphere,
with vigorous warming in October–December followed by a reversal to a neutral/cold trend in January–March.
This observed asymmetry in the cold half of the boreal year is linked to a two-way stratosphere–troposphere
interaction, which is strongest in the Northern Hemisphere during late winter and is related to variability in
Eurasian land surface conditions during autumn. This link has been demonstrated for year-to-year variability
and used to improve seasonal time-scale winter forecasts; here, this coupling is shown to strongly modulate the
warming trend, with implications for decadal-scale temperature projections.
1. Introduction
Global surface temperatures have been in a general
warming trend the entire length of the instrumental
record, and much of the warming has been attributed to
anthropogenic forcings. Though the record extends at
least as far back as the midnineteenth century, most of
the observed warming has occurred in the most recent
40 yr (Solomon et al. 2007). Deviations from the general
upward trend of temperatures exist not only temporally
but spatially as well, with the greatest warming anoma-
lies observed over the high-latitude Northern Hemi-
sphere (NH) during the boreal cold season. The skewed
warming preferably toward the NH high latitudes during
winter—polar and winter amplification—has been at-
tributed to decreasing snow and ice cover (Graversen
et al. 2008; Stine et al. 2009).
Observed changes to the climate system have spanned
the seasons, including increased snowmelt and early
peak river discharge in the spring (Groisman et al. 1994;
Rosenzweig et al. 2008), more intense heat waves in the
summer (Stott et al. 2004), and a collapse in Arctic sea
ice in the fall (Stroeve et al. 2008). Of all the seasons,
however, the global climate models (GCMs) predict that
winter will experience the greatest warming because of a
positive feedback of increased greenhouse gases (GHGs)
and a diminished and darker cryosphere (Hansen and
Nazarenko 2004). However, news headlines of recent
winters (2000/01–present) have been less about the ex-
treme warmth and dwindling cryosphere and more
about the severity of winter weather and record snow-
falls. Most notably, January 2008 was the coldest for the
NH landmasses in the past quarter of a century and
the snowiest on record, as measured by satellites, lead-
ing global warming skeptics to declare that the earth
Corresponding author address: Judah Cohen, AER, Inc., 131
Hartwell Avenue, Lexington, MA 02421.
E-mail: [email protected]
4418 J O U R N A L O F C L I M A T E VOLUME 22
DOI: 10.1175/2009JCLI2931.1
� 2009 American Meteorological Society

has started a protracted cooling trend (e.g., New York
Times, 2 March 2008). In this note, we analyze the NH
cold season temperatures over the past 2 decades. Over
this period, global surface temperatures continued to
warm at an accelerated rate with the eight warmest years
ever recorded occurring after 1998 during the second
half of the record being analyzed here. However, our
analysis of the observations reveals late-winter damping
of upward temperature trends providing asymmetric
winter temperature trends in an otherwise secularly
warming planet. Furthermore, climate models do not
predict the observed temperature trend reversal.
2. Data
For model surface temperature data we used the
World Climate Research Programme’s (WCRP’s) Cou-
pled Model Intercomparison Project phase 3 (CMIP3)
multimodel dataset (Meehl et al. 2007). For observed
surface temperature data we used the Climatic Research
Unit (CRU) CRUTEM3 land surface temperature da-
taset (Brohan et al. 2006). All atmospheric data are
taken from the National Centers for Environmental
Prediction–National Center for Atmospheric Research
(NCEP–NCAR) reanalysis (Kalnay et al. 1996). The
October-mean snow cover index merges a satellite-
based dataset (Robinson et al. 1993) from 1967 to 2007
and from a historical reconstruction based on in situ
observations from 1948 to 1966 (Brown 2000).
3. Results
We tested observed surface temperatures for the
extratropical (308–908N) NH landmasses for a statisti-
cally significant trend for the four seasons: spring [April–
June (AMJ)], summer [July–September (JAS)], fall
[October–December (OND)], and winter [January–
March (JFM)] for the past 40, 30, 20, and 10 yr using
CRUTEM3 land surface temperature data (Table 1).
We use rank correlation (e.g., Wilks 2006) as a robust
measure of the consistency of the trend (the maximum
rank correlation of 1.0 would indicate that temperature
increases every year), and linear trend as a measure of
the trend strength. The deciding factors for dividing the
seasons into AMJ, JAS, OND, and JFM are focused on
defining winter as JFM. As we will argue below, trends
in stratosphere-coupling and snow cover have at least
partially contributed to observed surface temperature
trends over the period of 1988–2008. Analysis from
Cohen et al. (2007) showed that the impact from snow
cover forcing in particular and stratosphere–troposphere
coupling in general on the phase and magnitude of the
Northern annular mode (NAM) is most frequent in
January. And, as Baldwin and Dunkerton (2001) have
shown, the influence of a stratospheric event on the
lower-tropospheric NAM can persist for 2–3 months.
Therefore, we felt that any dynamically forced changes
from snow cover anomalies or stratosphere–troposphere
coupling would be most apparent in the January–March
time period.
Three of the seasons show robust warming trends for
the most recent 40, 30, and 20 yr, and even at 10 yr the
trends are still significant or at least consistent with the
longer warming trends. The lone exception is winter
where a warming trend is detected at the longer time
periods of 40 and 30 yr, but is nearly absent for the last
20 yr and appears to even be slightly negative for the
last 10 yr.
The temperature trend for October through December
1988–2007 is shown in Fig. 1a. The trends are mostly
consistent with the expectations of a warming planet re-
sulting from increased GHGs; temperatures for the mid-
to high latitudes of the Northern Hemisphere have been
warming with some regional exceptions. However, the
plot of temperature trends for January through March
1989–2008 (Fig. 1b) does not exhibit hemispheric-scale
warming; instead, many regions of the mid- to high lat-
itudes have experienced a cooling trend. The pattern of
cooling over most of northern Eurasia and the eastern
United States, with warming over northeastern Canada,
Greenland, and the Middle East, is reminiscent of the
negative phase of the NAM. The NAM is the dominant
teleconnection pattern of the NH and is characterized
by a dipole in the sea level pressure field with one
anomaly center over the Arctic and another center of
the opposite sign across the midlatitude sector of the
North Atlantic and Pacific Oceans (Thompson and
Wallace 2000). However, a 2-decade-long cooling trend
is not expected based on the known dynamics of global
warming. This is especially so, given the decrease in the
NH cryosphere prior to the winter season and such a
warm beginning to the NH cold half of the year. El
Nino–Southern Oscillation (ENSO), the leading mode
TABLE 1. (left) The Spearman rank correlation of trends and
(right) linear trend (8C yr21) for the 3-month aggregate for OND,
JFM, AMJ, and JAS for the surface temperature of extratropical
Northern Hemisphere (308–908N) landmasses. Those correlations
found to be significant using the Student’s t test at the 90% (95%)
confidence limit are listed with a single (double) asterisk and those
at the 99% confidence limit are listed in bold.
OND JFM AMJ JAS
40-yr trend 0.68 0.04 0.70 0.05 0.82 0.03 0.77 0.03
30-yr trend 0.60 0.04 0.48 0.05 0.85 0.04 0.80 0.04
20-yr trend 0.66 0.06 0.13 0.02 0.73 0.04 0.78 0.04
10-yr trend 0.68** 0.09 20.09 20.01 0.56* 0.03 0.42 0.02
15 AUGUST 2009 N O T E S A N D C O R R E S P O N D E N C E 4419

FIG
.1
.(a
)T
he
de
cad
al
tre
nd
inO
cto
be
r,N
ov
emb
er,
an
dD
ece
mb
er
lan
dsu
rfac
ete
mp
era
ture
s,1
98
8–2
007
.(b
)T
he
de
cad
altr
en
din
Jan
ua
ry,
Fe
bru
ary
,a
nd
Marc
hla
nd
surf
ace
tem
per
atu
res,
19
89–
20
08.
Co
lore
dsh
adin
g(8
C);
va
lue
sb
etw
een
20
.25
an
d0
.25
are
sho
wn
ing
ray
an
dm
issi
ng
an
do
cea
nv
alu
esa
resh
ow
nin
wh
ite
.(c
)T
he
de
cad
al
tre
nd
inO
cto
be
r,
No
vem
ber
,a
nd
De
cem
be
rla
nd
surf
ace
tem
pe
ratu
res,
19
88–
20
07
,si
mu
late
db
yC
MIP
3G
CM
s.(d
)T
he
de
cad
al
tre
nd
inJa
nu
ary
,F
eb
rua
ry,
an
dM
arc
hla
nd
surf
ace
tem
pe
ratu
res,
19
89–
20
08
,sim
ula
ted
by
CM
IP3
GC
Ms.
Co
lore
dsh
adin
g(8
C);
va
lue
sb
etw
ee
n2
0.2
5a
nd
0.2
5a
resh
ow
nin
gra
ya
nd
mis
sin
ga
nd
oce
an
va
lues
are
sho
wn
inw
hit
e.T
wel
ve
mo
de
lsu
sed
for
en
sem
ble
me
an
incl
ud
eB
jerk
ne
sC
en
ter
for
Cli
ma
teR
ese
arc
h-B
erg
en
Cli
ma
teM
od
el
2.0
(BC
CR
-BC
M2
.0);
Ca
na
dia
nC
en
tre
for
Cli
ma
teM
od
ell
ing
an
dA
nal
ysi
s(C
CC
ma
)C
ou
ple
d
Gen
era
lC
ircu
lati
on
Mo
del,
vers
ion
3.1
(CG
CM
3.1
);C
en
tre
Nati
on
al
de
Rech
erc
hes
Mete
oro
logiq
ues
Co
up
led
Glo
bal
Cli
mate
Mo
del,
vers
ion
3(C
NR
M-C
M3);
Geo
ph
ysi
cal
Flu
id
Dy
na
mic
sL
abo
rato
ryC
lim
ate
Mo
de
lv
ers
ion
2.0
(GF
DL
CM
2.0
);G
od
dar
dIn
stit
ute
for
Sp
ace
Stu
die
s(G
ISS
);In
stit
ute
of
Atm
osp
he
ric
Ph
ysi
cs(I
AP
);Is
titu
toN
azi
on
ale
di
Ge
ofi
sica
e
Vu
lcan
olo
gia
(IN
GV
);In
stit
ute
of
Nu
me
rica
lM
ath
em
ati
csC
ou
ple
dM
od
el,
ve
rsio
n3
.0(I
NM
-CM
3.0
);L
’In
stit
ut
Pie
rre
-Sim
on
Lap
lace
Co
up
led
Mo
de
l,v
ers
ion
4(I
PS
LC
M4
);M
e-
teo
rolo
gic
al
Inst
itu
teo
fth
eU
niv
ers
ity
of
Bo
nn
EC
HO
-GM
od
el
(MIU
BE
CH
OG
);M
ax
Pla
nck
Inst
itu
teO
cea
nM
od
el
(MP
I-O
M);
an
dH
ad
ley
Ce
ntr
eG
lob
al
En
vir
on
me
nta
lM
od
el
ve
rsio
n1
–M
etO
ffice
(Ha
dG
EM
1–
UK
MO
).P
lea
sere
fer
toM
ee
hl
et
al.
(20
07)
for
mo
red
eta
ils
on
the
ind
ivid
ua
lm
od
els
.
4420 J O U R N A L O F C L I M A T E VOLUME 22

of interannual global climate variability, also cannot be
evoked as influential in the observed 2-decade temper-
ature trends. The period began and ended with strong
La Nina events with a strong El Nino in the middle.
Furthermore, we regressed the Nino-3.4 index with sur-
face temperatures and computed the observed trends
both with and without the temperature anomalies asso-
ciated with ENSO variability and found ENSO to have
little impact on recent temperature trends (not shown).
Do GCMs forced with increasing GHGs simulate the
temperature trends for the period of 1988–2008 similar
to the observed trends? As discussed in the introduction,
GCM modeling studies predict future warming for all
four boreal seasons with winter amplification and with
preferential warming over the continents relative to the
oceans. Also in Fig. 1, we plot the mean simulated
temperature trend from an ensemble of models used in
the CMIP3 project for both OND (Fig. 1c) and JFM
(Fig. 1d) of 1988–2008. Model-simulated trends show
widespread hemispheric warming for both seasons.
Thus, the atmosphere–ocean coupled models forced
with increased GHGs are correctly simulating the OND
hemispheric warming trend, but not the observed JFM
cooling trend over many parts of the NH extratropical
landmasses.
What can explain mid- to late-winter NH tropospheric
cooling of a magnitude that negates increasing GHGs,
decreasing ozone, a diminished cryosphere, and a warm
start in the troposphere during the NH cold months?
While natural variability is to be expected even under a
secular global warming trend, it is difficult to explain
asymmetric temporal trends in the cool half of the bo-
real year based on known modes of variability.
We propose anomalies and trends in stratosphere–
troposphere coupling as a significant forcing of the ob-
served winter temperature trends. Planetary-scale waves
that propagate from the troposphere into the strato-
sphere control the zonal-mean stratospheric circulation
and its variability (Charney and Drazin 1961; Matsuno
1970). More recent work suggests that the zonal-mean
stratospheric circulation can in turn exert a downward
influence on the zonal-mean tropospheric circulation
(Baldwin and Dunkerton 2001).
Stratospheric temperatures are predicted to cool in
response to tropospheric warming forced by anthropo-
genic climate change (Pawson et al. 1998). How the
cooling is distributed may not be solely dependent on
radiative changes, but also dynamical ones. The cooling
is predicted to be greatest in the polar stratosphere be-
cause of more frequent positive polarity events of the
NAM and the Southern annular mode (SAM) forced
by increased GHGs and decreased stratospheric ozone
(Shindell et al. 1999; Thompson and Solomon 2002; Gillett
and Thompson 2003). Positive trends in the NAM and
SAM would result in polar stratospheric cooling and
tropical stratospheric warming; and while mean hemi-
spheric stratospheric temperatures have been observed
to cool, the cooling is most robust in the tropics while
temperature trends in the extratropics are not statisti-
cally significant (Thompson and Solomon 2005). There-
fore, not only have winter tropospheric temperatures
unexpectedly cooled, polar stratospheric temperatures
have unexpectedly warmed (Cohen and Barlow 2005;
see also Fig. 2d). Furthermore, polar stratospheric cool-
ing has been observed in the Southern Hemisphere but
not in the Northern Hemisphere; so, what is forcing the
asymmetry between the Northern and Southern polar
stratospheres?
It has been demonstrated that tropospheric circula-
tion anomalies associated with the NAM originate in
the stratosphere and propagate down to the surface
(Baldwin and Dunkerton 2001). In an effort to better
understand the origins and timing of stratosphere–
troposphere coupling, an index was developed and is
referred to as the stratosphere–troposphere coupling
index (STCI). This index demonstrates a preference for
stratosphere–troposphere coupling in the December–
January time frame (Cohen et al. 2007). This suggests
that upwelling energy generated by tropospheric Rossby
waves in the fall is most likely to influence the polarity
of the stratospheric NAM index in January, which leads
to a same-sign polarity of the tropospheric NAM index
in January and the subsequent winter months. It was
further demonstrated that this midwinter stratosphere–
troposphere coupling is linked to the previous Eurasian
October snow cover.
The STCI and October snow cover area index from
1948/49 through 2007/08 are plotted in Fig. 2a. Here we
extend this land–atmosphere coupling from interannual-
to decadal-scale variability and trends. The last 20 yr of
both time series are characterized by a statistically sig-
nificant increasing trend. This increasing trend in strato-
sphere coupling and snow cover extent forces more
frequent negative polarity of the NAM and its associ-
ated temperature pattern. As will be shown below, this
pattern is associated with a clear decrease in tempera-
tures during late boreal winter over the same time pe-
riod, a decrease that is made all the more remarkable by
the secular global warming occurring throughout the
rest of the year. The trend in October NH snow cover
shows an overall increasing frequency over a large and
coherent region of Eurasia (Fig. 2b). An increase in
October Eurasian snow cover has been shown to force
upwelling tropospheric energy associated with Rossby
waves into the stratosphere in subsequent months, but in
particular in December (Saito et al. 2001; Gong et al.
15 AUGUST 2009 N O T E S A N D C O R R E S P O N D E N C E 4421

FIG. 2. (a) Plot of the normalized anomalies for the stratosphere–troposphere coupling index (blue), October Eurasian
snow cover (red) for the years 1948/49 through 2007/08, and the JFM NAM index (green; multiplied by 21 for ease of
comparison) 1949–2008. Also plotted is the linear trend for the most recent 20 yr (solid line). (b) Decadal trend in frequency
of October snow cover in percent, 1988–2007. (c) Decadal trend in December upward component of 100-hPa wave activity
flux (m2 s22) (3 5 3 101), 1988–2007. (d) Decadal trend in January 50-hPa temperatures (8C), 1989–2008. (e) Decadal trend
in January, February, and March sea level pressure (hPa), 1989–2008. (b)–(e) Positive trend values (red) and negative trend
values (blue) are denoted.
4422 J O U R N A L O F C L I M A T E VOLUME 22

2003; Cohen et al. 2007; Fletcher et al. 2009). Dynamical
arguments for the link between snow cover and verti-
cally propagating energy from Rossby waves are beyond
the scope of this paper (please refer to these references
and further references cited within for full dynamical
arguments). Trends of this upwelling energy, referred to
as upward wave activity flux (WAF), reveal a 2-decade-
long increasing trend over the region of increasing
snow cover and in the region of greatest variability of
the hemispheric WAF (Fig. 2c). Such a trend has been
shown to increase stratosphere–troposphere coupling
resulting in more frequent stratospheric warmings.
Consistent with the increasing trend, there has been an
unprecedented increase in the frequency of the 20-yr
period of 1988–2008, with no observed major midwinter
warmings (MMW) in the first half of the record and at
least nine observed MMW in the latter half of the record
(Manney et al. 2005; Charlton and Polvani 2007).
The increased upwelling energy from the troposphere
into the stratosphere in December would most directly
impact stratospheric temperatures in January; polar
stratospheric temperature trends over the past 20 yr
exhibit warming (Fig. 2d) despite the opposite forcing
from increased GHGs, depleted ozone, and predictions
of polar stratospheric cooling. Stratospheric circulation
anomalies then propagate down through the tropo-
sphere all the way to the surface and can force one po-
larity of the NAM index predominately for up to
3 months (Baldwin and Dunkerton 2001). Trends in
SLP for the months of January–March (Fig. 2e) show a
dipole of increasing pressure over the high latitudes and
decreasing pressures over the midlatitudes, especially in
the North Atlantic sector. This pattern of variability
closely resembles the negative polarity of the NAM
pattern of variability. In Fig. 2a we also included the
JFM NAM index, (multiplied by 21 for ease of com-
parison) and not surprisingly the NAM index is ob-
served to be in a statistically significant decreasing trend
over the 20-yr period since 1989. The negative NAM
trend in the late-winter months is also consistent with
the observed polar stratospheric warming in January for
the same period (Baldwin and Dunkerton 2001; Cohen
et al. 2007). Therefore, the increased snow cover in
October, the increased WAF in the late fall, and the
changes in the stratospheric circulation in midwinter
force a lower-tropospheric response that closely resem-
bles the negative polarity of the NAM index beginning in
January and continuing through the late-winter months.
Presumably, once the dynamically forced cooling has
come to its natural conclusion in the late winter and early
spring, radiative forced warming resumes.
Finally, in Fig. 3a, we plot the trend of JFM NH
temperatures, but first we remove the temperature
anomalies regressed with the NAM index over the pe-
riod. The temperature trend is qualitatively changed
from one of mixed temperature trends or even one of
cooling to one of clearly warming. We plot in Fig. 3b the
difference between Fig. 3a and Fig. 1b, which gives the
decadal temperature trend for JFM attributable to
NAM variability during the 20-yr period. The negative
trend in the NAM index over the past 2 decades has
contributed much of the observed cooling over the pe-
riod. In Fig. 3c we repeat the analysis in Fig. 3b, but the
temperature anomalies regressed with the areal extent
of October Eurasian snow cover are removed prior to
computing the difference from Fig. 1b. The result is
qualitatively the same as in Fig. 3b; a large percentage of
the decadal temperature trend for JFM is attributable to
the increasing snow cover trend during the 20-yr period.
We computed the area-weighted pattern correlation for
the extratropical NH between Figs. 3b and 3c, and the
value is equal to 0.83. The biggest difference between
the two plots is the magnitude, with the degree of
cooling associated with the snow cover equal to about
40% of the cooling associated with the NAM. This value
is consistent with the correlation of ;0.6 computed be-
tween Eurasian snow cover and the STCI.
We argue that the positive trend in snow cover has
contributed a significant fraction of the observed cooling
in eastern North America and northern Eurasia, where
snow cover is significantly correlated with winter tem-
peratures (Cohen and Fletcher 2007). Repetition of the
analysis in Fig. 3c with the STCI instead provides es-
sentially the same result (not shown). Therefore, much
of the recently observed late-winter cooling across the
NH is a response to increased October Siberian snow
cover, increased WAF mainly over Eurasia, and increased
stratosphere–troposphere coupling forcing a dynamical
response in the hemispheric circulation. This dynamical
forcing has resulted in both stratospheric polar warming
and lower-tropospheric cooling over the NH landmasses
and has largely masked the global warming trend that is
much more apparent earlier in the spring, summer, and
fall. While the bulk of the cooling is linearly associated
with this mechanism, there appear to be secondary fac-
tors as well, which we are investigating.
Coupled GCMs have been shown to poorly simulate
stratosphere–troposphere coupling and its associated link
with snow cover extent. Hardiman et al. (2008) dem-
onstrated that while the correlation between observed
October snow cover extent and the STCI is close to 0.6,
in the coupled GCMs that participated in CMIP3, the
correlations for all GCMs are clustered around zero.
Furthermore, the correlation between December WAF
and January SLP is also much lower in the CMIP3
GCMs than that observed. These deficiencies in coupled
15 AUGUST 2009 N O T E S A N D C O R R E S P O N D E N C E 4423
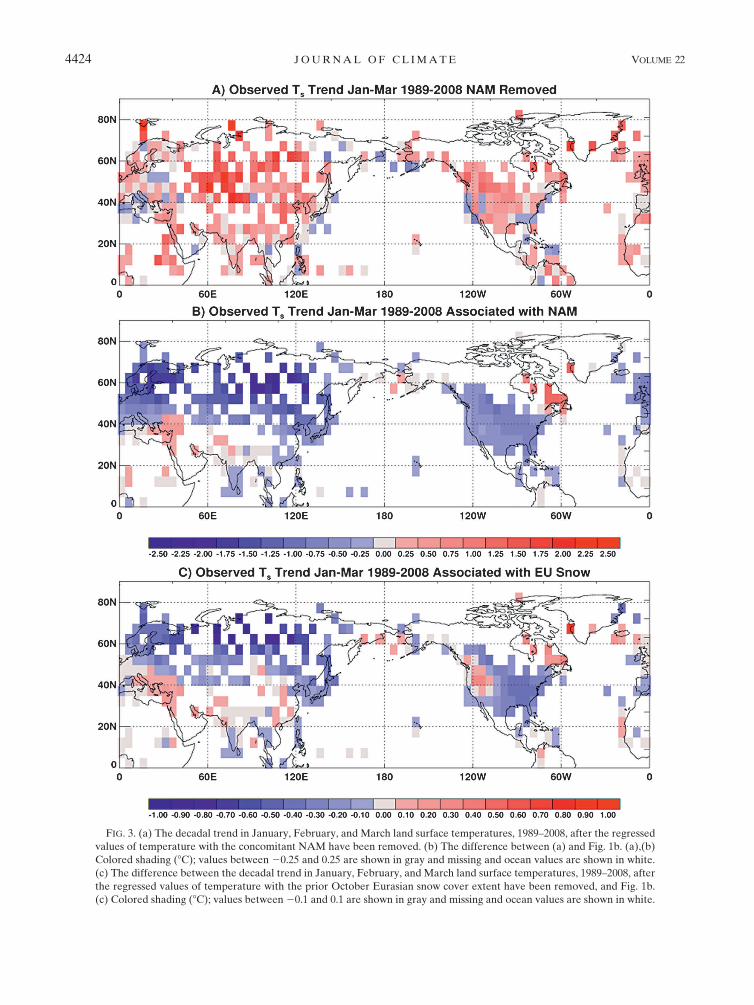
FIG. 3. (a) The decadal trend in January, February, and March land surface temperatures, 1989–2008, after the regressed
values of temperature with the concomitant NAM have been removed. (b) The difference between (a) and Fig. 1b. (a),(b)
Colored shading (8C); values between 20.25 and 0.25 are shown in gray and missing and ocean values are shown in white.
(c) The difference between the decadal trend in January, February, and March land surface temperatures, 1989–2008, after
the regressed values of temperature with the prior October Eurasian snow cover extent have been removed, and Fig. 1b.
(c) Colored shading (8C); values between 20.1 and 0.1 are shown in gray and missing and ocean values are shown in white.
4424 J O U R N A L O F C L I M A T E VOLUME 22

GCMs would make it highly unlikely for GCMs to
simulate observed temperature trends resulting from
trends in snow cover and/or stratosphere–troposphere
coupling.
4. Conclusions
Over the past 4 decades the globe has experienced
accelerated warming, with the majority of that warming
occurring in the most recent 2 decades. When the NH
cold months are analyzed in aggregate, the observed
trends are consistent with expectations: there is almost
universal warming, with the largest warming trend bi-
ased toward higher latitudes. However, when the early
and late months of the cold season are analyzed sepa-
rately, the two periods are observed to have notable
asymmetric temperature trends. For large regions of the
extratropical Northern Hemisphere landmasses, the
warming is skewed toward the first half of the cold
season. A marked trend reversal appears in January,
with hemispheric-wide warming in OND but large areas
of cooling in JFM and concomitant polar stratospheric
warming.
Whether or not this trend reversal continues, it is
important to understand the physics of the underlying
mechanism for a more complete understanding and more
accurate predictions for anthropogenically forced climate
change; the trend reversal also provides a useful model
test.
What dynamic forcings could contribute to reversing
the radiative warming forced by both increased GHGs
and decreased planetary albedo resultant of a shrinking
cryosphere? Our analysis argues that the temperature
trend reversal commences in the stratosphere where
increased absorption of anomalous vertical wave activ-
ity flux reverses the polar cooling trend to a warming
trend, which preferentially occurs in January. The de-
scent of the circulation anomalies from the stratosphere
to the troposphere initiates a trend reversal in lower-
tropospheric temperatures in the months of January–
March. The surface temperature trend pattern is most
closely associated with the negative polarity of the
NAM, which has been linked with leading stratospheric
circulation anomalies. These circulation anomalies are,
in turn, linked with increasing Eurasian snow cover
in the fall, consistent with changes to the near-surface
forcing of vertical wave activity by diabatic cooling
(Ringler and Cook 1999). An observed increasing trend
in Eurasian snow cover is the most likely boundary
condition for partially forcing hemispheric trends over
the past 2 decades that has heretofore been identified.
It is expected that global warming will not necessarily
be uniform but may have large variations at regional
scales as the circulation dynamics adjust to the changing
radiative forcing and cryospheric conditions. Here we
have identified a clear asymmetry in recent boreal winter
trends and shown that circulation changes link the recent
late-winter surface cooling trend and polar stratospheric
warming trend to changes in fall snow cover and subse-
quent stratosphere–troposphere coupling. This argues
for a dynamic cause to the observed late-winter changes
that are opposed to the long-term tropospheric warming
trends and stratospheric cooling trends forced partially
or in full by radiative effects of increased GHGs, de-
creased ozone, and a shrinking cryosphere.
Acknowledgments. We thank P. Kushner for his sug-
gestion of removing the NAM from the temperature
trends. JC is supported by the National Science Foun-
dation Grant ATM-0443512 and MB was supported by
National Science Foundation Grants ATM-0621737,
ATM-0603555, and EAR-0811099, and NOAA Grant
NA080AR4310592. KS is supported by the National
Science Foundation under Cooperative Agreement ARC-
0327664. We acknowledge the modeling groups, the
Program for Climate Model Diagnosis and Intercom-
parison (PCMDI) and the WCRP’s Working Group on
Coupled Modelling (WGCM) for their roles in making
the WCRP CMIP3 multimodel dataset available. Sup-
port of this dataset is provided by the Office of Science,
U.S. Department of Energy.
REFERENCES
Baldwin, M. P., and T. J. Dunkerton, 2001: Stratospheric harbin-
gers of anomalous weather regimes. Science, 294, 581–584.
Brohan, P., J. J. Kennedy, I. Harris, S. F. B. Tett, and P. D. Jones,
2006: Uncertainty estimates in regional and global observed
temperature changes: A new dataset from 1850. J. Geophys.
Res., 111, D12106, doi:10.1029/2005JD006548.
Brown, R. D., 2000: Northern Hemisphere snow cover variability
and change 1915–97. J. Climate, 13, 2339–2355.
Charlton, A. J., and L. M. Polvani, 2007: A new look at strato-
spheric sudden warmings. Part I: Climatology and modeling
benchmarks. J. Climate, 20, 449–469.
Charney, J. G., and P. G. Drazin, 1961: Propagation of planetary-
scale disturbances from the lower into the upper atmosphere.
J. Geophys. Res., 66, 83–109.
Cohen, J., and M. Barlow, 2005: The NAO, the AO, and global
warming: How closely related? J. Climate, 18, 4498–4513.
——, and C. Fletcher, 2007: Improved skill for Northern Hemi-
sphere winter surface temperature predictions based on land–
atmosphere fall anomalies. J. Climate, 20, 4118–4132.
——, M. Barlow, P. J. Kushner, and K. Saito, 2007: Stratosphere–
troposphere coupling and links with Eurasian land surface
variability. J. Climate, 20, 5335–5343.
Fletcher, C., S. C. Hardiman, P. J. Kushner, and J. Cohen, 2009:
The dynamical response to snow cover perturbations in a large
ensemble of atmospheric GCM integrations. J. Climate, 22,
1209–1222.
15 AUGUST 2009 N O T E S A N D C O R R E S P O N D E N C E 4425

Gillett, N. P., and D. W. J. Thompson, 2003: Simulation of recent
Southern Hemisphere climate change. Science, 302, 273–275.
Gong, G., D. Entekhabi, and J. Cohen, 2003: Modeled Northern
Hemisphere winter climate response to realistic Siberian snow
anomalies. J. Climate, 16, 3917–3931.
Graversen, R. G., T. Mauritsen, M. Tjernstrom, E. Kallen, and
G. Svensson, 2008: Vertical structure of recent Arctic warm-
ing. Nature, 541, 53–56.
Groisman, P. Ya., T. R. Karl, and R. W. Knight, 1994: Observed
impact of snow cover on the heat valance and the rise of
continental spring temperatures. Science, 263, 198–200.
Hansen, J., and L. Nazarenko, 2004: Soot climate forcing via snow
and ice albedos. Proc. Natl. Acad. Sci. USA, 101, 423–428.
Hardiman, S. C., P. J. Kushner, and J. Cohen, 2008: Investigating
the ability of general circulation models to capture the effects
of Eurasian snow cover on winter climate. J. Geophys. Res.,
113, D21123, doi:10.1029/2008JD010623.
Kalnay, E., and Coauthors, 1996: The NCEP/NCAR 40-Year Re-
analysis Project. Bull. Amer. Meteor. Soc., 77, 437–471.
Manney, G. L., K. Kruger, J. L. Sabutis, S. A. Sena, and S. Pawson,
2005: The remarkable 2003–2004 winter and other recent
warm winters in the Arctic stratosphere since the late 1990s.
J. Geophys. Res., 110, D04107, doi:10.1029/2004JD05637.
Matsuno, T., 1970: Vertical propagation of stationary planetary
waves in the winter Northern Hemisphere. J. Atmos. Sci., 27,
871–883.
Meehl, G. A., C. Covey, T. Delworth, M. Latif, B. McAvaney,
J. F. B. Mitchell, R. J. Stouffer, and K. E. Taylor, 2007: The
WCRP CMIP3 multimodel dataset: A new era in climate
change research. Bull. Amer. Meteor. Soc., 88, 1383–1394.
Pawson, S., K. Labitzke, and S. Leder, 1998: Stepwise changes in
stratosphere temperature. Geophys. Res. Lett., 25, 2157–2160.
Ringler, T. D., and K. H. Cook, 1999: Understanding the season-
ality of orographically forced stationary waves: Interactions
between mechanical and thermal forcing. J. Atmos. Sci., 56,
1154–1174.
Robinson, D. A., F. Dewey, and R. Heim Jr., 1993: Northern
Hemispheric snow cover: An update. Bull. Amer. Meteor. Soc.,
74, 1689.
Rosenzweig, C., and Coauthors, 2008: Attributing physical and
biological impacts to anthropogenic climate change. Nature,
453, 353–357.
Saito, K., J. Cohen, and D. Entekhabi, 2001: Evolution in atmo-
spheric response to early-season Eurasian snow cover anom-
alies. Mon. Wea. Rev., 129, 2746–2760.
Shindell, D. T., R. L. Miller, G. A. Schmidt, and L. Pandolfo, 1999:
Simulation of recent northern winter climate trends by
greenhouse-gas forcing. Nature, 399, 452–455.
Solomon, S., D. Qin, M. Manning, M. Marquis, K. Averyt,
M. M. B. Tignor, H. L. Miller, and C. Zhenlin, Eds., 2007:
Climate Change 2007: The Physical Science Basis. Cambridge
University Press, 996 pp.
Stine, A. R., P. Huybers, and I. Y. Fung, 2009: Changes in the
phase of the annual cycle of surface temperature. Nature, 457,
435–440.
Stott, P. A., D. A. Stone, and M. R. Allen, 2004: Human contri-
bution to the European heatwave of 2003. Nature, 432,
610–614.
Stroeve, J., M. Serreze, S. Drobot, S. Gearhead, M. Holland,
J. Maslanik, W. Meir, and T. Scambos, 2008: Arctic sea ice
extent plummets in 2007. Eos, Tans. Amer. Geophys. Union,
89, doi:10.1029/2008EO020001.
Thompson, D. W. J., and J. M. Wallace, 2000: Annular modes in the
extratropical circulation. Part I: Month-to-month variability.
J. Climate, 13, 1000–1016.
——, and S. Solomon, 2002: Interpretation of recent Southern
Hemisphere climate change. Science, 296, 895–899.
——, and ——, 2005: Recent stratospheric climate trends as evi-
denced in radiosonde data: Global structure and tropospheric
linkages. J. Climate, 18, 4785–4795.
Wilks, D. S., 2006: Statistical Methods in the Atmospheric Sciences.
2nd ed. Academic Press, 467 pp.
4426 J O U R N A L O F C L I M A T E VOLUME 22