Decadal climate variability: Societal impacts, Phenomena...
33
Vikram Mehta The SORCE Science Team meeting; Meredith, New Hampshire 27-29 October 2004 Decadal climate variability: Societal impacts, Phenomena, Problems, and Prospects Vikram M. Mehta The Center for Research on the Changing Earth System, Columbia, Maryland, USA What is decadal climate variability? From Athenian irrigation in 400 BC to Zimbabwe corn in 2000 AD Are these slowly-evolving physical phenomena or mere wiggles in time series of observations? …so many problems in this field, we better find another problem!! Oh, don’t run away!! There is hope. Summary
Transcript of Decadal climate variability: Societal impacts, Phenomena...

Vikram Mehta The SORCE Science Team meeting; Meredith, New Hampshire 27-29 October 2004
Decadal climate variability: Societal impacts, Phenomena, Problems, and Prospects
Vikram M. MehtaThe Center for Research on the Changing Earth System, Columbia, Maryland, USA
What is decadal climate variability?
From Athenian irrigation in 400 BC to Zimbabwe corn in 2000 AD
Are these slowly-evolving physical phenomena or mere wiggles in time series of observations?
…so many problems in this field, we better find another problem!!
Oh, don’t run away!! There is hope.
Summary

Vikram Mehta The SORCE Science Team meeting; Meredith, New Hampshire 27-29 October 2004
What is decadal climate variability?
Periodic or quasi-periodic phenomenon with an approximately 10-20 years period
”Bursts” or groups of higher frequency phenomena, e.g., El Niño-La Niña, hurricanes and other tropical cyclones, extreme precipitation or heat events, …., occurring every 10-20 years
Abrupt, in approximately 5-20 years, transitions between climate states

Vikram Mehta The SORCE Science Team meeting; Meredith, New Hampshire 27-29 October 2004
Periods in decadal climate variability researchPeriods in decadal climate variability research
The pre-modern period: Statistical Sunspots-climate relationships; 400 BC-1980 ADIrrigation engineer Meton of Athens (c. 400 BC): Connection between Sunspots and climate cause variability in precipitation Sir William Herschel (1801): Price of wheat in London indirectly controlled by decadal variability of SunspotsCottage industry in 19th and early 20th centuries to predict weather and climate from SunspotsDisrepute due to correlation reversals, prediction failures, and inability to test hypothesized mechanisms with modelsPublications in refereed journals till the 1980s
The modern period: First demonstrations of interannual-decadal climate variability with ocean-atmosphere models; 1980-1994
Busalacchi and O’Brien, 1980, JPO; 1981, JGRLau, 1981: JASMcCreary, 1983; McCreary and Anderson, 1984: MWRPhilander et al., 1983, 1984,1985: Nature, JASCane and Zebiak, 1985: ScienceHirst, 1986, 1988: JASSchopf and Suarez, 1988: JASBattisti and Hirst, 1989: JASZebiak and Cane, 1987: MWRMehta, 1991, 1992: Clim.Dyn., J.Clim.Latif and Barnett, 1994: Science
The post-modern period: The topic of this talk: 1994-

Vikram Mehta The SORCE Science Team meeting; Meredith, New Hampshire 27-29 October 2004
Societal ImpactsSocietal Impacts

Vikram Mehta The SORCE Science Team meeting; Meredith, New Hampshire 27-29 October 2004
Water and civilizationsWater and civilizationsFresh water the lifeblood of civilizations
Development of ancient civilizations near major rivers such as the Nile, the Euphrates-Tigris, the Indus, the Ganges, and the Yangtze
Spurts in the evolution of civilizations on their banks related to extremes of flow in these and other important river systems driven by climate variability and change
Association between availability of fresh water, the rise of civilization and societal well-being or vulnerability (susceptibility to damage), depends heavily on population and population density, internal cohesion, infrastructure and the resilience deliberately or inadvertently built into the society
The vulnerability also depends on socio-economic-political-religious dynamics of the society
Strains due to these dynamics (sometimes with geopolitical consequences) can be improved or exacerbated by climate variability and changes

Vikram Mehta The SORCE Science Team meeting; Meredith, New Hampshire 27-29 October 2004
Impacts of water scarcity on civilizationsImpacts of water scarcity on civilizations[Adapted from: Elhance, A.P.: Hydropolitics in the 3rd World. United States Institute of Peace, 1999]
DecreasedPrecipitation;
reduced stream flow
Othernatural
phenomena
Populationgrowth
Basinwidehuman
activities
1
Waterscarcity
2
Environ.degradation
3High
mortality/morbidity
4Reducedqualityof life
5Diminishedagriculturalproduction
6Diminishedindustrial
production
8Economic
decline
7Socialunrest
9Migration/
displacement
10Domesticupheaval
11Nationalinsecurity
12Potential
internationalconflict

Vikram Mehta The SORCE Science Team meeting; Meredith, New Hampshire 27-29 October 2004
Decadal climate variability and impacts in recent timesDecadal climate variability and impacts in recent times
Long history of decadal variability in precipitation, surface temperature, river flow, droughts, …; especially in regions where there are long records (Europe, Asia, North America)Decade-long droughts in the North American Great Plains and consequent societal impacts, including out-migration of people, especially in the 1890s and the 1930sDecadal variability in precipitation, stream flow, fish catch, and forest fires in the Pacific Northwest, and in precipitation in the southwest U.S. and Mexico Socio-economic-political instability in Brazil due to multiyear to decadal droughts in northeast BrazilThe Sahelian drought in the 1970s-1980s-1990s and consequent societal impactsMultiyear to decadal droughts in Pakistan and Afghanistan in the 1980s and 1990s and consequent socio-economic-political upheavals, with geopolitical consequencesDecadal-multidecadal variability in the Indian monsoon rainfallDecadal-multidecadal variability in numbers of hurricanes and other tropical cyclones…

Vikram Mehta The SORCE Science Team meeting; Meredith, New Hampshire 27-29 October 2004
ProblemsProblems

Vikram Mehta The SORCE Science Team meeting; Meredith, New Hampshire 27-29 October 2004
Problems in decadal climate variability researchProblems in decadal climate variability research
DataRelatively short time series of instrument observations, especially over and in the oceans; high and stable data quality required Instrument data quality, especially over the oceans, not well-known; quality of backward-extended instrument data dubiousObserving system changes make identifying physical climate variability from all-inclusive model-assimilated data difficultUnambiguous interpretation of physical climate variables derived from proxy data difficult
Analysis and interpretationUncertainty about decadal spectral peaksResearch guided by only one analysis technique, e.g. empirical orthogonal functions, confusing and misleadingA large number of mechanisms proposed, but no consensus on a small subset and not enough instrument data for verification of model-simulated variabilityPendulum has swung the other way: current mechanisms all about internally-generated decadal variability
PredictabilityLong-term predictability research stymied by exclusive use of short-term climate prediction modelsWhat would be useful to societies if it can be predicted at multiyear to multidecadal lead times with some skill? Who will use the predicted information and how will it be used?
GeneralThe importance of research on geophysical variability at these “civilization” timescales not recognized much in the scientific community and in the U.S. funding agencies

Vikram Mehta The SORCE Science Team meeting; Meredith, New Hampshire 27-29 October 2004
PhenomenaPhenomena

Vikram Mehta The SORCE Science Team meeting; Meredith, New Hampshire 27-29 October 2004
The North Atlantic Oscillation
• A stronger subtropical high and a weakerIcelandic low
• Stronger north-south pressure gradient results in more frequent and stronger winter storms on a more northern track
• This leads to warm-wet winters in northern Europe and cold-dry winters in Canada and Greenland
©Visbeck©Hurrell
The positive NAO-Index phase The negative NAO-Index phase
Bader [Hawaii, 2004]
The NAO Index
• A weaker subtropical high and a stronger Icelandic low
• Weaker north-south pressure gradient results infewer and weaker winter storms on a more southern track
• Cold-dry winters in northern Europe and cold-snowy winters over the US east coast
SLP difference between Iceland and the Azores/Lisbon/Gibraltar is averaged and normalized from November through March

Vikram Mehta The SORCE Science Team meeting; Meredith, New Hampshire 27-29 October 2004
Impacts of the NAO: EconomyBader [Hawaii, 2004] ©PREDICATE
•The annual heating oil consumptionin Norway varies in anticorrelationwith the NAO
•Correlation of NAO with precipitation results in variabilityin hydropower generation

Vikram Mehta The SORCE Science Team meeting; Meredith, New Hampshire 27-29 October 2004
Arctic Ocean circulation regimes: 1900-2002Proshutinsky and Dukhovskoy [Hawaii, 2004]*
* Presented in the CRCES-IPRC Workshop on Decadal Climate Variability; Kona, Hawaii; 23-26 Feb. 2004;sponsored by NASA-Ocean., NSF-Clim. Dyn., and NOAA/OGP; available from http://www.DecVar.org/auditorium.php

Vikram Mehta The SORCE Science Team meeting; Meredith, New Hampshire 27-29 October 2004
River discharge anomalies (cubic km. per year; Shiklomanov et al., 2000, updated)
Proshutinsky and Dukhovskoy [Hawaii, 2004]
River discharge – blue solid and dotted
AOO
NAO
Correlation between river runoff and AOO is 93%.

Vikram Mehta The SORCE Science Team meeting; Meredith, New Hampshire 27-29 October 2004
Arctic climate since1900Proshutinsky and Dukhovskoy [Hawaii, 2004]
• SLP decreases over the Arctic• Ice area, ice thickness, and ice volume decrease• Air temperature, precipitation, sea level, river discharge,
permafrost temperature increase• Wind driven ice and water circulation alternates between
cyclonic and anticyclonic• Climatic indices show more or less stable conditions
before 1940 and then have a well pronounced decadal variability and trends associated with the increase of cyclonicity over the Arctic Ocean.

Vikram Mehta The SORCE Science Team meeting; Meredith, New Hampshire 27-29 October 2004
Atlantic Multidecadal Oscillation Enfield et al., 2001
Vikram Mehta The SORCE Science Team meeting; Meredith, New Hampshire 27-29 October 2004
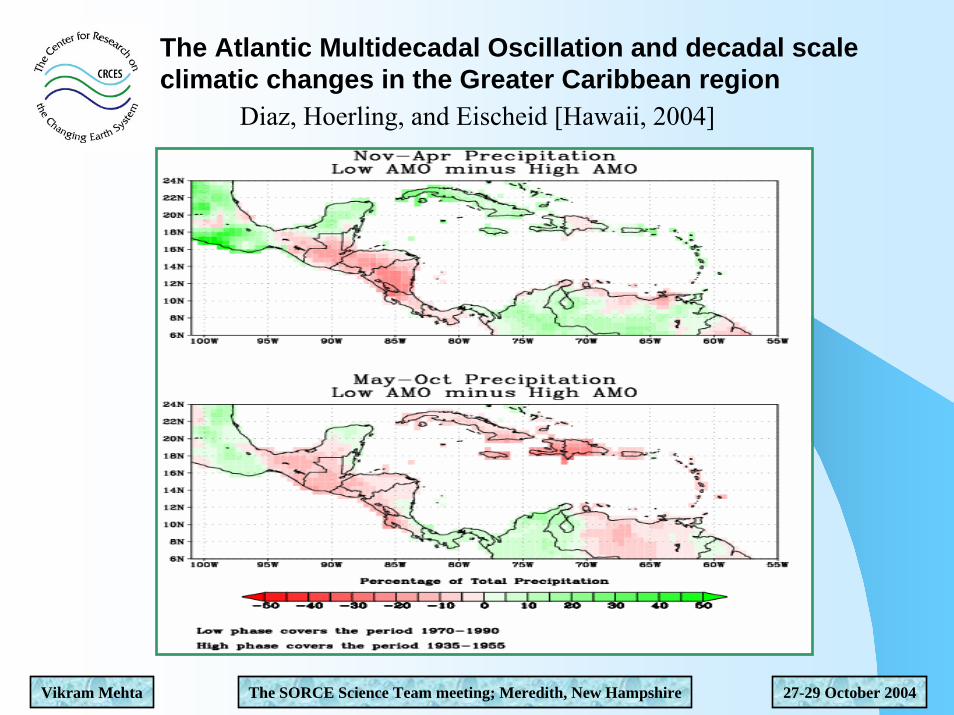
The Atlantic Multidecadal Oscillation and decadal scale climatic changes in the Greater Caribbean region
Diaz, Hoerling, and Eischeid [Hawaii, 2004]

Vikram Mehta The SORCE Science Team meeting; Meredith, New Hampshire 27-29 October 2004
The tropical Atlantic decadal variability and northeast Brazil rainfall
Dominant pattern of tropical-subtropical Atlantic sea-surface temperature (SST) variability between 1881 and 1990 shows opposite phase anomalies in North and South Atlantic (Fig. a), with maximum variances at 15ºN and 15ºS (Fig. b)The 110-years long SST time series modulating this pattern (Fig. c) and its Fourier spectrum (Fig. d) clearly show decadal and multidecadalvariabilityLow-pass filtered rainfall in northeast Brazil (solid line in Fig. e) shows opposite phase variability with respect to a low-pass filtered version of the SST time series in Fig. cOscillations of this north-south SST gradient (Fig. a) influence the location of the Inter-Tropical Convergence Zone
Mehta, 1998
e

Vikram Mehta The SORCE Science Team meeting; Meredith, New Hampshire 27-29 October 2004
The Pacific Decadal OscillationCourtesy: Nathan Mantua, Stephen Hare
Univ. of Washington
Major changes in northeast Pacific marine ecosystems have been correlated with phase changes in the PDO; warm eras have seen enhanced coastal ocean biological productivity in Alaska and inhibited productivity off the west coast of the contiguous United States, while cold PDO eras have seen the opposite north-south pattern of marine ecosystem productivity.

Vikram Mehta The SORCE Science Team meeting; Meredith, New Hampshire 27-29 October 2004
Impacts of the Pacific Decadal Oscillation on the Pacific Northwest forests and salmon catchCourtesy: Climate Impacts Group, Univ. of Washington
Low frequency variability in Pacific Northwest tree growth compared to the average winter, five-year running-mean, PDO.
For the period 1922-1995, the number of forest fires burning more than 1,000 acres was higher during warm phase of the PDO (blue bar) than cool phase of the PDO (white bar) in nearly all of the Pacific Northwest’s national forests.
Selected Pacific salmon catch records with PDO signatures. Black (gray) bars denote catches that are greater (less) than the long-term median. The dotted vertical lines mark the PDO polarity reversal times in 1925, 1947, and 1977.

Vikram Mehta The SORCE Science Team meeting; Meredith, New Hampshire 27-29 October 2004
Impacts of the Pacific Decadal Oscillationon on the U.S. temperatures and Columbia River stream flow
High PDO index in February-April is followed by above-average summer temperatures in the western and southeast U.S. and below-average summer temperatures in the northeast U.S.
Courtesy: W. Patzert, JPL; and Climate Impacts Group, Univ. of Washington
The impact of ENSO and PDO on Columbia River summer streamflow at The Dalles, Oregon for 1900-1999. The horizontal lines show average streamflow over each of the PDO epochs (cool: 1900-1925, warm: 1925-1945, cool: 1945-1977, warm: 1977-1995). The red dots are El Niño years, the blue dots are La Niña years, and the green dots are ENSO neutral years. The figure shows "naturalized" streamflow (i.e., with the effects of the dams numerically removed) for April-September of each year.

Vikram Mehta The SORCE Science Team meeting; Meredith, New Hampshire 27-29 October 2004
Importance of the Indo-Pacific Warm Pool in the global climate system
Warmest surface ocean water on the EarthAnnual-average SST≥28°C from approximately 90°E-180°, 20°S-20°N; pronounced annual cycleSaturation vapor pressure non-linearly related to SST⇒dramatic increase in atmospheric moisture content and convection when SST ≥ ≈28.5°CTHE major source of heat for the global atmosphereNumerous studies of possible mechanisms of maintenance of time-average state of the IPWP (Ramanathan and Collins, 1991; Wallace, 1992; Fu et al., 1992; Hartman and Michelsen, 1993; Waliser and Graham, 1993; Waliser, 1996; Sud et al., 1999)Natural variability has not received much attention; influences ENSO and marine ecosystems at interannual timescales (Delcroix et al., 2000; Picaut et al. 2000)
Vikram Mehta The SORCE Science Team meeting; Meredith, New Hampshire 27-29 October 2004
The Warm Pool OscillationClimatology + low-pass filtered sea-surface temperatures
from SODA: 1950-2001 Mehta and Mehta [Hawaii, 2004]

Vikram Mehta The SORCE Science Team meeting; Meredith, New Hampshire 27-29 October 2004
850-mb wind anomalies associated with the Warm Pool Oscillation: 1949-1998
Low-pass (≥8 years) wind anomalies; composited according to the phase of the low-pass filtered, western Pacific Warm Pool SSTNote the equatorial westerlies (1-2 m/s) when Warm Pool less warm(Fig. a) and in the following year (Fig. b)Note the equatorial easterlies (1-2 m/s) when Warm Pool warmer(Fig. c) and in the following year (Fig. d)Also, note coherent mid- and high-latitude wind anomalies in both phases, especially over the North Pacific and the North Atlantic, confirming previous results by Mehta et al. (2000) and Hoerling and Hurrel (2002)
a c
b d
2 m/s
Warm Pool less warm Warm Pool warmerMehta and Mehta [Hawaii, 2004]

Vikram Mehta The SORCE Science Team meeting; Meredith, New Hampshire 27-29 October 2004
Association between global upper-ocean temperature and solar
irradiance at decadal-interdecadal timescalesWhite, Lean, Cayan, and Dettinger; 1997
a b
(a) First EOF and time series of 9-13 years filtered bathythermograph SST anomalies and solar irradiance anomalies from 1955 to 1994; first and second SST EOFs“explain” 50% of filtered variance; SST lags solar irradiance by ~1-2 years (b) First EOF and time series of 18-25 years filtered GISST SST anomalies from 1901 to 1990; “explains” 87% of filtered variance; SST lags solar irradiance ~0-4 years (c) Correlation coefficients, with confidence intervals, as a function of depth between filtered upper-ocean temperature and solar irradiance anomalies from 1955 to 1994; 9-13 years on the left and 18-25 years on the right
c

Vikram Mehta The SORCE Science Team meeting; Meredith, New Hampshire 27-29 October 2004
Influence of solar irradiance on the Indian monsoon rainfall andNiño3 SST at decadal-multidecadal timescales
(a) All-India rainfall and Niño3 SST index(b & c) Decadal variations in correlation coefficients between the two(d) Low-pass (≥ 24 years) filtered All-India rainfall (shaded; std. dev. units) varies coherently with low-pass filtered solar irradiance (dashed line; 2* W/m2); this can be seen even in unfiltered data (solid line).(e) Low-pass filtered Niño3 SST index (shaded; °C) shows less coherent variations and nearly-opposite phase variation with low-pass filtered solar irradiance.Differential heating/cooling of South Asia and the oceans around it can strengthen/weaken the monsoon, but one or more positive feedback processes may be necessary because irradiance changes are small eventhough persistent for one or more decades.
Mehta and Lau, 1997

Vikram Mehta The SORCE Science Team meeting; Meredith, New Hampshire 27-29 October 2004
Association between the decadal-multidecadal WPO and interannual ENSO (1950-2001): Dec-Jan-Feb sea surface temperature and wind stress patterns
El Niño and La Niña events in high-pass (≤7 years) filtered, DJF SST and surface wind stress data: SODA 1950-2001; composited according to decadal-multidecadal phase of the WP SST
Approximately same number but less warm El Niño events when WP warmer at decadal-multidecadaltimescales.
Warmer El Niño events when WP less warm at decadal-multidecadaltimescales; Indian Ocean anomalously warm, mid-high latitude ocean and atmosphere anomalies.
Very few La Niña events when WP warmer; many more La Niña events when WP less warm at decadal-multidecadal timescales.
Mehta and Fayos, submitted, 2004aEl Niño La Niña
WPwarmer
WPlesswarm
Warmminusless warm
9 events
8 events
2 events
15 events
ºC
N/m2

Vikram Mehta The SORCE Science Team meeting; Meredith, New Hampshire 27-29 October 2004
Association between the decadal-multidecadal WPO and interannual ENSO (1950-2001): Dec-Jan-Feb sea-level pressure and lower and upper troposphere zonal wind patterns
El Niño events in high-pass (≤7 years) filtered, DJF SLP and wind data from NCEP-NCAR reanalysis1950-2001; composited according to decadal-multidecadal phase of the WPO
Weak SLP and wind patterns in the tropical Pacific when WP warmer at decadal-multidecadaltimescales; weak global response to weak El Niño (see previous slide)
Strong SLP and wind patterns in the tropical Pacific when WP less warm at decadal-multidecadaltimescales; strong mid-high latitude SLP and upper tropospheric wind response to strong El Niño (see previous slide)
Mehta and Fayos, submitted, 2004b
WPwarmer
15 events
WPwarmer
WPlesswarm
Warmerminuslesswarm
9 events
8 events
SLP (mb) and u850 (m/s) SLP (mb) and u200 (m/s)
SLP shading zonal winds contour
mb

Vikram Mehta The SORCE Science Team meeting; Meredith, New Hampshire 27-29 October 2004
Long-term variability of frequency and intensity of Atlantic hurricanes
0
2
4
6
8
10
12
14
1978
1979
1980
1981
1982
1983
1984
1985
1986
1987
1988
1990
1991
1992
1993
1994
1995
ObservedForecast
T.N. Krishnamurti (pers. comm.)
Atlantic cyclone index (1886-1991)
Interannual-decadal variability of Atlantic hurricane frequency simulated by the FSU global model
Vikram Mehta The SORCE Science Team meeting; Meredith, New Hampshire 27-29 October 2004
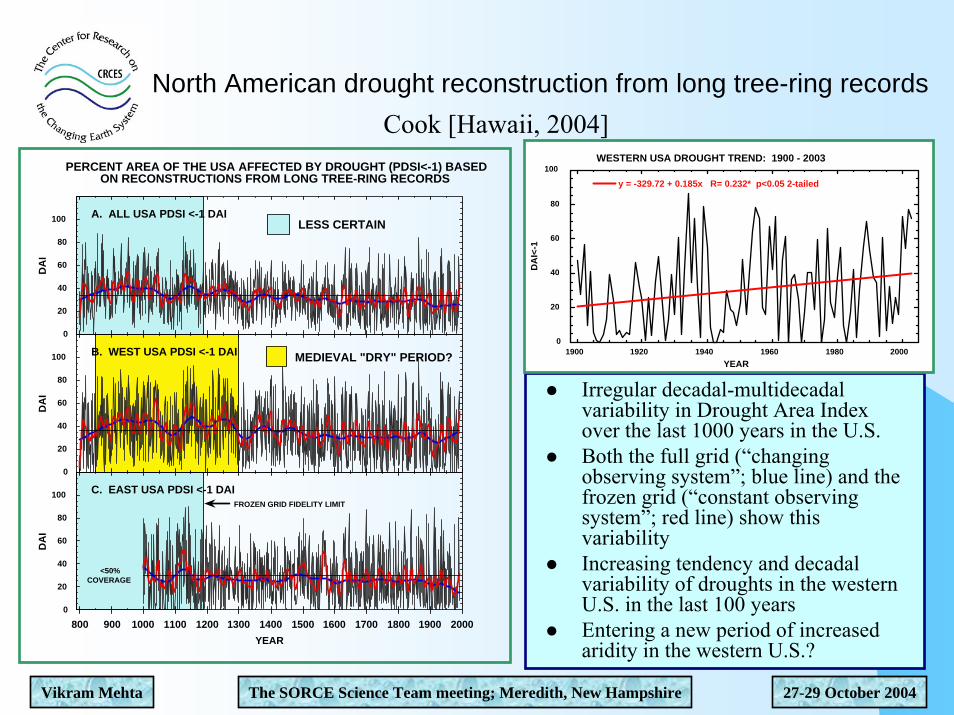
North American drought reconstruction from long tree-ring records
Irregular decadal-multidecadalvariability in Drought Area Index over the last 1000 years in the U.S.Both the full grid (“changing observing system”; blue line) and the frozen grid (“constant observing system”; red line) show this variabilityIncreasing tendency and decadal variability of droughts in the western U.S. in the last 100 yearsEntering a new period of increased aridity in the western U.S.?
0
20
40
60
80
100
800 900 1000 1100 1200 1300 1400 1500 1600 1700 1800 1900 2000
DA
I
C. EAST USA PDSI <-1 DAI
YEAR
<50%COVERAGE
FROZEN GRID FIDELITY LIMIT
0
20
40
60
80
100
DA
I
B. WEST USA PDSI <-1 DAI MEDIEVAL "DRY" PERIOD?
0
20
40
60
80
100
PERCENT AREA OF THE USA AFFECTED BY DROUGHT (PDSI<-1) BASEDON RECONSTRUCTIONS FROM LONG TREE-RING RECORDS
DA
I
A. ALL USA PDSI <-1 DAILESS CERTAIN
0
20
40
60
80
100
1900 1920 1940 1960 1980 2000
WESTERN USA DROUGHT TREND: 1900 - 2003
y = -329.72 + 0.185x R= 0.232* p<0.05 2-tailed
DA
I<-1
YEAR
Cook [Hawaii, 2004]

Vikram Mehta The SORCE Science Team meeting; Meredith, New Hampshire 27-29 October 2004
The Virtual Center for Decadal Climate Variabilityhttp://www.DecVar.org

Vikram Mehta The SORCE Science Team meeting; Meredith, New Hampshire 27-29 October 2004
SummarySummaryDecadal-multidecadal climate variability impacts societies on civilization timescales and is one of the forces guiding the course of history.
Many patterns of decadal climate variability; not obvious that all of them independent and truly oscillatory
Many mechanisms proposed, all but one invoke internal variability in the coupled climate system; the oceans’ role crucial
Success in understanding and prediction of short-term climate variability and long-term climate change, especially at subcontinental to state/province scale, depends crucially on success in understanding and prediction of decadal-multidecadal climate variability
Major problems, including insufficient instrument data, largely unknown quantitative impacts on societies, largely unknown predictability

Vikram Mehta The SORCE Science Team meeting; Meredith, New Hampshire 27-29 October 2004
ProspectsDecadal variability research in danger of becoming parochial, as in the pre-modern periodMust not limit our search for causes of decadal climate variability to internal processes only Variability of external forcings perhaps very important in exciting internal variability; interplay between the twoDecadal climate predictability a function of external forcings and internal variability Decadal variability very important even if greenhouse gas emissions are limited in the futureGrowing research communityThe importance of research on geophysical variability at these civilization timescales not recognized much in the scientific community and in the U.S. funding agenciesSystematic, permanent observing system required to provide high-quality observations, including forcingsSystematic and large-scale effort required to assess impacts in various societal sectorsNext Decadal Climate Variability Workshop in October 2005 somewhere in the Maryland to West Virginia mountains