DEC. 2006 Seoul Development Institute Take Transit, Enjoy More Time for Life SEOUL Challenges for...
15
DEC. 200 6 Seoul Development Institut Take Transit, Enjoy More Time for Life SEOUL SEOUL Challenges Challenges for for Environmentally Environmentally Sustainable Sustainable Transport Transport Dr. GyengChul Kim Department of Urban Transit Seoul Development Institute of SMG ([email protected])
-
Upload
alicia-austin -
Category
Documents
-
view
213 -
download
0
Transcript of DEC. 2006 Seoul Development Institute Take Transit, Enjoy More Time for Life SEOUL Challenges for...

DEC. 2006
Seoul Development InstituteSeoul Development InstituteTake Transit, Enjoy More Time for Life
SEOUL ChallengesSEOUL Challengesfor Environmentally for Environmentally
Sustainable TransportSustainable Transport
Dr. GyengChul Kim
Department of Urban TransitSeoul Development Institute of SMG

DEC. 2006
Seoul Development InstituteSeoul Development InstituteTake Transit, Enjoy More Time for Life
Facts About Facts About SeoulSeoul
With a population of 10 million, Seoul is a world-renowned megalopolis.
It occupies 605 square kilometers or 0.6 % of the nation’s territory.
Seoul is the economic heart of Korea, and has been the key driver of Korea’s economic growth.
Seoul’s GRDP as of 2004 was 187 trillion
dollar (U.S.), according for 23 % the national GDP.
Basic Statistics
Population(2005)
Population(2005) 10.3 10.3 millionmillion10.3 10.3 millionmillion 20.9 %20.9 %20.9 %20.9 %
Area(2005)Area(2005) 605 605 kmkm22605 605 kmkm22 0.6 %0.6 %0.6 %0.6 %
GRDP(2004)GRDP(2004) 187 187 trillion $trillion $187 187 trillion $trillion $ 23.1 %23.1 %23.1 %23.1 %
Companies(2004)
Companies(2004) 740,779740,779740,779740,779 23.2 %23.2 %23.2 %23.2 %
Parkland(2004)
Parkland(2004) 160 160 kmkm22 160 160 kmkm22
Foreign Residents(2005)
Foreign Residents(2005) 129 129 thousandthousand129 129 thousandthousand 1.2 %1.2 %1.2 %1.2 %

DEC. 2006
Seoul Development InstituteSeoul Development InstituteTake Transit, Enjoy More Time for Life
□ Population : doubled
1970 : 5.4 million
2003 : 10.4 million
□ Population : doubled
1970 : 5.4 million
2003 : 10.4 million
□ Registered vehicles : 46 times
1970 : 60 thousands
2003 : 2.8 millions
□ Registered vehicles : 46 times
1970 : 60 thousands
2003 : 2.8 millions
Registered vehicles in Seoul
0
500
1,000
1,500
2,000
2,500
3,000
1970 1975 1980 1985 1990 1995 2000Year
Thou
sand
s
Population of Seoul
0
2,000
4,000
6,000
8,000
10,000
12,000
1970 1975 1980 1985 1990 1995 2000Year
Thou
sand
s Population & Vehicles

DEC. 2006
Seoul Development InstituteSeoul Development InstituteTake Transit, Enjoy More Time for Life
Gridlock of SEOUL in 90’s

DEC. 2006
Seoul Development InstituteSeoul Development InstituteTake Transit, Enjoy More Time for Life
Strategy(PUSH + PULL)
○ Physical (between modes(Station+Stops))○ Network (Railway, Bus, and others)○ Fare (Equity, Providing incentives )○ Information (Seamless transfer)○ Institutional (Custom-based)
○ GREENING of Car Space○ Pedestrian Friendly Street ○ Culture Re-creative Space
□ CAR Space : REFORM
□ Transit System : Integration for Multi-Modal

DEC. 2006
Seoul Development InstituteSeoul Development InstituteTake Transit, Enjoy More Time for Life
○ Revenue based on Number of Passengers
Before
○ Revenue based on Service Distance (Vehkm) + BMS
After
Revenue System Change
Bus Stop
Excessive competitionChaos on roads (interruptions)
Quick Stops and Start Driver vs Passenger FTG
Service Quality
Friendly drivers
No route ownership
Effective route reorg.
Decrease of total op. cost
Decrease of gov. subsidy
Service Quality

DEC. 2006
Seoul Development InstituteSeoul Development InstituteTake Transit, Enjoy More Time for Life
Results of Bus Re-routing
Increase - Network Capacity new Bus Route +BRT - Bus ridership - Bus Frequency( Keep Interval )Decrease – Total Bus Operation Cost Increase - Bus Company Revenue Decrease – Subsidy of SMG

DEC. 2006
Seoul Development InstituteSeoul Development InstituteTake Transit, Enjoy More Time for Life
※ Status of Existing Bus Lanes(2005) ▷Exclusive median bus lanes: 7 lines/ 84㎞ ▷Curbside bus lanes: 293.6㎞
■ Expansion Plan (13 lines/192㎞ )
Create Bus Priority MB Lane

DEC. 2006
Seoul Development InstituteSeoul Development InstituteTake Transit, Enjoy More Time for Life
□ CNG buses
2010
DEC. 2006
Seoul Development InstituteSeoul Development InstituteTake Transit, Enjoy More Time for Life
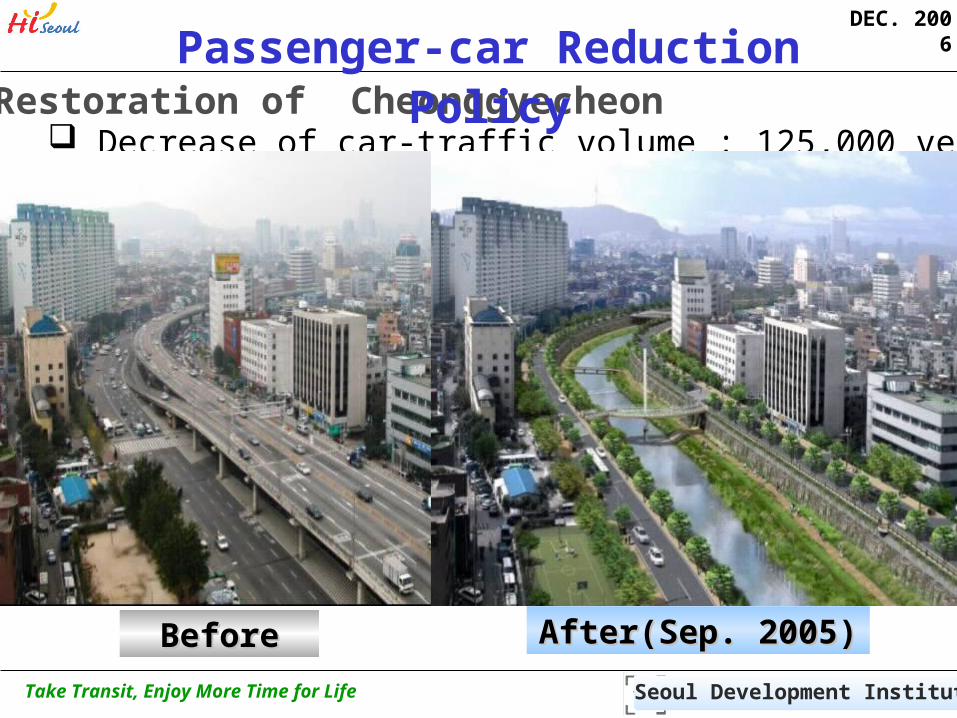
□ Restoration of Cheonggyecheon Decrease of car-traffic volume : 125,000 veh/day
BeforeBefore After(Sep. 2005)After(Sep. 2005)
Passenger-car Reduction Policy

DEC. 2006
Seoul Development InstituteSeoul Development InstituteTake Transit, Enjoy More Time for Life
□ □ CheonGyeCheon Restoration□ □ CheonGyeCheon Restoration
Balance Regional Development Balance Regional Development
Create an Environment-friendly City Space Create an Environment-friendly City Space
• Deterioration of City Environment• Deterioration of City Environment
Recovery of Seoul’s Historic and Cultural Space Recovery of Seoul’s Historic and Cultural Space
• Loss of Historic and Cultural Relics• Loss of Historic and Cultural Relics
Fundamental Solution to Safety Problem Fundamental Solution to Safety Problem
• Obsolescence of Expressway and Covering Structures• Obsolescence of Expressway and Covering Structures
Area Development Falling Behind Other Area of Seoul Area Development Falling Behind Other Area of Seoul
DEC. 2006
Seoul Development InstituteSeoul Development InstituteTake Transit, Enjoy More Time for Life
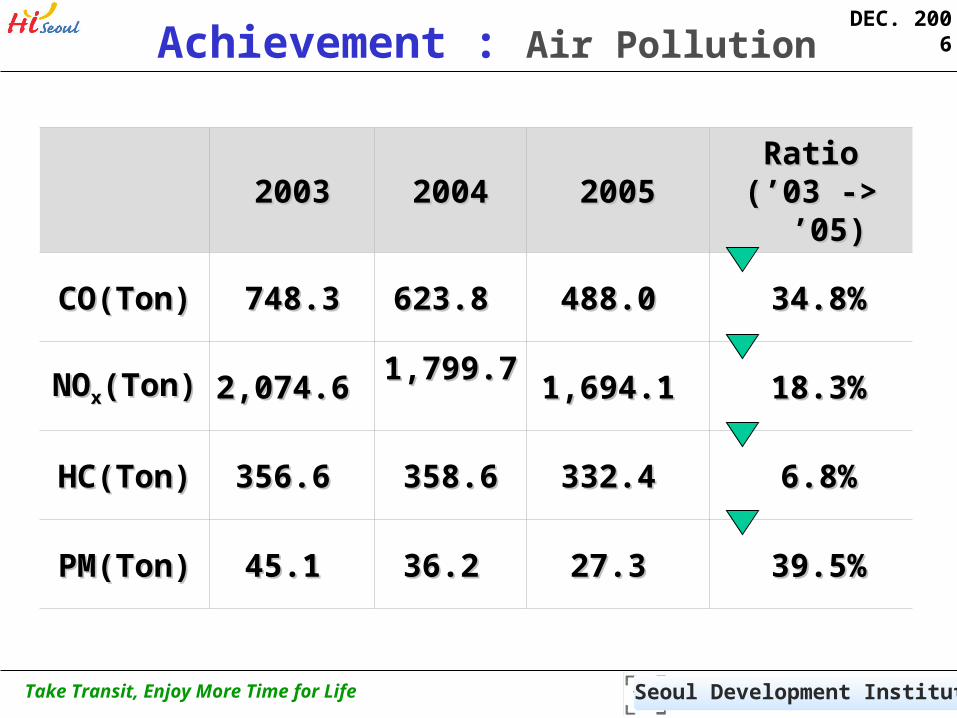
20032003 20042004 20052005RatioRatio
(’03 -> ’05)(’03 -> ’05)
CO(Ton)CO(Ton) 748.3748.3 623.8 623.8 488.0 488.0 34.8%34.8%
NONOxx(Ton)(Ton) 2,074.6 2,074.6 1,799.7 1,799.7 1,694.1 1,694.1 18.3%18.3%
HC(Ton)HC(Ton) 356.6 356.6 358.6 358.6 332.4 332.4 6.8%6.8%
PM(Ton)PM(Ton) 45.1 45.1 36.2 36.2 27.3 27.3 39.5%39.5%
Achievement : Air Pollution

DEC. 2006
Seoul Development InstituteSeoul Development InstituteTake Transit, Enjoy More Time for Life
20032003 20042004 20052005
DieselDiesel Usage(1,000ℓ)Usage(1,000ℓ) 148,059148,059 126,485126,485 118,783118,783
CNGCNG Usage(1,000Usage(1,000㎥㎥ )) 33,955 33,955 41,73141,731 44,671 44,671
Total Fuel Cost (KRW M)Total Fuel Cost (KRW M) 64,81664,816 58,68558,685 56,03356,033
Difference of Cost(%)Difference of Cost(%) -- 9.59.5 4.54.5
Achievement : Fuel Consumption

DEC. 2006
Seoul Development InstituteSeoul Development InstituteTake Transit, Enjoy More Time for Life
○ Make Success Story dramatically ex) BRT with Restructuring ALL re-Coloring, re-Routing, Free Transfer, re-Spacing, delete M-way+Parking Lot, Use IT for exciting Transit
○MY Authority First, and Ask others Take Transit, NO-AUTO
○War against Auto, Dancing with Transit Users With NGO, Labor Union, Political leader
Key Messages from Seoul

DEC. 2006
Seoul Development InstituteSeoul Development InstituteTake Transit, Enjoy More Time for Life
IT System Solution ?Political WILL ?
Emission ControlDiesel car surveillance
Fine system
Public TransitStation Network
InformationOrg.Fare
TDMCongestion Pricing
Re design+re-spacing
INTEGRATION ISSUE for Public Transit
Land Use PlanningTOD (Long term)