Debugging with gdb - Computer Sciencecsci243/resources/gdb.pdfDebugging with gdb The gnu...
612
Debugging with gdb The gnu Source-Level Debugger Tenth Edition, for gdb version 7.4-debian (GDB) Richard Stallman, Roland Pesch, Stan Shebs, et al.
Transcript of Debugging with gdb - Computer Sciencecsci243/resources/gdb.pdfDebugging with gdb The gnu...
Debugging with gdbThe gnu Source-Level Debugger
Tenth Edition, for gdb version 7.4-debian
(GDB)
Richard Stallman, Roland Pesch, Stan Shebs, et al.
(Send bugs and comments on gdb to http://www.gnu.org/software/gdb/bugs/.)Debugging with gdb
TEXinfo 2008-04-18.10
Published by the Free Software Foundation51 Franklin Street, Fifth Floor, Boston, MA 02110-1301, USAISBN 978-0-9831592-3-0
Copyright c© 1988, 1989, 1990, 1991, 1992, 1993, 1994, 1995, 1996, 1998, 1999, 2000, 2001,2002, 2003, 2004, 2005, 2006, 2007, 2008, 2009, 2010 Free Software Foundation, Inc.
Permission is granted to copy, distribute and/or modify this document under the termsof the GNU Free Documentation License, Version 1.3 or any later version published bythe Free Software Foundation; with the Invariant Sections being “Free Software” and “FreeSoftware Needs Free Documentation”, with the Front-Cover Texts being “A GNU Manual,”and with the Back-Cover Texts as in (a) below.
(a) The FSF’s Back-Cover Text is: “You are free to copy and modify this GNU Man-ual. Buying copies from GNU Press supports the FSF in developing GNU and promotingsoftware freedom.”
i
Table of Contents
Summary of gdb . . . . . . . . . . . . . . . . . . . . . . . . . . . . . . . . . . . . 1Free Software . . . . . . . . . . . . . . . . . . . . . . . . . . . . . . . . . . . . . . . . . . . . . . . . . . . . . . . 1Free Software Needs Free Documentation . . . . . . . . . . . . . . . . . . . . . . . . . . . . 1Contributors to gdb . . . . . . . . . . . . . . . . . . . . . . . . . . . . . . . . . . . . . . . . . . . . . . . . . 3
1 A Sample gdb Session . . . . . . . . . . . . . . . . . . . . . . . . . . 7
2 Getting In and Out of gdb . . . . . . . . . . . . . . . . . . . 112.1 Invoking gdb . . . . . . . . . . . . . . . . . . . . . . . . . . . . . . . . . . . . . . . . . . . . . . . . . 11
2.1.1 Choosing Files . . . . . . . . . . . . . . . . . . . . . . . . . . . . . . . . . . . . . . . . . . . 122.1.2 Choosing Modes . . . . . . . . . . . . . . . . . . . . . . . . . . . . . . . . . . . . . . . . . 132.1.3 What gdb Does During Startup . . . . . . . . . . . . . . . . . . . . . . . . . . 15
2.2 Quitting gdb . . . . . . . . . . . . . . . . . . . . . . . . . . . . . . . . . . . . . . . . . . . . . . . . . 162.3 Shell Commands . . . . . . . . . . . . . . . . . . . . . . . . . . . . . . . . . . . . . . . . . . . . . . 172.4 Logging Output . . . . . . . . . . . . . . . . . . . . . . . . . . . . . . . . . . . . . . . . . . . . . . . 17
3 gdb Commands . . . . . . . . . . . . . . . . . . . . . . . . . . . . . . . . 193.1 Command Syntax . . . . . . . . . . . . . . . . . . . . . . . . . . . . . . . . . . . . . . . . . . . . . 193.2 Command Completion . . . . . . . . . . . . . . . . . . . . . . . . . . . . . . . . . . . . . . . . 193.3 Getting Help . . . . . . . . . . . . . . . . . . . . . . . . . . . . . . . . . . . . . . . . . . . . . . . . . . 21
4 Running Programs Under gdb . . . . . . . . . . . . . . . 254.1 Compiling for Debugging . . . . . . . . . . . . . . . . . . . . . . . . . . . . . . . . . . . . . . 254.2 Starting your Program . . . . . . . . . . . . . . . . . . . . . . . . . . . . . . . . . . . . . . . . 264.3 Your Program’s Arguments . . . . . . . . . . . . . . . . . . . . . . . . . . . . . . . . . . . 284.4 Your Program’s Environment . . . . . . . . . . . . . . . . . . . . . . . . . . . . . . . . . . 294.5 Your Program’s Working Directory . . . . . . . . . . . . . . . . . . . . . . . . . . . . 304.6 Your Program’s Input and Output . . . . . . . . . . . . . . . . . . . . . . . . . . . . 304.7 Debugging an Already-running Process . . . . . . . . . . . . . . . . . . . . . . . . 314.8 Killing the Child Process . . . . . . . . . . . . . . . . . . . . . . . . . . . . . . . . . . . . . . 324.9 Debugging Multiple Inferiors and Programs . . . . . . . . . . . . . . . . . . . . 324.10 Debugging Programs with Multiple Threads . . . . . . . . . . . . . . . . . . 354.11 Debugging Forks . . . . . . . . . . . . . . . . . . . . . . . . . . . . . . . . . . . . . . . . . . . . . 384.12 Setting a Bookmark to Return to Later . . . . . . . . . . . . . . . . . . . . . . . 40
4.12.1 A Non-obvious Benefit of Using Checkpoints . . . . . . . . . . . . . 42
ii Debugging with gdb
5 Stopping and Continuing . . . . . . . . . . . . . . . . . . . . . 435.1 Breakpoints, Watchpoints, and Catchpoints . . . . . . . . . . . . . . . . . . . 43
5.1.1 Setting Breakpoints . . . . . . . . . . . . . . . . . . . . . . . . . . . . . . . . . . . . . . 445.1.2 Setting Watchpoints . . . . . . . . . . . . . . . . . . . . . . . . . . . . . . . . . . . . . . 495.1.3 Setting Catchpoints . . . . . . . . . . . . . . . . . . . . . . . . . . . . . . . . . . . . . . 525.1.4 Deleting Breakpoints . . . . . . . . . . . . . . . . . . . . . . . . . . . . . . . . . . . . . 555.1.5 Disabling Breakpoints . . . . . . . . . . . . . . . . . . . . . . . . . . . . . . . . . . . . 565.1.6 Break Conditions . . . . . . . . . . . . . . . . . . . . . . . . . . . . . . . . . . . . . . . . . 575.1.7 Breakpoint Command Lists . . . . . . . . . . . . . . . . . . . . . . . . . . . . . . 595.1.8 How to save breakpoints to a file . . . . . . . . . . . . . . . . . . . . . . . . . 605.1.9 “Cannot insert breakpoints” . . . . . . . . . . . . . . . . . . . . . . . . . . . . . . 605.1.10 “Breakpoint address adjusted...” . . . . . . . . . . . . . . . . . . . . . . . . 60
5.2 Continuing and Stepping . . . . . . . . . . . . . . . . . . . . . . . . . . . . . . . . . . . . . . 615.3 Skipping Over Functions and Files . . . . . . . . . . . . . . . . . . . . . . . . . . . . 645.4 Signals . . . . . . . . . . . . . . . . . . . . . . . . . . . . . . . . . . . . . . . . . . . . . . . . . . . . . . . . 665.5 Stopping and Starting Multi-thread Programs . . . . . . . . . . . . . . . . . 68
5.5.1 All-Stop Mode . . . . . . . . . . . . . . . . . . . . . . . . . . . . . . . . . . . . . . . . . . . 685.5.2 Non-Stop Mode . . . . . . . . . . . . . . . . . . . . . . . . . . . . . . . . . . . . . . . . . . 695.5.3 Background Execution . . . . . . . . . . . . . . . . . . . . . . . . . . . . . . . . . . . 715.5.4 Thread-Specific Breakpoints . . . . . . . . . . . . . . . . . . . . . . . . . . . . . . 725.5.5 Interrupted System Calls . . . . . . . . . . . . . . . . . . . . . . . . . . . . . . . . . 725.5.6 Observer Mode . . . . . . . . . . . . . . . . . . . . . . . . . . . . . . . . . . . . . . . . . . . 73
6 Running programs backward . . . . . . . . . . . . . . . . . 75
7 Recording Inferior’s Execution and ReplayingIt . . . . . . . . . . . . . . . . . . . . . . . . . . . . . . . . . . . . . . . . . . . . . . 77
8 Examining the Stack . . . . . . . . . . . . . . . . . . . . . . . . . . 818.1 Stack Frames . . . . . . . . . . . . . . . . . . . . . . . . . . . . . . . . . . . . . . . . . . . . . . . . . 818.2 Backtraces . . . . . . . . . . . . . . . . . . . . . . . . . . . . . . . . . . . . . . . . . . . . . . . . . . . . 828.3 Selecting a Frame . . . . . . . . . . . . . . . . . . . . . . . . . . . . . . . . . . . . . . . . . . . . . 848.4 Information About a Frame . . . . . . . . . . . . . . . . . . . . . . . . . . . . . . . . . . . 85
9 Examining Source Files . . . . . . . . . . . . . . . . . . . . . . . 879.1 Printing Source Lines . . . . . . . . . . . . . . . . . . . . . . . . . . . . . . . . . . . . . . . . . 879.2 Specifying a Location . . . . . . . . . . . . . . . . . . . . . . . . . . . . . . . . . . . . . . . . . 889.3 Editing Source Files . . . . . . . . . . . . . . . . . . . . . . . . . . . . . . . . . . . . . . . . . . . 89
9.3.1 Choosing your Editor . . . . . . . . . . . . . . . . . . . . . . . . . . . . . . . . . . . . 909.4 Searching Source Files . . . . . . . . . . . . . . . . . . . . . . . . . . . . . . . . . . . . . . . . 909.5 Specifying Source Directories . . . . . . . . . . . . . . . . . . . . . . . . . . . . . . . . . . 909.6 Source and Machine Code . . . . . . . . . . . . . . . . . . . . . . . . . . . . . . . . . . . . . 93
iii
10 Examining Data . . . . . . . . . . . . . . . . . . . . . . . . . . . . . . 9710.1 Expressions . . . . . . . . . . . . . . . . . . . . . . . . . . . . . . . . . . . . . . . . . . . . . . . . . . 9710.2 Ambiguous Expressions . . . . . . . . . . . . . . . . . . . . . . . . . . . . . . . . . . . . . . 9810.3 Program Variables . . . . . . . . . . . . . . . . . . . . . . . . . . . . . . . . . . . . . . . . . . . 9910.4 Artificial Arrays . . . . . . . . . . . . . . . . . . . . . . . . . . . . . . . . . . . . . . . . . . . . 10110.5 Output Formats . . . . . . . . . . . . . . . . . . . . . . . . . . . . . . . . . . . . . . . . . . . . 10210.6 Examining Memory . . . . . . . . . . . . . . . . . . . . . . . . . . . . . . . . . . . . . . . . . 10310.7 Automatic Display . . . . . . . . . . . . . . . . . . . . . . . . . . . . . . . . . . . . . . . . . . 10510.8 Print Settings . . . . . . . . . . . . . . . . . . . . . . . . . . . . . . . . . . . . . . . . . . . . . . . 10610.9 Pretty Printing . . . . . . . . . . . . . . . . . . . . . . . . . . . . . . . . . . . . . . . . . . . . . 114
10.9.1 Pretty-Printer Introduction . . . . . . . . . . . . . . . . . . . . . . . . . . . . 11410.9.2 Pretty-Printer Example . . . . . . . . . . . . . . . . . . . . . . . . . . . . . . . . 11510.9.3 Pretty-Printer Commands . . . . . . . . . . . . . . . . . . . . . . . . . . . . . . 115
10.10 Value History . . . . . . . . . . . . . . . . . . . . . . . . . . . . . . . . . . . . . . . . . . . . . . 11610.11 Convenience Variables . . . . . . . . . . . . . . . . . . . . . . . . . . . . . . . . . . . . . 11710.12 Registers . . . . . . . . . . . . . . . . . . . . . . . . . . . . . . . . . . . . . . . . . . . . . . . . . . 11910.13 Floating Point Hardware . . . . . . . . . . . . . . . . . . . . . . . . . . . . . . . . . . . 12010.14 Vector Unit . . . . . . . . . . . . . . . . . . . . . . . . . . . . . . . . . . . . . . . . . . . . . . . . 12110.15 Operating System Auxiliary Information . . . . . . . . . . . . . . . . . . . 12110.16 Memory Region Attributes . . . . . . . . . . . . . . . . . . . . . . . . . . . . . . . . . 122
10.16.1 Attributes . . . . . . . . . . . . . . . . . . . . . . . . . . . . . . . . . . . . . . . . . . . . 12210.16.1.1 Memory Access Mode . . . . . . . . . . . . . . . . . . . . . . . . . . . . 12310.16.1.2 Memory Access Size . . . . . . . . . . . . . . . . . . . . . . . . . . . . . . 12310.16.1.3 Data Cache . . . . . . . . . . . . . . . . . . . . . . . . . . . . . . . . . . . . . . 123
10.16.2 Memory Access Checking . . . . . . . . . . . . . . . . . . . . . . . . . . . . . 12310.17 Copy Between Memory and a File . . . . . . . . . . . . . . . . . . . . . . . . . 12410.18 How to Produce a Core File from Your Program . . . . . . . . . . . 12410.19 Character Sets . . . . . . . . . . . . . . . . . . . . . . . . . . . . . . . . . . . . . . . . . . . . . 12510.20 Caching Data of Remote Targets . . . . . . . . . . . . . . . . . . . . . . . . . . . 12710.21 Search Memory . . . . . . . . . . . . . . . . . . . . . . . . . . . . . . . . . . . . . . . . . . . . 128
11 Debugging Optimized Code . . . . . . . . . . . . . . . . 13111.1 Inline Functions . . . . . . . . . . . . . . . . . . . . . . . . . . . . . . . . . . . . . . . . . . . . 13111.2 Tail Call Frames . . . . . . . . . . . . . . . . . . . . . . . . . . . . . . . . . . . . . . . . . . . . 132
12 C Preprocessor Macros . . . . . . . . . . . . . . . . . . . . . 135
13 Tracepoints . . . . . . . . . . . . . . . . . . . . . . . . . . . . . . . . . . 13913.1 Commands to Set Tracepoints . . . . . . . . . . . . . . . . . . . . . . . . . . . . . . 139
13.1.1 Create and Delete Tracepoints . . . . . . . . . . . . . . . . . . . . . . . . . 14013.1.2 Enable and Disable Tracepoints . . . . . . . . . . . . . . . . . . . . . . . . 14213.1.3 Tracepoint Passcounts . . . . . . . . . . . . . . . . . . . . . . . . . . . . . . . . . 14313.1.4 Tracepoint Conditions . . . . . . . . . . . . . . . . . . . . . . . . . . . . . . . . . . 14313.1.5 Trace State Variables . . . . . . . . . . . . . . . . . . . . . . . . . . . . . . . . . . 14313.1.6 Tracepoint Action Lists . . . . . . . . . . . . . . . . . . . . . . . . . . . . . . . . 14413.1.7 Listing Tracepoints . . . . . . . . . . . . . . . . . . . . . . . . . . . . . . . . . . . . 14613.1.8 Listing Static Tracepoint Markers . . . . . . . . . . . . . . . . . . . . . . 147
iv Debugging with gdb
13.1.9 Starting and Stopping Trace Experiments . . . . . . . . . . . . . . 14713.1.10 Tracepoint Restrictions . . . . . . . . . . . . . . . . . . . . . . . . . . . . . . . 149
13.2 Using the Collected Data . . . . . . . . . . . . . . . . . . . . . . . . . . . . . . . . . . . 15013.2.1 tfind n . . . . . . . . . . . . . . . . . . . . . . . . . . . . . . . . . . . . . . . . . . . . . . . 15013.2.2 tdump . . . . . . . . . . . . . . . . . . . . . . . . . . . . . . . . . . . . . . . . . . . . . . . . . . 15213.2.3 save tracepoints filename . . . . . . . . . . . . . . . . . . . . . . . . . . . 153
13.3 Convenience Variables for Tracepoints . . . . . . . . . . . . . . . . . . . . . . . 15313.4 Using Trace Files . . . . . . . . . . . . . . . . . . . . . . . . . . . . . . . . . . . . . . . . . . . 154
14 Debugging Programs That Use Overlays. . . . . . . . . . . . . . . . . . . . . . . . . . . . . . . . . . . . . . . . . . . . . . . 155
14.1 How Overlays Work . . . . . . . . . . . . . . . . . . . . . . . . . . . . . . . . . . . . . . . . . 15514.2 Overlay Commands . . . . . . . . . . . . . . . . . . . . . . . . . . . . . . . . . . . . . . . . . 15614.3 Automatic Overlay Debugging . . . . . . . . . . . . . . . . . . . . . . . . . . . . . . 15814.4 Overlay Sample Program . . . . . . . . . . . . . . . . . . . . . . . . . . . . . . . . . . . 159
15 Using gdb with Different Languages . . . . . . 16115.1 Switching Between Source Languages . . . . . . . . . . . . . . . . . . . . . . . 161
15.1.1 List of Filename Extensions and Languages . . . . . . . . . . . . . 16115.1.2 Setting the Working Language . . . . . . . . . . . . . . . . . . . . . . . . . 16215.1.3 Having gdb Infer the Source Language . . . . . . . . . . . . . . . . . 162
15.2 Displaying the Language . . . . . . . . . . . . . . . . . . . . . . . . . . . . . . . . . . . . 16215.3 Type and Range Checking . . . . . . . . . . . . . . . . . . . . . . . . . . . . . . . . . . 163
15.3.1 An Overview of Type Checking . . . . . . . . . . . . . . . . . . . . . . . . 16315.3.2 An Overview of Range Checking . . . . . . . . . . . . . . . . . . . . . . . 164
15.4 Supported Languages . . . . . . . . . . . . . . . . . . . . . . . . . . . . . . . . . . . . . . . 16515.4.1 C and C++ . . . . . . . . . . . . . . . . . . . . . . . . . . . . . . . . . . . . . . . . . . . . . 165
15.4.1.1 C and C++ Operators . . . . . . . . . . . . . . . . . . . . . . . . . . . . . 16615.4.1.2 C and C++ Constants . . . . . . . . . . . . . . . . . . . . . . . . . . . . . 16715.4.1.3 C++ Expressions . . . . . . . . . . . . . . . . . . . . . . . . . . . . . . . . . . 16815.4.1.4 C and C++ Defaults . . . . . . . . . . . . . . . . . . . . . . . . . . . . . . . 16915.4.1.5 C and C++ Type and Range Checks . . . . . . . . . . . . . . . 16915.4.1.6 gdb and C . . . . . . . . . . . . . . . . . . . . . . . . . . . . . . . . . . . . . . . . 16915.4.1.7 gdb Features for C++ . . . . . . . . . . . . . . . . . . . . . . . . . . . . . 17015.4.1.8 Decimal Floating Point format . . . . . . . . . . . . . . . . . . . . 171
15.4.2 D . . . . . . . . . . . . . . . . . . . . . . . . . . . . . . . . . . . . . . . . . . . . . . . . . . . . . . 17115.4.3 Objective-C . . . . . . . . . . . . . . . . . . . . . . . . . . . . . . . . . . . . . . . . . . . . 171
15.4.3.1 Method Names in Commands . . . . . . . . . . . . . . . . . . . . . 17115.4.3.2 The Print Command With Objective-C . . . . . . . . . . . . 172
15.4.4 OpenCL C . . . . . . . . . . . . . . . . . . . . . . . . . . . . . . . . . . . . . . . . . . . . . 17215.4.4.1 OpenCL C Datatypes . . . . . . . . . . . . . . . . . . . . . . . . . . . . . 17215.4.4.2 OpenCL C Expressions . . . . . . . . . . . . . . . . . . . . . . . . . . . . 17315.4.4.3 OpenCL C Operators . . . . . . . . . . . . . . . . . . . . . . . . . . . . . 173
15.4.5 Fortran . . . . . . . . . . . . . . . . . . . . . . . . . . . . . . . . . . . . . . . . . . . . . . . . 17315.4.5.1 Fortran Operators and Expressions . . . . . . . . . . . . . . . . 17315.4.5.2 Fortran Defaults . . . . . . . . . . . . . . . . . . . . . . . . . . . . . . . . . . 17315.4.5.3 Special Fortran Commands . . . . . . . . . . . . . . . . . . . . . . . . 173
v
15.4.6 Pascal . . . . . . . . . . . . . . . . . . . . . . . . . . . . . . . . . . . . . . . . . . . . . . . . . 17415.4.7 Modula-2 . . . . . . . . . . . . . . . . . . . . . . . . . . . . . . . . . . . . . . . . . . . . . . 174
15.4.7.1 Operators . . . . . . . . . . . . . . . . . . . . . . . . . . . . . . . . . . . . . . . . . 17415.4.7.2 Built-in Functions and Procedures . . . . . . . . . . . . . . . . . 17515.4.7.3 Constants . . . . . . . . . . . . . . . . . . . . . . . . . . . . . . . . . . . . . . . . . 17615.4.7.4 Modula-2 Types . . . . . . . . . . . . . . . . . . . . . . . . . . . . . . . . . . . 17715.4.7.5 Modula-2 Defaults . . . . . . . . . . . . . . . . . . . . . . . . . . . . . . . . 17915.4.7.6 Deviations from Standard Modula-2 . . . . . . . . . . . . . . . 17915.4.7.7 Modula-2 Type and Range Checks . . . . . . . . . . . . . . . . . 17915.4.7.8 The Scope Operators :: and . . . . . . . . . . . . . . . . . . . . . 17915.4.7.9 gdb and Modula-2 . . . . . . . . . . . . . . . . . . . . . . . . . . . . . . . . 180
15.4.8 Ada . . . . . . . . . . . . . . . . . . . . . . . . . . . . . . . . . . . . . . . . . . . . . . . . . . . 18015.4.8.1 Introduction . . . . . . . . . . . . . . . . . . . . . . . . . . . . . . . . . . . . . . 18015.4.8.2 Omissions from Ada . . . . . . . . . . . . . . . . . . . . . . . . . . . . . . . 18115.4.8.3 Additions to Ada . . . . . . . . . . . . . . . . . . . . . . . . . . . . . . . . . 18215.4.8.4 Stopping at the Very Beginning . . . . . . . . . . . . . . . . . . . 18315.4.8.5 Extensions for Ada Tasks . . . . . . . . . . . . . . . . . . . . . . . . . 18315.4.8.6 Tasking Support when Debugging Core Files . . . . . . 18615.4.8.7 Tasking Support when using the Ravenscar Profile
. . . . . . . . . . . . . . . . . . . . . . . . . . . . . . . . . . . . . . . . . . . . . . . . . . . . . . . . 18715.4.8.8 Known Peculiarities of Ada Mode . . . . . . . . . . . . . . . . . 187
15.5 Unsupported Languages . . . . . . . . . . . . . . . . . . . . . . . . . . . . . . . . . . . . 188
16 Examining the Symbol Table . . . . . . . . . . . . . . 189
17 Altering Execution . . . . . . . . . . . . . . . . . . . . . . . . . . 19517.1 Assignment to Variables . . . . . . . . . . . . . . . . . . . . . . . . . . . . . . . . . . . . 19517.2 Continuing at a Different Address . . . . . . . . . . . . . . . . . . . . . . . . . . . 19617.3 Giving your Program a Signal . . . . . . . . . . . . . . . . . . . . . . . . . . . . . . . 19717.4 Returning from a Function . . . . . . . . . . . . . . . . . . . . . . . . . . . . . . . . . . 19717.5 Calling Program Functions . . . . . . . . . . . . . . . . . . . . . . . . . . . . . . . . . . 19817.6 Patching Programs . . . . . . . . . . . . . . . . . . . . . . . . . . . . . . . . . . . . . . . . . 199
18 gdb Files . . . . . . . . . . . . . . . . . . . . . . . . . . . . . . . . . . . . . 20118.1 Commands to Specify Files . . . . . . . . . . . . . . . . . . . . . . . . . . . . . . . . . 20118.2 Debugging Information in Separate Files . . . . . . . . . . . . . . . . . . . . 20918.3 Index Files Speed Up gdb . . . . . . . . . . . . . . . . . . . . . . . . . . . . . . . . . . 21218.4 Errors Reading Symbol Files . . . . . . . . . . . . . . . . . . . . . . . . . . . . . . . . 21318.5 GDB Data Files . . . . . . . . . . . . . . . . . . . . . . . . . . . . . . . . . . . . . . . . . . . . 214
19 Specifying a Debugging Target . . . . . . . . . . . . 21519.1 Active Targets . . . . . . . . . . . . . . . . . . . . . . . . . . . . . . . . . . . . . . . . . . . . . . 21519.2 Commands for Managing Targets . . . . . . . . . . . . . . . . . . . . . . . . . . . 21519.3 Choosing Target Byte Order . . . . . . . . . . . . . . . . . . . . . . . . . . . . . . . . 218
vi Debugging with gdb
20 Debugging Remote Programs . . . . . . . . . . . . . . 21920.1 Connecting to a Remote Target . . . . . . . . . . . . . . . . . . . . . . . . . . . . . 21920.2 Sending files to a remote system . . . . . . . . . . . . . . . . . . . . . . . . . . . . 22120.3 Using the gdbserver Program . . . . . . . . . . . . . . . . . . . . . . . . . . . . . . 221
20.3.1 Running gdbserver . . . . . . . . . . . . . . . . . . . . . . . . . . . . . . . . . . . . 22120.3.1.1 Attaching to a Running Program . . . . . . . . . . . . . . . . . . 22220.3.1.2 Multi-Process Mode for gdbserver . . . . . . . . . . . . . . . . 22220.3.1.3 TCP port allocation lifecycle of gdbserver . . . . . . . . 22320.3.1.4 Other Command-Line Arguments for gdbserver . . . 223
20.3.2 Connecting to gdbserver . . . . . . . . . . . . . . . . . . . . . . . . . . . . . . 22420.3.3 Monitor Commands for gdbserver . . . . . . . . . . . . . . . . . . . . . 22420.3.4 Tracepoints support in gdbserver . . . . . . . . . . . . . . . . . . . . . . 224
20.4 Remote Configuration . . . . . . . . . . . . . . . . . . . . . . . . . . . . . . . . . . . . . . . 22620.5 Implementing a Remote Stub . . . . . . . . . . . . . . . . . . . . . . . . . . . . . . . 230
20.5.1 What the Stub Can Do for You . . . . . . . . . . . . . . . . . . . . . . . . 23120.5.2 What You Must Do for the Stub . . . . . . . . . . . . . . . . . . . . . . . 23220.5.3 Putting it All Together . . . . . . . . . . . . . . . . . . . . . . . . . . . . . . . . . 233
21 Configuration-Specific Information . . . . . . . . 23521.1 Native . . . . . . . . . . . . . . . . . . . . . . . . . . . . . . . . . . . . . . . . . . . . . . . . . . . . . . 235
21.1.1 HP-UX . . . . . . . . . . . . . . . . . . . . . . . . . . . . . . . . . . . . . . . . . . . . . . . . 23521.1.2 BSD libkvm Interface . . . . . . . . . . . . . . . . . . . . . . . . . . . . . . . . . . 23521.1.3 SVR4 Process Information . . . . . . . . . . . . . . . . . . . . . . . . . . . . . 23521.1.4 Features for Debugging djgpp Programs . . . . . . . . . . . . . . . 23721.1.5 Features for Debugging MS Windows PE Executables . . 239
21.1.5.1 Support for DLLs without Debugging Symbols . . . . . 24021.1.5.2 DLL Name Prefixes . . . . . . . . . . . . . . . . . . . . . . . . . . . . . . . 24121.1.5.3 Working with Minimal Symbols . . . . . . . . . . . . . . . . . . . 241
21.1.6 Commands Specific to gnu Hurd Systems . . . . . . . . . . . . . . 24221.1.7 QNX Neutrino . . . . . . . . . . . . . . . . . . . . . . . . . . . . . . . . . . . . . . . . . 24421.1.8 Darwin . . . . . . . . . . . . . . . . . . . . . . . . . . . . . . . . . . . . . . . . . . . . . . . . 245
21.2 Embedded Operating Systems . . . . . . . . . . . . . . . . . . . . . . . . . . . . . . 24521.2.1 Using gdb with VxWorks . . . . . . . . . . . . . . . . . . . . . . . . . . . . . . 245
21.2.1.1 Connecting to VxWorks . . . . . . . . . . . . . . . . . . . . . . . . . . . 24621.2.1.2 VxWorks Download . . . . . . . . . . . . . . . . . . . . . . . . . . . . . . . 24621.2.1.3 Running Tasks . . . . . . . . . . . . . . . . . . . . . . . . . . . . . . . . . . . . 247
21.3 Embedded Processors . . . . . . . . . . . . . . . . . . . . . . . . . . . . . . . . . . . . . . . 24721.3.1 ARM . . . . . . . . . . . . . . . . . . . . . . . . . . . . . . . . . . . . . . . . . . . . . . . . . . 24721.3.2 Renesas M32R/D and M32R/SDI . . . . . . . . . . . . . . . . . . . . . . 24921.3.3 M68k . . . . . . . . . . . . . . . . . . . . . . . . . . . . . . . . . . . . . . . . . . . . . . . . . . 25021.3.4 MicroBlaze . . . . . . . . . . . . . . . . . . . . . . . . . . . . . . . . . . . . . . . . . . . . 25021.3.5 MIPS Embedded . . . . . . . . . . . . . . . . . . . . . . . . . . . . . . . . . . . . . . . 25121.3.6 OpenRISC 1000 . . . . . . . . . . . . . . . . . . . . . . . . . . . . . . . . . . . . . . . . 25321.3.7 PowerPC Embedded . . . . . . . . . . . . . . . . . . . . . . . . . . . . . . . . . . . 25521.3.8 HP PA Embedded . . . . . . . . . . . . . . . . . . . . . . . . . . . . . . . . . . . . . 25621.3.9 Tsqware Sparclet . . . . . . . . . . . . . . . . . . . . . . . . . . . . . . . . . . . . . . 256
21.3.9.1 Setting File to Debug . . . . . . . . . . . . . . . . . . . . . . . . . . . . . 25721.3.9.2 Connecting to Sparclet . . . . . . . . . . . . . . . . . . . . . . . . . . . . 257
vii
21.3.9.3 Sparclet Download . . . . . . . . . . . . . . . . . . . . . . . . . . . . . . . . 25721.3.9.4 Running and Debugging . . . . . . . . . . . . . . . . . . . . . . . . . . . 258
21.3.10 Fujitsu Sparclite . . . . . . . . . . . . . . . . . . . . . . . . . . . . . . . . . . . . . . 25821.3.11 Zilog Z8000 . . . . . . . . . . . . . . . . . . . . . . . . . . . . . . . . . . . . . . . . . . . 25821.3.12 Atmel AVR . . . . . . . . . . . . . . . . . . . . . . . . . . . . . . . . . . . . . . . . . . . 25921.3.13 CRIS . . . . . . . . . . . . . . . . . . . . . . . . . . . . . . . . . . . . . . . . . . . . . . . . . 25921.3.14 Renesas Super-H . . . . . . . . . . . . . . . . . . . . . . . . . . . . . . . . . . . . . . 259
21.4 Architectures . . . . . . . . . . . . . . . . . . . . . . . . . . . . . . . . . . . . . . . . . . . . . . . 26021.4.1 x86 Architecture-specific Issues . . . . . . . . . . . . . . . . . . . . . . . . . 26021.4.2 A29K . . . . . . . . . . . . . . . . . . . . . . . . . . . . . . . . . . . . . . . . . . . . . . . . . . 26021.4.3 Alpha . . . . . . . . . . . . . . . . . . . . . . . . . . . . . . . . . . . . . . . . . . . . . . . . . . 26021.4.4 MIPS . . . . . . . . . . . . . . . . . . . . . . . . . . . . . . . . . . . . . . . . . . . . . . . . . . 26021.4.5 HPPA . . . . . . . . . . . . . . . . . . . . . . . . . . . . . . . . . . . . . . . . . . . . . . . . . 26221.4.6 Cell Broadband Engine SPU architecture . . . . . . . . . . . . . . . 26221.4.7 PowerPC . . . . . . . . . . . . . . . . . . . . . . . . . . . . . . . . . . . . . . . . . . . . . . 263
22 Controlling gdb . . . . . . . . . . . . . . . . . . . . . . . . . . . . . 26522.1 Prompt . . . . . . . . . . . . . . . . . . . . . . . . . . . . . . . . . . . . . . . . . . . . . . . . . . . . . 26522.2 Command Editing . . . . . . . . . . . . . . . . . . . . . . . . . . . . . . . . . . . . . . . . . . 26522.3 Command History . . . . . . . . . . . . . . . . . . . . . . . . . . . . . . . . . . . . . . . . . . 26622.4 Screen Size . . . . . . . . . . . . . . . . . . . . . . . . . . . . . . . . . . . . . . . . . . . . . . . . . 26722.5 Numbers . . . . . . . . . . . . . . . . . . . . . . . . . . . . . . . . . . . . . . . . . . . . . . . . . . . 26822.6 Configuring the Current ABI . . . . . . . . . . . . . . . . . . . . . . . . . . . . . . . . 26922.7 Optional Warnings and Messages . . . . . . . . . . . . . . . . . . . . . . . . . . . . 27022.8 Optional Messages about Internal Happenings . . . . . . . . . . . . . . . 27122.9 Other Miscellaneous Settings . . . . . . . . . . . . . . . . . . . . . . . . . . . . . . . . 274
23 Extending gdb . . . . . . . . . . . . . . . . . . . . . . . . . . . . . . 27523.1 Canned Sequences of Commands . . . . . . . . . . . . . . . . . . . . . . . . . . . . 275
23.1.1 User-defined Commands . . . . . . . . . . . . . . . . . . . . . . . . . . . . . . . 27523.1.2 User-defined Command Hooks . . . . . . . . . . . . . . . . . . . . . . . . . . 27723.1.3 Command Files . . . . . . . . . . . . . . . . . . . . . . . . . . . . . . . . . . . . . . . . 27823.1.4 Commands for Controlled Output . . . . . . . . . . . . . . . . . . . . . . 279
23.2 Scripting gdb using Python . . . . . . . . . . . . . . . . . . . . . . . . . . . . . . . . . 28123.2.1 Python Commands . . . . . . . . . . . . . . . . . . . . . . . . . . . . . . . . . . . . 28123.2.2 Python API . . . . . . . . . . . . . . . . . . . . . . . . . . . . . . . . . . . . . . . . . . . 282
23.2.2.1 Basic Python . . . . . . . . . . . . . . . . . . . . . . . . . . . . . . . . . . . . . 28223.2.2.2 Exception Handling . . . . . . . . . . . . . . . . . . . . . . . . . . . . . . . 28523.2.2.3 Values From Inferior . . . . . . . . . . . . . . . . . . . . . . . . . . . . . . 28623.2.2.4 Types In Python . . . . . . . . . . . . . . . . . . . . . . . . . . . . . . . . . . 29023.2.2.5 Pretty Printing API . . . . . . . . . . . . . . . . . . . . . . . . . . . . . . . 29423.2.2.6 Selecting Pretty-Printers . . . . . . . . . . . . . . . . . . . . . . . . . . 29523.2.2.7 Writing a Pretty-Printer . . . . . . . . . . . . . . . . . . . . . . . . . . 29623.2.2.8 Inferiors In Python . . . . . . . . . . . . . . . . . . . . . . . . . . . . . . . . 29823.2.2.9 Events In Python . . . . . . . . . . . . . . . . . . . . . . . . . . . . . . . . . 29923.2.2.10 Threads In Python . . . . . . . . . . . . . . . . . . . . . . . . . . . . . . . 30123.2.2.11 Commands In Python . . . . . . . . . . . . . . . . . . . . . . . . . . . . 30223.2.2.12 Parameters In Python . . . . . . . . . . . . . . . . . . . . . . . . . . . . 305
viii Debugging with gdb
23.2.2.13 Writing new convenience functions . . . . . . . . . . . . . . . 30723.2.2.14 Program Spaces In Python . . . . . . . . . . . . . . . . . . . . . . . 30823.2.2.15 Objfiles In Python . . . . . . . . . . . . . . . . . . . . . . . . . . . . . . . 30923.2.2.16 Accessing inferior stack frames from Python. . . . . . 30923.2.2.17 Accessing frame blocks from Python. . . . . . . . . . . . . . 31223.2.2.18 Python representation of Symbols. . . . . . . . . . . . . . . . 31323.2.2.19 Symbol table representation in Python. . . . . . . . . . . . 31623.2.2.20 Manipulating breakpoints using Python . . . . . . . . . . 31723.2.2.21 Finish Breakpoints . . . . . . . . . . . . . . . . . . . . . . . . . . . . . . . 32023.2.2.22 Python representation of lazy strings. . . . . . . . . . . . . 320
23.2.3 Auto-loading . . . . . . . . . . . . . . . . . . . . . . . . . . . . . . . . . . . . . . . . . . . 32123.2.3.1 The ‘objfile-gdb.py’ file . . . . . . . . . . . . . . . . . . . . . . . . . 32223.2.3.2 The .debug_gdb_scripts section . . . . . . . . . . . . . . . . . 32223.2.3.3 Which flavor to choose? . . . . . . . . . . . . . . . . . . . . . . . . . . . 323
23.2.4 Python modules . . . . . . . . . . . . . . . . . . . . . . . . . . . . . . . . . . . . . . . 32323.2.4.1 gdb.printing . . . . . . . . . . . . . . . . . . . . . . . . . . . . . . . . . . . . . . . 32323.2.4.2 gdb.types . . . . . . . . . . . . . . . . . . . . . . . . . . . . . . . . . . . . . . . . . 32423.2.4.3 gdb.prompt . . . . . . . . . . . . . . . . . . . . . . . . . . . . . . . . . . . . . . . 325
23.3 Creating new spellings of existing commands . . . . . . . . . . . . . . . . 325
24 Command Interpreters . . . . . . . . . . . . . . . . . . . . . 327
25 gdb Text User Interface . . . . . . . . . . . . . . . . . . . . 32925.1 TUI Overview . . . . . . . . . . . . . . . . . . . . . . . . . . . . . . . . . . . . . . . . . . . . . . 32925.2 TUI Key Bindings . . . . . . . . . . . . . . . . . . . . . . . . . . . . . . . . . . . . . . . . . . 33025.3 TUI Single Key Mode . . . . . . . . . . . . . . . . . . . . . . . . . . . . . . . . . . . . . . . 33125.4 TUI-specific Commands . . . . . . . . . . . . . . . . . . . . . . . . . . . . . . . . . . . . . 33125.5 TUI Configuration Variables . . . . . . . . . . . . . . . . . . . . . . . . . . . . . . . . 333
26 Using gdb under gnu Emacs . . . . . . . . . . . . . . . 335
27 The gdb/mi Interface . . . . . . . . . . . . . . . . . . . . . . . 337Function and Purpose . . . . . . . . . . . . . . . . . . . . . . . . . . . . . . . . . . . . . . . . . . . . . 337Notation and Terminology . . . . . . . . . . . . . . . . . . . . . . . . . . . . . . . . . . . . . . . . 33727.3 gdb/mi General Design . . . . . . . . . . . . . . . . . . . . . . . . . . . . . . . . . . . . . 337
27.3.1 Context management . . . . . . . . . . . . . . . . . . . . . . . . . . . . . . . . . . 33827.3.2 Asynchronous command execution and non-stop mode . . 33927.3.3 Thread groups . . . . . . . . . . . . . . . . . . . . . . . . . . . . . . . . . . . . . . . . . 339
27.4 gdb/mi Command Syntax . . . . . . . . . . . . . . . . . . . . . . . . . . . . . . . . . . 34027.4.1 gdb/mi Input Syntax . . . . . . . . . . . . . . . . . . . . . . . . . . . . . . . . . . 34027.4.2 gdb/mi Output Syntax . . . . . . . . . . . . . . . . . . . . . . . . . . . . . . . . 341
27.5 gdb/mi Compatibility with CLI . . . . . . . . . . . . . . . . . . . . . . . . . . . . 34227.6 gdb/mi Development and Front Ends . . . . . . . . . . . . . . . . . . . . . . . 34327.7 gdb/mi Output Records . . . . . . . . . . . . . . . . . . . . . . . . . . . . . . . . . . . . 343
27.7.1 gdb/mi Result Records . . . . . . . . . . . . . . . . . . . . . . . . . . . . . . . . 34327.7.2 gdb/mi Stream Records . . . . . . . . . . . . . . . . . . . . . . . . . . . . . . . 34427.7.3 gdb/mi Async Records . . . . . . . . . . . . . . . . . . . . . . . . . . . . . . . . 344
ix
27.7.4 gdb/mi Frame Information . . . . . . . . . . . . . . . . . . . . . . . . . . . . 34727.7.5 gdb/mi Thread Information . . . . . . . . . . . . . . . . . . . . . . . . . . . 34727.7.6 gdb/mi Ada Exception Information . . . . . . . . . . . . . . . . . . . . 348
27.8 Simple Examples of gdb/mi Interaction . . . . . . . . . . . . . . . . . . . . . 34827.9 gdb/mi Command Description Format . . . . . . . . . . . . . . . . . . . . . . 34927.10 gdb/mi Breakpoint Commands . . . . . . . . . . . . . . . . . . . . . . . . . . . . 34927.11 gdb/mi Program Context . . . . . . . . . . . . . . . . . . . . . . . . . . . . . . . . . 35827.12 gdb/mi Thread Commands . . . . . . . . . . . . . . . . . . . . . . . . . . . . . . . . 36027.13 gdb/mi Ada Tasking Commands . . . . . . . . . . . . . . . . . . . . . . . . . . 36227.14 gdb/mi Program Execution . . . . . . . . . . . . . . . . . . . . . . . . . . . . . . . . 36327.15 gdb/mi Stack Manipulation Commands . . . . . . . . . . . . . . . . . . . . 37027.16 gdb/mi Variable Objects . . . . . . . . . . . . . . . . . . . . . . . . . . . . . . . . . . 37527.17 gdb/mi Data Manipulation . . . . . . . . . . . . . . . . . . . . . . . . . . . . . . . . 38527.18 gdb/mi Tracepoint Commands . . . . . . . . . . . . . . . . . . . . . . . . . . . . 39327.19 gdb/mi Symbol Query Commands . . . . . . . . . . . . . . . . . . . . . . . . . 39727.20 gdb/mi File Commands . . . . . . . . . . . . . . . . . . . . . . . . . . . . . . . . . . . 39727.21 gdb/mi Target Manipulation Commands . . . . . . . . . . . . . . . . . . . 39927.22 gdb/mi File Transfer Commands . . . . . . . . . . . . . . . . . . . . . . . . . . 40227.23 Miscellaneous gdb/mi Commands . . . . . . . . . . . . . . . . . . . . . . . . . 403
28 gdb Annotations . . . . . . . . . . . . . . . . . . . . . . . . . . . . 41128.1 What is an Annotation? . . . . . . . . . . . . . . . . . . . . . . . . . . . . . . . . . . . . 41128.2 The Server Prefix . . . . . . . . . . . . . . . . . . . . . . . . . . . . . . . . . . . . . . . . . . . 41228.3 Annotation for gdb Input . . . . . . . . . . . . . . . . . . . . . . . . . . . . . . . . . . . 41228.4 Errors . . . . . . . . . . . . . . . . . . . . . . . . . . . . . . . . . . . . . . . . . . . . . . . . . . . . . . 41328.5 Invalidation Notices . . . . . . . . . . . . . . . . . . . . . . . . . . . . . . . . . . . . . . . . . 41328.6 Running the Program . . . . . . . . . . . . . . . . . . . . . . . . . . . . . . . . . . . . . . . 41328.7 Displaying Source . . . . . . . . . . . . . . . . . . . . . . . . . . . . . . . . . . . . . . . . . . . 414
29 JIT Compilation Interface . . . . . . . . . . . . . . . . . 41529.1 JIT Declarations . . . . . . . . . . . . . . . . . . . . . . . . . . . . . . . . . . . . . . . . . . . . 41529.2 Registering Code . . . . . . . . . . . . . . . . . . . . . . . . . . . . . . . . . . . . . . . . . . . 41629.3 Unregistering Code . . . . . . . . . . . . . . . . . . . . . . . . . . . . . . . . . . . . . . . . . 41629.4 Custom Debug Info . . . . . . . . . . . . . . . . . . . . . . . . . . . . . . . . . . . . . . . . . 416
29.4.1 Using JIT Debug Info Readers . . . . . . . . . . . . . . . . . . . . . . . . . 41729.4.2 Writing JIT Debug Info Readers . . . . . . . . . . . . . . . . . . . . . . . 417
30 Reporting Bugs in gdb . . . . . . . . . . . . . . . . . . . . . 41930.1 Have You Found a Bug? . . . . . . . . . . . . . . . . . . . . . . . . . . . . . . . . . . . . 41930.2 How to Report Bugs . . . . . . . . . . . . . . . . . . . . . . . . . . . . . . . . . . . . . . . . 419
x Debugging with gdb
31 Command Line Editing . . . . . . . . . . . . . . . . . . . . . 42331.1 Introduction to Line Editing . . . . . . . . . . . . . . . . . . . . . . . . . . . . . . . . 42331.2 Readline Interaction . . . . . . . . . . . . . . . . . . . . . . . . . . . . . . . . . . . . . . . . 423
31.2.1 Readline Bare Essentials . . . . . . . . . . . . . . . . . . . . . . . . . . . . . . . 42331.2.2 Readline Movement Commands . . . . . . . . . . . . . . . . . . . . . . . . 42431.2.3 Readline Killing Commands . . . . . . . . . . . . . . . . . . . . . . . . . . . . 42431.2.4 Readline Arguments . . . . . . . . . . . . . . . . . . . . . . . . . . . . . . . . . . . 42531.2.5 Searching for Commands in the History . . . . . . . . . . . . . . . . 425
31.3 Readline Init File . . . . . . . . . . . . . . . . . . . . . . . . . . . . . . . . . . . . . . . . . . . 42631.3.1 Readline Init File Syntax . . . . . . . . . . . . . . . . . . . . . . . . . . . . . . . 42631.3.2 Conditional Init Constructs . . . . . . . . . . . . . . . . . . . . . . . . . . . . 43231.3.3 Sample Init File . . . . . . . . . . . . . . . . . . . . . . . . . . . . . . . . . . . . . . . . 433
31.4 Bindable Readline Commands . . . . . . . . . . . . . . . . . . . . . . . . . . . . . . . 43631.4.1 Commands For Moving . . . . . . . . . . . . . . . . . . . . . . . . . . . . . . . . 43631.4.2 Commands For Manipulating The History . . . . . . . . . . . . . . 43631.4.3 Commands For Changing Text . . . . . . . . . . . . . . . . . . . . . . . . . 43831.4.4 Killing And Yanking . . . . . . . . . . . . . . . . . . . . . . . . . . . . . . . . . . . 43931.4.5 Specifying Numeric Arguments . . . . . . . . . . . . . . . . . . . . . . . . . 44031.4.6 Letting Readline Type For You . . . . . . . . . . . . . . . . . . . . . . . . . 44031.4.7 Keyboard Macros . . . . . . . . . . . . . . . . . . . . . . . . . . . . . . . . . . . . . . 44131.4.8 Some Miscellaneous Commands . . . . . . . . . . . . . . . . . . . . . . . . 441
31.5 Readline vi Mode . . . . . . . . . . . . . . . . . . . . . . . . . . . . . . . . . . . . . . . . . . . 443
32 Using History Interactively . . . . . . . . . . . . . . . . 44532.1 History Expansion . . . . . . . . . . . . . . . . . . . . . . . . . . . . . . . . . . . . . . . . . . 445
32.1.1 Event Designators . . . . . . . . . . . . . . . . . . . . . . . . . . . . . . . . . . . . . 44532.1.2 Word Designators . . . . . . . . . . . . . . . . . . . . . . . . . . . . . . . . . . . . . . 44632.1.3 Modifiers . . . . . . . . . . . . . . . . . . . . . . . . . . . . . . . . . . . . . . . . . . . . . . 446
Appendix A In Memoriam . . . . . . . . . . . . . . . . . . . . 449
Appendix B Formatting Documentation . . . . . 451
Appendix C Installing gdb . . . . . . . . . . . . . . . . . . . . 453C.1 Requirements for Building gdb . . . . . . . . . . . . . . . . . . . . . . . . . . . . . . 453C.2 Invoking the gdb ‘configure’ Script . . . . . . . . . . . . . . . . . . . . . . . . 454C.3 Compiling gdb in Another Directory . . . . . . . . . . . . . . . . . . . . . . . . 455C.4 Specifying Names for Hosts and Targets . . . . . . . . . . . . . . . . . . . . . 456C.5 ‘configure’ Options . . . . . . . . . . . . . . . . . . . . . . . . . . . . . . . . . . . . . . . . . 457C.6 System-wide configuration and settings . . . . . . . . . . . . . . . . . . . . . . 458
Appendix D Maintenance Commands . . . . . . . . 459
xi
Appendix E gdb Remote Serial Protocol . . . . 467E.1 Overview . . . . . . . . . . . . . . . . . . . . . . . . . . . . . . . . . . . . . . . . . . . . . . . . . . . . 467E.2 Packets . . . . . . . . . . . . . . . . . . . . . . . . . . . . . . . . . . . . . . . . . . . . . . . . . . . . . . 468E.3 Stop Reply Packets . . . . . . . . . . . . . . . . . . . . . . . . . . . . . . . . . . . . . . . . . . 478E.4 General Query Packets . . . . . . . . . . . . . . . . . . . . . . . . . . . . . . . . . . . . . . 479E.5 Architecture-Specific Protocol Details . . . . . . . . . . . . . . . . . . . . . . . . 495
E.5.1 ARM . . . . . . . . . . . . . . . . . . . . . . . . . . . . . . . . . . . . . . . . . . . . . . . . . . . 495E.5.1.1 Breakpoint Kinds . . . . . . . . . . . . . . . . . . . . . . . . . . . . . . . . . . 496
E.5.2 MIPS . . . . . . . . . . . . . . . . . . . . . . . . . . . . . . . . . . . . . . . . . . . . . . . . . . . 496E.5.2.1 Register Packet Format . . . . . . . . . . . . . . . . . . . . . . . . . . . . 496
E.6 Tracepoint Packets . . . . . . . . . . . . . . . . . . . . . . . . . . . . . . . . . . . . . . . . . . 496E.6.1 Relocate instruction reply packet . . . . . . . . . . . . . . . . . . . . . . . . 503
E.7 Host I/O Packets . . . . . . . . . . . . . . . . . . . . . . . . . . . . . . . . . . . . . . . . . . . . 503E.8 Interrupts . . . . . . . . . . . . . . . . . . . . . . . . . . . . . . . . . . . . . . . . . . . . . . . . . . . 504E.9 Notification Packets . . . . . . . . . . . . . . . . . . . . . . . . . . . . . . . . . . . . . . . . . 505E.10 Remote Protocol Support for Non-Stop Mode . . . . . . . . . . . . . . . 506E.11 Packet Acknowledgment . . . . . . . . . . . . . . . . . . . . . . . . . . . . . . . . . . . . 507E.12 Examples . . . . . . . . . . . . . . . . . . . . . . . . . . . . . . . . . . . . . . . . . . . . . . . . . . 507E.13 File-I/O Remote Protocol Extension . . . . . . . . . . . . . . . . . . . . . . . . 508
E.13.1 File-I/O Overview . . . . . . . . . . . . . . . . . . . . . . . . . . . . . . . . . . . . . 508E.13.2 Protocol Basics . . . . . . . . . . . . . . . . . . . . . . . . . . . . . . . . . . . . . . . . 509E.13.3 The F Request Packet . . . . . . . . . . . . . . . . . . . . . . . . . . . . . . . . . 509E.13.4 The F Reply Packet . . . . . . . . . . . . . . . . . . . . . . . . . . . . . . . . . . . 510E.13.5 The ‘Ctrl-C’ Message . . . . . . . . . . . . . . . . . . . . . . . . . . . . . . . . . 510E.13.6 Console I/O . . . . . . . . . . . . . . . . . . . . . . . . . . . . . . . . . . . . . . . . . . . 510E.13.7 List of Supported Calls . . . . . . . . . . . . . . . . . . . . . . . . . . . . . . . . 511
open . . . . . . . . . . . . . . . . . . . . . . . . . . . . . . . . . . . . . . . . . . . . . . . . . . . . . . . . 511close . . . . . . . . . . . . . . . . . . . . . . . . . . . . . . . . . . . . . . . . . . . . . . . . . . . . . . . . 512read . . . . . . . . . . . . . . . . . . . . . . . . . . . . . . . . . . . . . . . . . . . . . . . . . . . . . . . . 512write . . . . . . . . . . . . . . . . . . . . . . . . . . . . . . . . . . . . . . . . . . . . . . . . . . . . . . . 513lseek . . . . . . . . . . . . . . . . . . . . . . . . . . . . . . . . . . . . . . . . . . . . . . . . . . . . . . . . 513rename . . . . . . . . . . . . . . . . . . . . . . . . . . . . . . . . . . . . . . . . . . . . . . . . . . . . . 513unlink . . . . . . . . . . . . . . . . . . . . . . . . . . . . . . . . . . . . . . . . . . . . . . . . . . . . . . 514stat/fstat . . . . . . . . . . . . . . . . . . . . . . . . . . . . . . . . . . . . . . . . . . . . . . . . . . . 515gettimeofday . . . . . . . . . . . . . . . . . . . . . . . . . . . . . . . . . . . . . . . . . . . . . . . . 515isatty . . . . . . . . . . . . . . . . . . . . . . . . . . . . . . . . . . . . . . . . . . . . . . . . . . . . . . . 515system . . . . . . . . . . . . . . . . . . . . . . . . . . . . . . . . . . . . . . . . . . . . . . . . . . . . . . 516
E.13.8 Protocol-specific Representation of Datatypes . . . . . . . . . . 516Integral Datatypes . . . . . . . . . . . . . . . . . . . . . . . . . . . . . . . . . . . . . . . . . . 516Pointer Values . . . . . . . . . . . . . . . . . . . . . . . . . . . . . . . . . . . . . . . . . . . . . . 516Memory Transfer . . . . . . . . . . . . . . . . . . . . . . . . . . . . . . . . . . . . . . . . . . . 517struct stat . . . . . . . . . . . . . . . . . . . . . . . . . . . . . . . . . . . . . . . . . . . . . . . . . . 517struct timeval . . . . . . . . . . . . . . . . . . . . . . . . . . . . . . . . . . . . . . . . . . . . . . . 518
E.13.9 Constants . . . . . . . . . . . . . . . . . . . . . . . . . . . . . . . . . . . . . . . . . . . . . 518Open Flags . . . . . . . . . . . . . . . . . . . . . . . . . . . . . . . . . . . . . . . . . . . . . . . . . 518mode t Values . . . . . . . . . . . . . . . . . . . . . . . . . . . . . . . . . . . . . . . . . . . . . . 518Errno Values . . . . . . . . . . . . . . . . . . . . . . . . . . . . . . . . . . . . . . . . . . . . . . . . 518Lseek Flags . . . . . . . . . . . . . . . . . . . . . . . . . . . . . . . . . . . . . . . . . . . . . . . . . 519
xii Debugging with gdb
Limits . . . . . . . . . . . . . . . . . . . . . . . . . . . . . . . . . . . . . . . . . . . . . . . . . . . . . . 519E.13.10 File-I/O Examples . . . . . . . . . . . . . . . . . . . . . . . . . . . . . . . . . . . . 519
E.14 Library List Format . . . . . . . . . . . . . . . . . . . . . . . . . . . . . . . . . . . . . . . . 520E.15 Library List Format for SVR4 Targets . . . . . . . . . . . . . . . . . . . . . . 521E.16 Memory Map Format . . . . . . . . . . . . . . . . . . . . . . . . . . . . . . . . . . . . . . . 521E.17 Thread List Format . . . . . . . . . . . . . . . . . . . . . . . . . . . . . . . . . . . . . . . . 522E.18 Traceframe Info Format . . . . . . . . . . . . . . . . . . . . . . . . . . . . . . . . . . . . 523
Appendix F The GDB Agent ExpressionMechanism . . . . . . . . . . . . . . . . . . . . . . . . . . . . . . . . . . 525
F.1 General Bytecode Design . . . . . . . . . . . . . . . . . . . . . . . . . . . . . . . . . . . . 525F.2 Bytecode Descriptions . . . . . . . . . . . . . . . . . . . . . . . . . . . . . . . . . . . . . . . 527F.3 Using Agent Expressions . . . . . . . . . . . . . . . . . . . . . . . . . . . . . . . . . . . . . 532F.4 Varying Target Capabilities . . . . . . . . . . . . . . . . . . . . . . . . . . . . . . . . . . 532F.5 Rationale . . . . . . . . . . . . . . . . . . . . . . . . . . . . . . . . . . . . . . . . . . . . . . . . . . . . 533
Appendix G Target Descriptions . . . . . . . . . . . . . 537G.1 Retrieving Descriptions . . . . . . . . . . . . . . . . . . . . . . . . . . . . . . . . . . . . . . 537G.2 Target Description Format . . . . . . . . . . . . . . . . . . . . . . . . . . . . . . . . . . 537
G.2.1 Inclusion . . . . . . . . . . . . . . . . . . . . . . . . . . . . . . . . . . . . . . . . . . . . . . . 538G.2.2 Architecture . . . . . . . . . . . . . . . . . . . . . . . . . . . . . . . . . . . . . . . . . . . . 538G.2.3 OS ABI . . . . . . . . . . . . . . . . . . . . . . . . . . . . . . . . . . . . . . . . . . . . . . . . 539G.2.4 Compatible Architecture . . . . . . . . . . . . . . . . . . . . . . . . . . . . . . . . 539G.2.5 Features . . . . . . . . . . . . . . . . . . . . . . . . . . . . . . . . . . . . . . . . . . . . . . . . 539G.2.6 Types . . . . . . . . . . . . . . . . . . . . . . . . . . . . . . . . . . . . . . . . . . . . . . . . . . 539G.2.7 Registers . . . . . . . . . . . . . . . . . . . . . . . . . . . . . . . . . . . . . . . . . . . . . . . 540
G.3 Predefined Target Types . . . . . . . . . . . . . . . . . . . . . . . . . . . . . . . . . . . . 541G.4 Standard Target Features . . . . . . . . . . . . . . . . . . . . . . . . . . . . . . . . . . . . 542
G.4.1 ARM Features . . . . . . . . . . . . . . . . . . . . . . . . . . . . . . . . . . . . . . . . . 542G.4.2 i386 Features . . . . . . . . . . . . . . . . . . . . . . . . . . . . . . . . . . . . . . . . . . . 543G.4.3 MIPS Features . . . . . . . . . . . . . . . . . . . . . . . . . . . . . . . . . . . . . . . . . 543G.4.4 M68K Features . . . . . . . . . . . . . . . . . . . . . . . . . . . . . . . . . . . . . . . . . 543G.4.5 PowerPC Features . . . . . . . . . . . . . . . . . . . . . . . . . . . . . . . . . . . . . . 544G.4.6 TMS320C6x Features . . . . . . . . . . . . . . . . . . . . . . . . . . . . . . . . . . . 544
Appendix H Operating System Information. . . . . . . . . . . . . . . . . . . . . . . . . . . . . . . . . . . . . . . . . . . . . . . 545
H.1 Process list . . . . . . . . . . . . . . . . . . . . . . . . . . . . . . . . . . . . . . . . . . . . . . . . . . 545
Appendix I Trace File Format . . . . . . . . . . . . . . . 547
Appendix J .gdb_index section format . . . . . . . 549
Appendix K GNU GENERAL PUBLICLICENSE . . . . . . . . . . . . . . . . . . . . . . . . . . . . . . . . . . . . 551

xiii
Appendix L GNU Free Documentation License. . . . . . . . . . . . . . . . . . . . . . . . . . . . . . . . . . . . . . . . . . . . . . . 563
Index . . . . . . . . . . . . . . . . . . . . . . . . . . . . . . . . . . . . . . . . . . . . . . 571

Summary of gdb 1
Summary of gdb
The purpose of a debugger such as gdb is to allow you to see what is going on “inside”another program while it executes—or what another program was doing at the moment itcrashed.
gdb can do four main kinds of things (plus other things in support of these) to help youcatch bugs in the act:
• Start your program, specifying anything that might affect its behavior.
• Make your program stop on specified conditions.
• Examine what has happened, when your program has stopped.
• Change things in your program, so you can experiment with correcting the effects ofone bug and go on to learn about another.
You can use gdb to debug programs written in C and C++. For more information, seeSection 15.4 [Supported Languages], page 165. For more information, see Section 15.4.1 [Cand C++], page 165.
Support for D is partial. For information on D, see Section 15.4.2 [D], page 171.
Support for Modula-2 is partial. For information on Modula-2, see Section 15.4.7[Modula-2], page 174.
Support for OpenCL C is partial. For information on OpenCL C, see Section 15.4.4[OpenCL C], page 172.
Debugging Pascal programs which use sets, subranges, file variables, or nested functionsdoes not currently work. gdb does not support entering expressions, printing values, orsimilar features using Pascal syntax.
gdb can be used to debug programs written in Fortran, although it may be necessaryto refer to some variables with a trailing underscore.
gdb can be used to debug programs written in Objective-C, using either the Ap-ple/NeXT or the GNU Objective-C runtime.
Free Software
gdb is free software, protected by the gnu General Public License (GPL). The GPL givesyou the freedom to copy or adapt a licensed program—but every person getting a copy alsogets with it the freedom to modify that copy (which means that they must get access to thesource code), and the freedom to distribute further copies. Typical software companies usecopyrights to limit your freedoms; the Free Software Foundation uses the GPL to preservethese freedoms.
Fundamentally, the General Public License is a license which says that you have thesefreedoms and that you cannot take these freedoms away from anyone else.
Free Software Needs Free Documentation
The biggest deficiency in the free software community today is not in the software—it is thelack of good free documentation that we can include with the free software. Many of ourmost important programs do not come with free reference manuals and free introductory
2 Debugging with gdb
texts. Documentation is an essential part of any software package; when an important freesoftware package does not come with a free manual and a free tutorial, that is a major gap.We have many such gaps today.
Consider Perl, for instance. The tutorial manuals that people normally use are non-free.How did this come about? Because the authors of those manuals published them withrestrictive terms—no copying, no modification, source files not available—which excludethem from the free software world.
That wasn’t the first time this sort of thing happened, and it was far from the last.Many times we have heard a GNU user eagerly describe a manual that he is writing, hisintended contribution to the community, only to learn that he had ruined everything bysigning a publication contract to make it non-free.
Free documentation, like free software, is a matter of freedom, not price. The problemwith the non-free manual is not that publishers charge a price for printed copies—that initself is fine. (The Free Software Foundation sells printed copies of manuals, too.) Theproblem is the restrictions on the use of the manual. Free manuals are available in sourcecode form, and give you permission to copy and modify. Non-free manuals do not allowthis.
The criteria of freedom for a free manual are roughly the same as for free software.Redistribution (including the normal kinds of commercial redistribution) must be permitted,so that the manual can accompany every copy of the program, both on-line and on paper.
Permission for modification of the technical content is crucial too. When people mod-ify the software, adding or changing features, if they are conscientious they will changethe manual too—so they can provide accurate and clear documentation for the modifiedprogram. A manual that leaves you no choice but to write a new manual to document achanged version of the program is not really available to our community.
Some kinds of limits on the way modification is handled are acceptable. For example,requirements to preserve the original author’s copyright notice, the distribution terms, orthe list of authors, are ok. It is also no problem to require modified versions to includenotice that they were modified. Even entire sections that may not be deleted or changedare acceptable, as long as they deal with nontechnical topics (like this one). These kinds ofrestrictions are acceptable because they don’t obstruct the community’s normal use of themanual.
However, it must be possible to modify all the technical content of the manual, and thendistribute the result in all the usual media, through all the usual channels. Otherwise, therestrictions obstruct the use of the manual, it is not free, and we need another manual toreplace it.
Please spread the word about this issue. Our community continues to lose manualsto proprietary publishing. If we spread the word that free software needs free referencemanuals and free tutorials, perhaps the next person who wants to contribute by writingdocumentation will realize, before it is too late, that only free manuals contribute to thefree software community.
If you are writing documentation, please insist on publishing it under the GNU FreeDocumentation License or another free documentation license. Remember that this deci-sion requires your approval—you don’t have to let the publisher decide. Some commercialpublishers will use a free license if you insist, but they will not propose the option; it is up
Summary of gdb 3
to you to raise the issue and say firmly that this is what you want. If the publisher youare dealing with refuses, please try other publishers. If you’re not sure whether a proposedlicense is free, write to [email protected].
You can encourage commercial publishers to sell more free, copylefted manuals andtutorials by buying them, and particularly by buying copies from the publishers that paidfor their writing or for major improvements. Meanwhile, try to avoid buying non-freedocumentation at all. Check the distribution terms of a manual before you buy it, andinsist that whoever seeks your business must respect your freedom. Check the history ofthe book, and try to reward the publishers that have paid or pay the authors to work on it.
The Free Software Foundation maintains a list of free documentation published by otherpublishers, at http://www.fsf.org/doc/other-free-books.html.
Contributors to gdb
Richard Stallman was the original author of gdb, and of many other gnu programs. Manyothers have contributed to its development. This section attempts to credit major contrib-utors. One of the virtues of free software is that everyone is free to contribute to it; withregret, we cannot actually acknowledge everyone here. The file ‘ChangeLog’ in the gdbdistribution approximates a blow-by-blow account.
Changes much prior to version 2.0 are lost in the mists of time.
Plea: Additions to this section are particularly welcome. If you or your friends(or enemies, to be evenhanded) have been unfairly omitted from this list, wewould like to add your names!
So that they may not regard their many labors as thankless, we particularly thank thosewho shepherded gdb through major releases: Andrew Cagney (releases 6.3, 6.2, 6.1, 6.0,5.3, 5.2, 5.1 and 5.0); Jim Blandy (release 4.18); Jason Molenda (release 4.17); Stan Shebs(release 4.14); Fred Fish (releases 4.16, 4.15, 4.13, 4.12, 4.11, 4.10, and 4.9); Stu Grossmanand John Gilmore (releases 4.8, 4.7, 4.6, 4.5, and 4.4); John Gilmore (releases 4.3, 4.2, 4.1,4.0, and 3.9); Jim Kingdon (releases 3.5, 3.4, and 3.3); and Randy Smith (releases 3.2, 3.1,and 3.0).
Richard Stallman, assisted at various times by Peter TerMaat, Chris Hanson, andRichard Mlynarik, handled releases through 2.8.
Michael Tiemann is the author of most of the gnu C++ support in gdb, with significantadditional contributions from Per Bothner and Daniel Berlin. James Clark wrote the gnuC++ demangler. Early work on C++ was by Peter TerMaat (who also did much generalupdate work leading to release 3.0).
gdb uses the BFD subroutine library to examine multiple object-file formats; BFD wasa joint project of David V. Henkel-Wallace, Rich Pixley, Steve Chamberlain, and JohnGilmore.
David Johnson wrote the original COFF support; Pace Willison did the original supportfor encapsulated COFF.
Brent Benson of Harris Computer Systems contributed DWARF 2 support.
Adam de Boor and Bradley Davis contributed the ISI Optimum V support. Per Bothner,Noboyuki Hikichi, and Alessandro Forin contributed MIPS support. Jean-Daniel Feketecontributed Sun 386i support. Chris Hanson improved the HP9000 support. Noboyuki

4 Debugging with gdb
Hikichi and Tomoyuki Hasei contributed Sony/News OS 3 support. David Johnson con-tributed Encore Umax support. Jyrki Kuoppala contributed Altos 3068 support. JeffLaw contributed HP PA and SOM support. Keith Packard contributed NS32K support.Doug Rabson contributed Acorn Risc Machine support. Bob Rusk contributed HarrisNighthawk CX-UX support. Chris Smith contributed Convex support (and Fortran de-bugging). Jonathan Stone contributed Pyramid support. Michael Tiemann contributedSPARC support. Tim Tucker contributed support for the Gould NP1 and Gould Powern-ode. Pace Willison contributed Intel 386 support. Jay Vosburgh contributed Symmetrysupport. Marko Mlinar contributed OpenRISC 1000 support.
Andreas Schwab contributed M68K gnu/Linux support.
Rich Schaefer and Peter Schauer helped with support of SunOS shared libraries.
Jay Fenlason and Roland McGrath ensured that gdb and GAS agree about severalmachine instruction sets.
Patrick Duval, Ted Goldstein, Vikram Koka and Glenn Engel helped develop remotedebugging. Intel Corporation, Wind River Systems, AMD, and ARM contributed remotedebugging modules for the i960, VxWorks, A29K UDI, and RDI targets, respectively.
Brian Fox is the author of the readline libraries providing command-line editing andcommand history.
Andrew Beers of SUNY Buffalo wrote the language-switching code, the Modula-2 sup-port, and contributed the Languages chapter of this manual.
Fred Fish wrote most of the support for Unix System Vr4. He also enhanced thecommand-completion support to cover C++ overloaded symbols.
Hitachi America (now Renesas America), Ltd. sponsored the support for H8/300,H8/500, and Super-H processors.
NEC sponsored the support for the v850, Vr4xxx, and Vr5xxx processors.
Mitsubishi (now Renesas) sponsored the support for D10V, D30V, and M32R/D proces-sors.
Toshiba sponsored the support for the TX39 Mips processor.
Matsushita sponsored the support for the MN10200 and MN10300 processors.
Fujitsu sponsored the support for SPARClite and FR30 processors.
Kung Hsu, Jeff Law, and Rick Sladkey added support for hardware watchpoints.
Michael Snyder added support for tracepoints.
Stu Grossman wrote gdbserver.
Jim Kingdon, Peter Schauer, Ian Taylor, and Stu Grossman made nearly innumerablebug fixes and cleanups throughout gdb.
The following people at the Hewlett-Packard Company contributed support for the PA-RISC 2.0 architecture, HP-UX 10.20, 10.30, and 11.0 (narrow mode), HP’s implementationof kernel threads, HP’s aC++ compiler, and the Text User Interface (nee Terminal UserInterface): Ben Krepp, Richard Title, John Bishop, Susan Macchia, Kathy Mann, SatishPai, India Paul, Steve Rehrauer, and Elena Zannoni. Kim Haase provided HP-specificinformation in this manual.
DJ Delorie ported gdb to MS-DOS, for the DJGPP project. Robert Hoehne madesignificant contributions to the DJGPP port.

Summary of gdb 5
Cygnus Solutions has sponsored gdb maintenance and much of its development since1991. Cygnus engineers who have worked on gdb fulltime include Mark Alexander, JimBlandy, Per Bothner, Kevin Buettner, Edith Epstein, Chris Faylor, Fred Fish, MartinHunt, Jim Ingham, John Gilmore, Stu Grossman, Kung Hsu, Jim Kingdon, John Metzler,Fernando Nasser, Geoffrey Noer, Dawn Perchik, Rich Pixley, Zdenek Radouch, Keith Seitz,Stan Shebs, David Taylor, and Elena Zannoni. In addition, Dave Brolley, Ian Carmichael,Steve Chamberlain, Nick Clifton, JT Conklin, Stan Cox, DJ Delorie, Ulrich Drepper, FrankEigler, Doug Evans, Sean Fagan, David Henkel-Wallace, Richard Henderson, Jeff Holcomb,Jeff Law, Jim Lemke, Tom Lord, Bob Manson, Michael Meissner, Jason Merrill, CatherineMoore, Drew Moseley, Ken Raeburn, Gavin Romig-Koch, Rob Savoye, Jamie Smith, MikeStump, Ian Taylor, Angela Thomas, Michael Tiemann, Tom Tromey, Ron Unrau, JimWilson, and David Zuhn have made contributions both large and small.
Andrew Cagney, Fernando Nasser, and Elena Zannoni, while working for Cygnus Solu-tions, implemented the original gdb/mi interface.
Jim Blandy added support for preprocessor macros, while working for Red Hat.
Andrew Cagney designed gdb’s architecture vector. Many people including AndrewCagney, Stephane Carrez, Randolph Chung, Nick Duffek, Richard Henderson, Mark Ket-tenis, Grace Sainsbury, Kei Sakamoto, Yoshinori Sato, Michael Snyder, Andreas Schwab,Jason Thorpe, Corinna Vinschen, Ulrich Weigand, and Elena Zannoni, helped with themigration of old architectures to this new framework.
Andrew Cagney completely re-designed and re-implemented gdb’s unwinder framework,this consisting of a fresh new design featuring frame IDs, independent frame sniffers, andthe sentinel frame. Mark Kettenis implemented the dwarf 2 unwinder, Jeff Johnston thelibunwind unwinder, and Andrew Cagney the dummy, sentinel, tramp, and trad unwinders.The architecture-specific changes, each involving a complete rewrite of the architecture’sframe code, were carried out by Jim Blandy, Joel Brobecker, Kevin Buettner, AndrewCagney, Stephane Carrez, Randolph Chung, Orjan Friberg, Richard Henderson, DanielJacobowitz, Jeff Johnston, Mark Kettenis, Theodore A. Roth, Kei Sakamoto, YoshinoriSato, Michael Snyder, Corinna Vinschen, and Ulrich Weigand.
Christian Zankel, Ross Morley, Bob Wilson, and Maxim Grigoriev from Tensilica, Inc.contributed support for Xtensa processors. Others who have worked on the Xtensa port ofgdb in the past include Steve Tjiang, John Newlin, and Scott Foehner.
Michael Eager and staff of Xilinx, Inc., contributed support for the Xilinx MicroBlazearchitecture.

Chapter 1: A Sample gdb Session 7
1 A Sample gdb Session
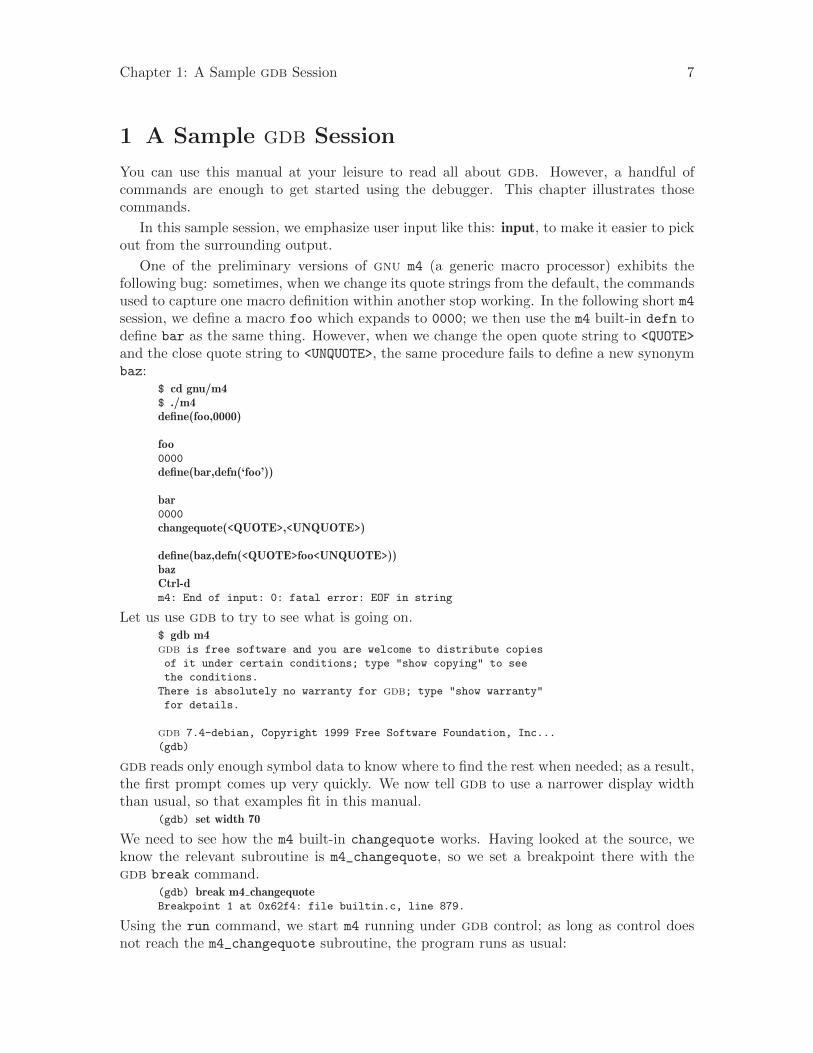
You can use this manual at your leisure to read all about gdb. However, a handful ofcommands are enough to get started using the debugger. This chapter illustrates thosecommands.
In this sample session, we emphasize user input like this: input, to make it easier to pickout from the surrounding output.
One of the preliminary versions of gnu m4 (a generic macro processor) exhibits thefollowing bug: sometimes, when we change its quote strings from the default, the commandsused to capture one macro definition within another stop working. In the following short m4session, we define a macro foo which expands to 0000; we then use the m4 built-in defn todefine bar as the same thing. However, when we change the open quote string to <QUOTE>
and the close quote string to <UNQUOTE>, the same procedure fails to define a new synonymbaz:
$ cd gnu/m4$ ./m4define(foo,0000)
foo0000
define(bar,defn(‘foo’))
bar0000
changequote(<QUOTE>,<UNQUOTE>)
define(baz,defn(<QUOTE>foo<UNQUOTE>))bazCtrl-dm4: End of input: 0: fatal error: EOF in string
Let us use gdb to try to see what is going on.$ gdb m4gdb is free software and you are welcome to distribute copies
of it under certain conditions; type "show copying" to see
the conditions.
There is absolutely no warranty for gdb; type "show warranty"
for details.
gdb 7.4-debian, Copyright 1999 Free Software Foundation, Inc...
(gdb)
gdb reads only enough symbol data to know where to find the rest when needed; as a result,the first prompt comes up very quickly. We now tell gdb to use a narrower display widththan usual, so that examples fit in this manual.
(gdb) set width 70
We need to see how the m4 built-in changequote works. Having looked at the source, weknow the relevant subroutine is m4_changequote, so we set a breakpoint there with thegdb break command.
(gdb) break m4 changequoteBreakpoint 1 at 0x62f4: file builtin.c, line 879.
Using the run command, we start m4 running under gdb control; as long as control doesnot reach the m4_changequote subroutine, the program runs as usual:
8 Debugging with gdb
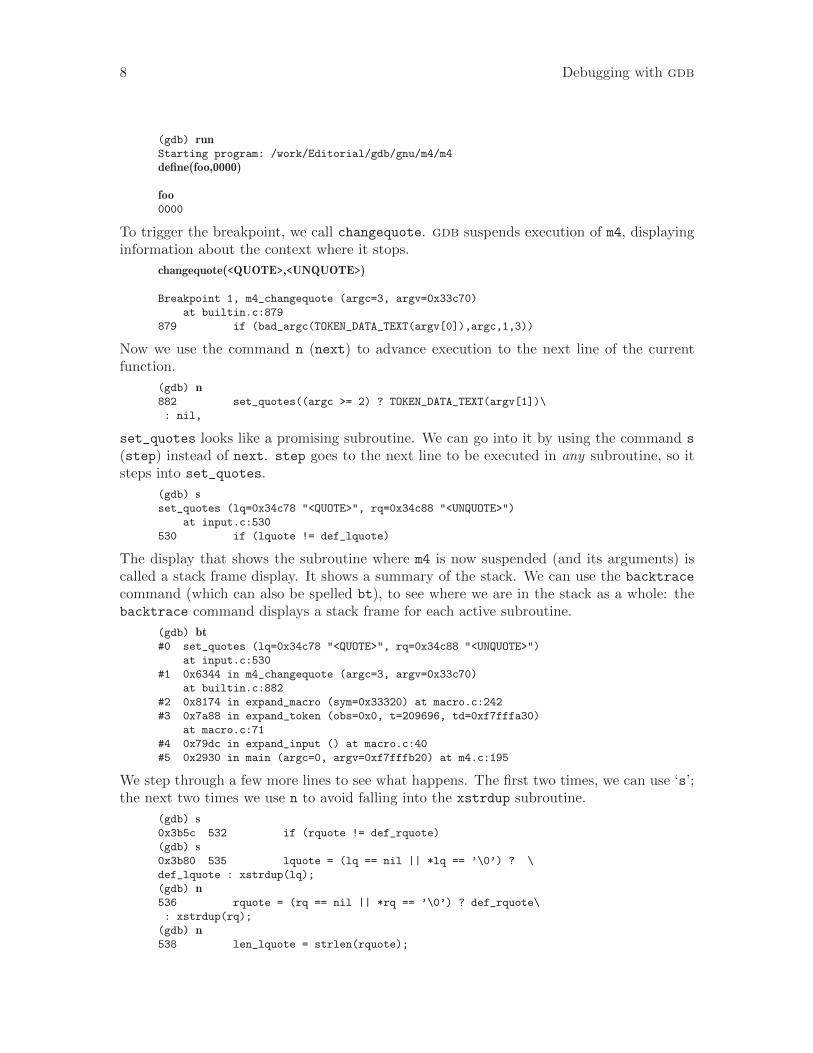
(gdb) runStarting program: /work/Editorial/gdb/gnu/m4/m4
define(foo,0000)
foo0000
To trigger the breakpoint, we call changequote. gdb suspends execution of m4, displayinginformation about the context where it stops.
changequote(<QUOTE>,<UNQUOTE>)
Breakpoint 1, m4_changequote (argc=3, argv=0x33c70)
at builtin.c:879
879 if (bad_argc(TOKEN_DATA_TEXT(argv[0]),argc,1,3))
Now we use the command n (next) to advance execution to the next line of the currentfunction.
(gdb) n882 set_quotes((argc >= 2) ? TOKEN_DATA_TEXT(argv[1])\
: nil,
set_quotes looks like a promising subroutine. We can go into it by using the command s
(step) instead of next. step goes to the next line to be executed in any subroutine, so itsteps into set_quotes.
(gdb) sset_quotes (lq=0x34c78 "<QUOTE>", rq=0x34c88 "<UNQUOTE>")
at input.c:530
530 if (lquote != def_lquote)
The display that shows the subroutine where m4 is now suspended (and its arguments) iscalled a stack frame display. It shows a summary of the stack. We can use the backtrace
command (which can also be spelled bt), to see where we are in the stack as a whole: thebacktrace command displays a stack frame for each active subroutine.
(gdb) bt#0 set_quotes (lq=0x34c78 "<QUOTE>", rq=0x34c88 "<UNQUOTE>")
at input.c:530
#1 0x6344 in m4_changequote (argc=3, argv=0x33c70)
at builtin.c:882
#2 0x8174 in expand_macro (sym=0x33320) at macro.c:242
#3 0x7a88 in expand_token (obs=0x0, t=209696, td=0xf7fffa30)
at macro.c:71
#4 0x79dc in expand_input () at macro.c:40
#5 0x2930 in main (argc=0, argv=0xf7fffb20) at m4.c:195
We step through a few more lines to see what happens. The first two times, we can use ‘s’;the next two times we use n to avoid falling into the xstrdup subroutine.
(gdb) s0x3b5c 532 if (rquote != def_rquote)
(gdb) s0x3b80 535 lquote = (lq == nil || *lq == ’\0’) ? \
def_lquote : xstrdup(lq);
(gdb) n536 rquote = (rq == nil || *rq == ’\0’) ? def_rquote\
: xstrdup(rq);
(gdb) n538 len_lquote = strlen(rquote);
Chapter 1: A Sample gdb Session 9
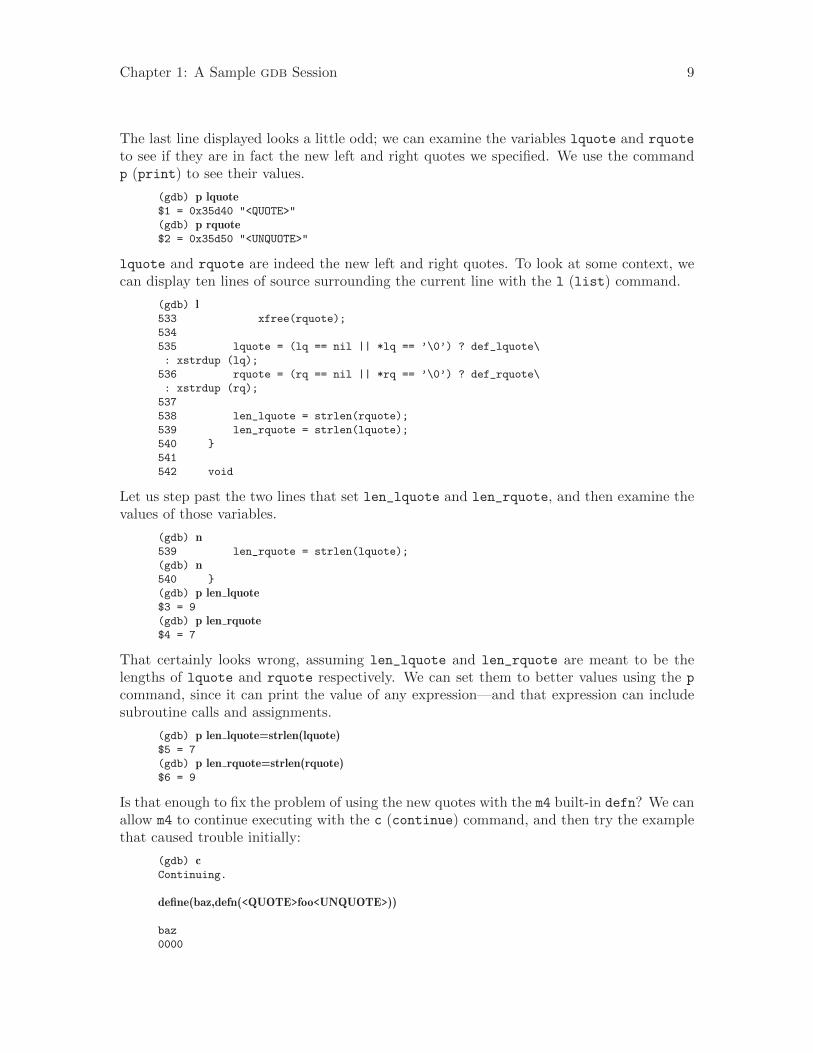
The last line displayed looks a little odd; we can examine the variables lquote and rquote
to see if they are in fact the new left and right quotes we specified. We use the commandp (print) to see their values.
(gdb) p lquote$1 = 0x35d40 "<QUOTE>"
(gdb) p rquote$2 = 0x35d50 "<UNQUOTE>"
lquote and rquote are indeed the new left and right quotes. To look at some context, wecan display ten lines of source surrounding the current line with the l (list) command.
(gdb) l533 xfree(rquote);
534
535 lquote = (lq == nil || *lq == ’\0’) ? def_lquote\
: xstrdup (lq);
536 rquote = (rq == nil || *rq == ’\0’) ? def_rquote\
: xstrdup (rq);
537
538 len_lquote = strlen(rquote);
539 len_rquote = strlen(lquote);
540 }
541
542 void
Let us step past the two lines that set len_lquote and len_rquote, and then examine thevalues of those variables.
(gdb) n539 len_rquote = strlen(lquote);
(gdb) n540 }
(gdb) p len lquote$3 = 9
(gdb) p len rquote$4 = 7
That certainly looks wrong, assuming len_lquote and len_rquote are meant to be thelengths of lquote and rquote respectively. We can set them to better values using the p
command, since it can print the value of any expression—and that expression can includesubroutine calls and assignments.
(gdb) p len lquote=strlen(lquote)$5 = 7
(gdb) p len rquote=strlen(rquote)$6 = 9
Is that enough to fix the problem of using the new quotes with the m4 built-in defn? We canallow m4 to continue executing with the c (continue) command, and then try the examplethat caused trouble initially:
(gdb) cContinuing.
define(baz,defn(<QUOTE>foo<UNQUOTE>))
baz
0000
10 Debugging with gdb
Success! The new quotes now work just as well as the default ones. The problem seems tohave been just the two typos defining the wrong lengths. We allow m4 exit by giving it anEOF as input:
Ctrl-dProgram exited normally.
The message ‘Program exited normally.’ is from gdb; it indicates m4 has finished execut-ing. We can end our gdb session with the gdb quit command.
(gdb) quit
Chapter 2: Getting In and Out of gdb 11
2 Getting In and Out of gdb
This chapter discusses how to start gdb, and how to get out of it. The essentials are:
• type ‘gdb’ to start gdb.
• type quit or Ctrl-d to exit.
2.1 Invoking gdb
Invoke gdb by running the program gdb. Once started, gdb reads commands from theterminal until you tell it to exit.
You can also run gdb with a variety of arguments and options, to specify more of yourdebugging environment at the outset.
The command-line options described here are designed to cover a variety of situations;in some environments, some of these options may effectively be unavailable.
The most usual way to start gdb is with one argument, specifying an executable program:
gdb program
You can also start with both an executable program and a core file specified:
gdb program core
You can, instead, specify a process ID as a second argument, if you want to debug arunning process:
gdb program 1234
would attach gdb to process 1234 (unless you also have a file named ‘1234’; gdb does checkfor a core file first).
Taking advantage of the second command-line argument requires a fairly complete op-erating system; when you use gdb as a remote debugger attached to a bare board, theremay not be any notion of “process”, and there is often no way to get a core dump. gdbwill warn you if it is unable to attach or to read core dumps.
You can optionally have gdb pass any arguments after the executable file to the inferiorusing --args. This option stops option processing.
gdb --args gcc -O2 -c foo.c
This will cause gdb to debug gcc, and to set gcc’s command-line arguments (seeSection 4.3 [Arguments], page 28) to ‘-O2 -c foo.c’.
You can run gdb without printing the front material, which describes gdb’snon-warranty, by specifying -silent:
gdb -silent
You can further control how gdb starts up by using command-line options. gdb itself canremind you of the options available.
Type
gdb -help
to display all available options and briefly describe their use (‘gdb -h’ is a shorter equiva-lent).
All options and command line arguments you give are processed in sequential order. Theorder makes a difference when the ‘-x’ option is used.
12 Debugging with gdb
2.1.1 Choosing Files
When gdb starts, it reads any arguments other than options as specifying an executablefile and core file (or process ID). This is the same as if the arguments were specified by the‘-se’ and ‘-c’ (or ‘-p’) options respectively. (gdb reads the first argument that does nothave an associated option flag as equivalent to the ‘-se’ option followed by that argument;and the second argument that does not have an associated option flag, if any, as equivalentto the ‘-c’/‘-p’ option followed by that argument.) If the second argument begins with adecimal digit, gdb will first attempt to attach to it as a process, and if that fails, attemptto open it as a corefile. If you have a corefile whose name begins with a digit, you canprevent gdb from treating it as a pid by prefixing it with ‘./’, e.g. ‘./12345’.
If gdb has not been configured to included core file support, such as for most embeddedtargets, then it will complain about a second argument and ignore it.
Many options have both long and short forms; both are shown in the following list. gdbalso recognizes the long forms if you truncate them, so long as enough of the option ispresent to be unambiguous. (If you prefer, you can flag option arguments with ‘--’ ratherthan ‘-’, though we illustrate the more usual convention.)
-symbols file
-s file Read symbol table from file file.
-exec file
-e file Use file file as the executable file to execute when appropriate, and for examiningpure data in conjunction with a core dump.
-se file Read symbol table from file file and use it as the executable file.
-core file
-c file Use file file as a core dump to examine.
-pid number
-p number
Connect to process ID number, as with the attach command.
-command file
-x file Execute commands from file file. The contents of this file is evaluated exactlyas the source command would. See Section 23.1.3 [Command files], page 278.
-eval-command command
-ex command
Execute a single gdb command.
This option may be used multiple times to call multiple commands. It may alsobe interleaved with ‘-command’ as required.
gdb -ex ’target sim’ -ex ’load’ \
-x setbreakpoints -ex ’run’ a.out
-directory directory
-d directory
Add directory to the path to search for source and script files.
Chapter 2: Getting In and Out of gdb 13
-r
-readnow Read each symbol file’s entire symbol table immediately, rather than the default,which is to read it incrementally as it is needed. This makes startup slower,but makes future operations faster.
2.1.2 Choosing Modes
You can run gdb in various alternative modes—for example, in batch mode or quiet mode.
-nx
-n Do not execute commands found in any initialization files. Normally, gdb exe-cutes the commands in these files after all the command options and argumentshave been processed. See Section 23.1.3 [Command Files], page 278.
-quiet
-silent
-q “Quiet”. Do not print the introductory and copyright messages. These mes-sages are also suppressed in batch mode.
-batch Run in batch mode. Exit with status 0 after processing all the command filesspecified with ‘-x’ (and all commands from initialization files, if not inhibitedwith ‘-n’). Exit with nonzero status if an error occurs in executing the gdbcommands in the command files. Batch mode also disables pagination, sets un-limited terminal width and height see Section 22.4 [Screen Size], page 267, andacts as if set confirm off were in effect (see Section 22.7 [Messages/Warnings],page 270).
Batch mode may be useful for running gdb as a filter, for example to downloadand run a program on another computer; in order to make this more useful, themessage
Program exited normally.
(which is ordinarily issued whenever a program running under gdb controlterminates) is not issued when running in batch mode.
-batch-silent
Run in batch mode exactly like ‘-batch’, but totally silently. All gdb output tostdout is prevented (stderr is unaffected). This is much quieter than ‘-silent’and would be useless for an interactive session.
This is particularly useful when using targets that give ‘Loading section’ mes-sages, for example.
Note that targets that give their output via gdb, as opposed to writing directlyto stdout, will also be made silent.
-return-child-result
The return code from gdb will be the return code from the child process (theprocess being debugged), with the following exceptions:
• gdb exits abnormally. E.g., due to an incorrect argument or an internalerror. In this case the exit code is the same as it would have been without‘-return-child-result’.
• The user quits with an explicit value. E.g., ‘quit 1’.
14 Debugging with gdb
• The child process never runs, or is not allowed to terminate, in which casethe exit code will be -1.
This option is useful in conjunction with ‘-batch’ or ‘-batch-silent’, whengdb is being used as a remote program loader or simulator interface.
-nowindows
-nw “No windows”. If gdb comes with a graphical user interface (GUI) built in,then this option tells gdb to only use the command-line interface. If no GUI isavailable, this option has no effect.
-windows
-w If gdb includes a GUI, then this option requires it to be used if possible.
-cd directory
Run gdb using directory as its working directory, instead of the current direc-tory.
-data-directory directory
Run gdb using directory as its data directory. The data directory is where gdbsearches for its auxiliary files. See Section 18.5 [Data Files], page 214.
-fullname
-f gnu Emacs sets this option when it runs gdb as a subprocess. It tells gdb tooutput the full file name and line number in a standard, recognizable fashioneach time a stack frame is displayed (which includes each time your programstops). This recognizable format looks like two ‘\032’ characters, followed bythe file name, line number and character position separated by colons, and anewline. The Emacs-to-gdb interface program uses the two ‘\032’ charactersas a signal to display the source code for the frame.
-epoch The Epoch Emacs-gdb interface sets this option when it runs gdb as a subpro-cess. It tells gdb to modify its print routines so as to allow Epoch to displayvalues of expressions in a separate window.
-annotate level
This option sets the annotation level inside gdb. Its effect is identical to using‘set annotate level ’ (see Chapter 28 [Annotations], page 411). The annota-tion level controls how much information gdb prints together with its prompt,values of expressions, source lines, and other types of output. Level 0 is thenormal, level 1 is for use when gdb is run as a subprocess of gnu Emacs, level3 is the maximum annotation suitable for programs that control gdb, and level2 has been deprecated.
The annotation mechanism has largely been superseded by gdb/mi (seeChapter 27 [GDB/MI], page 337).
--args Change interpretation of command line so that arguments following the exe-cutable file are passed as command line arguments to the inferior. This optionstops option processing.
-baud bps
-b bps Set the line speed (baud rate or bits per second) of any serial interface used bygdb for remote debugging.
Chapter 2: Getting In and Out of gdb 15
-l timeout
Set the timeout (in seconds) of any communication used by gdb for remotedebugging.
-tty device
-t device
Run using device for your program’s standard input and output.
-tui Activate the Text User Interface when starting. The Text User Interface man-ages several text windows on the terminal, showing source, assembly, regis-ters and gdb command outputs (see Chapter 25 [gdb Text User Interface],page 329). Alternatively, the Text User Interface can be enabled by invokingthe program ‘gdbtui’. Do not use this option if you run gdb from Emacs (seeChapter 26 [Using gdb under gnu Emacs], page 335).
-interpreter interp
Use the interpreter interp for interface with the controlling program or device.This option is meant to be set by programs which communicate with gdb usingit as a back end. See Chapter 24 [Command Interpreters], page 327.
‘--interpreter=mi’ (or ‘--interpreter=mi2’) causes gdb to use the gdb/miinterface (see Chapter 27 [The gdb/mi Interface], page 337) included since gdbversion 6.0. The previous gdb/mi interface, included in gdb version 5.3 andselected with ‘--interpreter=mi1’, is deprecated. Earlier gdb/mi interfacesare no longer supported.
-write Open the executable and core files for both reading and writing. This is equiv-alent to the ‘set write on’ command inside gdb (see Section 17.6 [Patching],page 199).
-statistics
This option causes gdb to print statistics about time and memory usage afterit completes each command and returns to the prompt.
-version This option causes gdb to print its version number and no-warranty blurb, andexit.
2.1.3 What gdb Does During Startup
Here’s the description of what gdb does during session startup:
1. Sets up the command interpreter as specified by the command line (see Section 2.1.2[Mode Options], page 13).
2. Reads the system-wide init file (if ‘--with-system-gdbinit’ was used when buildinggdb; see Section C.6 [System-wide configuration and settings], page 458) and executesall the commands in that file.
3. Reads the init file (if any) in your home directory1 and executes all the commands inthat file.
4. Processes command line options and operands.
1 On DOS/Windows systems, the home directory is the one pointed to by the HOME environment variable.
16 Debugging with gdb
5. Reads and executes the commands from init file (if any) in the current working direc-tory. This is only done if the current directory is different from your home directory.Thus, you can have more than one init file, one generic in your home directory, andanother, specific to the program you are debugging, in the directory where you invokegdb.
6. If the command line specified a program to debug, or a process to attach to, or a corefile, gdb loads any auto-loaded scripts provided for the program or for its loaded sharedlibraries. See Section 23.2.3 [Auto-loading], page 321.
If you wish to disable the auto-loading during startup, you must do something like thefollowing:
$ gdb -ex "set auto-load-scripts off" -ex "file myprogram"
The following does not work because the auto-loading is turned off too late:
$ gdb -ex "set auto-load-scripts off" myprogram
7. Reads command files specified by the ‘-x’ option. See Section 23.1.3 [Command Files],page 278, for more details about gdb command files.
8. Reads the command history recorded in the history file. See Section 22.3 [CommandHistory], page 266, for more details about the command history and the files wheregdb records it.
Init files use the same syntax as command files (see Section 23.1.3 [Command Files],page 278) and are processed by gdb in the same way. The init file in your home directorycan set options (such as ‘set complaints’) that affect subsequent processing of commandline options and operands. Init files are not executed if you use the ‘-nx’ option (seeSection 2.1.2 [Choosing Modes], page 13).
To display the list of init files loaded by gdb at startup, you can use gdb --help.
The gdb init files are normally called ‘.gdbinit’. The DJGPP port of gdb uses thename ‘gdb.ini’, due to the limitations of file names imposed by DOS filesystems. TheWindows ports of gdb use the standard name, but if they find a ‘gdb.ini’ file, they warnyou about that and suggest to rename the file to the standard name.
2.2 Quitting gdb
quit [expression ]q To exit gdb, use the quit command (abbreviated q), or type an end-of-file
character (usually Ctrl-d). If you do not supply expression, gdb will terminatenormally; otherwise it will terminate using the result of expression as the errorcode.
An interrupt (often Ctrl-c) does not exit from gdb, but rather terminates the actionof any gdb command that is in progress and returns to gdb command level. It is safe totype the interrupt character at any time because gdb does not allow it to take effect untila time when it is safe.
If you have been using gdb to control an attached process or device, you can releaseit with the detach command (see Section 4.7 [Debugging an Already-running Process],page 31).
Chapter 2: Getting In and Out of gdb 17
2.3 Shell Commands
If you need to execute occasional shell commands during your debugging session, there isno need to leave or suspend gdb; you can just use the shell command.
shell command-string
!command-string
Invoke a standard shell to execute command-string. Note that no space isneeded between ! and command-string. If it exists, the environment variableSHELL determines which shell to run. Otherwise gdb uses the default shell(‘/bin/sh’ on Unix systems, ‘COMMAND.COM’ on MS-DOS, etc.).
The utility make is often needed in development environments. You do not have to usethe shell command for this purpose in gdb:
make make-args
Execute the make program with the specified arguments. This is equivalent to‘shell make make-args ’.
2.4 Logging Output
You may want to save the output of gdb commands to a file. There are several commandsto control gdb’s logging.
set logging on
Enable logging.
set logging off
Disable logging.
set logging file file
Change the name of the current logfile. The default logfile is ‘gdb.txt’.
set logging overwrite [on|off]
By default, gdb will append to the logfile. Set overwrite if you want set
logging on to overwrite the logfile instead.
set logging redirect [on|off]
By default, gdb output will go to both the terminal and the logfile. Setredirect if you want output to go only to the log file.
show logging
Show the current values of the logging settings.

Chapter 3: gdb Commands 19
3 gdb Commands
You can abbreviate a gdb command to the first few letters of the command name, if thatabbreviation is unambiguous; and you can repeat certain gdb commands by typing justRET. You can also use the TAB key to get gdb to fill out the rest of a word in a command(or to show you the alternatives available, if there is more than one possibility).
3.1 Command Syntax
A gdb command is a single line of input. There is no limit on how long it can be. Itstarts with a command name, which is followed by arguments whose meaning depends onthe command name. For example, the command step accepts an argument which is thenumber of times to step, as in ‘step 5’. You can also use the step command with noarguments. Some commands do not allow any arguments.
gdb command names may always be truncated if that abbreviation is unambiguous.Other possible command abbreviations are listed in the documentation for individual com-mands. In some cases, even ambiguous abbreviations are allowed; for example, s is speciallydefined as equivalent to step even though there are other commands whose names startwith s. You can test abbreviations by using them as arguments to the help command.
A blank line as input to gdb (typing just RET) means to repeat the previous command.Certain commands (for example, run) will not repeat this way; these are commands whoseunintentional repetition might cause trouble and which you are unlikely to want to repeat.User-defined commands can disable this feature; see Section 23.1.1 [Define], page 275.
The list and x commands, when you repeat them with RET, construct new argumentsrather than repeating exactly as typed. This permits easy scanning of source or memory.
gdb can also use RET in another way: to partition lengthy output, in a way similar tothe common utility more (see Section 22.4 [Screen Size], page 267). Since it is easy to pressone RET too many in this situation, gdb disables command repetition after any commandthat generates this sort of display.
Any text from a # to the end of the line is a comment; it does nothing. This is usefulmainly in command files (see Section 23.1.3 [Command Files], page 278).
The Ctrl-o binding is useful for repeating a complex sequence of commands. Thiscommand accepts the current line, like RET, and then fetches the next line relative to thecurrent line from the history for editing.
3.2 Command Completion
gdb can fill in the rest of a word in a command for you, if there is only one possibility;it can also show you what the valid possibilities are for the next word in a command, atany time. This works for gdb commands, gdb subcommands, and the names of symbolsin your program.
Press the TAB key whenever you want gdb to fill out the rest of a word. If there is onlyone possibility, gdb fills in the word, and waits for you to finish the command (or pressRET to enter it). For example, if you type
(gdb) info bre TAB
gdb fills in the rest of the word ‘breakpoints’, since that is the only info subcommandbeginning with ‘bre’:
20 Debugging with gdb
(gdb) info breakpoints
You can either press RET at this point, to run the info breakpoints command, orbackspace and enter something else, if ‘breakpoints’ does not look like the command youexpected. (If you were sure you wanted info breakpoints in the first place, you might aswell just type RET immediately after ‘info bre’, to exploit command abbreviations ratherthan command completion).
If there is more than one possibility for the next word when you press TAB, gdb soundsa bell. You can either supply more characters and try again, or just press TAB a secondtime; gdb displays all the possible completions for that word. For example, you might wantto set a breakpoint on a subroutine whose name begins with ‘make_’, but when you type bmake_TAB gdb just sounds the bell. Typing TAB again displays all the function names inyour program that begin with those characters, for example:
(gdb) b make_ TAB
gdb sounds bell; press TAB again, to see:make_a_section_from_file make_environ
make_abs_section make_function_type
make_blockvector make_pointer_type
make_cleanup make_reference_type
make_command make_symbol_completion_list
(gdb) b make_
After displaying the available possibilities, gdb copies your partial input (‘b make_’ in theexample) so you can finish the command.
If you just want to see the list of alternatives in the first place, you can press M-? ratherthan pressing TAB twice. M-? means META ?. You can type this either by holding down akey designated as the META shift on your keyboard (if there is one) while typing ?, or asESC followed by ?.
Sometimes the string you need, while logically a “word”, may contain parentheses orother characters that gdb normally excludes from its notion of a word. To permit wordcompletion to work in this situation, you may enclose words in ’ (single quote marks) ingdb commands.
The most likely situation where you might need this is in typing the name of a C++function. This is because C++ allows function overloading (multiple definitions of the samefunction, distinguished by argument type). For example, when you want to set a breakpointyou may need to distinguish whether you mean the version of name that takes an int
parameter, name(int), or the version that takes a float parameter, name(float). To usethe word-completion facilities in this situation, type a single quote ’ at the beginning of thefunction name. This alerts gdb that it may need to consider more information than usualwhen you press TAB or M-? to request word completion:
(gdb) b ’bubble( M-?
bubble(double,double) bubble(int,int)
(gdb) b ’bubble(
In some cases, gdb can tell that completing a name requires using quotes. When thishappens, gdb inserts the quote for you (while completing as much as it can) if you do nottype the quote in the first place:
(gdb) b bub TAB
gdb alters your input line to the following, and rings a bell:(gdb) b ’bubble(
Chapter 3: gdb Commands 21
In general, gdb can tell that a quote is needed (and inserts it) if you have not yet startedtyping the argument list when you ask for completion on an overloaded symbol.
For more information about overloaded functions, see Section 15.4.1.3 [C++ Expressions],page 168. You can use the command set overload-resolution off to disable overloadresolution; see Section 15.4.1.7 [gdb Features for C++], page 170.
When completing in an expression which looks up a field in a structure, gdb also tries1
to limit completions to the field names available in the type of the left-hand-side:(gdb) p gdb_stdout.M-?
magic to_fputs to_rewind
to_data to_isatty to_write
to_delete to_put to_write_async_safe
to_flush to_read
This is because the gdb_stdout is a variable of the type struct ui_file that is defined ingdb sources as follows:
struct ui_file
{
int *magic;
ui_file_flush_ftype *to_flush;
ui_file_write_ftype *to_write;
ui_file_write_async_safe_ftype *to_write_async_safe;
ui_file_fputs_ftype *to_fputs;
ui_file_read_ftype *to_read;
ui_file_delete_ftype *to_delete;
ui_file_isatty_ftype *to_isatty;
ui_file_rewind_ftype *to_rewind;
ui_file_put_ftype *to_put;
void *to_data;
}
3.3 Getting Help
You can always ask gdb itself for information on its commands, using the command help.
help
h You can use help (abbreviated h) with no arguments to display a short list ofnamed classes of commands:
(gdb) help
List of classes of commands:
aliases -- Aliases of other commands
breakpoints -- Making program stop at certain points
data -- Examining data
files -- Specifying and examining files
internals -- Maintenance commands
obscure -- Obscure features
running -- Running the program
stack -- Examining the stack
status -- Status inquiries
support -- Support facilities
tracepoints -- Tracing of program execution without
stopping the program
1 The completer can be confused by certain kinds of invalid expressions. Also, it only examines the statictype of the expression, not the dynamic type.
22 Debugging with gdb
user-defined -- User-defined commands
Type "help" followed by a class name for a list of
commands in that class.
Type "help" followed by command name for full
documentation.
Command name abbreviations are allowed if unambiguous.
(gdb)
help class
Using one of the general help classes as an argument, you can get a list of theindividual commands in that class. For example, here is the help display forthe class status:
(gdb) help status
Status inquiries.
List of commands:
info -- Generic command for showing things
about the program being debugged
show -- Generic command for showing things
about the debugger
Type "help" followed by command name for full
documentation.
Command name abbreviations are allowed if unambiguous.
(gdb)
help command
With a command name as help argument, gdb displays a short paragraph onhow to use that command.
apropos args
The apropos command searches through all of the gdb commands, and theirdocumentation, for the regular expression specified in args. It prints out allmatches found. For example:
apropos reload
results in:set symbol-reloading -- Set dynamic symbol table reloading
multiple times in one run
show symbol-reloading -- Show dynamic symbol table reloading
multiple times in one run
complete args
The complete args command lists all the possible completions for the begin-ning of a command. Use args to specify the beginning of the command youwant completed. For example:
complete i
results in:if
ignore
info
inspect
This is intended for use by gnu Emacs.
Chapter 3: gdb Commands 23
In addition to help, you can use the gdb commands info and show to inquire about thestate of your program, or the state of gdb itself. Each command supports many topics ofinquiry; this manual introduces each of them in the appropriate context. The listings underinfo and under show in the Index point to all the sub-commands. See [Index], page 571.
info This command (abbreviated i) is for describing the state of your program. Forexample, you can show the arguments passed to a function with info args,list the registers currently in use with info registers, or list the breakpointsyou have set with info breakpoints. You can get a complete list of the info
sub-commands with help info.
set You can assign the result of an expression to an environment variable with set.For example, you can set the gdb prompt to a $-sign with set prompt $.
show In contrast to info, show is for describing the state of gdb itself. You canchange most of the things you can show, by using the related command set;for example, you can control what number system is used for displays with set
radix, or simply inquire which is currently in use with show radix.
To display all the settable parameters and their current values, you can useshow with no arguments; you may also use info set. Both commands producethe same display.
Here are three miscellaneous show subcommands, all of which are exceptional in lackingcorresponding set commands:
show version
Show what version of gdb is running. You should include this information ingdb bug-reports. If multiple versions of gdb are in use at your site, you mayneed to determine which version of gdb you are running; as gdb evolves, newcommands are introduced, and old ones may wither away. Also, many systemvendors ship variant versions of gdb, and there are variant versions of gdb ingnu/Linux distributions as well. The version number is the same as the oneannounced when you start gdb.
show copying
info copying
Display information about permission for copying gdb.
show warranty
info warranty
Display the gnu “NO WARRANTY” statement, or a warranty, if your versionof gdb comes with one.

Chapter 4: Running Programs Under gdb 25
4 Running Programs Under gdb
When you run a program under gdb, you must first generate debugging information whenyou compile it.
You may start gdb with its arguments, if any, in an environment of your choice. If youare doing native debugging, you may redirect your program’s input and output, debug analready running process, or kill a child process.
4.1 Compiling for Debugging
In order to debug a program effectively, you need to generate debugging information whenyou compile it. This debugging information is stored in the object file; it describes the datatype of each variable or function and the correspondence between source line numbers andaddresses in the executable code.
To request debugging information, specify the ‘-g’ option when you run the compiler.
Programs that are to be shipped to your customers are compiled with optimizations,using the ‘-O’ compiler option. However, some compilers are unable to handle the ‘-g’ and‘-O’ options together. Using those compilers, you cannot generate optimized executablescontaining debugging information.
gcc, the gnu C/C++ compiler, supports ‘-g’ with or without ‘-O’, making it possibleto debug optimized code. We recommend that you always use ‘-g’ whenever you compilea program. You may think your program is correct, but there is no sense in pushing yourluck. For more information, see Chapter 11 [Optimized Code], page 131.
Older versions of the gnu C compiler permitted a variant option ‘-gg’ for debugginginformation. gdb no longer supports this format; if your gnu C compiler has this option,do not use it.
gdb knows about preprocessor macros and can show you their expansion (see Chapter 12[Macros], page 135). Most compilers do not include information about preprocessor macrosin the debugging information if you specify the ‘-g’ flag alone. Version 3.1 and later of gcc,the gnu C compiler, provides macro information if you are using the DWARF debuggingformat, and specify the option ‘-g3’.
See Section “Options for Debugging Your Program or GCC” in Using the gnu CompilerCollection (GCC), for more information on gcc options affecting debug information.
You will have the best debugging experience if you use the latest version of the DWARFdebugging format that your compiler supports. DWARF is currently the most expressiveand best supported debugging format in gdb.
26 Debugging with gdb
4.2 Starting your Program
run
r Use the run command to start your program under gdb. You must first spec-ify the program name (except on VxWorks) with an argument to gdb (seeChapter 2 [Getting In and Out of gdb], page 11), or by using the file orexec-file command (see Section 18.1 [Commands to Specify Files], page 201).
If you are running your program in an execution environment that supports processes,run creates an inferior process and makes that process run your program. In some envi-ronments without processes, run jumps to the start of your program. Other targets, like‘remote’, are always running. If you get an error message like this one:
The "remote" target does not support "run".
Try "help target" or "continue".
then use continue to run your program. You may need load first (see [load], page 217).
The execution of a program is affected by certain information it receives from its superior.gdb provides ways to specify this information, which you must do before starting yourprogram. (You can change it after starting your program, but such changes only affect yourprogram the next time you start it.) This information may be divided into four categories:
The arguments.Specify the arguments to give your program as the arguments of the run com-mand. If a shell is available on your target, the shell is used to pass the argu-ments, so that you may use normal conventions (such as wildcard expansion orvariable substitution) in describing the arguments. In Unix systems, you cancontrol which shell is used with the SHELL environment variable. See Section 4.3[Your Program’s Arguments], page 28.
The environment.Your program normally inherits its environment from gdb, but you can usethe gdb commands set environment and unset environment to change partsof the environment that affect your program. See Section 4.4 [Your Program’sEnvironment], page 29.
The working directory.Your program inherits its working directory from gdb. You can set the gdbworking directory with the cd command in gdb. See Section 4.5 [Your Pro-gram’s Working Directory], page 30.
The standard input and output.Your program normally uses the same device for standard input and standardoutput as gdb is using. You can redirect input and output in the run commandline, or you can use the tty command to set a different device for your program.See Section 4.6 [Your Program’s Input and Output], page 30.
Warning: While input and output redirection work, you cannot use pipes topass the output of the program you are debugging to another program; if youattempt this, gdb is likely to wind up debugging the wrong program.
Chapter 4: Running Programs Under gdb 27
When you issue the run command, your program begins to execute immediately. SeeChapter 5 [Stopping and Continuing], page 43, for discussion of how to arrange for yourprogram to stop. Once your program has stopped, you may call functions in your program,using the print or call commands. See Chapter 10 [Examining Data], page 97.
If the modification time of your symbol file has changed since the last time gdb read itssymbols, gdb discards its symbol table, and reads it again. When it does this, gdb tries toretain your current breakpoints.
start The name of the main procedure can vary from language to language. WithC or C++, the main procedure name is always main, but other languages suchas Ada do not require a specific name for their main procedure. The debuggerprovides a convenient way to start the execution of the program and to stop atthe beginning of the main procedure, depending on the language used.
The ‘start’ command does the equivalent of setting a temporary breakpointat the beginning of the main procedure and then invoking the ‘run’ command.
Some programs contain an elaboration phase where some startup code is exe-cuted before the main procedure is called. This depends on the languages usedto write your program. In C++, for instance, constructors for static and globalobjects are executed before main is called. It is therefore possible that thedebugger stops before reaching the main procedure. However, the temporarybreakpoint will remain to halt execution.
Specify the arguments to give to your program as arguments to the ‘start’command. These arguments will be given verbatim to the underlying ‘run’command. Note that the same arguments will be reused if no argument isprovided during subsequent calls to ‘start’ or ‘run’.
It is sometimes necessary to debug the program during elaboration. In thesecases, using the start command would stop the execution of your programtoo late, as the program would have already completed the elaboration phase.Under these circumstances, insert breakpoints in your elaboration code beforerunning your program.
set exec-wrapper wrapper
show exec-wrapper
unset exec-wrapper
When ‘exec-wrapper’ is set, the specified wrapper is used to launch programsfor debugging. gdb starts your program with a shell command of the form exec
wrapper program . Quoting is added to program and its arguments, but not towrapper, so you should add quotes if appropriate for your shell. The wrapperruns until it executes your program, and then gdb takes control.
You can use any program that eventually calls execve with its arguments asa wrapper. Several standard Unix utilities do this, e.g. env and nohup. AnyUnix shell script ending with exec "$@" will also work.
For example, you can use env to pass an environment variable to the debuggedprogram, without setting the variable in your shell’s environment:
(gdb) set exec-wrapper env ’LD_PRELOAD=libtest.so’
(gdb) run
28 Debugging with gdb
This command is available when debugging locally on most targets, excludingdjgpp, Cygwin, MS Windows, and QNX Neutrino.
set disable-randomization
set disable-randomization on
This option (enabled by default in gdb) will turn off the native randomiza-tion of the virtual address space of the started program. This option is usefulfor multiple debugging sessions to make the execution better reproducible andmemory addresses reusable across debugging sessions.
This feature is implemented only on certain targets, including gnu/Linux. Ongnu/Linux you can get the same behavior using
(gdb) set exec-wrapper setarch ‘uname -m‘ -R
set disable-randomization off
Leave the behavior of the started executable unchanged. Some bugs rear theirugly heads only when the program is loaded at certain addresses. If your bugdisappears when you run the program under gdb, that might be because gdbby default disables the address randomization on platforms, such as gnu/Linux,which do that for stand-alone programs. Use set disable-randomization off
to try to reproduce such elusive bugs.
On targets where it is available, virtual address space randomization protectsthe programs against certain kinds of security attacks. In these cases the at-tacker needs to know the exact location of a concrete executable code. Ran-domizing its location makes it impossible to inject jumps misusing a code at itsexpected addresses.
Prelinking shared libraries provides a startup performance advantage but itmakes addresses in these libraries predictable for privileged processes by havingjust unprivileged access at the target system. Reading the shared library binarygives enough information for assembling the malicious code misusing it. Stilleven a prelinked shared library can get loaded at a new random address justrequiring the regular relocation process during the startup. Shared libraries notalready prelinked are always loaded at a randomly chosen address.
Position independent executables (PIE) contain position independent code sim-ilar to the shared libraries and therefore such executables get loaded at a ran-domly chosen address upon startup. PIE executables always load even alreadyprelinked shared libraries at a random address. You can build such executableusing gcc -fPIE -pie.
Heap (malloc storage), stack and custom mmap areas are always placed ran-domly (as long as the randomization is enabled).
show disable-randomization
Show the current setting of the explicit disable of the native randomization ofthe virtual address space of the started program.
4.3 Your Program’s Arguments
The arguments to your program can be specified by the arguments of the run command.They are passed to a shell, which expands wildcard characters and performs redirection of
Chapter 4: Running Programs Under gdb 29
I/O, and thence to your program. Your SHELL environment variable (if it exists) specifieswhat shell gdb uses. If you do not define SHELL, gdb uses the default shell (‘/bin/sh’ onUnix).
On non-Unix systems, the program is usually invoked directly by gdb, which emulatesI/O redirection via the appropriate system calls, and the wildcard characters are expandedby the startup code of the program, not by the shell.
run with no arguments uses the same arguments used by the previous run, or those setby the set args command.
set args Specify the arguments to be used the next time your program is run. If setargs has no arguments, run executes your program with no arguments. Onceyou have run your program with arguments, using set args before the nextrun is the only way to run it again without arguments.
show args Show the arguments to give your program when it is started.
4.4 Your Program’s Environment
The environment consists of a set of environment variables and their values. Environmentvariables conventionally record such things as your user name, your home directory, yourterminal type, and your search path for programs to run. Usually you set up environmentvariables with the shell and they are inherited by all the other programs you run. Whendebugging, it can be useful to try running your program with a modified environmentwithout having to start gdb over again.
path directory
Add directory to the front of the PATH environment variable (the search pathfor executables) that will be passed to your program. The value of PATH usedby gdb does not change. You may specify several directory names, separatedby whitespace or by a system-dependent separator character (‘:’ on Unix, ‘;’on MS-DOS and MS-Windows). If directory is already in the path, it is movedto the front, so it is searched sooner.
You can use the string ‘$cwd’ to refer to whatever is the current working direc-tory at the time gdb searches the path. If you use ‘.’ instead, it refers to thedirectory where you executed the path command. gdb replaces ‘.’ in the di-rectory argument (with the current path) before adding directory to the searchpath.
show paths
Display the list of search paths for executables (the PATH environment variable).
show environment [varname ]Print the value of environment variable varname to be given to your programwhen it starts. If you do not supply varname, print the names and values ofall environment variables to be given to your program. You can abbreviateenvironment as env.
set environment varname [=value ]Set environment variable varname to value. The value changes for your programonly, not for gdb itself. value may be any string; the values of environment
30 Debugging with gdb
variables are just strings, and any interpretation is supplied by your programitself. The value parameter is optional; if it is eliminated, the variable is set toa null value.
For example, this command:set env USER = foo
tells the debugged program, when subsequently run, that its user is named‘foo’. (The spaces around ‘=’ are used for clarity here; they are not actuallyrequired.)
unset environment varname
Remove variable varname from the environment to be passed to your program.This is different from ‘set env varname =’; unset environment removes thevariable from the environment, rather than assigning it an empty value.
Warning: On Unix systems, gdb runs your program using the shell indicated by yourSHELL environment variable if it exists (or /bin/sh if not). If your SHELL variable names ashell that runs an initialization file—such as ‘.cshrc’ for C-shell, or ‘.bashrc’ for BASH—any variables you set in that file affect your program. You may wish to move setting ofenvironment variables to files that are only run when you sign on, such as ‘.login’ or‘.profile’.
4.5 Your Program’s Working Directory
Each time you start your program with run, it inherits its working directory from the currentworking directory of gdb. The gdb working directory is initially whatever it inherited fromits parent process (typically the shell), but you can specify a new working directory in gdbwith the cd command.
The gdb working directory also serves as a default for the commands that specify filesfor gdb to operate on. See Section 18.1 [Commands to Specify Files], page 201.
cd directory
Set the gdb working directory to directory.
pwd Print the gdb working directory.
It is generally impossible to find the current working directory of the process beingdebugged (since a program can change its directory during its run). If you work on a systemwhere gdb is configured with the ‘/proc’ support, you can use the info proc command(see Section 21.1.3 [SVR4 Process Information], page 235) to find out the current workingdirectory of the debuggee.
4.6 Your Program’s Input and Output
By default, the program you run under gdb does input and output to the same terminalthat gdb uses. gdb switches the terminal to its own terminal modes to interact with you,but it records the terminal modes your program was using and switches back to them whenyou continue running your program.
info terminal
Displays information recorded by gdb about the terminal modes your programis using.
Chapter 4: Running Programs Under gdb 31
You can redirect your program’s input and/or output using shell redirection with therun command. For example,
run > outfile
starts your program, diverting its output to the file ‘outfile’.
Another way to specify where your program should do input and output is with thetty command. This command accepts a file name as argument, and causes this file to bethe default for future run commands. It also resets the controlling terminal for the childprocess, for future run commands. For example,
tty /dev/ttyb
directs that processes started with subsequent run commands default to do input and outputon the terminal ‘/dev/ttyb’ and have that as their controlling terminal.
An explicit redirection in run overrides the tty command’s effect on the input/outputdevice, but not its effect on the controlling terminal.
When you use the tty command or redirect input in the run command, only the inputfor your program is affected. The input for gdb still comes from your terminal. tty is analias for set inferior-tty.
You can use the show inferior-tty command to tell gdb to display the name of theterminal that will be used for future runs of your program.
set inferior-tty /dev/ttyb
Set the tty for the program being debugged to /dev/ttyb.
show inferior-tty
Show the current tty for the program being debugged.
4.7 Debugging an Already-running Process
attach process-id
This command attaches to a running process—one that was started outsidegdb. (info files shows your active targets.) The command takes as argumenta process ID. The usual way to find out the process-id of a Unix process is withthe ps utility, or with the ‘jobs -l’ shell command.
attach does not repeat if you press RET a second time after executing thecommand.
To use attach, your program must be running in an environment which supports pro-cesses; for example, attach does not work for programs on bare-board targets that lack anoperating system. You must also have permission to send the process a signal.
When you use attach, the debugger finds the program running in the process first bylooking in the current working directory, then (if the program is not found) by using thesource file search path (see Section 9.5 [Specifying Source Directories], page 90). You canalso use the file command to load the program. See Section 18.1 [Commands to SpecifyFiles], page 201.
The first thing gdb does after arranging to debug the specified process is to stop it. Youcan examine and modify an attached process with all the gdb commands that are ordinarilyavailable when you start processes with run. You can insert breakpoints; you can step and
32 Debugging with gdb
continue; you can modify storage. If you would rather the process continue running, youmay use the continue command after attaching gdb to the process.
detach When you have finished debugging the attached process, you can use the detachcommand to release it from gdb control. Detaching the process continues itsexecution. After the detach command, that process and gdb become com-pletely independent once more, and you are ready to attach another processor start one with run. detach does not repeat if you press RET again afterexecuting the command.
If you exit gdb while you have an attached process, you detach that process. If you usethe run command, you kill that process. By default, gdb asks for confirmation if you tryto do either of these things; you can control whether or not you need to confirm by usingthe set confirm command (see Section 22.7 [Optional Warnings and Messages], page 270).
4.8 Killing the Child Process
kill Kill the child process in which your program is running under gdb.
This command is useful if you wish to debug a core dump instead of a running process.gdb ignores any core dump file while your program is running.
On some operating systems, a program cannot be executed outside gdb while you havebreakpoints set on it inside gdb. You can use the kill command in this situation to permitrunning your program outside the debugger.
The kill command is also useful if you wish to recompile and relink your program,since on many systems it is impossible to modify an executable file while it is running in aprocess. In this case, when you next type run, gdb notices that the file has changed, andreads the symbol table again (while trying to preserve your current breakpoint settings).
4.9 Debugging Multiple Inferiors and Programs
gdb lets you run and debug multiple programs in a single session. In addition, gdb onsome systems may let you run several programs simultaneously (otherwise you have to exitfrom one before starting another). In the most general case, you can have multiple threadsof execution in each of multiple processes, launched from multiple executables.
gdb represents the state of each program execution with an object called an inferior.An inferior typically corresponds to a process, but is more general and applies also totargets that do not have processes. Inferiors may be created before a process runs, and maybe retained after a process exits. Inferiors have unique identifiers that are different fromprocess ids. Usually each inferior will also have its own distinct address space, althoughsome embedded targets may have several inferiors running in different parts of a singleaddress space. Each inferior may in turn have multiple threads running in it.
To find out what inferiors exist at any moment, use info inferiors:
info inferiors
Print a list of all inferiors currently being managed by gdb.
gdb displays for each inferior (in this order):
1. the inferior number assigned by gdb
Chapter 4: Running Programs Under gdb 33
2. the target system’s inferior identifier
3. the name of the executable the inferior is running.
An asterisk ‘*’ preceding the gdb inferior number indicates the current inferior.
For example,(gdb) info inferiors
Num Description Executable
2 process 2307 hello
* 1 process 3401 goodbye
To switch focus between inferiors, use the inferior command:
inferior infno
Make inferior number infno the current inferior. The argument infno is the infe-rior number assigned by gdb, as shown in the first field of the ‘info inferiors’display.
You can get multiple executables into a debugging session via the add-inferior andclone-inferior commands. On some systems gdb can add inferiors to the debug sessionautomatically by following calls to fork and exec. To remove inferiors from the debuggingsession use the remove-inferiors command.
add-inferior [ -copies n ] [ -exec executable ]
Adds n inferiors to be run using executable as the executable. n defaults to 1.If no executable is specified, the inferiors begins empty, with no program. Youcan still assign or change the program assigned to the inferior at any time byusing the file command with the executable name as its argument.
clone-inferior [ -copies n ] [ infno ]
Adds n inferiors ready to execute the same program as inferior infno. n de-faults to 1. infno defaults to the number of the current inferior. This is aconvenient command when you want to run another instance of the inferior youare debugging.
(gdb) info inferiors
Num Description Executable
* 1 process 29964 helloworld
(gdb) clone-inferior
Added inferior 2.
1 inferiors added.
(gdb) info inferiors
Num Description Executable
2 <null> helloworld
* 1 process 29964 helloworld
You can now simply switch focus to inferior 2 and run it.
remove-inferiors infno...
Removes the inferior or inferiors infno . . . . It is not possible to remove aninferior that is running with this command. For those, use the kill or detachcommand first.
To quit debugging one of the running inferiors that is not the current inferior, youcan either detach from it by using the detach inferior command (allowing it to runindependently), or kill it using the kill inferiors command:
34 Debugging with gdb
detach inferior infno...
Detach from the inferior or inferiors identified by gdb inferior number(s)infno . . . . Note that the inferior’s entry still stays on the list of inferiors shownby info inferiors, but its Description will show ‘<null>’.
kill inferiors infno...
Kill the inferior or inferiors identified by gdb inferior number(s) infno . . . .Note that the inferior’s entry still stays on the list of inferiors shown by info
inferiors, but its Description will show ‘<null>’.
After the successful completion of a command such as detach, detach inferiors, killor kill inferiors, or after a normal process exit, the inferior is still valid and listed withinfo inferiors, ready to be restarted.
To be notified when inferiors are started or exit under gdb’s control useset print inferior-events:
set print inferior-events
set print inferior-events on
set print inferior-events off
The set print inferior-events command allows you to enable or disableprinting of messages when gdb notices that new inferiors have started or thatinferiors have exited or have been detached. By default, these messages willnot be printed.
show print inferior-events
Show whether messages will be printed when gdb detects that inferiors havestarted, exited or have been detached.
Many commands will work the same with multiple programs as with a single program:e.g., print myglobal will simply display the value of myglobal in the current inferior.
Occasionaly, when debugging gdb itself, it may be useful to get more info about therelationship of inferiors, programs, address spaces in a debug session. You can do that withthe maint info program-spaces command.
maint info program-spaces
Print a list of all program spaces currently being managed by gdb.
gdb displays for each program space (in this order):
1. the program space number assigned by gdb
2. the name of the executable loaded into the program space, with e.g., thefile command.
An asterisk ‘*’ preceding the gdb program space number indicates the currentprogram space.
In addition, below each program space line, gdb prints extra information thatisn’t suitable to display in tabular form. For example, the list of inferiors boundto the program space.
(gdb) maint info program-spaces
Id Executable
2 goodbye
Bound inferiors: ID 1 (process 21561)
Chapter 4: Running Programs Under gdb 35
* 1 hello
Here we can see that no inferior is running the program hello, while process21561 is running the program goodbye. On some targets, it is possible thatmultiple inferiors are bound to the same program space. The most commonexample is that of debugging both the parent and child processes of a vfork
call. For example,
(gdb) maint info program-spaces
Id Executable
* 1 vfork-test
Bound inferiors: ID 2 (process 18050), ID 1 (process 18045)
Here, both inferior 2 and inferior 1 are running in the same program space asa result of inferior 1 having executed a vfork call.
4.10 Debugging Programs with Multiple Threads
In some operating systems, such as HP-UX and Solaris, a single program may have morethan one thread of execution. The precise semantics of threads differ from one operatingsystem to another, but in general the threads of a single program are akin to multipleprocesses—except that they share one address space (that is, they can all examine andmodify the same variables). On the other hand, each thread has its own registers andexecution stack, and perhaps private memory.
gdb provides these facilities for debugging multi-thread programs:
• automatic notification of new threads
• ‘thread threadno ’, a command to switch among threads
• ‘info threads’, a command to inquire about existing threads
• ‘thread apply [threadno] [all] args ’, a command to apply a command to a list ofthreads
• thread-specific breakpoints
• ‘set print thread-events’, which controls printing of messages on thread start andexit.
• ‘set libthread-db-search-path path ’, which lets the user specify which libthread_
db to use if the default choice isn’t compatible with the program.
Warning: These facilities are not yet available on every gdb configurationwhere the operating system supports threads. If your gdb does not supportthreads, these commands have no effect. For example, a system without threadsupport shows no output from ‘info threads’, and always rejects the thread
command, like this:
(gdb) info threads
(gdb) thread 1
Thread ID 1 not known. Use the "info threads" command to
see the IDs of currently known threads.
The gdb thread debugging facility allows you to observe all threads while your programruns—but whenever gdb takes control, one thread in particular is always the focus ofdebugging. This thread is called the current thread. Debugging commands show programinformation from the perspective of the current thread.
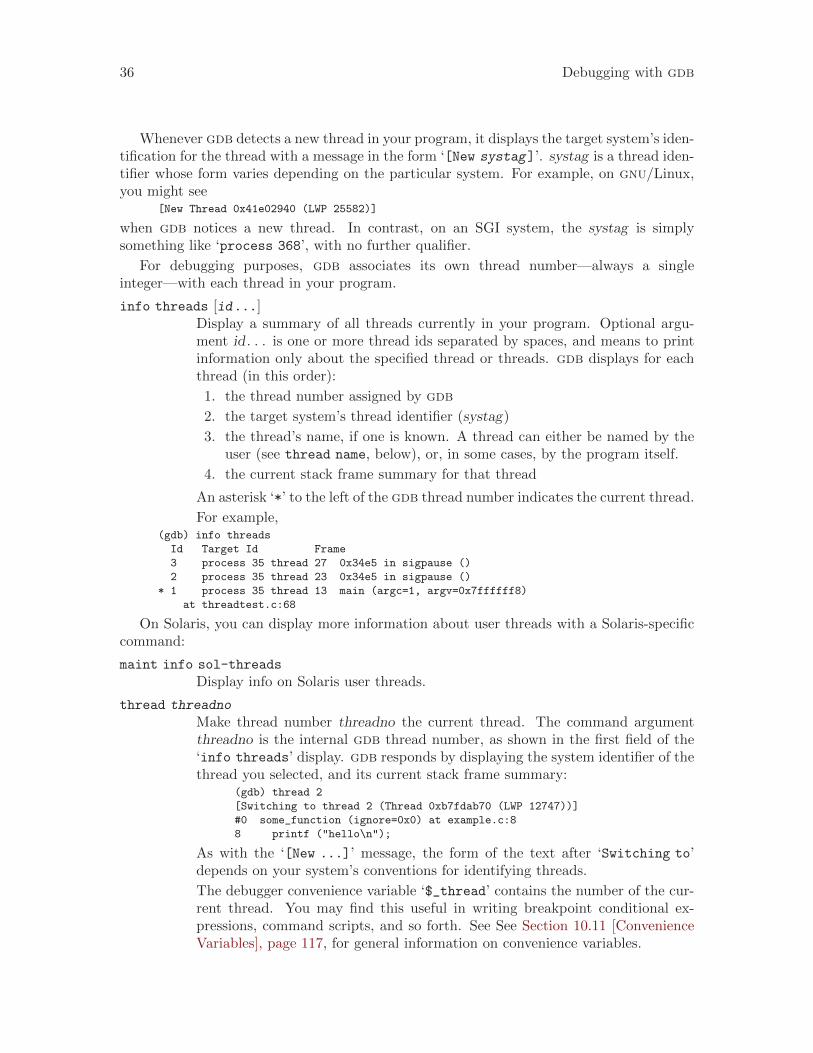
36 Debugging with gdb
Whenever gdb detects a new thread in your program, it displays the target system’s iden-tification for the thread with a message in the form ‘[New systag]’. systag is a thread iden-tifier whose form varies depending on the particular system. For example, on gnu/Linux,you might see
[New Thread 0x41e02940 (LWP 25582)]
when gdb notices a new thread. In contrast, on an SGI system, the systag is simplysomething like ‘process 368’, with no further qualifier.
For debugging purposes, gdb associates its own thread number—always a singleinteger—with each thread in your program.
info threads [id...]Display a summary of all threads currently in your program. Optional argu-ment id . . . is one or more thread ids separated by spaces, and means to printinformation only about the specified thread or threads. gdb displays for eachthread (in this order):
1. the thread number assigned by gdb
2. the target system’s thread identifier (systag)
3. the thread’s name, if one is known. A thread can either be named by theuser (see thread name, below), or, in some cases, by the program itself.
4. the current stack frame summary for that thread
An asterisk ‘*’ to the left of the gdb thread number indicates the current thread.
For example,(gdb) info threads
Id Target Id Frame
3 process 35 thread 27 0x34e5 in sigpause ()
2 process 35 thread 23 0x34e5 in sigpause ()
* 1 process 35 thread 13 main (argc=1, argv=0x7ffffff8)
at threadtest.c:68
On Solaris, you can display more information about user threads with a Solaris-specificcommand:
maint info sol-threads
Display info on Solaris user threads.
thread threadno
Make thread number threadno the current thread. The command argumentthreadno is the internal gdb thread number, as shown in the first field of the‘info threads’ display. gdb responds by displaying the system identifier of thethread you selected, and its current stack frame summary:
(gdb) thread 2
[Switching to thread 2 (Thread 0xb7fdab70 (LWP 12747))]
#0 some_function (ignore=0x0) at example.c:8
8 printf ("hello\n");
As with the ‘[New ...]’ message, the form of the text after ‘Switching to’depends on your system’s conventions for identifying threads.
The debugger convenience variable ‘$_thread’ contains the number of the cur-rent thread. You may find this useful in writing breakpoint conditional ex-pressions, command scripts, and so forth. See See Section 10.11 [ConvenienceVariables], page 117, for general information on convenience variables.
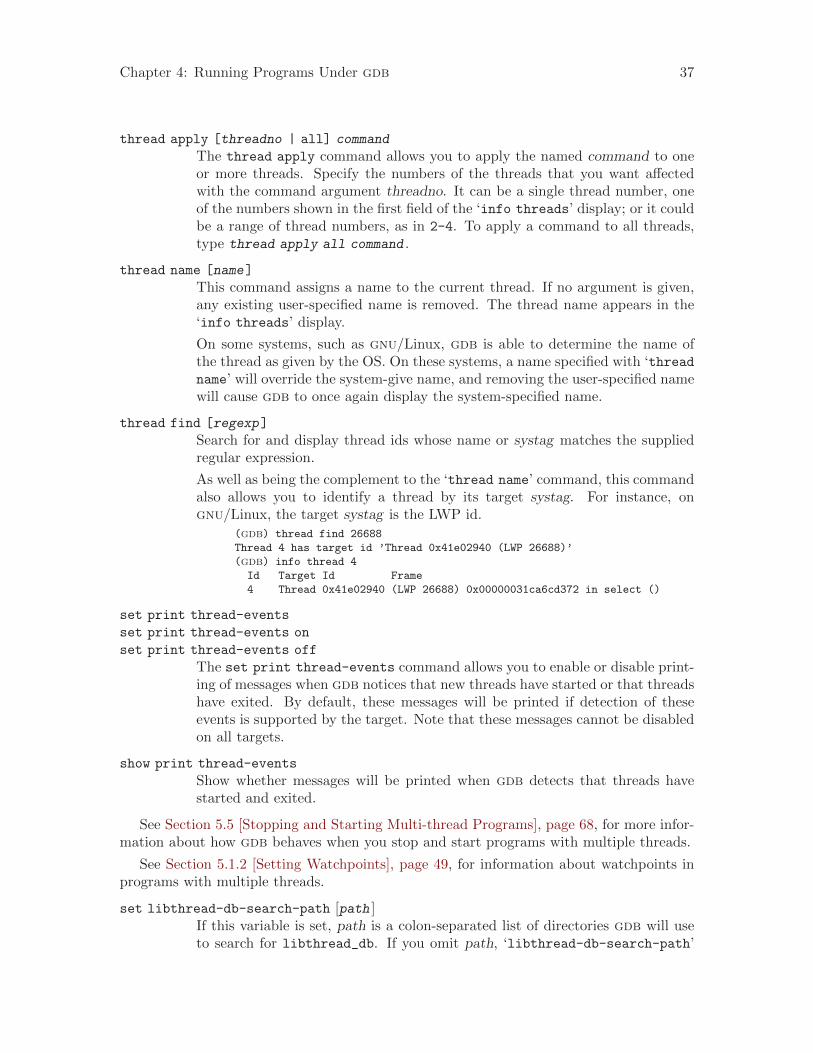
Chapter 4: Running Programs Under gdb 37
thread apply [threadno | all] command
The thread apply command allows you to apply the named command to oneor more threads. Specify the numbers of the threads that you want affectedwith the command argument threadno. It can be a single thread number, oneof the numbers shown in the first field of the ‘info threads’ display; or it couldbe a range of thread numbers, as in 2-4. To apply a command to all threads,type thread apply all command .
thread name [name]
This command assigns a name to the current thread. If no argument is given,any existing user-specified name is removed. The thread name appears in the‘info threads’ display.
On some systems, such as gnu/Linux, gdb is able to determine the name ofthe thread as given by the OS. On these systems, a name specified with ‘threadname’ will override the system-give name, and removing the user-specified namewill cause gdb to once again display the system-specified name.
thread find [regexp]
Search for and display thread ids whose name or systag matches the suppliedregular expression.
As well as being the complement to the ‘thread name’ command, this commandalso allows you to identify a thread by its target systag. For instance, ongnu/Linux, the target systag is the LWP id.
(gdb) thread find 26688
Thread 4 has target id ’Thread 0x41e02940 (LWP 26688)’
(gdb) info thread 4
Id Target Id Frame
4 Thread 0x41e02940 (LWP 26688) 0x00000031ca6cd372 in select ()
set print thread-events
set print thread-events on
set print thread-events off
The set print thread-events command allows you to enable or disable print-ing of messages when gdb notices that new threads have started or that threadshave exited. By default, these messages will be printed if detection of theseevents is supported by the target. Note that these messages cannot be disabledon all targets.
show print thread-events
Show whether messages will be printed when gdb detects that threads havestarted and exited.
See Section 5.5 [Stopping and Starting Multi-thread Programs], page 68, for more infor-mation about how gdb behaves when you stop and start programs with multiple threads.
See Section 5.1.2 [Setting Watchpoints], page 49, for information about watchpoints inprograms with multiple threads.
set libthread-db-search-path [path ]If this variable is set, path is a colon-separated list of directories gdb will useto search for libthread_db. If you omit path, ‘libthread-db-search-path’
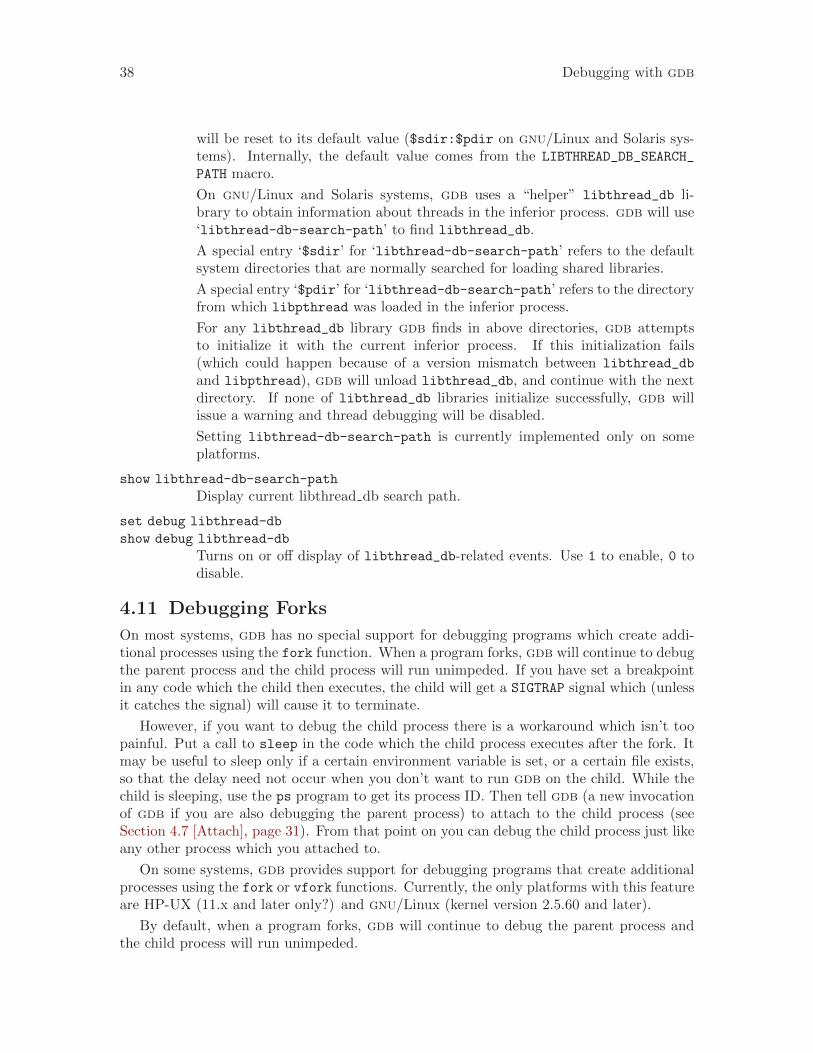
38 Debugging with gdb
will be reset to its default value ($sdir:$pdir on gnu/Linux and Solaris sys-tems). Internally, the default value comes from the LIBTHREAD_DB_SEARCH_
PATH macro.
On gnu/Linux and Solaris systems, gdb uses a “helper” libthread_db li-brary to obtain information about threads in the inferior process. gdb will use‘libthread-db-search-path’ to find libthread_db.
A special entry ‘$sdir’ for ‘libthread-db-search-path’ refers to the defaultsystem directories that are normally searched for loading shared libraries.
A special entry ‘$pdir’ for ‘libthread-db-search-path’ refers to the directoryfrom which libpthread was loaded in the inferior process.
For any libthread_db library gdb finds in above directories, gdb attemptsto initialize it with the current inferior process. If this initialization fails(which could happen because of a version mismatch between libthread_db
and libpthread), gdb will unload libthread_db, and continue with the nextdirectory. If none of libthread_db libraries initialize successfully, gdb willissue a warning and thread debugging will be disabled.
Setting libthread-db-search-path is currently implemented only on someplatforms.
show libthread-db-search-path
Display current libthread db search path.
set debug libthread-db
show debug libthread-db
Turns on or off display of libthread_db-related events. Use 1 to enable, 0 todisable.
4.11 Debugging Forks
On most systems, gdb has no special support for debugging programs which create addi-tional processes using the fork function. When a program forks, gdb will continue to debugthe parent process and the child process will run unimpeded. If you have set a breakpointin any code which the child then executes, the child will get a SIGTRAP signal which (unlessit catches the signal) will cause it to terminate.
However, if you want to debug the child process there is a workaround which isn’t toopainful. Put a call to sleep in the code which the child process executes after the fork. Itmay be useful to sleep only if a certain environment variable is set, or a certain file exists,so that the delay need not occur when you don’t want to run gdb on the child. While thechild is sleeping, use the ps program to get its process ID. Then tell gdb (a new invocationof gdb if you are also debugging the parent process) to attach to the child process (seeSection 4.7 [Attach], page 31). From that point on you can debug the child process just likeany other process which you attached to.
On some systems, gdb provides support for debugging programs that create additionalprocesses using the fork or vfork functions. Currently, the only platforms with this featureare HP-UX (11.x and later only?) and gnu/Linux (kernel version 2.5.60 and later).
By default, when a program forks, gdb will continue to debug the parent process andthe child process will run unimpeded.
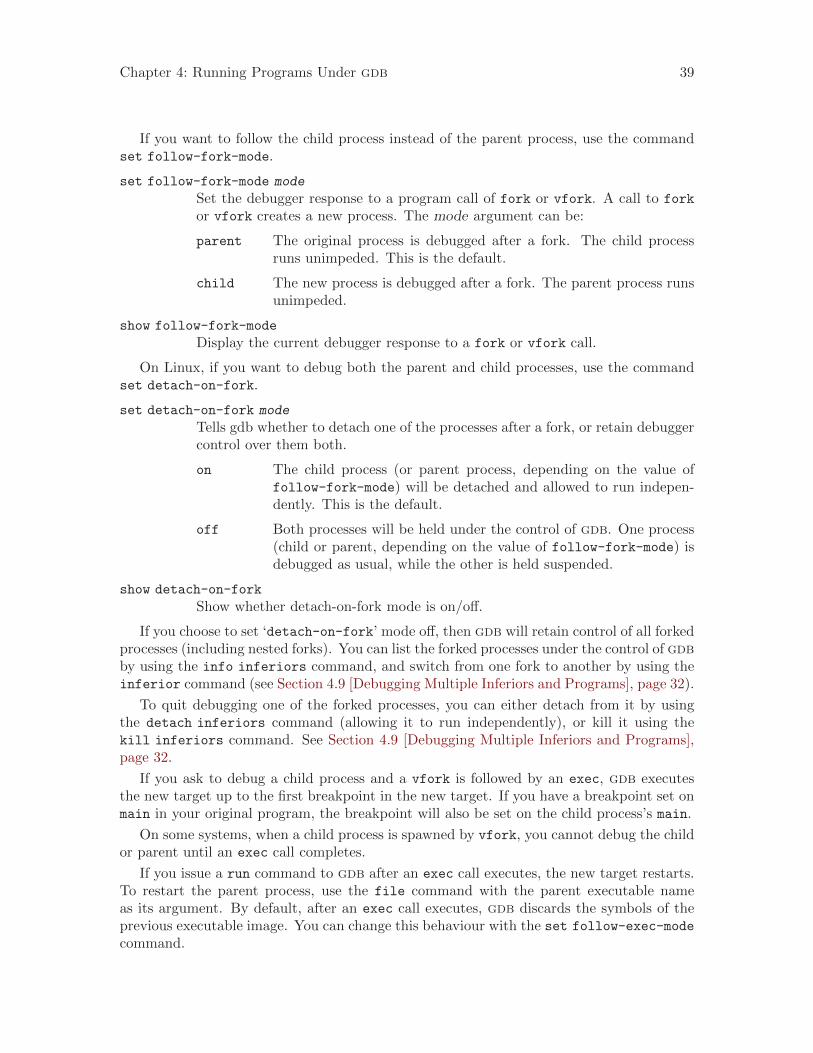
Chapter 4: Running Programs Under gdb 39
If you want to follow the child process instead of the parent process, use the commandset follow-fork-mode.
set follow-fork-mode mode
Set the debugger response to a program call of fork or vfork. A call to fork
or vfork creates a new process. The mode argument can be:
parent The original process is debugged after a fork. The child processruns unimpeded. This is the default.
child The new process is debugged after a fork. The parent process runsunimpeded.
show follow-fork-mode
Display the current debugger response to a fork or vfork call.
On Linux, if you want to debug both the parent and child processes, use the commandset detach-on-fork.
set detach-on-fork mode
Tells gdb whether to detach one of the processes after a fork, or retain debuggercontrol over them both.
on The child process (or parent process, depending on the value offollow-fork-mode) will be detached and allowed to run indepen-dently. This is the default.
off Both processes will be held under the control of gdb. One process(child or parent, depending on the value of follow-fork-mode) isdebugged as usual, while the other is held suspended.
show detach-on-fork
Show whether detach-on-fork mode is on/off.
If you choose to set ‘detach-on-fork’ mode off, then gdb will retain control of all forkedprocesses (including nested forks). You can list the forked processes under the control of gdbby using the info inferiors command, and switch from one fork to another by using theinferior command (see Section 4.9 [Debugging Multiple Inferiors and Programs], page 32).
To quit debugging one of the forked processes, you can either detach from it by usingthe detach inferiors command (allowing it to run independently), or kill it using thekill inferiors command. See Section 4.9 [Debugging Multiple Inferiors and Programs],page 32.
If you ask to debug a child process and a vfork is followed by an exec, gdb executesthe new target up to the first breakpoint in the new target. If you have a breakpoint set onmain in your original program, the breakpoint will also be set on the child process’s main.
On some systems, when a child process is spawned by vfork, you cannot debug the childor parent until an exec call completes.
If you issue a run command to gdb after an exec call executes, the new target restarts.To restart the parent process, use the file command with the parent executable nameas its argument. By default, after an exec call executes, gdb discards the symbols of theprevious executable image. You can change this behaviour with the set follow-exec-mode
command.
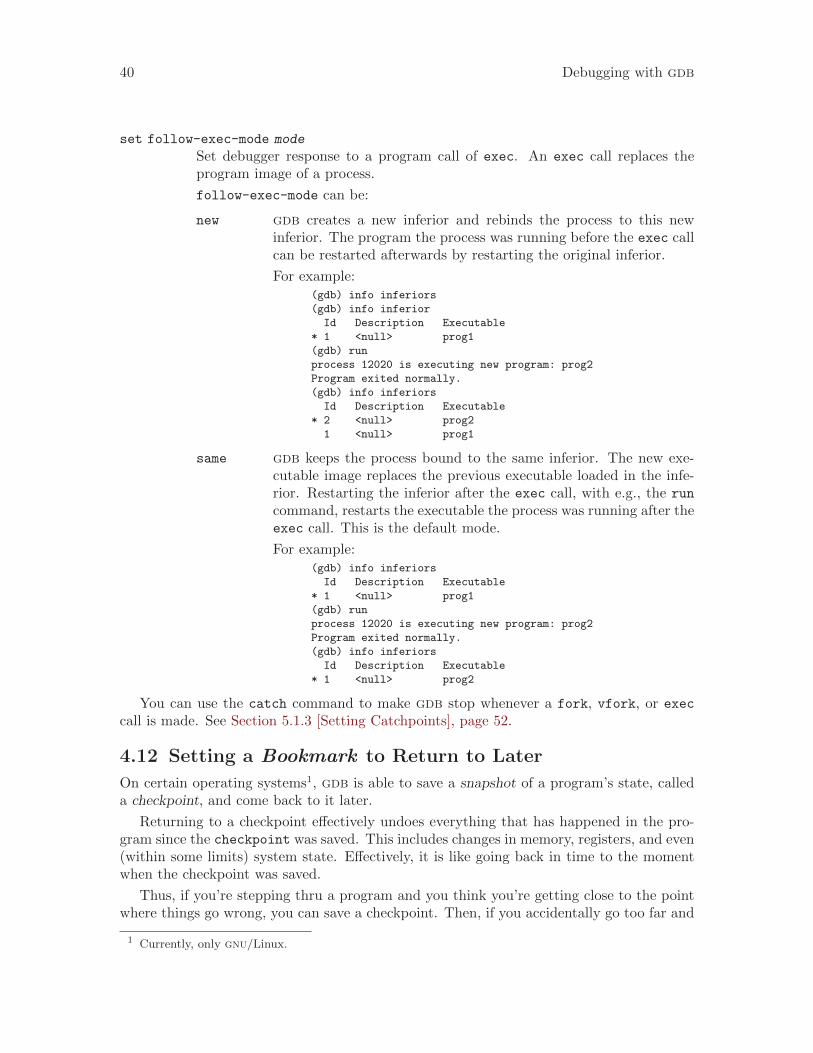
40 Debugging with gdb
set follow-exec-mode mode
Set debugger response to a program call of exec. An exec call replaces theprogram image of a process.
follow-exec-mode can be:
new gdb creates a new inferior and rebinds the process to this newinferior. The program the process was running before the exec callcan be restarted afterwards by restarting the original inferior.
For example:(gdb) info inferiors
(gdb) info inferior
Id Description Executable
* 1 <null> prog1
(gdb) run
process 12020 is executing new program: prog2
Program exited normally.
(gdb) info inferiors
Id Description Executable
* 2 <null> prog2
1 <null> prog1
same gdb keeps the process bound to the same inferior. The new exe-cutable image replaces the previous executable loaded in the infe-rior. Restarting the inferior after the exec call, with e.g., the run
command, restarts the executable the process was running after theexec call. This is the default mode.
For example:(gdb) info inferiors
Id Description Executable
* 1 <null> prog1
(gdb) run
process 12020 is executing new program: prog2
Program exited normally.
(gdb) info inferiors
Id Description Executable
* 1 <null> prog2
You can use the catch command to make gdb stop whenever a fork, vfork, or execcall is made. See Section 5.1.3 [Setting Catchpoints], page 52.
4.12 Setting a Bookmark to Return to Later
On certain operating systems1, gdb is able to save a snapshot of a program’s state, calleda checkpoint, and come back to it later.
Returning to a checkpoint effectively undoes everything that has happened in the pro-gram since the checkpoint was saved. This includes changes in memory, registers, and even(within some limits) system state. Effectively, it is like going back in time to the momentwhen the checkpoint was saved.
Thus, if you’re stepping thru a program and you think you’re getting close to the pointwhere things go wrong, you can save a checkpoint. Then, if you accidentally go too far and
1 Currently, only gnu/Linux.
Chapter 4: Running Programs Under gdb 41
miss the critical statement, instead of having to restart your program from the beginning,you can just go back to the checkpoint and start again from there.
This can be especially useful if it takes a lot of time or steps to reach the point whereyou think the bug occurs.
To use the checkpoint/restart method of debugging:
checkpoint
Save a snapshot of the debugged program’s current execution state. Thecheckpoint command takes no arguments, but each checkpoint is assigneda small integer id, similar to a breakpoint id.
info checkpoints
List the checkpoints that have been saved in the current debugging session. Foreach checkpoint, the following information will be listed:
Checkpoint ID
Process ID
Code Address
Source line, or label
restart checkpoint-id
Restore the program state that was saved as checkpoint number checkpoint-id.All program variables, registers, stack frames etc. will be returned to the valuesthat they had when the checkpoint was saved. In essence, gdb will “wind backthe clock” to the point in time when the checkpoint was saved.
Note that breakpoints, gdb variables, command history etc. are not affectedby restoring a checkpoint. In general, a checkpoint only restores things thatreside in the program being debugged, not in the debugger.
delete checkpoint checkpoint-id
Delete the previously-saved checkpoint identified by checkpoint-id.
Returning to a previously saved checkpoint will restore the user state of the programbeing debugged, plus a significant subset of the system (OS) state, including file pointers. Itwon’t “un-write” data from a file, but it will rewind the file pointer to the previous location,so that the previously written data can be overwritten. For files opened in read mode, thepointer will also be restored so that the previously read data can be read again.
Of course, characters that have been sent to a printer (or other external device) cannotbe “snatched back”, and characters received from eg. a serial device can be removed frominternal program buffers, but they cannot be “pushed back” into the serial pipeline, readyto be received again. Similarly, the actual contents of files that have been changed cannotbe restored (at this time).
However, within those constraints, you actually can “rewind” your program to a previ-ously saved point in time, and begin debugging it again — and you can change the courseof events so as to debug a different execution path this time.
Finally, there is one bit of internal program state that will be different when you returnto a checkpoint — the program’s process id. Each checkpoint will have a unique process id(or pid), and each will be different from the program’s original pid. If your program hassaved a local copy of its process id, this could potentially pose a problem.
42 Debugging with gdb
4.12.1 A Non-obvious Benefit of Using Checkpoints
On some systems such as gnu/Linux, address space randomization is performed on newprocesses for security reasons. This makes it difficult or impossible to set a breakpoint, orwatchpoint, on an absolute address if you have to restart the program, since the absolutelocation of a symbol will change from one execution to the next.
A checkpoint, however, is an identical copy of a process. Therefore if you create acheckpoint at (eg.) the start of main, and simply return to that checkpoint instead ofrestarting the process, you can avoid the effects of address randomization and your symbolswill all stay in the same place.
Chapter 5: Stopping and Continuing 43
5 Stopping and Continuing
The principal purposes of using a debugger are so that you can stop your program before itterminates; or so that, if your program runs into trouble, you can investigate and find outwhy.
Inside gdb, your program may stop for any of several reasons, such as a signal, a break-point, or reaching a new line after a gdb command such as step. You may then examineand change variables, set new breakpoints or remove old ones, and then continue execu-tion. Usually, the messages shown by gdb provide ample explanation of the status of yourprogram—but you can also explicitly request this information at any time.
info program
Display information about the status of your program: whether it is runningor not, what process it is, and why it stopped.
5.1 Breakpoints, Watchpoints, and Catchpoints
A breakpoint makes your program stop whenever a certain point in the program is reached.For each breakpoint, you can add conditions to control in finer detail whether your programstops. You can set breakpoints with the break command and its variants (see Section 5.1.1[Setting Breakpoints], page 44), to specify the place where your program should stop byline number, function name or exact address in the program.
On some systems, you can set breakpoints in shared libraries before the executable isrun. There is a minor limitation on HP-UX systems: you must wait until the executableis run in order to set breakpoints in shared library routines that are not called directly bythe program (for example, routines that are arguments in a pthread_create call).
A watchpoint is a special breakpoint that stops your program when the value of anexpression changes. The expression may be a value of a variable, or it could involve valuesof one or more variables combined by operators, such as ‘a + b’. This is sometimes calleddata breakpoints. You must use a different command to set watchpoints (see Section 5.1.2[Setting Watchpoints], page 49), but aside from that, you can manage a watchpoint like anyother breakpoint: you enable, disable, and delete both breakpoints and watchpoints usingthe same commands.
You can arrange to have values from your program displayed automatically whenevergdb stops at a breakpoint. See Section 10.7 [Automatic Display], page 105.
A catchpoint is another special breakpoint that stops your program when a certain kindof event occurs, such as the throwing of a C++ exception or the loading of a library. As withwatchpoints, you use a different command to set a catchpoint (see Section 5.1.3 [SettingCatchpoints], page 52), but aside from that, you can manage a catchpoint like any otherbreakpoint. (To stop when your program receives a signal, use the handle command; seeSection 5.4 [Signals], page 66.)
gdb assigns a number to each breakpoint, watchpoint, or catchpoint when you createit; these numbers are successive integers starting with one. In many of the commands forcontrolling various features of breakpoints you use the breakpoint number to say whichbreakpoint you want to change. Each breakpoint may be enabled or disabled; if disabled,it has no effect on your program until you enable it again.
44 Debugging with gdb
Some gdb commands accept a range of breakpoints on which to operate. A breakpointrange is either a single breakpoint number, like ‘5’, or two such numbers, in increasingorder, separated by a hyphen, like ‘5-7’. When a breakpoint range is given to a command,all breakpoints in that range are operated on.
5.1.1 Setting Breakpoints
Breakpoints are set with the break command (abbreviated b). The debugger conve-nience variable ‘$bpnum’ records the number of the breakpoint you’ve set most recently;see Section 10.11 [Convenience Variables], page 117, for a discussion of what you can dowith convenience variables.
break location
Set a breakpoint at the given location, which can specify a function name, a linenumber, or an address of an instruction. (See Section 9.2 [Specify Location],page 88, for a list of all the possible ways to specify a location.) The breakpointwill stop your program just before it executes any of the code in the specifiedlocation.
When using source languages that permit overloading of symbols, such as C++,a function name may refer to more than one possible place to break. SeeSection 10.2 [Ambiguous Expressions], page 98, for a discussion of that situa-tion.
It is also possible to insert a breakpoint that will stop the program only if aspecific thread (see Section 5.5.4 [Thread-Specific Breakpoints], page 72) or aspecific task (see Section 15.4.8.5 [Ada Tasks], page 183) hits that breakpoint.
break When called without any arguments, break sets a breakpoint at the next in-struction to be executed in the selected stack frame (see Chapter 8 [Examiningthe Stack], page 81). In any selected frame but the innermost, this makes yourprogram stop as soon as control returns to that frame. This is similar to theeffect of a finish command in the frame inside the selected frame—except thatfinish does not leave an active breakpoint. If you use break without an ar-gument in the innermost frame, gdb stops the next time it reaches the currentlocation; this may be useful inside loops.
gdb normally ignores breakpoints when it resumes execution, until at least oneinstruction has been executed. If it did not do this, you would be unable to pro-ceed past a breakpoint without first disabling the breakpoint. This rule applieswhether or not the breakpoint already existed when your program stopped.
break ... if cond
Set a breakpoint with condition cond; evaluate the expression cond each timethe breakpoint is reached, and stop only if the value is nonzero—that is, if condevaluates as true. ‘...’ stands for one of the possible arguments describedabove (or no argument) specifying where to break. See Section 5.1.6 [BreakConditions], page 57, for more information on breakpoint conditions.
tbreak args
Set a breakpoint enabled only for one stop. args are the same as for the breakcommand, and the breakpoint is set in the same way, but the breakpoint is auto-
Chapter 5: Stopping and Continuing 45
matically deleted after the first time your program stops there. See Section 5.1.5[Disabling Breakpoints], page 56.
hbreak args
Set a hardware-assisted breakpoint. args are the same as for the break com-mand and the breakpoint is set in the same way, but the breakpoint requireshardware support and some target hardware may not have this support. Themain purpose of this is EPROM/ROM code debugging, so you can set a break-point at an instruction without changing the instruction. This can be usedwith the new trap-generation provided by SPARClite DSU and most x86-basedtargets. These targets will generate traps when a program accesses some dataor instruction address that is assigned to the debug registers. However thehardware breakpoint registers can take a limited number of breakpoints. Forexample, on the DSU, only two data breakpoints can be set at a time, andgdb will reject this command if more than two are used. Delete or disableunused hardware breakpoints before setting new ones (see Section 5.1.5 [Dis-abling Breakpoints], page 56). See Section 5.1.6 [Break Conditions], page 57.For remote targets, you can restrict the number of hardware breakpoints gdbwill use, see [set remote hardware-breakpoint-limit], page 227.
thbreak args
Set a hardware-assisted breakpoint enabled only for one stop. args are thesame as for the hbreak command and the breakpoint is set in the same way.However, like the tbreak command, the breakpoint is automatically deletedafter the first time your program stops there. Also, like the hbreak command,the breakpoint requires hardware support and some target hardware may nothave this support. See Section 5.1.5 [Disabling Breakpoints], page 56. See alsoSection 5.1.6 [Break Conditions], page 57.
rbreak regex
Set breakpoints on all functions matching the regular expression regex. Thiscommand sets an unconditional breakpoint on all matches, printing a list of allbreakpoints it set. Once these breakpoints are set, they are treated just like thebreakpoints set with the break command. You can delete them, disable them,or make them conditional the same way as any other breakpoint.
The syntax of the regular expression is the standard one used with tools like‘grep’. Note that this is different from the syntax used by shells, so for instancefoo*matches all functions that include an fo followed by zero or more os. Thereis an implicit .* leading and trailing the regular expression you supply, so tomatch only functions that begin with foo, use ^foo.
When debugging C++ programs, rbreak is useful for setting breakpoints onoverloaded functions that are not members of any special classes.
The rbreak command can be used to set breakpoints in all the functions in aprogram, like this:
(gdb) rbreak .
46 Debugging with gdb
rbreak file:regex
If rbreak is called with a filename qualification, it limits the search for functionsmatching the given regular expression to the specified file. This can be used,for example, to set breakpoints on every function in a given file:
(gdb) rbreak file.c:.
The colon separating the filename qualifier from the regex may optionally besurrounded by spaces.
info breakpoints [n...]info break [n...]
Print a table of all breakpoints, watchpoints, and catchpoints set and notdeleted. Optional argument n means print information only about the spec-ified breakpoint(s) (or watchpoint(s) or catchpoint(s)). For each breakpoint,following columns are printed:
Breakpoint NumbersType Breakpoint, watchpoint, or catchpoint.
DispositionWhether the breakpoint is marked to be disabled or deleted whenhit.
Enabled or DisabledEnabled breakpoints are marked with ‘y’. ‘n’ marks breakpointsthat are not enabled.
Address Where the breakpoint is in your program, as a memory address.For a pending breakpoint whose address is not yet known, thisfield will contain ‘<PENDING>’. Such breakpoint won’t fire until ashared library that has the symbol or line referred by breakpoint isloaded. See below for details. A breakpoint with several locationswill have ‘<MULTIPLE>’ in this field—see below for details.
What Where the breakpoint is in the source for your program, as a file andline number. For a pending breakpoint, the original string passedto the breakpoint command will be listed as it cannot be resolveduntil the appropriate shared library is loaded in the future.
If a breakpoint is conditional, info break shows the condition on the line fol-lowing the affected breakpoint; breakpoint commands, if any, are listed afterthat. A pending breakpoint is allowed to have a condition specified for it. Thecondition is not parsed for validity until a shared library is loaded that allowsthe pending breakpoint to resolve to a valid location.
info break with a breakpoint number n as argument lists only that break-point. The convenience variable $_ and the default examining-address for thex command are set to the address of the last breakpoint listed (see Section 10.6[Examining Memory], page 103).
info break displays a count of the number of times the breakpoint has beenhit. This is especially useful in conjunction with the ignore command. Youcan ignore a large number of breakpoint hits, look at the breakpoint info to see

Chapter 5: Stopping and Continuing 47
how many times the breakpoint was hit, and then run again, ignoring one lessthan that number. This will get you quickly to the last hit of that breakpoint.
gdb allows you to set any number of breakpoints at the same place in your program.There is nothing silly or meaningless about this. When the breakpoints are conditional,this is even useful (see Section 5.1.6 [Break Conditions], page 57).
It is possible that a breakpoint corresponds to several locations in your program. Ex-amples of this situation are:
• Multiple functions in the program may have the same name.
• For a C++ constructor, the gcc compiler generates several instances of the functionbody, used in different cases.
• For a C++ template function, a given line in the function can correspond to any numberof instantiations.
• For an inlined function, a given source line can correspond to several places where thatfunction is inlined.
In all those cases, gdb will insert a breakpoint at all the relevant locations.
A breakpoint with multiple locations is displayed in the breakpoint table using severalrows—one header row, followed by one row for each breakpoint location. The header rowhas ‘<MULTIPLE>’ in the address column. The rows for individual locations contain theactual addresses for locations, and show the functions to which those locations belong. Thenumber column for a location is of the form breakpoint-number.location-number.
For example:
Num Type Disp Enb Address What
1 breakpoint keep y <MULTIPLE>
stop only if i==1
breakpoint already hit 1 time
1.1 y 0x080486a2 in void foo<int>() at t.cc:8
1.2 y 0x080486ca in void foo<double>() at t.cc:8
Each location can be individually enabled or disabled by passing breakpoint-number.location-number as argument to the enable and disable commands. Note thatyou cannot delete the individual locations from the list, you can only delete the entirelist of locations that belong to their parent breakpoint (with the delete num command,where num is the number of the parent breakpoint, 1 in the above example). Disablingor enabling the parent breakpoint (see Section 5.1.5 [Disabling], page 56) affects all of thelocations that belong to that breakpoint.
It’s quite common to have a breakpoint inside a shared library. Shared libraries canbe loaded and unloaded explicitly, and possibly repeatedly, as the program is executed.To support this use case, gdb updates breakpoint locations whenever any shared libraryis loaded or unloaded. Typically, you would set a breakpoint in a shared library at thebeginning of your debugging session, when the library is not loaded, and when the symbolsfrom the library are not available. When you try to set breakpoint, gdb will ask you if youwant to set a so called pending breakpoint—breakpoint whose address is not yet resolved.
After the program is run, whenever a new shared library is loaded, gdb reevaluates all thebreakpoints. When a newly loaded shared library contains the symbol or line referred to bysome pending breakpoint, that breakpoint is resolved and becomes an ordinary breakpoint.
48 Debugging with gdb
When a library is unloaded, all breakpoints that refer to its symbols or source lines becomepending again.
This logic works for breakpoints with multiple locations, too. For example, if you havea breakpoint in a C++ template function, and a newly loaded shared library has an instan-tiation of that template, a new location is added to the list of locations for the breakpoint.
Except for having unresolved address, pending breakpoints do not differ from regularbreakpoints. You can set conditions or commands, enable and disable them and performother breakpoint operations.
gdb provides some additional commands for controlling what happens when the ‘break’command cannot resolve breakpoint address specification to an address:
set breakpoint pending auto
This is the default behavior. When gdb cannot find the breakpoint location,it queries you whether a pending breakpoint should be created.
set breakpoint pending on
This indicates that an unrecognized breakpoint location should automaticallyresult in a pending breakpoint being created.
set breakpoint pending off
This indicates that pending breakpoints are not to be created. Any unrecog-nized breakpoint location results in an error. This setting does not affect anypending breakpoints previously created.
show breakpoint pending
Show the current behavior setting for creating pending breakpoints.
The settings above only affect the break command and its variants. Once breakpoint isset, it will be automatically updated as shared libraries are loaded and unloaded.
For some targets, gdb can automatically decide if hardware or software breakpointsshould be used, depending on whether the breakpoint address is read-only or read-write.This applies to breakpoints set with the break command as well as to internal breakpointsset by commands like next and finish. For breakpoints set with hbreak, gdb will alwaysuse hardware breakpoints.
You can control this automatic behaviour with the following commands::
set breakpoint auto-hw on
This is the default behavior. When gdb sets a breakpoint, it will try to use thetarget memory map to decide if software or hardware breakpoint must be used.
set breakpoint auto-hw off
This indicates gdb should not automatically select breakpoint type. If thetarget provides a memory map, gdb will warn when trying to set softwarebreakpoint at a read-only address.
gdb normally implements breakpoints by replacing the program code at the breakpointaddress with a special instruction, which, when executed, given control to the debugger.By default, the program code is so modified only when the program is resumed. As soon asthe program stops, gdb restores the original instructions. This behaviour guards againstleaving breakpoints inserted in the target should gdb abrubptly disconnect. However, with
Chapter 5: Stopping and Continuing 49
slow remote targets, inserting and removing breakpoint can reduce the performance. Thisbehavior can be controlled with the following commands::
set breakpoint always-inserted off
All breakpoints, including newly added by the user, are inserted in the targetonly when the target is resumed. All breakpoints are removed from the targetwhen it stops.
set breakpoint always-inserted on
Causes all breakpoints to be inserted in the target at all times. If the user addsa new breakpoint, or changes an existing breakpoint, the breakpoints in thetarget are updated immediately. A breakpoint is removed from the target onlywhen breakpoint itself is removed.
set breakpoint always-inserted auto
This is the default mode. If gdb is controlling the inferior in non-stop mode(see Section 5.5.2 [Non-Stop Mode], page 69), gdb behaves as if breakpointalways-insertedmode is on. If gdb is controlling the inferior in all-stop mode,gdb behaves as if breakpoint always-inserted mode is off.
gdb itself sometimes sets breakpoints in your program for special purposes, such asproper handling of longjmp (in C programs). These internal breakpoints are assignednegative numbers, starting with -1; ‘info breakpoints’ does not display them. You cansee these breakpoints with the gdb maintenance command ‘maint info breakpoints’ (see[maint info breakpoints], page 459).
5.1.2 Setting Watchpoints
You can use a watchpoint to stop execution whenever the value of an expression changes,without having to predict a particular place where this may happen. (This is sometimescalled a data breakpoint.) The expression may be as simple as the value of a single variable,or as complex as many variables combined by operators. Examples include:
• A reference to the value of a single variable.
• An address cast to an appropriate data type. For example, ‘*(int *)0x12345678’ willwatch a 4-byte region at the specified address (assuming an int occupies 4 bytes).
• An arbitrarily complex expression, such as ‘a*b + c/d’. The expression can use any op-erators valid in the program’s native language (see Chapter 15 [Languages], page 161).
You can set a watchpoint on an expression even if the expression can not be evaluated yet.For instance, you can set a watchpoint on ‘*global_ptr’ before ‘global_ptr’ is initialized.gdb will stop when your program sets ‘global_ptr’ and the expression produces a validvalue. If the expression becomes valid in some other way than changing a variable (e.g. ifthe memory pointed to by ‘*global_ptr’ becomes readable as the result of a malloc call),gdb may not stop until the next time the expression changes.
Depending on your system, watchpoints may be implemented in software or hardware.gdb does software watchpointing by single-stepping your program and testing the variable’svalue each time, which is hundreds of times slower than normal execution. (But this maystill be worth it, to catch errors where you have no clue what part of your program is theculprit.)
50 Debugging with gdb
On some systems, such as HP-UX, PowerPC, gnu/Linux and most other x86-based tar-gets, gdb includes support for hardware watchpoints, which do not slow down the runningof your program.
watch [-l|-location] expr [thread threadnum ] [mask maskvalue ]Set a watchpoint for an expression. gdb will break when the expression expris written into by the program and its value changes. The simplest (and themost popular) use of this command is to watch the value of a single variable:
(gdb) watch foo
If the command includes a [thread threadnum ] argument, gdb breaks onlywhen the thread identified by threadnum changes the value of expr. If any otherthreads change the value of expr, gdb will not break. Note that watchpointsrestricted to a single thread in this way only work with Hardware Watchpoints.
Ordinarily a watchpoint respects the scope of variables in expr (see below).The -location argument tells gdb to instead watch the memory referred toby expr. In this case, gdb will evaluate expr, take the address of the result, andwatch the memory at that address. The type of the result is used to determinethe size of the watched memory. If the expression’s result does not have anaddress, then gdb will print an error.
The [mask maskvalue ] argument allows creation of masked watchpoints, if thecurrent architecture supports this feature (e.g., PowerPC Embedded architec-ture, see Section 21.3.7 [PowerPC Embedded], page 255.) A masked watchpointspecifies a mask in addition to an address to watch. The mask specifies thatsome bits of an address (the bits which are reset in the mask) should be ignoredwhen matching the address accessed by the inferior against the watchpoint ad-dress. Thus, a masked watchpoint watches many addresses simultaneously—those addresses whose unmasked bits are identical to the unmasked bits in thewatchpoint address. The mask argument implies -location. Examples:
(gdb) watch foo mask 0xffff00ff
(gdb) watch *0xdeadbeef mask 0xffffff00
rwatch [-l|-location] expr [thread threadnum ] [mask maskvalue ]Set a watchpoint that will break when the value of expr is read by the program.
awatch [-l|-location] expr [thread threadnum ] [mask maskvalue ]Set a watchpoint that will break when expr is either read from or written intoby the program.
info watchpoints [n...]This command prints a list of watchpoints, using the same format as info
break (see Section 5.1.1 [Set Breaks], page 44).
If you watch for a change in a numerically entered address you need to dereference it, asthe address itself is just a constant number which will never change. gdb refuses to createa watchpoint that watches a never-changing value:
(gdb) watch 0x600850
Cannot watch constant value 0x600850.
(gdb) watch *(int *) 0x600850
Watchpoint 1: *(int *) 6293584
Chapter 5: Stopping and Continuing 51
gdb sets a hardware watchpoint if possible. Hardware watchpoints execute very quickly,and the debugger reports a change in value at the exact instruction where the change occurs.If gdb cannot set a hardware watchpoint, it sets a software watchpoint, which executes moreslowly and reports the change in value at the next statement, not the instruction, after thechange occurs.
You can force gdb to use only software watchpoints with the set can-use-hw-
watchpoints 0 command. With this variable set to zero, gdb will never try to usehardware watchpoints, even if the underlying system supports them. (Note thathardware-assisted watchpoints that were set before setting can-use-hw-watchpoints tozero will still use the hardware mechanism of watching expression values.)
set can-use-hw-watchpoints
Set whether or not to use hardware watchpoints.
show can-use-hw-watchpoints
Show the current mode of using hardware watchpoints.
For remote targets, you can restrict the number of hardware watchpoints gdb will use,see [set remote hardware-breakpoint-limit], page 227.
When you issue the watch command, gdb reportsHardware watchpoint num: expr
if it was able to set a hardware watchpoint.
Currently, the awatch and rwatch commands can only set hardware watchpoints, be-cause accesses to data that don’t change the value of the watched expression cannot bedetected without examining every instruction as it is being executed, and gdb does not dothat currently. If gdb finds that it is unable to set a hardware breakpoint with the awatchor rwatch command, it will print a message like this:
Expression cannot be implemented with read/access watchpoint.
Sometimes, gdb cannot set a hardware watchpoint because the data type of the watchedexpression is wider than what a hardware watchpoint on the target machine can handle.For example, some systems can only watch regions that are up to 4 bytes wide; on such sys-tems you cannot set hardware watchpoints for an expression that yields a double-precisionfloating-point number (which is typically 8 bytes wide). As a work-around, it might be pos-sible to break the large region into a series of smaller ones and watch them with separatewatchpoints.
If you set too many hardware watchpoints, gdb might be unable to insert all of themwhen you resume the execution of your program. Since the precise number of active watch-points is unknown until such time as the program is about to be resumed, gdb might not beable to warn you about this when you set the watchpoints, and the warning will be printedonly when the program is resumed:
Hardware watchpoint num: Could not insert watchpoint
If this happens, delete or disable some of the watchpoints.
Watching complex expressions that reference many variables can also exhaust the re-sources available for hardware-assisted watchpoints. That’s because gdb needs to watchevery variable in the expression with separately allocated resources.
If you call a function interactively using print or call, any watchpoints you have setwill be inactive until gdb reaches another kind of breakpoint or the call completes.
52 Debugging with gdb
gdb automatically deletes watchpoints that watch local (automatic) variables, or expres-sions that involve such variables, when they go out of scope, that is, when the executionleaves the block in which these variables were defined. In particular, when the programbeing debugged terminates, all local variables go out of scope, and so only watchpointsthat watch global variables remain set. If you rerun the program, you will need to set allsuch watchpoints again. One way of doing that would be to set a code breakpoint at theentry to the main function and when it breaks, set all the watchpoints.
In multi-threaded programs, watchpoints will detect changes to the watched expressionfrom every thread.
Warning: In multi-threaded programs, software watchpoints have only limitedusefulness. If gdb creates a software watchpoint, it can only watch the valueof an expression in a single thread. If you are confident that the expression canonly change due to the current thread’s activity (and if you are also confidentthat no other thread can become current), then you can use software watch-points as usual. However, gdb may not notice when a non-current thread’sactivity changes the expression. (Hardware watchpoints, in contrast, watch anexpression in all threads.)
See [set remote hardware-watchpoint-limit], page 227.
5.1.3 Setting Catchpoints
You can use catchpoints to cause the debugger to stop for certain kinds of program events,such as C++ exceptions or the loading of a shared library. Use the catch command to seta catchpoint.
catch event
Stop when event occurs. event can be any of the following:
throw The throwing of a C++ exception.
catch The catching of a C++ exception.
exception
An Ada exception being raised. If an exception name is specifiedat the end of the command (eg catch exception Program_Error),the debugger will stop only when this specific exception is raised.Otherwise, the debugger stops execution when any Ada exceptionis raised.
When inserting an exception catchpoint on a user-defined exceptionwhose name is identical to one of the exceptions defined by the lan-guage, the fully qualified name must be used as the exception name.Otherwise, gdb will assume that it should stop on the pre-definedexception rather than the user-defined one. For instance, assum-ing an exception called Constraint_Error is defined in packagePck, then the command to use to catch such exceptions is catch
exception Pck.Constraint_Error.
exception unhandled
An exception that was raised but is not handled by the program.
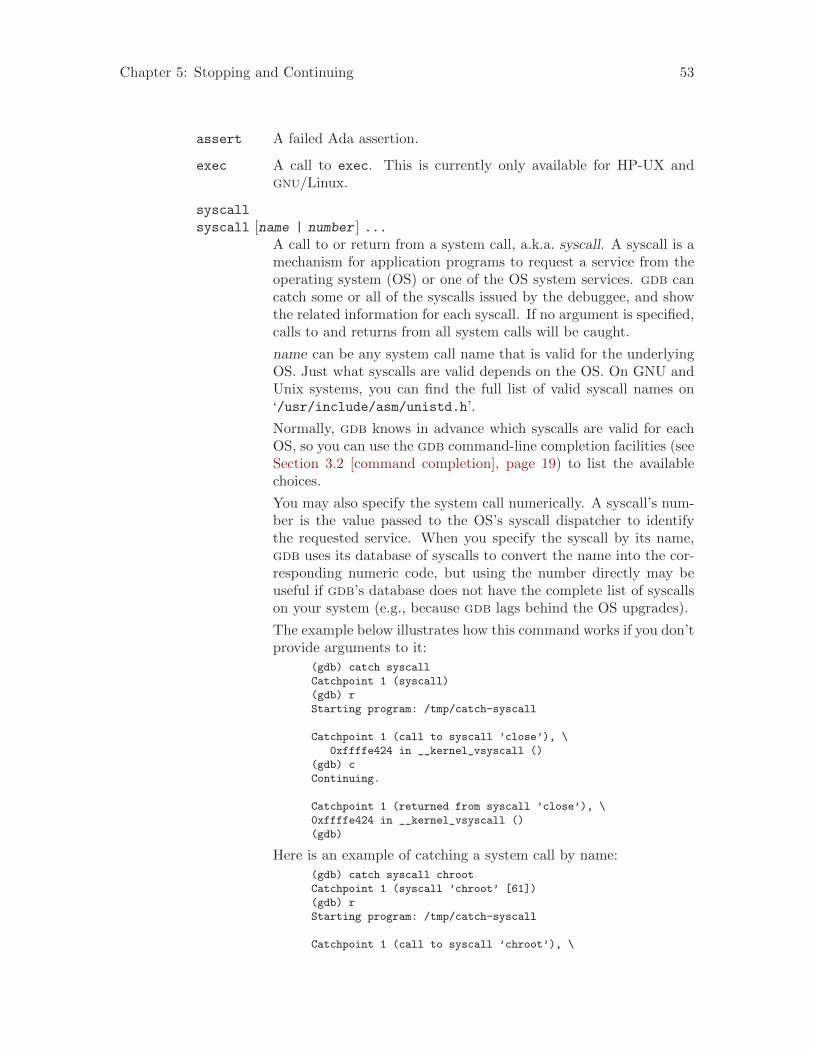
Chapter 5: Stopping and Continuing 53
assert A failed Ada assertion.
exec A call to exec. This is currently only available for HP-UX andgnu/Linux.
syscall
syscall [name | number ] ...A call to or return from a system call, a.k.a. syscall. A syscall is amechanism for application programs to request a service from theoperating system (OS) or one of the OS system services. gdb cancatch some or all of the syscalls issued by the debuggee, and showthe related information for each syscall. If no argument is specified,calls to and returns from all system calls will be caught.
name can be any system call name that is valid for the underlyingOS. Just what syscalls are valid depends on the OS. On GNU andUnix systems, you can find the full list of valid syscall names on‘/usr/include/asm/unistd.h’.
Normally, gdb knows in advance which syscalls are valid for eachOS, so you can use the gdb command-line completion facilities (seeSection 3.2 [command completion], page 19) to list the availablechoices.
You may also specify the system call numerically. A syscall’s num-ber is the value passed to the OS’s syscall dispatcher to identifythe requested service. When you specify the syscall by its name,gdb uses its database of syscalls to convert the name into the cor-responding numeric code, but using the number directly may beuseful if gdb’s database does not have the complete list of syscallson your system (e.g., because gdb lags behind the OS upgrades).
The example below illustrates how this command works if you don’tprovide arguments to it:
(gdb) catch syscall
Catchpoint 1 (syscall)
(gdb) r
Starting program: /tmp/catch-syscall
Catchpoint 1 (call to syscall ’close’), \
0xffffe424 in __kernel_vsyscall ()
(gdb) c
Continuing.
Catchpoint 1 (returned from syscall ’close’), \
0xffffe424 in __kernel_vsyscall ()
(gdb)
Here is an example of catching a system call by name:
(gdb) catch syscall chroot
Catchpoint 1 (syscall ’chroot’ [61])
(gdb) r
Starting program: /tmp/catch-syscall
Catchpoint 1 (call to syscall ’chroot’), \
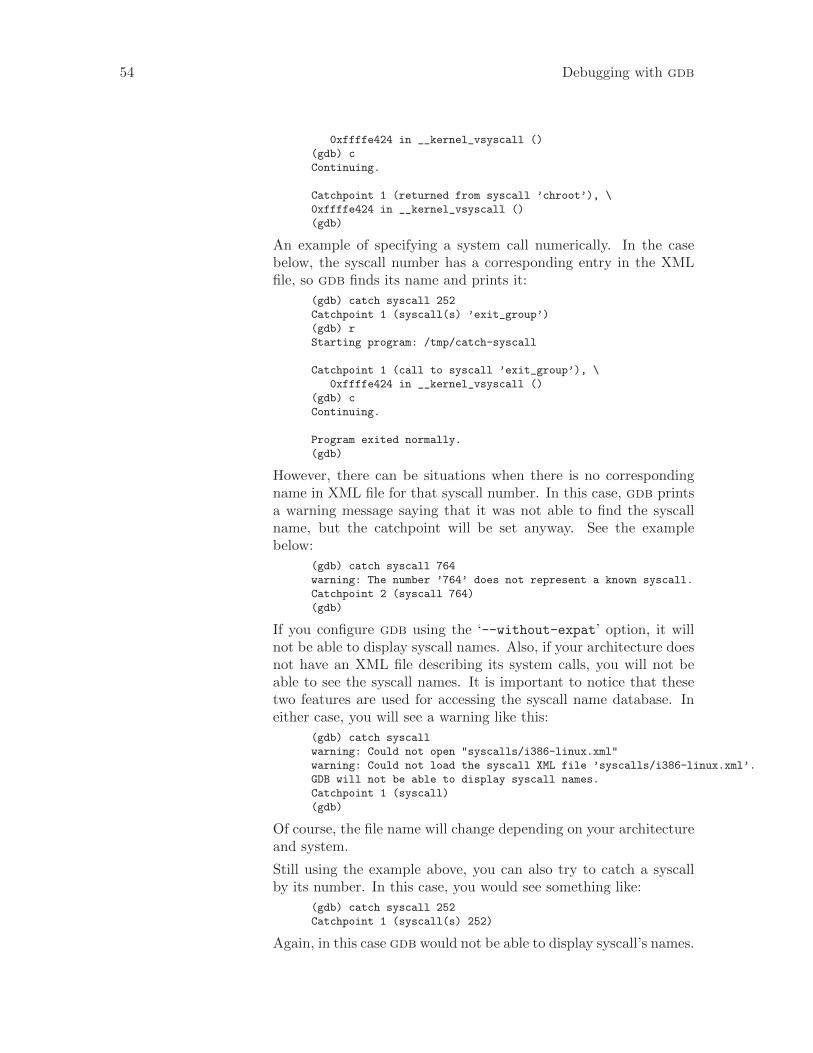
54 Debugging with gdb
0xffffe424 in __kernel_vsyscall ()
(gdb) c
Continuing.
Catchpoint 1 (returned from syscall ’chroot’), \
0xffffe424 in __kernel_vsyscall ()
(gdb)
An example of specifying a system call numerically. In the casebelow, the syscall number has a corresponding entry in the XMLfile, so gdb finds its name and prints it:
(gdb) catch syscall 252
Catchpoint 1 (syscall(s) ’exit_group’)
(gdb) r
Starting program: /tmp/catch-syscall
Catchpoint 1 (call to syscall ’exit_group’), \
0xffffe424 in __kernel_vsyscall ()
(gdb) c
Continuing.
Program exited normally.
(gdb)
However, there can be situations when there is no correspondingname in XML file for that syscall number. In this case, gdb printsa warning message saying that it was not able to find the syscallname, but the catchpoint will be set anyway. See the examplebelow:
(gdb) catch syscall 764
warning: The number ’764’ does not represent a known syscall.
Catchpoint 2 (syscall 764)
(gdb)
If you configure gdb using the ‘--without-expat’ option, it willnot be able to display syscall names. Also, if your architecture doesnot have an XML file describing its system calls, you will not beable to see the syscall names. It is important to notice that thesetwo features are used for accessing the syscall name database. Ineither case, you will see a warning like this:
(gdb) catch syscall
warning: Could not open "syscalls/i386-linux.xml"
warning: Could not load the syscall XML file ’syscalls/i386-linux.xml’.
GDB will not be able to display syscall names.
Catchpoint 1 (syscall)
(gdb)
Of course, the file name will change depending on your architectureand system.
Still using the example above, you can also try to catch a syscallby its number. In this case, you would see something like:
(gdb) catch syscall 252
Catchpoint 1 (syscall(s) 252)
Again, in this case gdb would not be able to display syscall’s names.
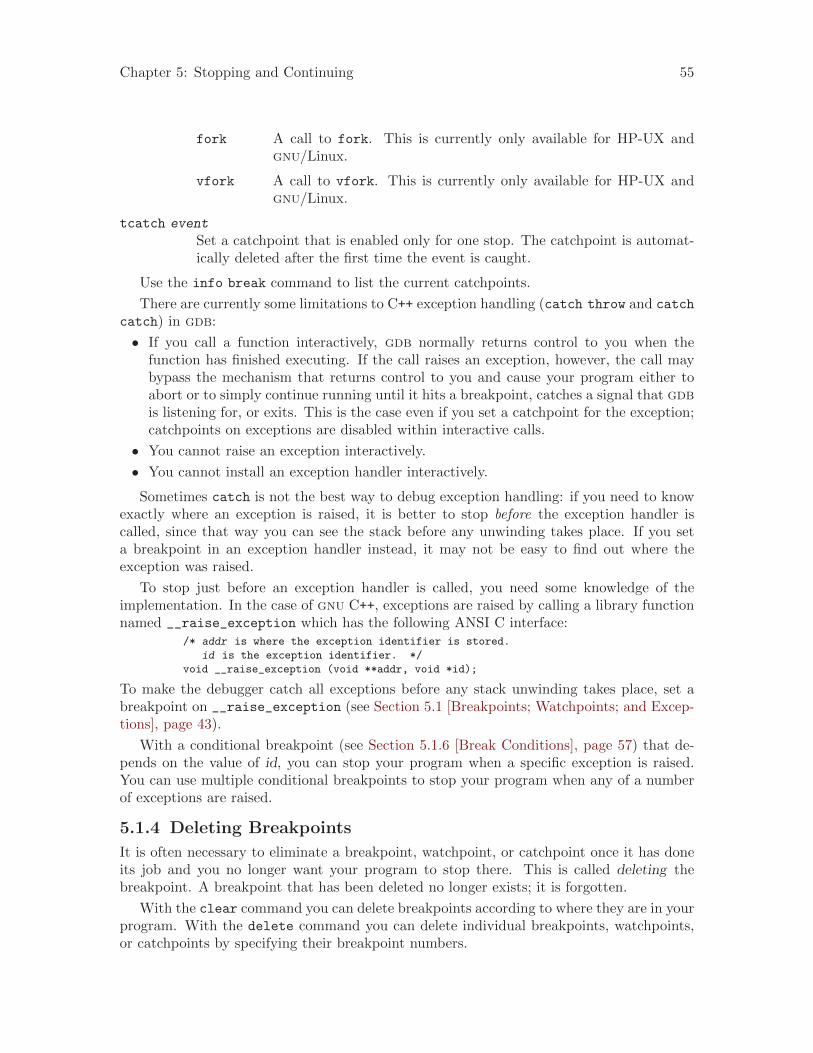
Chapter 5: Stopping and Continuing 55
fork A call to fork. This is currently only available for HP-UX andgnu/Linux.
vfork A call to vfork. This is currently only available for HP-UX andgnu/Linux.
tcatch event
Set a catchpoint that is enabled only for one stop. The catchpoint is automat-ically deleted after the first time the event is caught.
Use the info break command to list the current catchpoints.
There are currently some limitations to C++ exception handling (catch throw and catch
catch) in gdb:
• If you call a function interactively, gdb normally returns control to you when thefunction has finished executing. If the call raises an exception, however, the call maybypass the mechanism that returns control to you and cause your program either toabort or to simply continue running until it hits a breakpoint, catches a signal that gdbis listening for, or exits. This is the case even if you set a catchpoint for the exception;catchpoints on exceptions are disabled within interactive calls.
• You cannot raise an exception interactively.
• You cannot install an exception handler interactively.
Sometimes catch is not the best way to debug exception handling: if you need to knowexactly where an exception is raised, it is better to stop before the exception handler iscalled, since that way you can see the stack before any unwinding takes place. If you seta breakpoint in an exception handler instead, it may not be easy to find out where theexception was raised.
To stop just before an exception handler is called, you need some knowledge of theimplementation. In the case of gnu C++, exceptions are raised by calling a library functionnamed __raise_exception which has the following ANSI C interface:
/* addr is where the exception identifier is stored.
id is the exception identifier. */
void __raise_exception (void **addr, void *id);
To make the debugger catch all exceptions before any stack unwinding takes place, set abreakpoint on __raise_exception (see Section 5.1 [Breakpoints; Watchpoints; and Excep-tions], page 43).
With a conditional breakpoint (see Section 5.1.6 [Break Conditions], page 57) that de-pends on the value of id, you can stop your program when a specific exception is raised.You can use multiple conditional breakpoints to stop your program when any of a numberof exceptions are raised.
5.1.4 Deleting Breakpoints
It is often necessary to eliminate a breakpoint, watchpoint, or catchpoint once it has doneits job and you no longer want your program to stop there. This is called deleting thebreakpoint. A breakpoint that has been deleted no longer exists; it is forgotten.
With the clear command you can delete breakpoints according to where they are in yourprogram. With the delete command you can delete individual breakpoints, watchpoints,or catchpoints by specifying their breakpoint numbers.
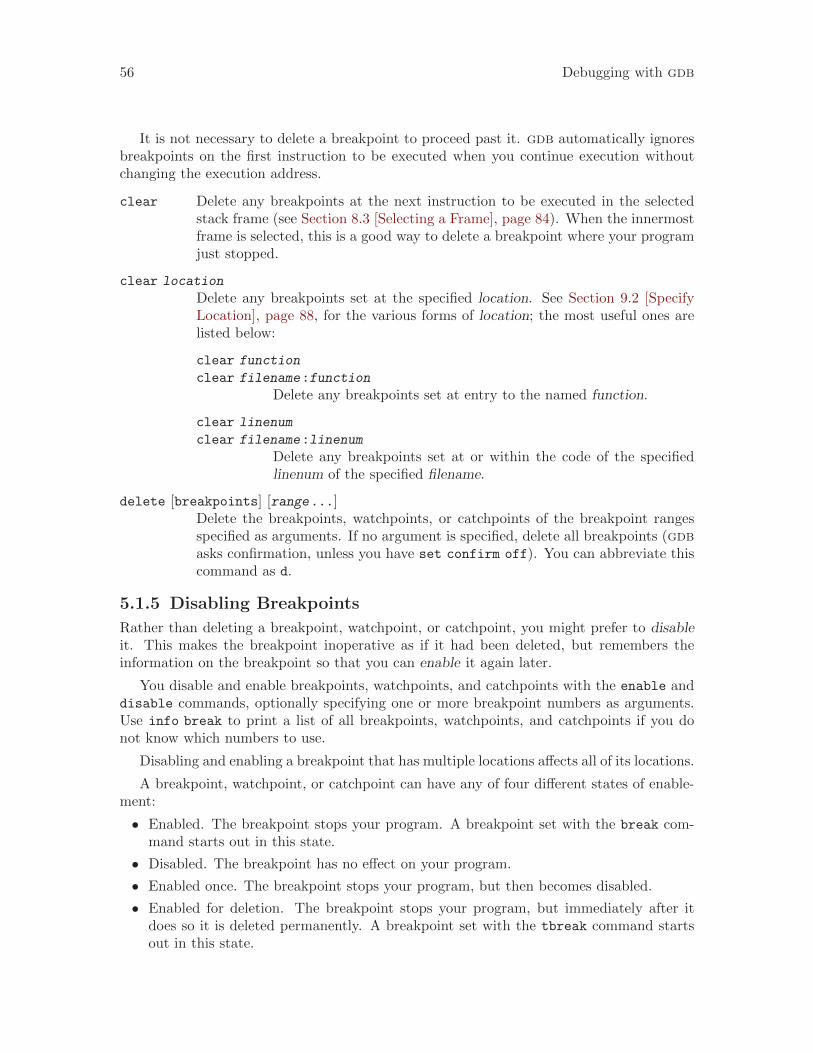
56 Debugging with gdb
It is not necessary to delete a breakpoint to proceed past it. gdb automatically ignoresbreakpoints on the first instruction to be executed when you continue execution withoutchanging the execution address.
clear Delete any breakpoints at the next instruction to be executed in the selectedstack frame (see Section 8.3 [Selecting a Frame], page 84). When the innermostframe is selected, this is a good way to delete a breakpoint where your programjust stopped.
clear location
Delete any breakpoints set at the specified location. See Section 9.2 [SpecifyLocation], page 88, for the various forms of location; the most useful ones arelisted below:
clear function
clear filename:function
Delete any breakpoints set at entry to the named function.
clear linenum
clear filename:linenum
Delete any breakpoints set at or within the code of the specifiedlinenum of the specified filename.
delete [breakpoints] [range...]Delete the breakpoints, watchpoints, or catchpoints of the breakpoint rangesspecified as arguments. If no argument is specified, delete all breakpoints (gdbasks confirmation, unless you have set confirm off). You can abbreviate thiscommand as d.
5.1.5 Disabling Breakpoints
Rather than deleting a breakpoint, watchpoint, or catchpoint, you might prefer to disableit. This makes the breakpoint inoperative as if it had been deleted, but remembers theinformation on the breakpoint so that you can enable it again later.
You disable and enable breakpoints, watchpoints, and catchpoints with the enable anddisable commands, optionally specifying one or more breakpoint numbers as arguments.Use info break to print a list of all breakpoints, watchpoints, and catchpoints if you donot know which numbers to use.
Disabling and enabling a breakpoint that has multiple locations affects all of its locations.
A breakpoint, watchpoint, or catchpoint can have any of four different states of enable-ment:
• Enabled. The breakpoint stops your program. A breakpoint set with the break com-mand starts out in this state.
• Disabled. The breakpoint has no effect on your program.
• Enabled once. The breakpoint stops your program, but then becomes disabled.
• Enabled for deletion. The breakpoint stops your program, but immediately after itdoes so it is deleted permanently. A breakpoint set with the tbreak command startsout in this state.
Chapter 5: Stopping and Continuing 57
You can use the following commands to enable or disable breakpoints, watchpoints, andcatchpoints:
disable [breakpoints] [range...]Disable the specified breakpoints—or all breakpoints, if none are listed. Adisabled breakpoint has no effect but is not forgotten. All options such asignore-counts, conditions and commands are remembered in case the breakpointis enabled again later. You may abbreviate disable as dis.
enable [breakpoints] [range...]Enable the specified breakpoints (or all defined breakpoints). They becomeeffective once again in stopping your program.
enable [breakpoints] once range...
Enable the specified breakpoints temporarily. gdb disables any of these break-points immediately after stopping your program.
enable [breakpoints] delete range...
Enable the specified breakpoints to work once, then die. gdb deletes any ofthese breakpoints as soon as your program stops there. Breakpoints set by thetbreak command start out in this state.
Except for a breakpoint set with tbreak (see Section 5.1.1 [Setting Breakpoints],page 44), breakpoints that you set are initially enabled; subsequently, they becomedisabled or enabled only when you use one of the commands above. (The command until
can set and delete a breakpoint of its own, but it does not change the state of your otherbreakpoints; see Section 5.2 [Continuing and Stepping], page 61.)
5.1.6 Break Conditions
The simplest sort of breakpoint breaks every time your program reaches a specified place.You can also specify a condition for a breakpoint. A condition is just a Boolean expressionin your programming language (see Section 10.1 [Expressions], page 97). A breakpoint witha condition evaluates the expression each time your program reaches it, and your programstops only if the condition is true.
This is the converse of using assertions for program validation; in that situation, youwant to stop when the assertion is violated—that is, when the condition is false. In C, ifyou want to test an assertion expressed by the condition assert, you should set the condition‘! assert ’ on the appropriate breakpoint.
Conditions are also accepted for watchpoints; you may not need them, since a watchpointis inspecting the value of an expression anyhow—but it might be simpler, say, to just set awatchpoint on a variable name, and specify a condition that tests whether the new value isan interesting one.
Break conditions can have side effects, and may even call functions in your program. Thiscan be useful, for example, to activate functions that log program progress, or to use yourown print functions to format special data structures. The effects are completely predictableunless there is another enabled breakpoint at the same address. (In that case, gdb mightsee the other breakpoint first and stop your program without checking the condition ofthis one.) Note that breakpoint commands are usually more convenient and flexible than
58 Debugging with gdb
break conditions for the purpose of performing side effects when a breakpoint is reached(see Section 5.1.7 [Breakpoint Command Lists], page 59).
Break conditions can be specified when a breakpoint is set, by using ‘if’ in the argumentsto the break command. See Section 5.1.1 [Setting Breakpoints], page 44. They can also bechanged at any time with the condition command.
You can also use the if keyword with the watch command. The catch command doesnot recognize the if keyword; condition is the only way to impose a further condition ona catchpoint.
condition bnum expression
Specify expression as the break condition for breakpoint, watchpoint, or catch-point number bnum. After you set a condition, breakpoint bnum stops yourprogram only if the value of expression is true (nonzero, in C). When youuse condition, gdb checks expression immediately for syntactic correctness,and to determine whether symbols in it have referents in the context of yourbreakpoint. If expression uses symbols not referenced in the context of thebreakpoint, gdb prints an error message:
No symbol "foo" in current context.
gdb does not actually evaluate expression at the time the condition command(or a command that sets a breakpoint with a condition, like break if ...) isgiven, however. See Section 10.1 [Expressions], page 97.
condition bnum
Remove the condition from breakpoint number bnum. It becomes an ordinaryunconditional breakpoint.
A special case of a breakpoint condition is to stop only when the breakpoint has beenreached a certain number of times. This is so useful that there is a special way to do it,using the ignore count of the breakpoint. Every breakpoint has an ignore count, which isan integer. Most of the time, the ignore count is zero, and therefore has no effect. But ifyour program reaches a breakpoint whose ignore count is positive, then instead of stopping,it just decrements the ignore count by one and continues. As a result, if the ignore countvalue is n, the breakpoint does not stop the next n times your program reaches it.
ignore bnum count
Set the ignore count of breakpoint number bnum to count. The next counttimes the breakpoint is reached, your program’s execution does not stop; otherthan to decrement the ignore count, gdb takes no action.
To make the breakpoint stop the next time it is reached, specify a count of zero.
When you use continue to resume execution of your program from a break-point, you can specify an ignore count directly as an argument to continue,rather than using ignore. See Section 5.2 [Continuing and Stepping], page 61.
If a breakpoint has a positive ignore count and a condition, the condition isnot checked. Once the ignore count reaches zero, gdb resumes checking thecondition.
You could achieve the effect of the ignore count with a condition such as‘$foo-- <= 0’ using a debugger convenience variable that is decremented eachtime. See Section 10.11 [Convenience Variables], page 117.
Chapter 5: Stopping and Continuing 59
Ignore counts apply to breakpoints, watchpoints, and catchpoints.
5.1.7 Breakpoint Command Lists
You can give any breakpoint (or watchpoint or catchpoint) a series of commands to executewhen your program stops due to that breakpoint. For example, you might want to printthe values of certain expressions, or enable other breakpoints.
commands [range...]... command-list ...
end Specify a list of commands for the given breakpoints. The commands themselvesappear on the following lines. Type a line containing just end to terminate thecommands.
To remove all commands from a breakpoint, type commands and follow it im-mediately with end; that is, give no commands.
With no argument, commands refers to the last breakpoint, watchpoint, or catch-point set (not to the breakpoint most recently encountered). If the most recentbreakpoints were set with a single command, then the commands will applyto all the breakpoints set by that command. This applies to breakpoints setby rbreak, and also applies when a single break command creates multiplebreakpoints (see Section 10.2 [Ambiguous Expressions], page 98).
Pressing RET as a means of repeating the last gdb command is disabled within acommand-list.
You can use breakpoint commands to start your program up again. Simply use thecontinue command, or step, or any other command that resumes execution.
Any other commands in the command list, after a command that resumes execution, areignored. This is because any time you resume execution (even with a simple next or step),you may encounter another breakpoint—which could have its own command list, leadingto ambiguities about which list to execute.
If the first command you specify in a command list is silent, the usual message aboutstopping at a breakpoint is not printed. This may be desirable for breakpoints that areto print a specific message and then continue. If none of the remaining commands printanything, you see no sign that the breakpoint was reached. silent is meaningful only atthe beginning of a breakpoint command list.
The commands echo, output, and printf allow you to print precisely controlled output,and are often useful in silent breakpoints. See Section 23.1.4 [Commands for ControlledOutput], page 279.
For example, here is how you could use breakpoint commands to print the value of x atentry to foo whenever x is positive.
break foo if x>0
commands
silent
printf "x is %d\n",x
cont
end
One application for breakpoint commands is to compensate for one bug so you can testfor another. Put a breakpoint just after the erroneous line of code, give it a condition
60 Debugging with gdb
to detect the case in which something erroneous has been done, and give it commands toassign correct values to any variables that need them. End with the continue command sothat your program does not stop, and start with the silent command so that no outputis produced. Here is an example:
break 403
commands
silent
set x = y + 4
cont
end
5.1.8 How to save breakpoints to a file
To save breakpoint definitions to a file use the save breakpoints command.
save breakpoints [filename]
This command saves all current breakpoint definitions together with their com-mands and ignore counts, into a file ‘filename ’ suitable for use in a laterdebugging session. This includes all types of breakpoints (breakpoints, watch-points, catchpoints, tracepoints). To read the saved breakpoint definitions, usethe source command (see Section 23.1.3 [Command Files], page 278). Notethat watchpoints with expressions involving local variables may fail to be recre-ated because it may not be possible to access the context where the watchpointis valid anymore. Because the saved breakpoint definitions are simply a se-quence of gdb commands that recreate the breakpoints, you can edit the filein your favorite editing program, and remove the breakpoint definitions you’renot interested in, or that can no longer be recreated.
5.1.9 “Cannot insert breakpoints”
If you request too many active hardware-assisted breakpoints and watchpoints, you will seethis error message:
Stopped; cannot insert breakpoints.
You may have requested too many hardware breakpoints and watchpoints.
This message is printed when you attempt to resume the program, since only then gdbknows exactly how many hardware breakpoints and watchpoints it needs to insert.
When this message is printed, you need to disable or remove some of the hardware-assisted breakpoints and watchpoints, and then continue.
5.1.10 “Breakpoint address adjusted...”
Some processor architectures place constraints on the addresses at which breakpoints maybe placed. For architectures thus constrained, gdb will attempt to adjust the breakpoint’saddress to comply with the constraints dictated by the architecture.
One example of such an architecture is the Fujitsu FR-V. The FR-V is a VLIW archi-tecture in which a number of RISC-like instructions may be bundled together for parallelexecution. The FR-V architecture constrains the location of a breakpoint instruction withinsuch a bundle to the instruction with the lowest address. gdb honors this constraint byadjusting a breakpoint’s address to the first in the bundle.
It is not uncommon for optimized code to have bundles which contain instructions fromdifferent source statements, thus it may happen that a breakpoint’s address will be adjusted
Chapter 5: Stopping and Continuing 61
from one source statement to another. Since this adjustment may significantly alter gdb’sbreakpoint related behavior from what the user expects, a warning is printed when thebreakpoint is first set and also when the breakpoint is hit.
A warning like the one below is printed when setting a breakpoint that’s been subjectto address adjustment:
warning: Breakpoint address adjusted from 0x00010414 to 0x00010410.
Such warnings are printed both for user settable and gdb’s internal breakpoints. If yousee one of these warnings, you should verify that a breakpoint set at the adjusted addresswill have the desired affect. If not, the breakpoint in question may be removed and otherbreakpoints may be set which will have the desired behavior. E.g., it may be sufficient toplace the breakpoint at a later instruction. A conditional breakpoint may also be useful insome cases to prevent the breakpoint from triggering too often.
gdb will also issue a warning when stopping at one of these adjusted breakpoints:warning: Breakpoint 1 address previously adjusted from 0x00010414
to 0x00010410.
When this warning is encountered, it may be too late to take remedial action except incases where the breakpoint is hit earlier or more frequently than expected.
5.2 Continuing and Stepping
Continuing means resuming program execution until your program completes normally. Incontrast, stepping means executing just one more “step” of your program, where “step”may mean either one line of source code, or one machine instruction (depending on whatparticular command you use). Either when continuing or when stepping, your program maystop even sooner, due to a breakpoint or a signal. (If it stops due to a signal, you may wantto use handle, or use ‘signal 0’ to resume execution. See Section 5.4 [Signals], page 66.)
continue [ignore-count ]c [ignore-count ]fg [ignore-count ]
Resume program execution, at the address where your program last stopped;any breakpoints set at that address are bypassed. The optional argumentignore-count allows you to specify a further number of times to ignore a break-point at this location; its effect is like that of ignore (see Section 5.1.6 [BreakConditions], page 57).
The argument ignore-count is meaningful only when your program stopped dueto a breakpoint. At other times, the argument to continue is ignored.
The synonyms c and fg (for foreground, as the debugged program is deemedto be the foreground program) are provided purely for convenience, and haveexactly the same behavior as continue.
To resume execution at a different place, you can use return (see Section 17.4 [Returningfrom a Function], page 197) to go back to the calling function; or jump (see Section 17.2[Continuing at a Different Address], page 196) to go to an arbitrary location in your program.
A typical technique for using stepping is to set a breakpoint (see Section 5.1 [Breakpoints;Watchpoints; and Catchpoints], page 43) at the beginning of the function or the sectionof your program where a problem is believed to lie, run your program until it stops at
62 Debugging with gdb
that breakpoint, and then step through the suspect area, examining the variables that areinteresting, until you see the problem happen.
step Continue running your program until control reaches a different source line,then stop it and return control to gdb. This command is abbreviated s.
Warning: If you use the step command while control is withina function that was compiled without debugging information, ex-ecution proceeds until control reaches a function that does havedebugging information. Likewise, it will not step into a functionwhich is compiled without debugging information. To step throughfunctions without debugging information, use the stepi command,described below.
The step command only stops at the first instruction of a source line. This pre-vents the multiple stops that could otherwise occur in switch statements, forloops, etc. step continues to stop if a function that has debugging informationis called within the line. In other words, step steps inside any functions calledwithin the line.
Also, the step command only enters a function if there is line number infor-mation for the function. Otherwise it acts like the next command. This avoidsproblems when using cc -gl on MIPS machines. Previously, step entered sub-routines if there was any debugging information about the routine.
step count
Continue running as in step, but do so count times. If a breakpoint is reached,or a signal not related to stepping occurs before count steps, stepping stopsright away.
next [count ]Continue to the next source line in the current (innermost) stack frame. Thisis similar to step, but function calls that appear within the line of code areexecuted without stopping. Execution stops when control reaches a differentline of code at the original stack level that was executing when you gave thenext command. This command is abbreviated n.
An argument count is a repeat count, as for step.
The next command only stops at the first instruction of a source line. Thisprevents multiple stops that could otherwise occur in switch statements, forloops, etc.
set step-mode
set step-mode on
The set step-mode on command causes the step command to stop at the firstinstruction of a function which contains no debug line information rather thanstepping over it.
This is useful in cases where you may be interested in inspecting the machineinstructions of a function which has no symbolic info and do not want gdb toautomatically skip over this function.
Chapter 5: Stopping and Continuing 63
set step-mode off
Causes the step command to step over any functions which contains no debuginformation. This is the default.
show step-mode
Show whether gdb will stop in or step over functions without source line debuginformation.
finish Continue running until just after function in the selected stack frame returns.Print the returned value (if any). This command can be abbreviated as fin.
Contrast this with the return command (see Section 17.4 [Returning from aFunction], page 197).
until
u Continue running until a source line past the current line, in the current stackframe, is reached. This command is used to avoid single stepping through a loopmore than once. It is like the next command, except that when until encoun-ters a jump, it automatically continues execution until the program counter isgreater than the address of the jump.
This means that when you reach the end of a loop after single stepping thoughit, until makes your program continue execution until it exits the loop. In con-trast, a next command at the end of a loop simply steps back to the beginningof the loop, which forces you to step through the next iteration.
until always stops your program if it attempts to exit the current stack frame.
until may produce somewhat counterintuitive results if the order of machinecode does not match the order of the source lines. For example, in the followingexcerpt from a debugging session, the f (frame) command shows that executionis stopped at line 206; yet when we use until, we get to line 195:
(gdb) f
#0 main (argc=4, argv=0xf7fffae8) at m4.c:206
206 expand_input();
(gdb) until
195 for ( ; argc > 0; NEXTARG) {
This happened because, for execution efficiency, the compiler had generatedcode for the loop closure test at the end, rather than the start, of the loop—even though the test in a C for-loop is written before the body of the loop.The until command appeared to step back to the beginning of the loop whenit advanced to this expression; however, it has not really gone to an earlierstatement—not in terms of the actual machine code.
until with no argument works by means of single instruction stepping, andhence is slower than until with an argument.
until location
u location
Continue running your program until either the specified location is reached,or the current stack frame returns. location is any of the forms describedin Section 9.2 [Specify Location], page 88. This form of the command usestemporary breakpoints, and hence is quicker than until without an argument.The specified location is actually reached only if it is in the current frame. This
64 Debugging with gdb
implies that until can be used to skip over recursive function invocations. Forinstance in the code below, if the current location is line 96, issuing until 99
will execute the program up to line 99 in the same invocation of factorial, i.e.,after the inner invocations have returned.
94 int factorial (int value)
95 {
96 if (value > 1) {
97 value *= factorial (value - 1);
98 }
99 return (value);
100 }
advance location
Continue running the program up to the given location. An argument is re-quired, which should be of one of the forms described in Section 9.2 [SpecifyLocation], page 88. Execution will also stop upon exit from the current stackframe. This command is similar to until, but advance will not skip over re-cursive function calls, and the target location doesn’t have to be in the sameframe as the current one.
stepi
stepi arg
si Execute one machine instruction, then stop and return to the debugger.
It is often useful to do ‘display/i $pc’ when stepping by machine instructions.This makes gdb automatically display the next instruction to be executed, eachtime your program stops. See Section 10.7 [Automatic Display], page 105.
An argument is a repeat count, as in step.
nexti
nexti arg
ni Execute one machine instruction, but if it is a function call, proceed until thefunction returns.
An argument is a repeat count, as in next.
5.3 Skipping Over Functions and Files
The program you are debugging may contain some functions which are uninteresting todebug. The skip comand lets you tell gdb to skip a function or all functions in a file whenstepping.
For example, consider the following C function:
101 int func()
102 {
103 foo(boring());
104 bar(boring());
105 }
Suppose you wish to step into the functions foo and bar, but you are not interested instepping through boring. If you run step at line 103, you’ll enter boring(), but if you runnext, you’ll step over both foo and boring!
One solution is to step into boring and use the finish command to immediately exitit. But this can become tedious if boring is called from many places.
Chapter 5: Stopping and Continuing 65
A more flexible solution is to execute skip boring. This instructs gdb never to stepinto boring. Now when you execute step at line 103, you’ll step over boring and directlyinto foo.
You can also instruct gdb to skip all functions in a file, with, for example, skip file
boring.c.
skip [linespec ]skip function [linespec ]
After running this command, the function named by linespec or the functioncontaining the line named by linespec will be skipped over when stepping. SeeSection 9.2 [Specify Location], page 88.
If you do not specify linespec, the function you’re currently debugging will beskipped.
(If you have a function called file that you want to skip, use skip function
file.)
skip file [filename ]After running this command, any function whose source lives in filename willbe skipped over when stepping.
If you do not specify filename, functions whose source lives in the file you’recurrently debugging will be skipped.
Skips can be listed, deleted, disabled, and enabled, much like breakpoints. These arethe commands for managing your list of skips:
info skip [range ]Print details about the specified skip(s). If range is not specified, print a tablewith details about all functions and files marked for skipping. info skip printsthe following information about each skip:
Identifier A number identifying this skip.
Type The type of this skip, either ‘function’ or ‘file’.
Enabled or DisabledEnabled skips are marked with ‘y’. Disabled skips are marked with‘n’.
Address For function skips, this column indicates the address in memoryof the function being skipped. If you’ve set a function skip ona function which has not yet been loaded, this field will contain‘<PENDING>’. Once a shared library which has the function isloaded, info skip will show the function’s address here.
What For file skips, this field contains the filename being skipped. Forfunctions skips, this field contains the function name and its linenumber in the file where it is defined.
skip delete [range ]Delete the specified skip(s). If range is not specified, delete all skips.
skip enable [range ]Enable the specified skip(s). If range is not specified, enable all skips.
66 Debugging with gdb
skip disable [range ]Disable the specified skip(s). If range is not specified, disable all skips.
5.4 Signals
A signal is an asynchronous event that can happen in a program. The operating systemdefines the possible kinds of signals, and gives each kind a name and a number. For example,in Unix SIGINT is the signal a program gets when you type an interrupt character (oftenCtrl-c); SIGSEGV is the signal a program gets from referencing a place in memory faraway from all the areas in use; SIGALRM occurs when the alarm clock timer goes off (whichhappens only if your program has requested an alarm).
Some signals, including SIGALRM, are a normal part of the functioning of your program.Others, such as SIGSEGV, indicate errors; these signals are fatal (they kill your programimmediately) if the program has not specified in advance some other way to handle thesignal. SIGINT does not indicate an error in your program, but it is normally fatal so it cancarry out the purpose of the interrupt: to kill the program.
gdb has the ability to detect any occurrence of a signal in your program. You can tellgdb in advance what to do for each kind of signal.
Normally, gdb is set up to let the non-erroneous signals like SIGALRM be silently passedto your program (so as not to interfere with their role in the program’s functioning) but tostop your program immediately whenever an error signal happens. You can change thesesettings with the handle command.
info signals
info handle
Print a table of all the kinds of signals and how gdb has been told to handleeach one. You can use this to see the signal numbers of all the defined types ofsignals.
info signals sig
Similar, but print information only about the specified signal number.
info handle is an alias for info signals.
handle signal [keywords...]Change the way gdb handles signal signal. signal can be the number of asignal or its name (with or without the ‘SIG’ at the beginning); a list of signalnumbers of the form ‘low-high ’; or the word ‘all’, meaning all the knownsignals. Optional arguments keywords, described below, say what change tomake.
The keywords allowed by the handle command can be abbreviated. Their full namesare:
nostop gdb should not stop your program when this signal happens. It may still printa message telling you that the signal has come in.
stop gdb should stop your program when this signal happens. This implies theprint keyword as well.
print gdb should print a message when this signal happens.
Chapter 5: Stopping and Continuing 67
noprint gdb should not mention the occurrence of the signal at all. This implies thenostop keyword as well.
pass
noignore gdb should allow your program to see this signal; your program can handle thesignal, or else it may terminate if the signal is fatal and not handled. pass andnoignore are synonyms.
nopass
ignore gdb should not allow your program to see this signal. nopass and ignore aresynonyms.
When a signal stops your program, the signal is not visible to the program until youcontinue. Your program sees the signal then, if pass is in effect for the signal in questionat that time. In other words, after gdb reports a signal, you can use the handle commandwith pass or nopass to control whether your program sees that signal when you continue.
The default is set to nostop, noprint, pass for non-erroneous signals such as SIGALRM,SIGWINCH and SIGCHLD, and to stop, print, pass for the erroneous signals.
You can also use the signal command to prevent your program from seeing a signal, orcause it to see a signal it normally would not see, or to give it any signal at any time. Forexample, if your program stopped due to some sort of memory reference error, you mightstore correct values into the erroneous variables and continue, hoping to see more execution;but your program would probably terminate immediately as a result of the fatal signal onceit saw the signal. To prevent this, you can continue with ‘signal 0’. See Section 17.3[Giving your Program a Signal], page 197.
On some targets, gdb can inspect extra signal information associated with the inter-cepted signal, before it is actually delivered to the program being debugged. This informa-tion is exported by the convenience variable $_siginfo, and consists of data that is passedby the kernel to the signal handler at the time of the receipt of a signal. The data type ofthe information itself is target dependent. You can see the data type using the ptype $_
siginfo command. On Unix systems, it typically corresponds to the standard siginfo_t
type, as defined in the ‘signal.h’ system header.
Here’s an example, on a gnu/Linux system, printing the stray referenced address thatraised a segmentation fault.
68 Debugging with gdb
(gdb) continue
Program received signal SIGSEGV, Segmentation fault.
0x0000000000400766 in main ()
69 *(int *)p = 0;
(gdb) ptype $_siginfo
type = struct {
int si_signo;
int si_errno;
int si_code;
union {
int _pad[28];
struct {...} _kill;
struct {...} _timer;
struct {...} _rt;
struct {...} _sigchld;
struct {...} _sigfault;
struct {...} _sigpoll;
} _sifields;
}
(gdb) ptype $_siginfo._sifields._sigfault
type = struct {
void *si_addr;
}
(gdb) p $_siginfo._sifields._sigfault.si_addr
$1 = (void *) 0x7ffff7ff7000
Depending on target support, $_siginfo may also be writable.
5.5 Stopping and Starting Multi-thread Programs
gdb supports debugging programs with multiple threads (see Section 4.10 [Debugging Pro-grams with Multiple Threads], page 35). There are two modes of controlling execution ofyour program within the debugger. In the default mode, referred to as all-stop mode, whenany thread in your program stops (for example, at a breakpoint or while being stepped), allother threads in the program are also stopped by gdb. On some targets, gdb also supportsnon-stop mode, in which other threads can continue to run freely while you examine thestopped thread in the debugger.
5.5.1 All-Stop Mode
In all-stop mode, whenever your program stops under gdb for any reason, all threads ofexecution stop, not just the current thread. This allows you to examine the overall stateof the program, including switching between threads, without worrying that things maychange underfoot.
Conversely, whenever you restart the program, all threads start executing. This is trueeven when single-stepping with commands like step or next.
In particular, gdb cannot single-step all threads in lockstep. Since thread schedulingis up to your debugging target’s operating system (not controlled by gdb), other threadsmay execute more than one statement while the current thread completes a single step.Moreover, in general other threads stop in the middle of a statement, rather than at a cleanstatement boundary, when the program stops.
Chapter 5: Stopping and Continuing 69
You might even find your program stopped in another thread after continuing or evensingle-stepping. This happens whenever some other thread runs into a breakpoint, a signal,or an exception before the first thread completes whatever you requested.
Whenever gdb stops your program, due to a breakpoint or a signal, it automaticallyselects the thread where that breakpoint or signal happened. gdb alerts you to the contextswitch with a message such as ‘[Switching to Thread n]’ to identify the thread.
On some OSes, you can modify gdb’s default behavior by locking the OS scheduler toallow only a single thread to run.
set scheduler-locking mode
Set the scheduler locking mode. If it is off, then there is no locking and anythread may run at any time. If on, then only the current thread may run whenthe inferior is resumed. The stepmode optimizes for single-stepping; it preventsother threads from preempting the current thread while you are stepping, sothat the focus of debugging does not change unexpectedly. Other threads onlyrarely (or never) get a chance to run when you step. They are more likely torun when you ‘next’ over a function call, and they are completely free to runwhen you use commands like ‘continue’, ‘until’, or ‘finish’. However, unlessanother thread hits a breakpoint during its timeslice, gdb does not change thecurrent thread away from the thread that you are debugging.
show scheduler-locking
Display the current scheduler locking mode.
By default, when you issue one of the execution commands such as continue, nextor step, gdb allows only threads of the current inferior to run. For example, if gdb isattached to two inferiors, each with two threads, the continue command resumes only thetwo threads of the current inferior. This is useful, for example, when you debug a programthat forks and you want to hold the parent stopped (so that, for instance, it doesn’t run toexit), while you debug the child. In other situations, you may not be interested in inspectingthe current state of any of the processes gdb is attached to, and you may want to resumethem all until some breakpoint is hit. In the latter case, you can instruct gdb to allow allthreads of all the inferiors to run with the set schedule-multiple command.
set schedule-multiple
Set the mode for allowing threads of multiple processes to be resumed when anexecution command is issued. When on, all threads of all processes are allowedto run. When off, only the threads of the current process are resumed. Thedefault is off. The scheduler-locking mode takes precedence when set toon, or while you are stepping and set to step.
show schedule-multiple
Display the current mode for resuming the execution of threads of multipleprocesses.
5.5.2 Non-Stop Mode
For some multi-threaded targets, gdb supports an optional mode of operation in whichyou can examine stopped program threads in the debugger while other threads continue toexecute freely. This minimizes intrusion when debugging live systems, such as programs
70 Debugging with gdb
where some threads have real-time constraints or must continue to respond to externalevents. This is referred to as non-stop mode.
In non-stop mode, when a thread stops to report a debugging event, only that thread isstopped; gdb does not stop other threads as well, in contrast to the all-stop mode behavior.Additionally, execution commands such as continue and step apply by default only tothe current thread in non-stop mode, rather than all threads as in all-stop mode. Thisallows you to control threads explicitly in ways that are not possible in all-stop mode — forexample, stepping one thread while allowing others to run freely, stepping one thread whileholding all others stopped, or stepping several threads independently and simultaneously.
To enter non-stop mode, use this sequence of commands before you run or attach toyour program:
# Enable the async interface.
set target-async 1
# If using the CLI, pagination breaks non-stop.
set pagination off
# Finally, turn it on!
set non-stop on
You can use these commands to manipulate the non-stop mode setting:
set non-stop on
Enable selection of non-stop mode.
set non-stop off
Disable selection of non-stop mode.
show non-stop
Show the current non-stop enablement setting.
Note these commands only reflect whether non-stop mode is enabled, not whether thecurrently-executing program is being run in non-stop mode. In particular, the set non-
stop preference is only consulted when gdb starts or connects to the target program, andit is generally not possible to switch modes once debugging has started. Furthermore, sincenot all targets support non-stop mode, even when you have enabled non-stop mode, gdbmay still fall back to all-stop operation by default.
In non-stop mode, all execution commands apply only to the current thread by default.That is, continue only continues one thread. To continue all threads, issue continue -a
or c -a.
You can use gdb’s background execution commands (see Section 5.5.3 [BackgroundExecution], page 71) to run some threads in the background while you continue to examineor step others from gdb. The MI execution commands (see Section 27.14 [GDB/MI ProgramExecution], page 363) are always executed asynchronously in non-stop mode.
Suspending execution is done with the interrupt command when running in the back-ground, or Ctrl-c during foreground execution. In all-stop mode, this stops the wholeprocess; but in non-stop mode the interrupt applies only to the current thread. To stop thewhole program, use interrupt -a.
Other execution commands do not currently support the -a option.
Chapter 5: Stopping and Continuing 71
In non-stop mode, when a thread stops, gdb doesn’t automatically make that threadcurrent, as it does in all-stop mode. This is because the thread stop notifications areasynchronous with respect to gdb’s command interpreter, and it would be confusing if gdbunexpectedly changed to a different thread just as you entered a command to operate onthe previously current thread.
5.5.3 Background Execution
gdb’s execution commands have two variants: the normal foreground (synchronous) behav-ior, and a background (asynchronous) behavior. In foreground execution, gdb waits for theprogram to report that some thread has stopped before prompting for another command.In background execution, gdb immediately gives a command prompt so that you can issueother commands while your program runs.
You need to explicitly enable asynchronous mode before you can use background ex-ecution commands. You can use these commands to manipulate the asynchronous modesetting:
set target-async on
Enable asynchronous mode.
set target-async off
Disable asynchronous mode.
show target-async
Show the current target-async setting.
If the target doesn’t support async mode, gdb issues an error message if you attemptto use the background execution commands.
To specify background execution, add a & to the command. For example, the backgroundform of the continue command is continue&, or just c&. The execution commands thataccept background execution are:
run See Section 4.2 [Starting your Program], page 26.
attach See Section 4.7 [Debugging an Already-running Process], page 31.
step See Section 5.2 [Continuing and Stepping], page 61.
stepi See Section 5.2 [Continuing and Stepping], page 61.
next See Section 5.2 [Continuing and Stepping], page 61.
nexti See Section 5.2 [Continuing and Stepping], page 61.
continue See Section 5.2 [Continuing and Stepping], page 61.
finish See Section 5.2 [Continuing and Stepping], page 61.
until See Section 5.2 [Continuing and Stepping], page 61.
Background execution is especially useful in conjunction with non-stop mode for debug-ging programs with multiple threads; see Section 5.5.2 [Non-Stop Mode], page 69. However,you can also use these commands in the normal all-stop mode with the restriction that youcannot issue another execution command until the previous one finishes. Examples of com-mands that are valid in all-stop mode while the program is running include help and info
break.
72 Debugging with gdb
You can interrupt your program while it is running in the background by using theinterrupt command.
interrupt
interrupt -a
Suspend execution of the running program. In all-stop mode, interrupt stopsthe whole process, but in non-stop mode, it stops only the current thread. Tostop the whole program in non-stop mode, use interrupt -a.
5.5.4 Thread-Specific Breakpoints
When your program has multiple threads (see Section 4.10 [Debugging Programs withMultiple Threads], page 35), you can choose whether to set breakpoints on all threads, oron a particular thread.
break linespec thread threadno
break linespec thread threadno if ...
linespec specifies source lines; there are several ways of writing them (seeSection 9.2 [Specify Location], page 88), but the effect is always to specifysome source line.
Use the qualifier ‘thread threadno ’ with a breakpoint command to specifythat you only want gdb to stop the program when a particular thread reachesthis breakpoint. threadno is one of the numeric thread identifiers assigned bygdb, shown in the first column of the ‘info threads’ display.
If you do not specify ‘thread threadno ’ when you set a breakpoint, the break-point applies to all threads of your program.
You can use the thread qualifier on conditional breakpoints as well; in this case,place ‘thread threadno ’ before or after the breakpoint condition, like this:
(gdb) break frik.c:13 thread 28 if bartab > lim
5.5.5 Interrupted System Calls
There is an unfortunate side effect when using gdb to debug multi-threaded programs. Ifone thread stops for a breakpoint, or for some other reason, and another thread is blockedin a system call, then the system call may return prematurely. This is a consequenceof the interaction between multiple threads and the signals that gdb uses to implementbreakpoints and other events that stop execution.
To handle this problem, your program should check the return value of each system calland react appropriately. This is good programming style anyways.
For example, do not write code like this:
sleep (10);
The call to sleep will return early if a different thread stops at a breakpoint or for someother reason.
Instead, write this:
int unslept = 10;
while (unslept > 0)
unslept = sleep (unslept);
Chapter 5: Stopping and Continuing 73
A system call is allowed to return early, so the system is still conforming to its specifica-tion. But gdb does cause your multi-threaded program to behave differently than it wouldwithout gdb.
Also, gdb uses internal breakpoints in the thread library to monitor certain events suchas thread creation and thread destruction. When such an event happens, a system callin another thread may return prematurely, even though your program does not appear tostop.
5.5.6 Observer Mode
If you want to build on non-stop mode and observe program behavior without any chanceof disruption by gdb, you can set variables to disable all of the debugger’s attempts tomodify state, whether by writing memory, inserting breakpoints, etc. These operate at alow level, intercepting operations from all commands.
When all of these are set to off, then gdb is said to be observer mode. As a convenience,the variable observer can be set to disable these, plus enable non-stop mode.
Note that gdb will not prevent you from making nonsensical combinations of thesesettings. For instance, if you have enabled may-insert-breakpoints but disabled may-
write-memory, then breakpoints that work by writing trap instructions into the code streamwill still not be able to be placed.
set observer on
set observer off
When set to on, this disables all the permission variables below (except forinsert-fast-tracepoints), plus enables non-stop debugging. Setting this tooff switches back to normal debugging, though remaining in non-stop mode.
show observer
Show whether observer mode is on or off.
set may-write-registers on
set may-write-registers off
This controls whether gdb will attempt to alter the values of registers, such aswith assignment expressions in print, or the jump command. It defaults to on.
show may-write-registers
Show the current permission to write registers.
set may-write-memory on
set may-write-memory off
This controls whether gdb will attempt to alter the contents of memory, suchas with assignment expressions in print. It defaults to on.
show may-write-memory
Show the current permission to write memory.
set may-insert-breakpoints on
set may-insert-breakpoints off
This controls whether gdb will attempt to insert breakpoints. This affects allbreakpoints, including internal breakpoints defined by gdb. It defaults to on.
74 Debugging with gdb
show may-insert-breakpoints
Show the current permission to insert breakpoints.
set may-insert-tracepoints on
set may-insert-tracepoints off
This controls whether gdb will attempt to insert (regular) tracepoints at thebeginning of a tracing experiment. It affects only non-fast tracepoints, fast tra-cepoints being under the control of may-insert-fast-tracepoints. It defaultsto on.
show may-insert-tracepoints
Show the current permission to insert tracepoints.
set may-insert-fast-tracepoints on
set may-insert-fast-tracepoints off
This controls whether gdb will attempt to insert fast tracepoints at the begin-ning of a tracing experiment. It affects only fast tracepoints, regular (non-fast)tracepoints being under the control of may-insert-tracepoints. It defaultsto on.
show may-insert-fast-tracepoints
Show the current permission to insert fast tracepoints.
set may-interrupt on
set may-interrupt off
This controls whether gdb will attempt to interrupt or stop program execution.When this variable is off, the interrupt command will have no effect, nor willCtrl-c. It defaults to on.
show may-interrupt
Show the current permission to interrupt or stop the program.
Chapter 6: Running programs backward 75
6 Running programs backward
When you are debugging a program, it is not unusual to realize that you have gone too far,and some event of interest has already happened. If the target environment supports it,gdb can allow you to “rewind” the program by running it backward.
A target environment that supports reverse execution should be able to “undo” thechanges in machine state that have taken place as the program was executing normally.Variables, registers etc. should revert to their previous values. Obviously this requires agreat deal of sophistication on the part of the target environment; not all target environ-ments can support reverse execution.
When a program is executed in reverse, the instructions that have most recently beenexecuted are “un-executed”, in reverse order. The program counter runs backward, follow-ing the previous thread of execution in reverse. As each instruction is “un-executed”, thevalues of memory and/or registers that were changed by that instruction are reverted totheir previous states. After executing a piece of source code in reverse, all side effects ofthat code should be “undone”, and all variables should be returned to their prior values1.
If you are debugging in a target environment that supports reverse execution, gdbprovides the following commands.
reverse-continue [ignore-count ]rc [ignore-count ]
Beginning at the point where your program last stopped, start executing inreverse. Reverse execution will stop for breakpoints and synchronous exceptions(signals), just like normal execution. Behavior of asynchronous signals dependson the target environment.
reverse-step [count ]Run the program backward until control reaches the start of a different sourceline; then stop it, and return control to gdb.
Like the step command, reverse-step will only stop at the beginning of asource line. It “un-executes” the previously executed source line. If the pre-vious source line included calls to debuggable functions, reverse-step willstep (backward) into the called function, stopping at the beginning of the laststatement in the called function (typically a return statement).
Also, as with the step command, if non-debuggable functions are called,reverse-step will run thru them backward without stopping.
reverse-stepi [count ]Reverse-execute one machine instruction. Note that the instruction to bereverse-executed is not the one pointed to by the program counter, but the
1 Note that some side effects are easier to undo than others. For instance, memory and registers arerelatively easy, but device I/O is hard. Some targets may be able undo things like device I/O, and somemay not.
The contract between gdb and the reverse executing target requires only that the target do somethingreasonable when gdb tells it to execute backwards, and then report the results back to gdb. Whateverthe target reports back to gdb, gdb will report back to the user. gdb assumes that the memory andregisters that the target reports are in a consistant state, but gdb accepts whatever it is given.
76 Debugging with gdb
instruction executed prior to that one. For instance, if the last instruction wasa jump, reverse-stepi will take you back from the destination of the jump tothe jump instruction itself.
reverse-next [count ]Run backward to the beginning of the previous line executed in the current(innermost) stack frame. If the line contains function calls, they will be “un-executed” without stopping. Starting from the first line of a function, reverse-next will take you back to the caller of that function, before the function wascalled, just as the normal next command would take you from the last line ofa function back to its return to its caller2.
reverse-nexti [count ]Like nexti, reverse-nexti executes a single instruction in reverse, exceptthat called functions are “un-executed” atomically. That is, if the previouslyexecuted instruction was a return from another function, reverse-nexti willcontinue to execute in reverse until the call to that function (from the currentstack frame) is reached.
reverse-finish
Just as the finish command takes you to the point where the current functionreturns, reverse-finish takes you to the point where it was called. Insteadof ending up at the end of the current function invocation, you end up at thebeginning.
set exec-direction
Set the direction of target execution.
set exec-direction reverse
gdb will perform all execution commands in reverse, until the exec-directionmode is changed to “forward”. Affected commands include step, stepi,
next, nexti, continue, and finish. The return command cannot be usedin reverse mode.
set exec-direction forward
gdb will perform all execution commands in the normal fashion. This is thedefault.
2 Unless the code is too heavily optimized.
Chapter 7: Recording Inferior’s Execution and Replaying It 77
7 Recording Inferior’s Execution and Replaying It
On some platforms, gdb provides a special process record and replay target that can recorda log of the process execution, and replay it later with both forward and reverse executioncommands.
When this target is in use, if the execution log includes the record for the next instruction,gdb will debug in replay mode. In the replay mode, the inferior does not really executecode instructions. Instead, all the events that normally happen during code execution aretaken from the execution log. While code is not really executed in replay mode, the valuesof registers (including the program counter register) and the memory of the inferior are stillchanged as they normally would. Their contents are taken from the execution log.
If the record for the next instruction is not in the execution log, gdb will debug in recordmode. In this mode, the inferior executes normally, and gdb records the execution log forfuture replay.
The process record and replay target supports reverse execution (see Chapter 6 [ReverseExecution], page 75), even if the platform on which the inferior runs does not. However,the reverse execution is limited in this case by the range of the instructions recorded in theexecution log. In other words, reverse execution on platforms that don’t support it directlycan only be done in the replay mode.
When debugging in the reverse direction, gdb will work in replay mode as long as theexecution log includes the record for the previous instruction; otherwise, it will work inrecord mode, if the platform supports reverse execution, or stop if not.
For architecture environments that support process record and replay, gdb provides thefollowing commands:
target record
This command starts the process record and replay target. The process recordand replay target can only debug a process that is already running. Therefore,you need first to start the process with the run or start commands, and thenstart the recording with the target record command.
Both record and rec are aliases of target record.
Displaced stepping (see Appendix D [displaced stepping], page 459) will beautomatically disabled when process record and replay target is started. That’sbecause the process record and replay target doesn’t support displaced stepping.
If the inferior is in the non-stop mode (see Section 5.5.2 [Non-Stop Mode],page 69) or in the asynchronous execution mode (see Section 5.5.3 [BackgroundExecution], page 71), the process record and replay target cannot be startedbecause it doesn’t support these two modes.
record stop
Stop the process record and replay target. When process record and replaytarget stops, the entire execution log will be deleted and the inferior will eitherbe terminated, or will remain in its final state.
When you stop the process record and replay target in record mode (at theend of the execution log), the inferior will be stopped at the next instructionthat would have been recorded. In other words, if you record for a while and
78 Debugging with gdb
then stop recording, the inferior process will be left in the same state as if therecording never happened.
On the other hand, if the process record and replay target is stopped while inreplay mode (that is, not at the end of the execution log, but at some earlierpoint), the inferior process will become “live” at that earlier state, and it willthen be possible to continue the usual “live” debugging of the process from thatstate.
When the inferior process exits, or gdb detaches from it, process record andreplay target will automatically stop itself.
record save filename
Save the execution log to a file ‘filename ’. Default filename is‘gdb_record.process_id ’, where process id is the process ID of the inferior.
record restore filename
Restore the execution log from a file ‘filename ’. File must have been createdwith record save.
set record insn-number-max limit
Set the limit of instructions to be recorded. Default value is 200000.
If limit is a positive number, then gdb will start deleting instructions from thelog once the number of the record instructions becomes greater than limit. Forevery new recorded instruction, gdb will delete the earliest recorded instruc-tion to keep the number of recorded instructions at the limit. (Since deletingrecorded instructions loses information, gdb lets you control what happenswhen the limit is reached, by means of the stop-at-limit option, describedbelow.)
If limit is zero, gdb will never delete recorded instructions from the executionlog. The number of recorded instructions is unlimited in this case.
show record insn-number-max
Show the limit of instructions to be recorded.
set record stop-at-limit
Control the behavior when the number of recorded instructions reaches thelimit. If ON (the default), gdb will stop when the limit is reached for the firsttime and ask you whether you want to stop the inferior or continue running itand recording the execution log. If you decide to continue recording, each newrecorded instruction will cause the oldest one to be deleted.
If this option is OFF, gdb will automatically delete the oldest record to makeroom for each new one, without asking.
show record stop-at-limit
Show the current setting of stop-at-limit.
set record memory-query
Control the behavior when gdb is unable to record memory changes caused byan instruction. If ON, gdb will query whether to stop the inferior in that case.
If this option is OFF (the default), gdb will automatically ignore the effect ofsuch instructions on memory. Later, when gdb replays this execution log, it
Chapter 7: Recording Inferior’s Execution and Replaying It 79
will mark the log of this instruction as not accessible, and it will not affect thereplay results.
show record memory-query
Show the current setting of memory-query.
info record
Show various statistics about the state of process record and its in-memoryexecution log buffer, including:
• Whether in record mode or replay mode.
• Lowest recorded instruction number (counting from when the current exe-cution log started recording instructions).
• Highest recorded instruction number.
• Current instruction about to be replayed (if in replay mode).
• Number of instructions contained in the execution log.
• Maximum number of instructions that may be contained in the executionlog.
record delete
When record target runs in replay mode (“in the past”), delete the subsequentexecution log and begin to record a new execution log starting from the currentaddress. This means you will abandon the previously recorded “future” andbegin recording a new “future”.

Chapter 8: Examining the Stack 81
8 Examining the Stack
When your program has stopped, the first thing you need to know is where it stopped andhow it got there.
Each time your program performs a function call, information about the call is generated.That information includes the location of the call in your program, the arguments of thecall, and the local variables of the function being called. The information is saved in a blockof data called a stack frame. The stack frames are allocated in a region of memory calledthe call stack.
When your program stops, the gdb commands for examining the stack allow you to seeall of this information.
One of the stack frames is selected by gdb and many gdb commands refer implicitlyto the selected frame. In particular, whenever you ask gdb for the value of a variable inyour program, the value is found in the selected frame. There are special gdb commands toselect whichever frame you are interested in. See Section 8.3 [Selecting a Frame], page 84.
When your program stops, gdb automatically selects the currently executing frame anddescribes it briefly, similar to the frame command (see Section 8.4 [Information about aFrame], page 85).
8.1 Stack Frames
The call stack is divided up into contiguous pieces called stack frames, or frames for short;each frame is the data associated with one call to one function. The frame contains thearguments given to the function, the function’s local variables, and the address at whichthe function is executing.
When your program is started, the stack has only one frame, that of the function main.This is called the initial frame or the outermost frame. Each time a function is called, anew frame is made. Each time a function returns, the frame for that function invocationis eliminated. If a function is recursive, there can be many frames for the same function.The frame for the function in which execution is actually occurring is called the innermostframe. This is the most recently created of all the stack frames that still exist.
Inside your program, stack frames are identified by their addresses. A stack frameconsists of many bytes, each of which has its own address; each kind of computer has a con-vention for choosing one byte whose address serves as the address of the frame. Usually thisaddress is kept in a register called the frame pointer register (see Section 10.12 [Registers],page 119) while execution is going on in that frame.
gdb assigns numbers to all existing stack frames, starting with zero for the innermostframe, one for the frame that called it, and so on upward. These numbers do not reallyexist in your program; they are assigned by gdb to give you a way of designating stackframes in gdb commands.
Some compilers provide a way to compile functions so that they operate without stackframes. (For example, the gcc option
‘-fomit-frame-pointer’
generates functions without a frame.) This is occasionally done with heavily used li-brary functions to save the frame setup time. gdb has limited facilities for dealing with
82 Debugging with gdb
these function invocations. If the innermost function invocation has no stack frame, gdbnevertheless regards it as though it had a separate frame, which is numbered zero as usual,allowing correct tracing of the function call chain. However, gdb has no provision forframeless functions elsewhere in the stack.
frame args
The frame command allows you to move from one stack frame to another, andto print the stack frame you select. args may be either the address of the frameor the stack frame number. Without an argument, frame prints the currentstack frame.
select-frame
The select-frame command allows you to move from one stack frame to an-other without printing the frame. This is the silent version of frame.
8.2 Backtraces
A backtrace is a summary of how your program got where it is. It shows one line per frame,for many frames, starting with the currently executing frame (frame zero), followed by itscaller (frame one), and on up the stack.
backtrace
bt Print a backtrace of the entire stack: one line per frame for all frames in thestack.
You can stop the backtrace at any time by typing the system interrupt charac-ter, normally Ctrl-c.
backtrace n
bt n Similar, but print only the innermost n frames.
backtrace -n
bt -n Similar, but print only the outermost n frames.
backtrace full
bt full
bt full n
bt full -n
Print the values of the local variables also. n specifies the number of frames toprint, as described above.
The names where and info stack (abbreviated info s) are additional aliases forbacktrace.
In a multi-threaded program, gdb by default shows the backtrace only for the currentthread. To display the backtrace for several or all of the threads, use the command thread
apply (see Section 4.10 [Threads], page 35). For example, if you type thread apply all
backtrace, gdb will display the backtrace for all the threads; this is handy when you debuga core dump of a multi-threaded program.
Each line in the backtrace shows the frame number and the function name. The programcounter value is also shown—unless you use set print address off. The backtrace alsoshows the source file name and line number, as well as the arguments to the function. Theprogram counter value is omitted if it is at the beginning of the code for that line number.
Chapter 8: Examining the Stack 83
Here is an example of a backtrace. It was made with the command ‘bt 3’, so it showsthe innermost three frames.
#0 m4_traceon (obs=0x24eb0, argc=1, argv=0x2b8c8)
at builtin.c:993
#1 0x6e38 in expand_macro (sym=0x2b600, data=...) at macro.c:242
#2 0x6840 in expand_token (obs=0x0, t=177664, td=0xf7fffb08)
at macro.c:71
(More stack frames follow...)
The display for frame zero does not begin with a program counter value, indicating thatyour program has stopped at the beginning of the code for line 993 of builtin.c.
The value of parameter data in frame 1 has been replaced by .... By default, gdb printsthe value of a parameter only if it is a scalar (integer, pointer, enumeration, etc). Seecommand set print frame-arguments in Section 10.8 [Print Settings], page 106 for moredetails on how to configure the way function parameter values are printed.
If your program was compiled with optimizations, some compilers will optimize awayarguments passed to functions if those arguments are never used after the call. Such opti-mizations generate code that passes arguments through registers, but doesn’t store thosearguments in the stack frame. gdb has no way of displaying such arguments in stack framesother than the innermost one. Here’s what such a backtrace might look like:
#0 m4_traceon (obs=0x24eb0, argc=1, argv=0x2b8c8)
at builtin.c:993
#1 0x6e38 in expand_macro (sym=<optimized out>) at macro.c:242
#2 0x6840 in expand_token (obs=0x0, t=<optimized out>, td=0xf7fffb08)
at macro.c:71
(More stack frames follow...)
The values of arguments that were not saved in their stack frames are shown as ‘<optimizedout>’.
If you need to display the values of such optimized-out arguments, either deduce thatfrom other variables whose values depend on the one you are interested in, or recompilewithout optimizations.
Most programs have a standard user entry point—a place where system libraries andstartup code transition into user code. For C this is main1. When gdb finds the entryfunction in a backtrace it will terminate the backtrace, to avoid tracing into highly system-specific (and generally uninteresting) code.
If you need to examine the startup code, or limit the number of levels in a backtrace,you can change this behavior:
set backtrace past-main
set backtrace past-main on
Backtraces will continue past the user entry point.
set backtrace past-main off
Backtraces will stop when they encounter the user entry point. This is thedefault.
show backtrace past-main
Display the current user entry point backtrace policy.
1 Note that embedded programs (the so-called “free-standing” environment) are not required to have amain function as the entry point. They could even have multiple entry points.
84 Debugging with gdb
set backtrace past-entry
set backtrace past-entry on
Backtraces will continue past the internal entry point of an application. Thisentry point is encoded by the linker when the application is built, and is likelybefore the user entry point main (or equivalent) is called.
set backtrace past-entry off
Backtraces will stop when they encounter the internal entry point of an appli-cation. This is the default.
show backtrace past-entry
Display the current internal entry point backtrace policy.
set backtrace limit n
set backtrace limit 0
Limit the backtrace to n levels. A value of zero means unlimited.
show backtrace limit
Display the current limit on backtrace levels.
8.3 Selecting a Frame
Most commands for examining the stack and other data in your program work on whicheverstack frame is selected at the moment. Here are the commands for selecting a stack frame;all of them finish by printing a brief description of the stack frame just selected.
frame n
f n Select frame number n. Recall that frame zero is the innermost (currentlyexecuting) frame, frame one is the frame that called the innermost one, and soon. The highest-numbered frame is the one for main.
frame addr
f addr Select the frame at address addr. This is useful mainly if the chaining of stackframes has been damaged by a bug, making it impossible for gdb to assignnumbers properly to all frames. In addition, this can be useful when yourprogram has multiple stacks and switches between them.
On the SPARC architecture, frame needs two addresses to select an arbitraryframe: a frame pointer and a stack pointer.
On the MIPS and Alpha architecture, it needs two addresses: a stack pointerand a program counter.
On the 29k architecture, it needs three addresses: a register stack pointer, aprogram counter, and a memory stack pointer.
up n Move n frames up the stack. For positive numbers n, this advances toward theoutermost frame, to higher frame numbers, to frames that have existed longer.n defaults to one.
down n Move n frames down the stack. For positive numbers n, this advances towardthe innermost frame, to lower frame numbers, to frames that were created morerecently. n defaults to one. You may abbreviate down as do.
Chapter 8: Examining the Stack 85
All of these commands end by printing two lines of output describing the frame. Thefirst line shows the frame number, the function name, the arguments, and the source fileand line number of execution in that frame. The second line shows the text of that sourceline.
For example:
(gdb) up
#1 0x22f0 in main (argc=1, argv=0xf7fffbf4, env=0xf7fffbfc)
at env.c:10
10 read_input_file (argv[i]);
After such a printout, the list command with no arguments prints ten lines centered onthe point of execution in the frame. You can also edit the program at the point of executionwith your favorite editing program by typing edit. See Section 9.1 [Printing Source Lines],page 87, for details.
up-silently n
down-silently n
These two commands are variants of up and down, respectively; they differ inthat they do their work silently, without causing display of the new frame. Theyare intended primarily for use in gdb command scripts, where the output mightbe unnecessary and distracting.
8.4 Information About a Frame
There are several other commands to print information about the selected stack frame.
frame
f When used without any argument, this command does not change which frameis selected, but prints a brief description of the currently selected stack frame.It can be abbreviated f. With an argument, this command is used to select astack frame. See Section 8.3 [Selecting a Frame], page 84.
info frame
info f This command prints a verbose description of the selected stack frame, includ-ing:
• the address of the frame
• the address of the next frame down (called by this frame)
• the address of the next frame up (caller of this frame)
• the language in which the source code corresponding to this frame is written
• the address of the frame’s arguments
• the address of the frame’s local variables
• the program counter saved in it (the address of execution in the callerframe)
• which registers were saved in the frame
The verbose description is useful when something has gone wrong that has madethe stack format fail to fit the usual conventions.
86 Debugging with gdb
info frame addr
info f addr
Print a verbose description of the frame at address addr, without selecting thatframe. The selected frame remains unchanged by this command. This requiresthe same kind of address (more than one for some architectures) that you specifyin the frame command. See Section 8.3 [Selecting a Frame], page 84.
info args Print the arguments of the selected frame, each on a separate line.
info locals
Print the local variables of the selected frame, each on a separate line. Theseare all variables (declared either static or automatic) accessible at the point ofexecution of the selected frame.
info catch
Print a list of all the exception handlers that are active in the current stackframe at the current point of execution. To see other exception handlers, visitthe associated frame (using the up, down, or frame commands); then type infocatch. See Section 5.1.3 [Setting Catchpoints], page 52.
Chapter 9: Examining Source Files 87
9 Examining Source Files
gdb can print parts of your program’s source, since the debugging information recorded inthe program tells gdb what source files were used to build it. When your program stops,gdb spontaneously prints the line where it stopped. Likewise, when you select a stack frame(see Section 8.3 [Selecting a Frame], page 84), gdb prints the line where execution in thatframe has stopped. You can print other portions of source files by explicit command.
If you use gdb through its gnu Emacs interface, you may prefer to use Emacs facilitiesto view source; see Chapter 26 [Using gdb under gnu Emacs], page 335.
9.1 Printing Source Lines
To print lines from a source file, use the list command (abbreviated l). By default, tenlines are printed. There are several ways to specify what part of the file you want to print;see Section 9.2 [Specify Location], page 88, for the full list.
Here are the forms of the list command most commonly used:
list linenum
Print lines centered around line number linenum in the current source file.
list function
Print lines centered around the beginning of function function.
list Print more lines. If the last lines printed were printed with a list command,this prints lines following the last lines printed; however, if the last line printedwas a solitary line printed as part of displaying a stack frame (see Chapter 8[Examining the Stack], page 81), this prints lines centered around that line.
list - Print lines just before the lines last printed.
By default, gdb prints ten source lines with any of these forms of the list command.You can change this using set listsize:
set listsize count
Make the list command display count source lines (unless the list argumentexplicitly specifies some other number).
show listsize
Display the number of lines that list prints.
Repeating a list command with RET discards the argument, so it is equivalent totyping just list. This is more useful than listing the same lines again. An exception ismade for an argument of ‘-’; that argument is preserved in repetition so that each repetitionmoves up in the source file.
In general, the list command expects you to supply zero, one or two linespecs. Line-specs specify source lines; there are several ways of writing them (see Section 9.2 [SpecifyLocation], page 88), but the effect is always to specify some source line.
Here is a complete description of the possible arguments for list:
list linespec
Print lines centered around the line specified by linespec.
88 Debugging with gdb
list first,last
Print lines from first to last. Both arguments are linespecs. When a list
command has two linespecs, and the source file of the second linespec is omitted,this refers to the same source file as the first linespec.
list ,last
Print lines ending with last.
list first,
Print lines starting with first.
list + Print lines just after the lines last printed.
list - Print lines just before the lines last printed.
list As described in the preceding table.
9.2 Specifying a Location
Several gdb commands accept arguments that specify a location of your program’s code.Since gdb is a source-level debugger, a location usually specifies some line in the sourcecode; for that reason, locations are also known as linespecs.
Here are all the different ways of specifying a code location that gdb understands:
linenum Specifies the line number linenum of the current source file.
-offset
+offset Specifies the line offset lines before or after the current line. For the list
command, the current line is the last one printed; for the breakpoint commands,this is the line at which execution stopped in the currently selected stack frame(see Section 8.1 [Frames], page 81, for a description of stack frames.) Whenused as the second of the two linespecs in a list command, this specifies theline offset lines up or down from the first linespec.
filename:linenum
Specifies the line linenum in the source file filename.
function Specifies the line that begins the body of the function function. For example,in C, this is the line with the open brace.
function:label
Specifies the line where label appears in function.
filename:function
Specifies the line that begins the body of the function function in the file file-name. You only need the file name with a function name to avoid ambiguitywhen there are identically named functions in different source files.
label Specifies the line at which the label named label appears. gdb searches forthe label in the function corresponding to the currently selected stack frame.If there is no current selected stack frame (for instance, if the inferior is notrunning), then gdb will not search for a label.
Chapter 9: Examining Source Files 89
*address Specifies the program address address. For line-oriented commands, such aslist and edit, this specifies a source line that contains address. For break
and other breakpoint oriented commands, this can be used to set breakpointsin parts of your program which do not have debugging information or sourcefiles.
Here address may be any expression valid in the current working language (seeChapter 15 [Languages], page 161) that specifies a code address. In addition,as a convenience, gdb extends the semantics of expressions used in locationsto cover the situations that frequently happen during debugging. Here are thevarious forms of address:
expression
Any expression valid in the current working language.
funcaddr An address of a function or procedure derived from its name. InC, C++, Java, Objective-C, Fortran, minimal, and assembly, thisis simply the function’s name function (and actually a special caseof a valid expression). In Pascal and Modula-2, this is &function .In Ada, this is function’Address (although the Pascal form alsoworks).
This form specifies the address of the function’s first instruction,before the stack frame and arguments have been set up.
’filename’::funcaddr
Like funcaddr above, but also specifies the name of the source fileexplicitly. This is useful if the name of the function does not specifythe function unambiguously, e.g., if there are several functions withidentical names in different source files.
9.3 Editing Source Files
To edit the lines in a source file, use the edit command. The editing program of yourchoice is invoked with the current line set to the active line in the program. Alternatively,there are several ways to specify what part of the file you want to print if you want to seeother parts of the program:
edit location
Edit the source file specified by location. Editing starts at that location,e.g., at the specified source line of the specified file. See Section 9.2 [SpecifyLocation], page 88, for all the possible forms of the location argument; here arethe forms of the edit command most commonly used:
edit number
Edit the current source file with number as the active line number.
edit function
Edit the file containing function at the beginning of its definition.
90 Debugging with gdb
9.3.1 Choosing your Editor
You can customize gdb to use any editor you want1. By default, it is ‘/bin/ex’, but youcan change this by setting the environment variable EDITOR before using gdb. For example,to configure gdb to use the vi editor, you could use these commands with the sh shell:
EDITOR=/usr/bin/vi
export EDITOR
gdb ...
or in the csh shell,setenv EDITOR /usr/bin/vi
gdb ...
9.4 Searching Source Files
There are two commands for searching through the current source file for a regular expres-sion.
forward-search regexp
search regexp
The command ‘forward-search regexp ’ checks each line, starting with theone following the last line listed, for a match for regexp. It lists the line that isfound. You can use the synonym ‘search regexp ’ or abbreviate the commandname as fo.
reverse-search regexp
The command ‘reverse-search regexp ’ checks each line, starting with theone before the last line listed and going backward, for a match for regexp. Itlists the line that is found. You can abbreviate this command as rev.
9.5 Specifying Source Directories
Executable programs sometimes do not record the directories of the source files from whichthey were compiled, just the names. Even when they do, the directories could be movedbetween the compilation and your debugging session. gdb has a list of directories to searchfor source files; this is called the source path. Each time gdb wants a source file, it tries allthe directories in the list, in the order they are present in the list, until it finds a file withthe desired name.
For example, suppose an executable references the file ‘/usr/src/foo-1.0/lib/foo.c’,and our source path is ‘/mnt/cross’. The file is first looked up literally; if this fails,‘/mnt/cross/usr/src/foo-1.0/lib/foo.c’ is tried; if this fails, ‘/mnt/cross/foo.c’ isopened; if this fails, an error message is printed. gdb does not look up the parts of the sourcefile name, such as ‘/mnt/cross/src/foo-1.0/lib/foo.c’. Likewise, the subdirectories ofthe source path are not searched: if the source path is ‘/mnt/cross’, and the binary refersto ‘foo.c’, gdb would not find it under ‘/mnt/cross/usr/src/foo-1.0/lib’.
Plain file names, relative file names with leading directories, file names containing dots,etc. are all treated as described above; for instance, if the source path is ‘/mnt/cross’, and
1 The only restriction is that your editor (say ex), recognizes the following command-line syntax:
ex +number file
The optional numeric value +number specifies the number of the line in the file where to start editing.
Chapter 9: Examining Source Files 91
the source file is recorded as ‘../lib/foo.c’, gdb would first try ‘../lib/foo.c’, then‘/mnt/cross/../lib/foo.c’, and after that—‘/mnt/cross/foo.c’.
Note that the executable search path is not used to locate the source files.
Whenever you reset or rearrange the source path, gdb clears out any information it hascached about where source files are found and where each line is in the file.
When you start gdb, its source path includes only ‘cdir’ and ‘cwd’, in that order. Toadd other directories, use the directory command.
The search path is used to find both program source files and gdb script files (read usingthe ‘-command’ option and ‘source’ command).
In addition to the source path, gdb provides a set of commands that manage a list ofsource path substitution rules. A substitution rule specifies how to rewrite source directoriesstored in the program’s debug information in case the sources were moved to a differentdirectory between compilation and debugging. A rule is made of two strings, the firstspecifying what needs to be rewritten in the path, and the second specifying how it shouldbe rewritten. In [set substitute-path], page 92, we name these two parts from and torespectively. gdb does a simple string replacement of from with to at the start of thedirectory part of the source file name, and uses that result instead of the original file nameto look up the sources.
Using the previous example, suppose the ‘foo-1.0’ tree has been moved from ‘/usr/src’to ‘/mnt/cross’, then you can tell gdb to replace ‘/usr/src’ in all source path names with‘/mnt/cross’. The first lookup will then be ‘/mnt/cross/foo-1.0/lib/foo.c’ in place ofthe original location of ‘/usr/src/foo-1.0/lib/foo.c’. To define a source path substitu-tion rule, use the set substitute-path command (see [set substitute-path], page 92).
To avoid unexpected substitution results, a rule is applied only if the from partof the directory name ends at a directory separator. For instance, a rule substituting‘/usr/source’ into ‘/mnt/cross’ will be applied to ‘/usr/source/foo-1.0’ but notto ‘/usr/sourceware/foo-2.0’. And because the substitution is applied only at thebeginning of the directory name, this rule will not be applied to ‘/root/usr/source/baz.c’either.
In many cases, you can achieve the same result using the directory command. However,set substitute-path can be more efficient in the case where the sources are organized ina complex tree with multiple subdirectories. With the directory command, you need toadd each subdirectory of your project. If you moved the entire tree while preserving itsinternal organization, then set substitute-path allows you to direct the debugger to allthe sources with one single command.
set substitute-path is also more than just a shortcut command. The source pathis only used if the file at the original location no longer exists. On the other hand, setsubstitute-path modifies the debugger behavior to look at the rewritten location instead.So, if for any reason a source file that is not relevant to your executable is located at theoriginal location, a substitution rule is the only method available to point gdb at the newlocation.
You can configure a default source path substitution rule by configuring gdb with the‘--with-relocated-sources=dir ’ option. The dir should be the name of a directory undergdb’s configured prefix (set with ‘--prefix’ or ‘--exec-prefix’), and directory names indebug information under dir will be adjusted automatically if the installed gdb is moved
92 Debugging with gdb
to a new location. This is useful if gdb, libraries or executables with debug informationand corresponding source code are being moved together.
directory dirname ...
dir dirname ...
Add directory dirname to the front of the source path. Several directory namesmay be given to this command, separated by ‘:’ (‘;’ on MS-DOS and MS-Windows, where ‘:’ usually appears as part of absolute file names) or white-space. You may specify a directory that is already in the source path; thismoves it forward, so gdb searches it sooner.
You can use the string ‘$cdir’ to refer to the compilation directory (if one isrecorded), and ‘$cwd’ to refer to the current working directory. ‘$cwd’ is notthe same as ‘.’—the former tracks the current working directory as it changesduring your gdb session, while the latter is immediately expanded to the currentdirectory at the time you add an entry to the source path.
directory
Reset the source path to its default value (‘$cdir:$cwd’ on Unix systems). Thisrequires confirmation.
set directories path-list
Set the source path to path-list. ‘$cdir:$cwd’ are added if missing.
show directories
Print the source path: show which directories it contains.
set substitute-path from to
Define a source path substitution rule, and add it at the end of the current listof existing substitution rules. If a rule with the same from was already defined,then the old rule is also deleted.
For example, if the file ‘/foo/bar/baz.c’ was moved to ‘/mnt/cross/baz.c’,then the command
(gdb) set substitute-path /usr/src /mnt/cross
will tell gdb to replace ‘/usr/src’ with ‘/mnt/cross’, which will allow gdb tofind the file ‘baz.c’ even though it was moved.
In the case when more than one substitution rule have been defined, the rulesare evaluated one by one in the order where they have been defined. The firstone matching, if any, is selected to perform the substitution.
For instance, if we had entered the following commands:(gdb) set substitute-path /usr/src/include /mnt/include
(gdb) set substitute-path /usr/src /mnt/src
gdb would then rewrite ‘/usr/src/include/defs.h’ into ‘/mnt/include/defs.h’by using the first rule. However, it would use the second rule to rewrite‘/usr/src/lib/foo.c’ into ‘/mnt/src/lib/foo.c’.
unset substitute-path [path]
If a path is specified, search the current list of substitution rules for a rule thatwould rewrite that path. Delete that rule if found. A warning is emitted bythe debugger if no rule could be found.
If no path is specified, then all substitution rules are deleted.
Chapter 9: Examining Source Files 93
show substitute-path [path]
If a path is specified, then print the source path substitution rule which wouldrewrite that path, if any.
If no path is specified, then print all existing source path substitution rules.
If your source path is cluttered with directories that are no longer of interest, gdb maysometimes cause confusion by finding the wrong versions of source. You can correct thesituation as follows:
1. Use directory with no argument to reset the source path to its default value.
2. Use directory with suitable arguments to reinstall the directories you want in thesource path. You can add all the directories in one command.
9.6 Source and Machine Code
You can use the command info line to map source lines to program addresses (and viceversa), and the command disassemble to display a range of addresses as machine instruc-tions. You can use the command set disassemble-next-line to set whether to disas-semble next source line when execution stops. When run under gnu Emacs mode, theinfo line command causes the arrow to point to the line specified. Also, info line printsaddresses in symbolic form as well as hex.
info line linespec
Print the starting and ending addresses of the compiled code for source line line-spec. You can specify source lines in any of the ways documented in Section 9.2[Specify Location], page 88.
For example, we can use info line to discover the location of the object code for thefirst line of function m4_changequote:
(gdb) info line m4_changequote
Line 895 of "builtin.c" starts at pc 0x634c and ends at 0x6350.
We can also inquire (using *addr as the form for linespec) what source line covers a par-ticular address:
(gdb) info line *0x63ff
Line 926 of "builtin.c" starts at pc 0x63e4 and ends at 0x6404.
After info line, the default address for the x command is changed to the startingaddress of the line, so that ‘x/i’ is sufficient to begin examining the machine code (seeSection 10.6 [Examining Memory], page 103). Also, this address is saved as the value of theconvenience variable $_ (see Section 10.11 [Convenience Variables], page 117).
disassemble
disassemble /m
disassemble /r
This specialized command dumps a range of memory as machine instructions. Itcan also print mixed source+disassembly by specifying the /m modifier and printthe raw instructions in hex as well as in symbolic form by specifying the /r. Thedefault memory range is the function surrounding the program counter of theselected frame. A single argument to this command is a program counter value;gdb dumps the function surrounding this value. When two arguments are given,
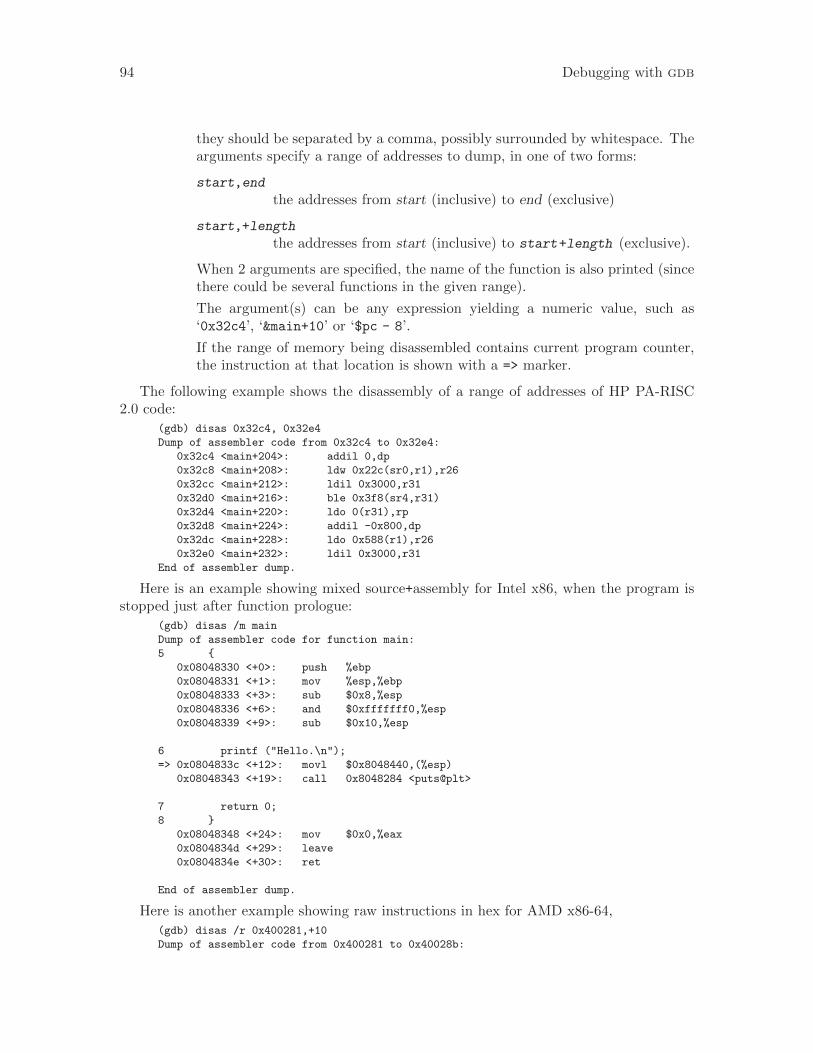
94 Debugging with gdb
they should be separated by a comma, possibly surrounded by whitespace. Thearguments specify a range of addresses to dump, in one of two forms:
start,end
the addresses from start (inclusive) to end (exclusive)
start,+length
the addresses from start (inclusive) to start+length (exclusive).
When 2 arguments are specified, the name of the function is also printed (sincethere could be several functions in the given range).
The argument(s) can be any expression yielding a numeric value, such as‘0x32c4’, ‘&main+10’ or ‘$pc - 8’.
If the range of memory being disassembled contains current program counter,the instruction at that location is shown with a => marker.
The following example shows the disassembly of a range of addresses of HP PA-RISC2.0 code:
(gdb) disas 0x32c4, 0x32e4
Dump of assembler code from 0x32c4 to 0x32e4:
0x32c4 <main+204>: addil 0,dp
0x32c8 <main+208>: ldw 0x22c(sr0,r1),r26
0x32cc <main+212>: ldil 0x3000,r31
0x32d0 <main+216>: ble 0x3f8(sr4,r31)
0x32d4 <main+220>: ldo 0(r31),rp
0x32d8 <main+224>: addil -0x800,dp
0x32dc <main+228>: ldo 0x588(r1),r26
0x32e0 <main+232>: ldil 0x3000,r31
End of assembler dump.
Here is an example showing mixed source+assembly for Intel x86, when the program isstopped just after function prologue:
(gdb) disas /m main
Dump of assembler code for function main:
5 {
0x08048330 <+0>: push %ebp
0x08048331 <+1>: mov %esp,%ebp
0x08048333 <+3>: sub $0x8,%esp
0x08048336 <+6>: and $0xfffffff0,%esp
0x08048339 <+9>: sub $0x10,%esp
6 printf ("Hello.\n");
=> 0x0804833c <+12>: movl $0x8048440,(%esp)
0x08048343 <+19>: call 0x8048284 <puts@plt>
7 return 0;
8 }
0x08048348 <+24>: mov $0x0,%eax
0x0804834d <+29>: leave
0x0804834e <+30>: ret
End of assembler dump.
Here is another example showing raw instructions in hex for AMD x86-64,
(gdb) disas /r 0x400281,+10
Dump of assembler code from 0x400281 to 0x40028b:
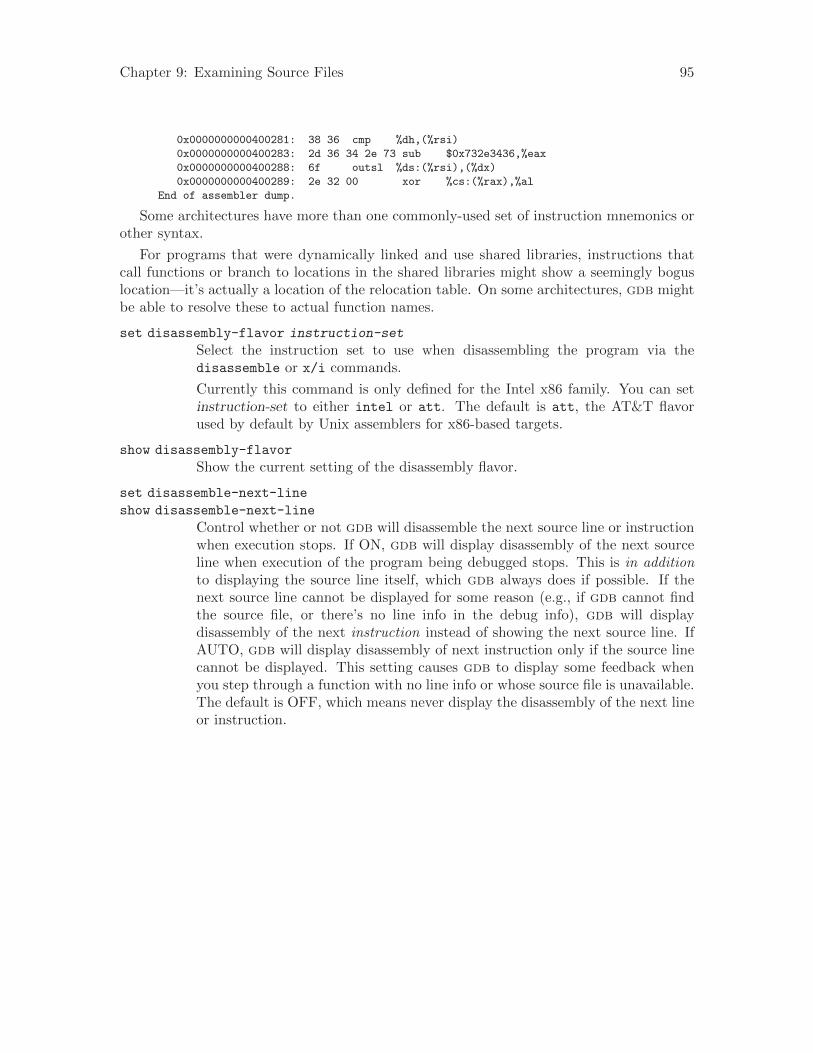
Chapter 9: Examining Source Files 95
0x0000000000400281: 38 36 cmp %dh,(%rsi)
0x0000000000400283: 2d 36 34 2e 73 sub $0x732e3436,%eax
0x0000000000400288: 6f outsl %ds:(%rsi),(%dx)
0x0000000000400289: 2e 32 00 xor %cs:(%rax),%al
End of assembler dump.
Some architectures have more than one commonly-used set of instruction mnemonics orother syntax.
For programs that were dynamically linked and use shared libraries, instructions thatcall functions or branch to locations in the shared libraries might show a seemingly boguslocation—it’s actually a location of the relocation table. On some architectures, gdb mightbe able to resolve these to actual function names.
set disassembly-flavor instruction-set
Select the instruction set to use when disassembling the program via thedisassemble or x/i commands.
Currently this command is only defined for the Intel x86 family. You can setinstruction-set to either intel or att. The default is att, the AT&T flavorused by default by Unix assemblers for x86-based targets.
show disassembly-flavor
Show the current setting of the disassembly flavor.
set disassemble-next-line
show disassemble-next-line
Control whether or not gdb will disassemble the next source line or instructionwhen execution stops. If ON, gdb will display disassembly of the next sourceline when execution of the program being debugged stops. This is in additionto displaying the source line itself, which gdb always does if possible. If thenext source line cannot be displayed for some reason (e.g., if gdb cannot findthe source file, or there’s no line info in the debug info), gdb will displaydisassembly of the next instruction instead of showing the next source line. IfAUTO, gdb will display disassembly of next instruction only if the source linecannot be displayed. This setting causes gdb to display some feedback whenyou step through a function with no line info or whose source file is unavailable.The default is OFF, which means never display the disassembly of the next lineor instruction.

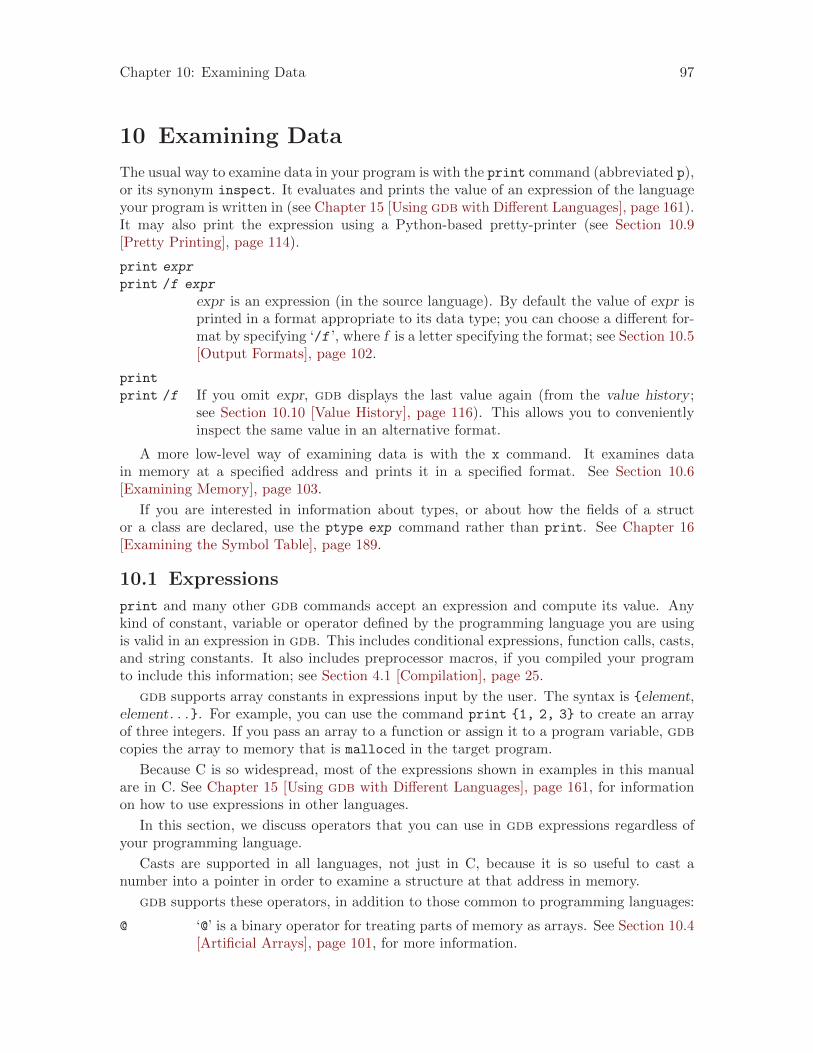
Chapter 10: Examining Data 97
10 Examining Data
The usual way to examine data in your program is with the print command (abbreviated p),or its synonym inspect. It evaluates and prints the value of an expression of the languageyour program is written in (see Chapter 15 [Using gdb with Different Languages], page 161).It may also print the expression using a Python-based pretty-printer (see Section 10.9[Pretty Printing], page 114).
print expr
print /f expr
expr is an expression (in the source language). By default the value of expr isprinted in a format appropriate to its data type; you can choose a different for-mat by specifying ‘/f ’, where f is a letter specifying the format; see Section 10.5[Output Formats], page 102.
print /f If you omit expr, gdb displays the last value again (from the value history ;see Section 10.10 [Value History], page 116). This allows you to convenientlyinspect the same value in an alternative format.
A more low-level way of examining data is with the x command. It examines datain memory at a specified address and prints it in a specified format. See Section 10.6[Examining Memory], page 103.
If you are interested in information about types, or about how the fields of a structor a class are declared, use the ptype exp command rather than print. See Chapter 16[Examining the Symbol Table], page 189.
10.1 Expressions
print and many other gdb commands accept an expression and compute its value. Anykind of constant, variable or operator defined by the programming language you are usingis valid in an expression in gdb. This includes conditional expressions, function calls, casts,and string constants. It also includes preprocessor macros, if you compiled your programto include this information; see Section 4.1 [Compilation], page 25.
gdb supports array constants in expressions input by the user. The syntax is {element,element. . .}. For example, you can use the command print {1, 2, 3} to create an arrayof three integers. If you pass an array to a function or assign it to a program variable, gdbcopies the array to memory that is malloced in the target program.
Because C is so widespread, most of the expressions shown in examples in this manualare in C. See Chapter 15 [Using gdb with Different Languages], page 161, for informationon how to use expressions in other languages.
In this section, we discuss operators that you can use in gdb expressions regardless ofyour programming language.
Casts are supported in all languages, not just in C, because it is so useful to cast anumber into a pointer in order to examine a structure at that address in memory.
gdb supports these operators, in addition to those common to programming languages:
@ ‘@’ is a binary operator for treating parts of memory as arrays. See Section 10.4[Artificial Arrays], page 101, for more information.
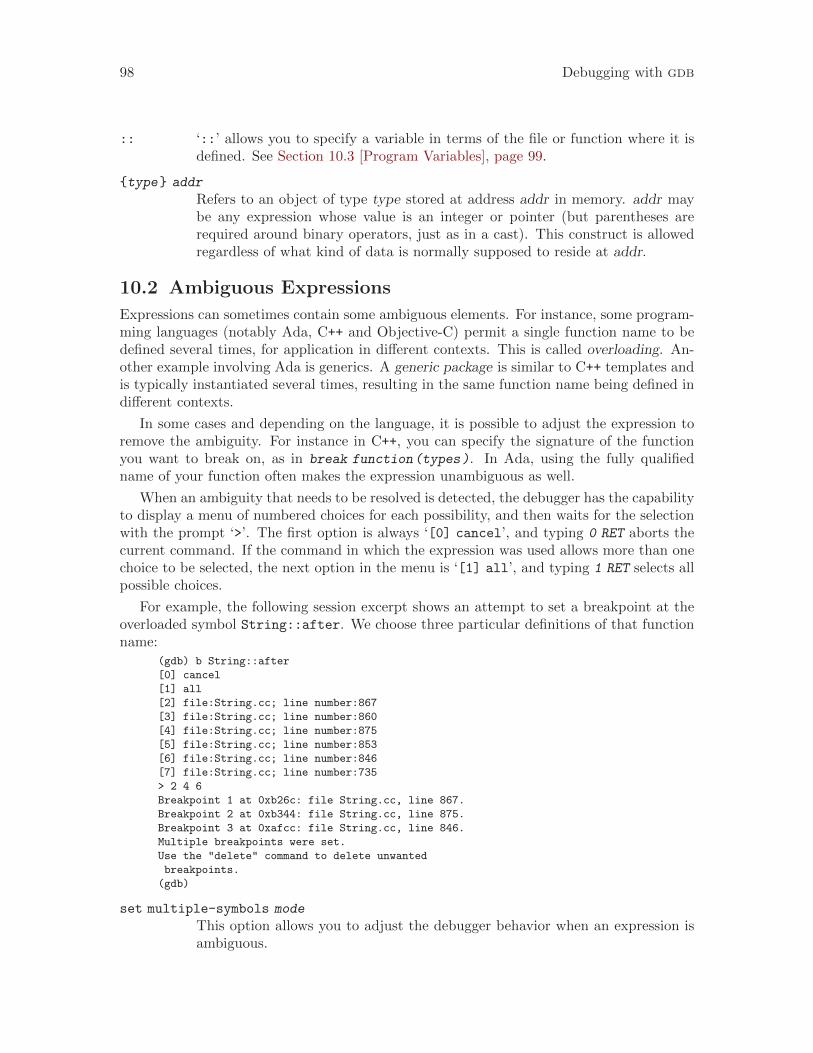
98 Debugging with gdb
:: ‘::’ allows you to specify a variable in terms of the file or function where it isdefined. See Section 10.3 [Program Variables], page 99.
{type} addr
Refers to an object of type type stored at address addr in memory. addr maybe any expression whose value is an integer or pointer (but parentheses arerequired around binary operators, just as in a cast). This construct is allowedregardless of what kind of data is normally supposed to reside at addr.
10.2 Ambiguous Expressions
Expressions can sometimes contain some ambiguous elements. For instance, some program-ming languages (notably Ada, C++ and Objective-C) permit a single function name to bedefined several times, for application in different contexts. This is called overloading. An-other example involving Ada is generics. A generic package is similar to C++ templates andis typically instantiated several times, resulting in the same function name being defined indifferent contexts.
In some cases and depending on the language, it is possible to adjust the expression toremove the ambiguity. For instance in C++, you can specify the signature of the functionyou want to break on, as in break function(types). In Ada, using the fully qualifiedname of your function often makes the expression unambiguous as well.
When an ambiguity that needs to be resolved is detected, the debugger has the capabilityto display a menu of numbered choices for each possibility, and then waits for the selectionwith the prompt ‘>’. The first option is always ‘[0] cancel’, and typing 0 RET aborts thecurrent command. If the command in which the expression was used allows more than onechoice to be selected, the next option in the menu is ‘[1] all’, and typing 1 RET selects allpossible choices.
For example, the following session excerpt shows an attempt to set a breakpoint at theoverloaded symbol String::after. We choose three particular definitions of that functionname:
(gdb) b String::after
[0] cancel
[1] all
[2] file:String.cc; line number:867
[3] file:String.cc; line number:860
[4] file:String.cc; line number:875
[5] file:String.cc; line number:853
[6] file:String.cc; line number:846
[7] file:String.cc; line number:735
> 2 4 6
Breakpoint 1 at 0xb26c: file String.cc, line 867.
Breakpoint 2 at 0xb344: file String.cc, line 875.
Breakpoint 3 at 0xafcc: file String.cc, line 846.
Multiple breakpoints were set.
Use the "delete" command to delete unwanted
breakpoints.
(gdb)
set multiple-symbols mode
This option allows you to adjust the debugger behavior when an expression isambiguous.
Chapter 10: Examining Data 99
By default, mode is set to all. If the command with which the expression isused allows more than one choice, then gdb automatically selects all possiblechoices. For instance, inserting a breakpoint on a function using an ambiguousname results in a breakpoint inserted on each possible match. However, if aunique choice must be made, then gdb uses the menu to help you disambiguatethe expression. For instance, printing the address of an overloaded function willresult in the use of the menu.
Whenmode is set to ask, the debugger always uses the menu when an ambiguityis detected.
Finally, when mode is set to cancel, the debugger reports an error due to theambiguity and the command is aborted.
show multiple-symbols
Show the current value of the multiple-symbols setting.
10.3 Program Variables
The most common kind of expression to use is the name of a variable in your program.
Variables in expressions are understood in the selected stack frame (see Section 8.3[Selecting a Frame], page 84); they must be either:
• global (or file-static)
or
• visible according to the scope rules of the programming language from the point ofexecution in that frame
This means that in the functionfoo (a)
int a;
{
bar (a);
{
int b = test ();
bar (b);
}
}
you can examine and use the variable a whenever your program is executing within thefunction foo, but you can only use or examine the variable b while your program is executinginside the block where b is declared.
There is an exception: you can refer to a variable or function whose scope is a singlesource file even if the current execution point is not in this file. But it is possible to havemore than one such variable or function with the same name (in different source files). Ifthat happens, referring to that name has unpredictable effects. If you wish, you can specifya static variable in a particular function or file, using the colon-colon (::) notation:
file::variable
function::variable
Here file or function is the name of the context for the static variable. In the case of filenames, you can use quotes to make sure gdb parses the file name as a single word—forexample, to print a global value of x defined in ‘f2.c’:
100 Debugging with gdb
(gdb) p ’f2.c’::x
This use of ‘::’ is very rarely in conflict with the very similar use of the same notationin C++. gdb also supports use of the C++ scope resolution operator in gdb expressions.
Warning: Occasionally, a local variable may appear to have the wrong valueat certain points in a function—just after entry to a new scope, and just beforeexit.
You may see this problem when you are stepping by machine instructions. This isbecause, on most machines, it takes more than one instruction to set up a stack frame(including local variable definitions); if you are stepping by machine instructions, variablesmay appear to have the wrong values until the stack frame is completely built. On exit, itusually also takes more than one machine instruction to destroy a stack frame; after youbegin stepping through that group of instructions, local variable definitions may be gone.
This may also happen when the compiler does significant optimizations. To be sure ofalways seeing accurate values, turn off all optimization when compiling.
Another possible effect of compiler optimizations is to optimize unused variables out ofexistence, or assign variables to registers (as opposed to memory addresses). Dependingon the support for such cases offered by the debug info format used by the compiler, gdbmight not be able to display values for such local variables. If that happens, gdb will printa message like this:
No symbol "foo" in current context.
To solve such problems, either recompile without optimizations, or use a different debuginfo format, if the compiler supports several such formats. See Section 4.1 [Compilation],page 25, for more information on choosing compiler options. See Section 15.4.1 [C andC++], page 165, for more information about debug info formats that are best suited to C++programs.
If you ask to print an object whose contents are unknown to gdb, e.g., because itsdata type is not completely specified by the debug information, gdb will say ‘<incompletetype>’. See Chapter 16 [Symbols], page 189, for more about this.
If you append @entry string to a function parameter name you get its value at the timethe function got called. If the value is not available an error message is printed. Entryvalues are available only with some compilers. Entry values are normally also printed atthe function parameter list according to [set print entry-values], page 109.
Breakpoint 1, d (i=30) at gdb.base/entry-value.c:29
29 i++;
(gdb) next
30 e (i);
(gdb) print i
$1 = 31
(gdb) print i@entry
$2 = 30
Strings are identified as arrays of char values without specified signedness. Arrays ofeither signed char or unsigned char get printed as arrays of 1 byte sized integers. -
fsigned-char or -funsigned-char gcc options have no effect as gdb defines literal stringtype "char" as char without a sign. For program code
char var0[] = "A";
signed char var1[] = "A";
You get during debugging
Chapter 10: Examining Data 101
(gdb) print var0
$1 = "A"
(gdb) print var1
$2 = {65 ’A’, 0 ’\0’}
10.4 Artificial Arrays
It is often useful to print out several successive objects of the same type in memory; asection of an array, or an array of dynamically determined size for which only a pointerexists in the program.
You can do this by referring to a contiguous span of memory as an artificial array, usingthe binary operator ‘@’. The left operand of ‘@’ should be the first element of the desiredarray and be an individual object. The right operand should be the desired length of thearray. The result is an array value whose elements are all of the type of the left argument.The first element is actually the left argument; the second element comes from bytes ofmemory immediately following those that hold the first element, and so on. Here is anexample. If a program says
int *array = (int *) malloc (len * sizeof (int));
you can print the contents of array with
p *array@len
The left operand of ‘@’ must reside in memory. Array values made with ‘@’ in this waybehave just like other arrays in terms of subscripting, and are coerced to pointers whenused in expressions. Artificial arrays most often appear in expressions via the value history(see Section 10.10 [Value History], page 116), after printing one out.
Another way to create an artificial array is to use a cast. This re-interprets a value as ifit were an array. The value need not be in memory:
(gdb) p/x (short[2])0x12345678
$1 = {0x1234, 0x5678}
As a convenience, if you leave the array length out (as in ‘(type[])value ’) gdb calcu-lates the size to fill the value (as ‘sizeof(value)/sizeof(type)’:
(gdb) p/x (short[])0x12345678
$2 = {0x1234, 0x5678}
Sometimes the artificial array mechanism is not quite enough; in moderately complexdata structures, the elements of interest may not actually be adjacent—for example, if youare interested in the values of pointers in an array. One useful work-around in this situationis to use a convenience variable (see Section 10.11 [Convenience Variables], page 117) asa counter in an expression that prints the first interesting value, and then repeat thatexpression via RET. For instance, suppose you have an array dtab of pointers to structures,and you are interested in the values of a field fv in each structure. Here is an example ofwhat you might type:
set $i = 0
p dtab[$i++]->fv
RET
RET
...
102 Debugging with gdb
10.5 Output Formats
By default, gdb prints a value according to its data type. Sometimes this is not what youwant. For example, you might want to print a number in hex, or a pointer in decimal. Oryou might want to view data in memory at a certain address as a character string or as aninstruction. To do these things, specify an output format when you print a value.
The simplest use of output formats is to say how to print a value already computed.This is done by starting the arguments of the print command with a slash and a formatletter. The format letters supported are:
x Regard the bits of the value as an integer, and print the integer in hexadecimal.
d Print as integer in signed decimal.
u Print as integer in unsigned decimal.
o Print as integer in octal.
t Print as integer in binary. The letter ‘t’ stands for “two”.1
a Print as an address, both absolute in hexadecimal and as an offset from thenearest preceding symbol. You can use this format used to discover where (inwhat function) an unknown address is located:
(gdb) p/a 0x54320
$3 = 0x54320 <_initialize_vx+396>
The command info symbol 0x54320 yields similar results. See Chapter 16[Symbols], page 189.
c Regard as an integer and print it as a character constant. This prints both thenumerical value and its character representation. The character representationis replaced with the octal escape ‘\nnn’ for characters outside the 7-bit asciirange.
Without this format, gdb displays char, unsigned char, and signed char
data as character constants. Single-byte members of vectors are displayed asinteger data.
f Regard the bits of the value as a floating point number and print using typicalfloating point syntax.
s Regard as a string, if possible. With this format, pointers to single-byte data aredisplayed as null-terminated strings and arrays of single-byte data are displayedas fixed-length strings. Other values are displayed in their natural types.
Without this format, gdb displays pointers to and arrays of char,unsigned char, and signed char as strings. Single-byte members of a vectorare displayed as an integer array.
r Print using the ‘raw’ formatting. By default, gdb will use a Python-basedpretty-printer, if one is available (see Section 10.9 [Pretty Printing], page 114).This typically results in a higher-level display of the value’s contents. The ‘r’format bypasses any Python pretty-printer which might exist.
1 ‘b’ cannot be used because these format letters are also used with the x command, where ‘b’ stands for“byte”; see Section 10.6 [Examining Memory], page 103.
Chapter 10: Examining Data 103
For example, to print the program counter in hex (see Section 10.12 [Registers],page 119), type
p/x $pc
Note that no space is required before the slash; this is because command names in gdbcannot contain a slash.
To reprint the last value in the value history with a different format, you can use theprint command with just a format and no expression. For example, ‘p/x’ reprints the lastvalue in hex.
10.6 Examining Memory
You can use the command x (for “examine”) to examine memory in any of several formats,independently of your program’s data types.
x/nfu addr
x addr
x Use the x command to examine memory.
n, f, and u are all optional parameters that specify how much memory to display and howto format it; addr is an expression giving the address where you want to start displayingmemory. If you use defaults for nfu, you need not type the slash ‘/’. Several commands setconvenient defaults for addr.
n, the repeat countThe repeat count is a decimal integer; the default is 1. It specifies how muchmemory (counting by units u) to display.
f, the display formatThe display format is one of the formats used by print (‘x’, ‘d’, ‘u’, ‘o’, ‘t’,‘a’, ‘c’, ‘f’, ‘s’), and in addition ‘i’ (for machine instructions). The default is‘x’ (hexadecimal) initially. The default changes each time you use either x orprint.
u, the unit sizeThe unit size is any of
b Bytes.
h Halfwords (two bytes).
w Words (four bytes). This is the initial default.
g Giant words (eight bytes).
Each time you specify a unit size with x, that size becomes the default unitthe next time you use x. For the ‘i’ format, the unit size is ignored and isnormally not written. For the ‘s’ format, the unit size defaults to ‘b’, unless itis explicitly given. Use x /hs to display 16-bit char strings and x /ws to display32-bit strings. The next use of x /s will again display 8-bit strings. Note thatthe results depend on the programming language of the current compilationunit. If the language is C, the ‘s’ modifier will use the UTF-16 encoding while‘w’ will use UTF-32. The encoding is set by the programming language andcannot be altered.
104 Debugging with gdb
addr, starting display addressaddr is the address where you want gdb to begin displaying memory. The ex-pression need not have a pointer value (though it may); it is always interpretedas an integer address of a byte of memory. See Section 10.1 [Expressions],page 97, for more information on expressions. The default for addr is usu-ally just after the last address examined—but several other commands also setthe default address: info breakpoints (to the address of the last breakpointlisted), info line (to the starting address of a line), and print (if you use itto display a value from memory).
For example, ‘x/3uh 0x54320’ is a request to display three halfwords (h) of memory,formatted as unsigned decimal integers (‘u’), starting at address 0x54320. ‘x/4xw $sp’prints the four words (‘w’) of memory above the stack pointer (here, ‘$sp’; see Section 10.12[Registers], page 119) in hexadecimal (‘x’).
Since the letters indicating unit sizes are all distinct from the letters specifying outputformats, you do not have to remember whether unit size or format comes first; either orderworks. The output specifications ‘4xw’ and ‘4wx’ mean exactly the same thing. (However,the count n must come first; ‘wx4’ does not work.)
Even though the unit size u is ignored for the formats ‘s’ and ‘i’, you might still want touse a count n; for example, ‘3i’ specifies that you want to see three machine instructions,including any operands. For convenience, especially when used with the display command,the ‘i’ format also prints branch delay slot instructions, if any, beyond the count specified,which immediately follow the last instruction that is within the count. The commanddisassemble gives an alternative way of inspecting machine instructions; see Section 9.6[Source and Machine Code], page 93.
All the defaults for the arguments to x are designed to make it easy to continue scanningmemory with minimal specifications each time you use x. For example, after you haveinspected three machine instructions with ‘x/3i addr ’, you can inspect the next seven withjust ‘x/7’. If you use RET to repeat the x command, the repeat count n is used again; theother arguments default as for successive uses of x.
When examining machine instructions, the instruction at current program counter isshown with a => marker. For example:
(gdb) x/5i $pc-6
0x804837f <main+11>: mov %esp,%ebp
0x8048381 <main+13>: push %ecx
0x8048382 <main+14>: sub $0x4,%esp
=> 0x8048385 <main+17>: movl $0x8048460,(%esp)
0x804838c <main+24>: call 0x80482d4 <puts@plt>
The addresses and contents printed by the x command are not saved in the value historybecause there is often too much of them and they would get in the way. Instead, gdbmakes these values available for subsequent use in expressions as values of the conveniencevariables $_ and $__. After an x command, the last address examined is available for usein expressions in the convenience variable $_. The contents of that address, as examined,are available in the convenience variable $__.
If the x command has a repeat count, the address and contents saved are from the lastmemory unit printed; this is not the same as the last address printed if several units wereprinted on the last line of output.
Chapter 10: Examining Data 105
When you are debugging a program running on a remote target machine (see Chapter 20[Remote Debugging], page 219), you may wish to verify the program’s image in the remotemachine’s memory against the executable file you downloaded to the target. The compare-sections command is provided for such situations.
compare-sections [section-name ]Compare the data of a loadable section section-name in the executable fileof the program being debugged with the same section in the remote machine’smemory, and report any mismatches. With no arguments, compares all loadablesections. This command’s availability depends on the target’s support for the"qCRC" remote request.
10.7 Automatic Display
If you find that you want to print the value of an expression frequently (to see how itchanges), you might want to add it to the automatic display list so that gdb prints itsvalue each time your program stops. Each expression added to the list is given a number toidentify it; to remove an expression from the list, you specify that number. The automaticdisplay looks like this:
2: foo = 38
3: bar[5] = (struct hack *) 0x3804
This display shows item numbers, expressions and their current values. As with displaysyou request manually using x or print, you can specify the output format you prefer; infact, display decides whether to use print or x depending your format specification—ituses x if you specify either the ‘i’ or ‘s’ format, or a unit size; otherwise it uses print.
display expr
Add the expression expr to the list of expressions to display each time yourprogram stops. See Section 10.1 [Expressions], page 97.
display does not repeat if you press RET again after using it.
display/fmt expr
For fmt specifying only a display format and not a size or count, add theexpression expr to the auto-display list but arrange to display it each time inthe specified format fmt. See Section 10.5 [Output Formats], page 102.
display/fmt addr
For fmt ‘i’ or ‘s’, or including a unit-size or a number of units, add the expres-sion addr as a memory address to be examined each time your program stops.Examining means in effect doing ‘x/fmt addr ’. See Section 10.6 [ExaminingMemory], page 103.
For example, ‘display/i $pc’ can be helpful, to see the machine instruction about tobe executed each time execution stops (‘$pc’ is a common name for the program counter;see Section 10.12 [Registers], page 119).
undisplay dnums...
delete display dnums...
Remove items from the list of expressions to display. Specify the numbers ofthe displays that you want affected with the command argument dnums. It can
106 Debugging with gdb
be a single display number, one of the numbers shown in the first field of the‘info display’ display; or it could be a range of display numbers, as in 2-4.
undisplay does not repeat if you press RET after using it. (Otherwise youwould just get the error ‘No display number ...’.)
disable display dnums...
Disable the display of item numbers dnums. A disabled display item is notprinted automatically, but is not forgotten. It may be enabled again later.Specify the numbers of the displays that you want affected with the commandargument dnums. It can be a single display number, one of the numbers shownin the first field of the ‘info display’ display; or it could be a range of displaynumbers, as in 2-4.
enable display dnums...
Enable display of item numbers dnums. It becomes effective once again in autodisplay of its expression, until you specify otherwise. Specify the numbers ofthe displays that you want affected with the command argument dnums. It canbe a single display number, one of the numbers shown in the first field of the‘info display’ display; or it could be a range of display numbers, as in 2-4.
display Display the current values of the expressions on the list, just as is done whenyour program stops.
info display
Print the list of expressions previously set up to display automatically, eachone with its item number, but without showing the values. This includes dis-abled expressions, which are marked as such. It also includes expressions whichwould not be displayed right now because they refer to automatic variables notcurrently available.
If a display expression refers to local variables, then it does not make sense outside thelexical context for which it was set up. Such an expression is disabled when execution entersa context where one of its variables is not defined. For example, if you give the commanddisplay last_char while inside a function with an argument last_char, gdb displaysthis argument while your program continues to stop inside that function. When it stopselsewhere—where there is no variable last_char—the display is disabled automatically.The next time your program stops where last_char is meaningful, you can enable thedisplay expression once again.
10.8 Print Settings
gdb provides the following ways to control how arrays, structures, and symbols are printed.
These settings are useful for debugging programs in any language:
set print address
set print address on
gdb prints memory addresses showing the location of stack traces, structurevalues, pointer values, breakpoints, and so forth, even when it also displays thecontents of those addresses. The default is on. For example, this is what astack frame display looks like with set print address on:
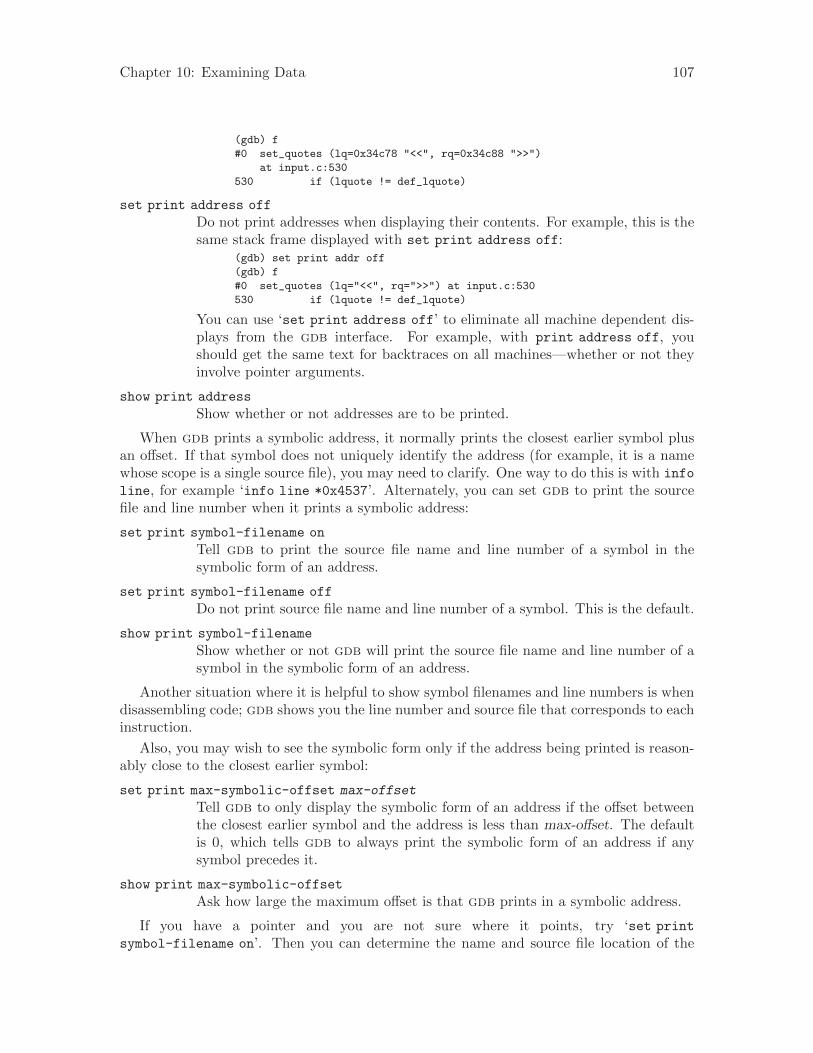
Chapter 10: Examining Data 107
(gdb) f
#0 set_quotes (lq=0x34c78 "<<", rq=0x34c88 ">>")
at input.c:530
530 if (lquote != def_lquote)
set print address off
Do not print addresses when displaying their contents. For example, this is thesame stack frame displayed with set print address off:
(gdb) set print addr off
(gdb) f
#0 set_quotes (lq="<<", rq=">>") at input.c:530
530 if (lquote != def_lquote)
You can use ‘set print address off’ to eliminate all machine dependent dis-plays from the gdb interface. For example, with print address off, youshould get the same text for backtraces on all machines—whether or not theyinvolve pointer arguments.
show print address
Show whether or not addresses are to be printed.
When gdb prints a symbolic address, it normally prints the closest earlier symbol plusan offset. If that symbol does not uniquely identify the address (for example, it is a namewhose scope is a single source file), you may need to clarify. One way to do this is with info
line, for example ‘info line *0x4537’. Alternately, you can set gdb to print the sourcefile and line number when it prints a symbolic address:
set print symbol-filename on
Tell gdb to print the source file name and line number of a symbol in thesymbolic form of an address.
set print symbol-filename off
Do not print source file name and line number of a symbol. This is the default.
show print symbol-filename
Show whether or not gdb will print the source file name and line number of asymbol in the symbolic form of an address.
Another situation where it is helpful to show symbol filenames and line numbers is whendisassembling code; gdb shows you the line number and source file that corresponds to eachinstruction.
Also, you may wish to see the symbolic form only if the address being printed is reason-ably close to the closest earlier symbol:
set print max-symbolic-offset max-offset
Tell gdb to only display the symbolic form of an address if the offset betweenthe closest earlier symbol and the address is less than max-offset. The defaultis 0, which tells gdb to always print the symbolic form of an address if anysymbol precedes it.
show print max-symbolic-offset
Ask how large the maximum offset is that gdb prints in a symbolic address.
If you have a pointer and you are not sure where it points, try ‘set print
symbol-filename on’. Then you can determine the name and source file location of the
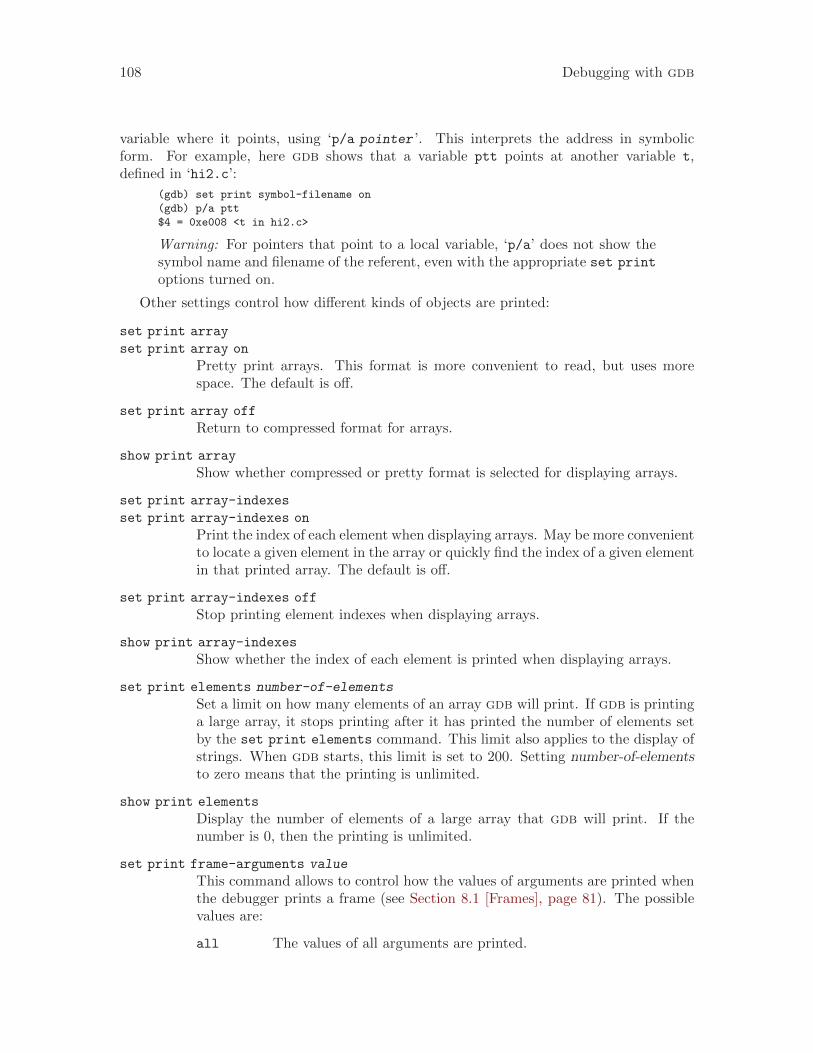
108 Debugging with gdb
variable where it points, using ‘p/a pointer ’. This interprets the address in symbolicform. For example, here gdb shows that a variable ptt points at another variable t,defined in ‘hi2.c’:
(gdb) set print symbol-filename on
(gdb) p/a ptt
$4 = 0xe008 <t in hi2.c>
Warning: For pointers that point to a local variable, ‘p/a’ does not show thesymbol name and filename of the referent, even with the appropriate set print
options turned on.
Other settings control how different kinds of objects are printed:
set print array
set print array on
Pretty print arrays. This format is more convenient to read, but uses morespace. The default is off.
set print array off
Return to compressed format for arrays.
show print array
Show whether compressed or pretty format is selected for displaying arrays.
set print array-indexes
set print array-indexes on
Print the index of each element when displaying arrays. May be more convenientto locate a given element in the array or quickly find the index of a given elementin that printed array. The default is off.
set print array-indexes off
Stop printing element indexes when displaying arrays.
show print array-indexes
Show whether the index of each element is printed when displaying arrays.
set print elements number-of-elements
Set a limit on how many elements of an array gdb will print. If gdb is printinga large array, it stops printing after it has printed the number of elements setby the set print elements command. This limit also applies to the display ofstrings. When gdb starts, this limit is set to 200. Setting number-of-elementsto zero means that the printing is unlimited.
show print elements
Display the number of elements of a large array that gdb will print. If thenumber is 0, then the printing is unlimited.
set print frame-arguments value
This command allows to control how the values of arguments are printed whenthe debugger prints a frame (see Section 8.1 [Frames], page 81). The possiblevalues are:
all The values of all arguments are printed.
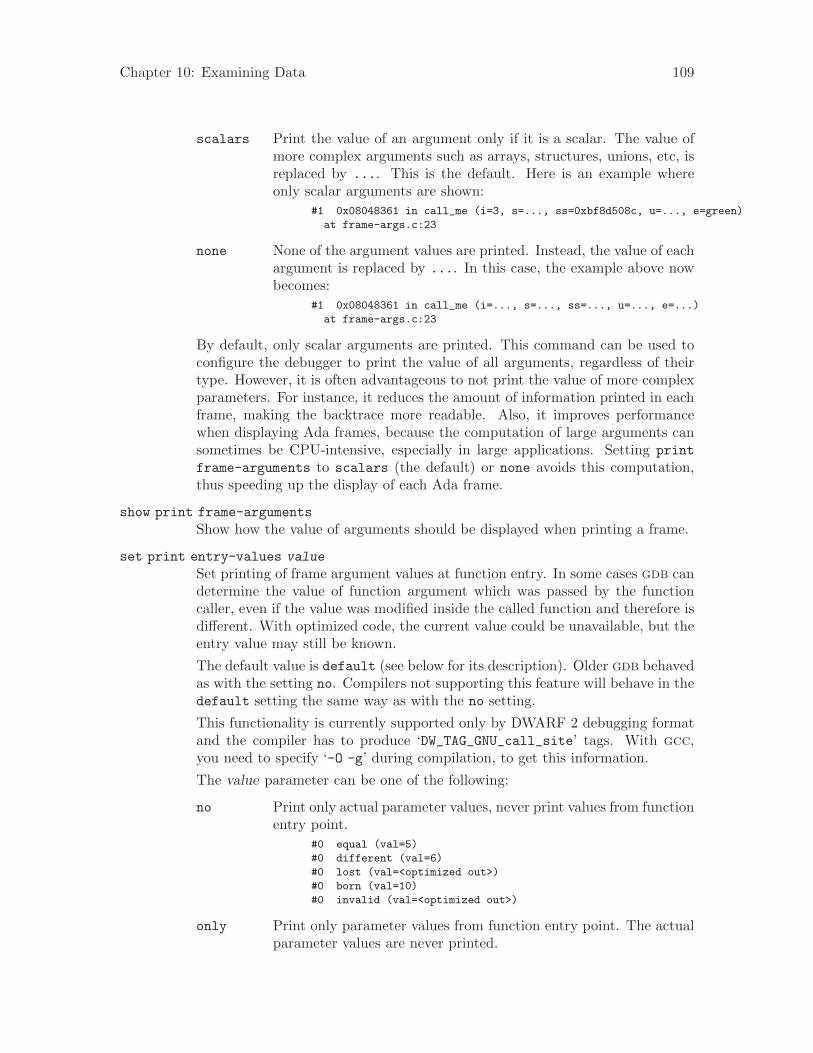
Chapter 10: Examining Data 109
scalars Print the value of an argument only if it is a scalar. The value ofmore complex arguments such as arrays, structures, unions, etc, isreplaced by .... This is the default. Here is an example whereonly scalar arguments are shown:
#1 0x08048361 in call_me (i=3, s=..., ss=0xbf8d508c, u=..., e=green)
at frame-args.c:23
none None of the argument values are printed. Instead, the value of eachargument is replaced by .... In this case, the example above nowbecomes:
#1 0x08048361 in call_me (i=..., s=..., ss=..., u=..., e=...)
at frame-args.c:23
By default, only scalar arguments are printed. This command can be used toconfigure the debugger to print the value of all arguments, regardless of theirtype. However, it is often advantageous to not print the value of more complexparameters. For instance, it reduces the amount of information printed in eachframe, making the backtrace more readable. Also, it improves performancewhen displaying Ada frames, because the computation of large arguments cansometimes be CPU-intensive, especially in large applications. Setting print
frame-arguments to scalars (the default) or none avoids this computation,thus speeding up the display of each Ada frame.
show print frame-arguments
Show how the value of arguments should be displayed when printing a frame.
set print entry-values value
Set printing of frame argument values at function entry. In some cases gdb candetermine the value of function argument which was passed by the functioncaller, even if the value was modified inside the called function and therefore isdifferent. With optimized code, the current value could be unavailable, but theentry value may still be known.
The default value is default (see below for its description). Older gdb behavedas with the setting no. Compilers not supporting this feature will behave in thedefault setting the same way as with the no setting.
This functionality is currently supported only by DWARF 2 debugging formatand the compiler has to produce ‘DW_TAG_GNU_call_site’ tags. With gcc,you need to specify ‘-O -g’ during compilation, to get this information.
The value parameter can be one of the following:
no Print only actual parameter values, never print values from functionentry point.
#0 equal (val=5)
#0 different (val=6)
#0 lost (val=<optimized out>)
#0 born (val=10)
#0 invalid (val=<optimized out>)
only Print only parameter values from function entry point. The actualparameter values are never printed.
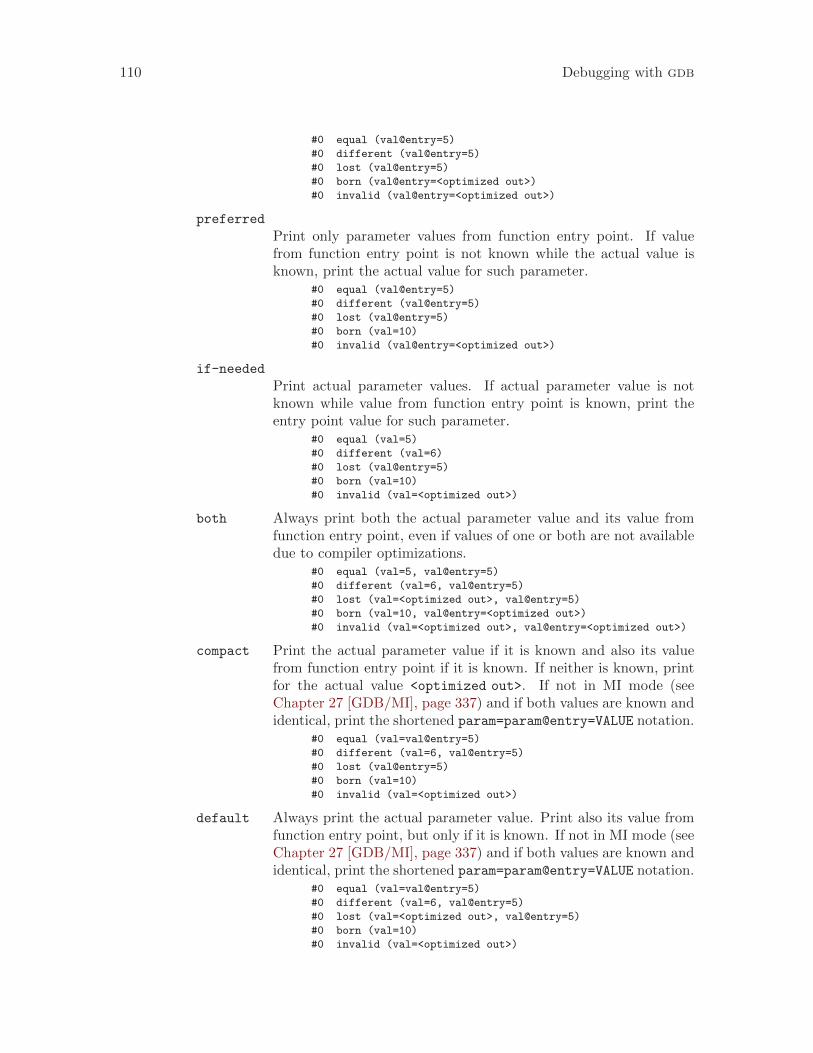
110 Debugging with gdb
#0 equal (val@entry=5)
#0 different (val@entry=5)
#0 lost (val@entry=5)
#0 born (val@entry=<optimized out>)
#0 invalid (val@entry=<optimized out>)
preferred
Print only parameter values from function entry point. If valuefrom function entry point is not known while the actual value isknown, print the actual value for such parameter.
#0 equal (val@entry=5)
#0 different (val@entry=5)
#0 lost (val@entry=5)
#0 born (val=10)
#0 invalid (val@entry=<optimized out>)
if-needed
Print actual parameter values. If actual parameter value is notknown while value from function entry point is known, print theentry point value for such parameter.
#0 equal (val=5)
#0 different (val=6)
#0 lost (val@entry=5)
#0 born (val=10)
#0 invalid (val=<optimized out>)
both Always print both the actual parameter value and its value fromfunction entry point, even if values of one or both are not availabledue to compiler optimizations.
#0 equal (val=5, val@entry=5)
#0 different (val=6, val@entry=5)
#0 lost (val=<optimized out>, val@entry=5)
#0 born (val=10, val@entry=<optimized out>)
#0 invalid (val=<optimized out>, val@entry=<optimized out>)
compact Print the actual parameter value if it is known and also its valuefrom function entry point if it is known. If neither is known, printfor the actual value <optimized out>. If not in MI mode (seeChapter 27 [GDB/MI], page 337) and if both values are known andidentical, print the shortened param=param@entry=VALUE notation.
#0 equal (val=val@entry=5)
#0 different (val=6, val@entry=5)
#0 lost (val@entry=5)
#0 born (val=10)
#0 invalid (val=<optimized out>)
default Always print the actual parameter value. Print also its value fromfunction entry point, but only if it is known. If not in MI mode (seeChapter 27 [GDB/MI], page 337) and if both values are known andidentical, print the shortened param=param@entry=VALUE notation.
#0 equal (val=val@entry=5)
#0 different (val=6, val@entry=5)
#0 lost (val=<optimized out>, val@entry=5)
#0 born (val=10)
#0 invalid (val=<optimized out>)
Chapter 10: Examining Data 111
For analysis messages on possible failures of frame argument values at functionentry resolution see [set debug entry-values], page 132.
show print entry-values
Show the method being used for printing of frame argument values at functionentry.
set print repeats
Set the threshold for suppressing display of repeated array elements. Whenthe number of consecutive identical elements of an array exceeds the threshold,gdb prints the string "<repeats n times>", where n is the number of identicalrepetitions, instead of displaying the identical elements themselves. Setting thethreshold to zero will cause all elements to be individually printed. The defaultthreshold is 10.
show print repeats
Display the current threshold for printing repeated identical elements.
set print null-stop
Cause gdb to stop printing the characters of an array when the first nullis encountered. This is useful when large arrays actually contain only shortstrings. The default is off.
show print null-stop
Show whether gdb stops printing an array on the first null character.
set print pretty on
Cause gdb to print structures in an indented format with one member per line,like this:
$1 = {
next = 0x0,
flags = {
sweet = 1,
sour = 1
},
meat = 0x54 "Pork"
}
set print pretty off
Cause gdb to print structures in a compact format, like this:
$1 = {next = 0x0, flags = {sweet = 1, sour = 1}, \
meat = 0x54 "Pork"}
This is the default format.
show print pretty
Show which format gdb is using to print structures.
set print sevenbit-strings on
Print using only seven-bit characters; if this option is set, gdb displays anyeight-bit characters (in strings or character values) using the notation \nnn.This setting is best if you are working in English (ascii) and you use the high-order bit of characters as a marker or “meta” bit.
112 Debugging with gdb
set print sevenbit-strings off
Print full eight-bit characters. This allows the use of more international char-acter sets, and is the default.
show print sevenbit-strings
Show whether or not gdb is printing only seven-bit characters.
set print union on
Tell gdb to print unions which are contained in structures and other unions.This is the default setting.
set print union off
Tell gdb not to print unions which are contained in structures and other unions.gdb will print "{...}" instead.
show print union
Ask gdb whether or not it will print unions which are contained in structuresand other unions.
For example, given the declarationstypedef enum {Tree, Bug} Species;
typedef enum {Big_tree, Acorn, Seedling} Tree_forms;
typedef enum {Caterpillar, Cocoon, Butterfly}
Bug_forms;
struct thing {
Species it;
union {
Tree_forms tree;
Bug_forms bug;
} form;
};
struct thing foo = {Tree, {Acorn}};
with set print union on in effect ‘p foo’ would print$1 = {it = Tree, form = {tree = Acorn, bug = Cocoon}}
and with set print union off in effect it would print$1 = {it = Tree, form = {...}}
set print union affects programs written in C-like languages and in Pascal.
These settings are of interest when debugging C++ programs:
set print demangle
set print demangle on
Print C++ names in their source form rather than in the encoded (“mangled”)form passed to the assembler and linker for type-safe linkage. The default ison.
show print demangle
Show whether C++ names are printed in mangled or demangled form.
set print asm-demangle
set print asm-demangle on
Print C++ names in their source form rather than their mangled form, even inassembler code printouts such as instruction disassemblies. The default is off.
Chapter 10: Examining Data 113
show print asm-demangle
Show whether C++ names in assembly listings are printed in mangled or de-mangled form.
set demangle-style style
Choose among several encoding schemes used by different compilers to representC++ names. The choices for style are currently:
auto Allow gdb to choose a decoding style by inspecting your program.
gnu Decode based on the gnu C++ compiler (g++) encoding algorithm.This is the default.
hp Decode based on the HP ANSI C++ (aCC) encoding algorithm.
lucid Decode based on the Lucid C++ compiler (lcc) encoding algorithm.
arm Decode using the algorithm in the C++ Annotated Reference Man-ual. Warning: this setting alone is not sufficient to allow debuggingcfront-generated executables. gdb would require further enhance-ment to permit that.
If you omit style, you will see a list of possible formats.
show demangle-style
Display the encoding style currently in use for decoding C++ symbols.
set print object
set print object on
When displaying a pointer to an object, identify the actual (derived) type ofthe object rather than the declared type, using the virtual function table. Notethat the virtual function table is required—this feature can only work for objectsthat have run-time type identification; a single virtual method in the object’sdeclared type is sufficient.
set print object off
Display only the declared type of objects, without reference to the virtual func-tion table. This is the default setting.
show print object
Show whether actual, or declared, object types are displayed.
set print static-members
set print static-members on
Print static members when displaying a C++ object. The default is on.
set print static-members off
Do not print static members when displaying a C++ object.
show print static-members
Show whether C++ static members are printed or not.
set print pascal_static-members
set print pascal_static-members on
Print static members when displaying a Pascal object. The default is on.
114 Debugging with gdb
set print pascal_static-members off
Do not print static members when displaying a Pascal object.
show print pascal_static-members
Show whether Pascal static members are printed or not.
set print vtbl
set print vtbl on
Pretty print C++ virtual function tables. The default is off. (The vtbl com-mands do not work on programs compiled with the HP ANSI C++ compiler(aCC).)
set print vtbl off
Do not pretty print C++ virtual function tables.
show print vtbl
Show whether C++ virtual function tables are pretty printed, or not.
10.9 Pretty Printing
gdb provides a mechanism to allow pretty-printing of values using Python code. It greatlysimplifies the display of complex objects. This mechanism works for both MI and the CLI.
10.9.1 Pretty-Printer Introduction
When gdb prints a value, it first sees if there is a pretty-printer registered for the value.If there is then gdb invokes the pretty-printer to print the value. Otherwise the value isprinted normally.
Pretty-printers are normally named. This makes them easy to manage. The ‘infopretty-printer’ command will list all the installed pretty-printers with their names. If apretty-printer can handle multiple data types, then its subprinters are the printers for theindividual data types. Each such subprinter has its own name. The format of the name isprinter-name;subprinter-name.
Pretty-printers are installed by registering them with gdb. Typically they are auto-matically loaded and registered when the corresponding debug information is loaded, thusmaking them available without having to do anything special.
There are three places where a pretty-printer can be registered.
• Pretty-printers registered globally are available when debugging all inferiors.
• Pretty-printers registered with a program space are available only when debugging thatprogram. See Section 23.2.2.14 [Progspaces In Python], page 308, for more details onprogram spaces in Python.
• Pretty-printers registered with an objfile are loaded and unloaded with the correspond-ing objfile (e.g., shared library). See Section 23.2.2.15 [Objfiles In Python], page 309,for more details on objfiles in Python.
See Section 23.2.2.6 [Selecting Pretty-Printers], page 295, for further information on howpretty-printers are selected,
See Section 23.2.2.7 [Writing a Pretty-Printer], page 296, for implementing pretty print-ers for new types.
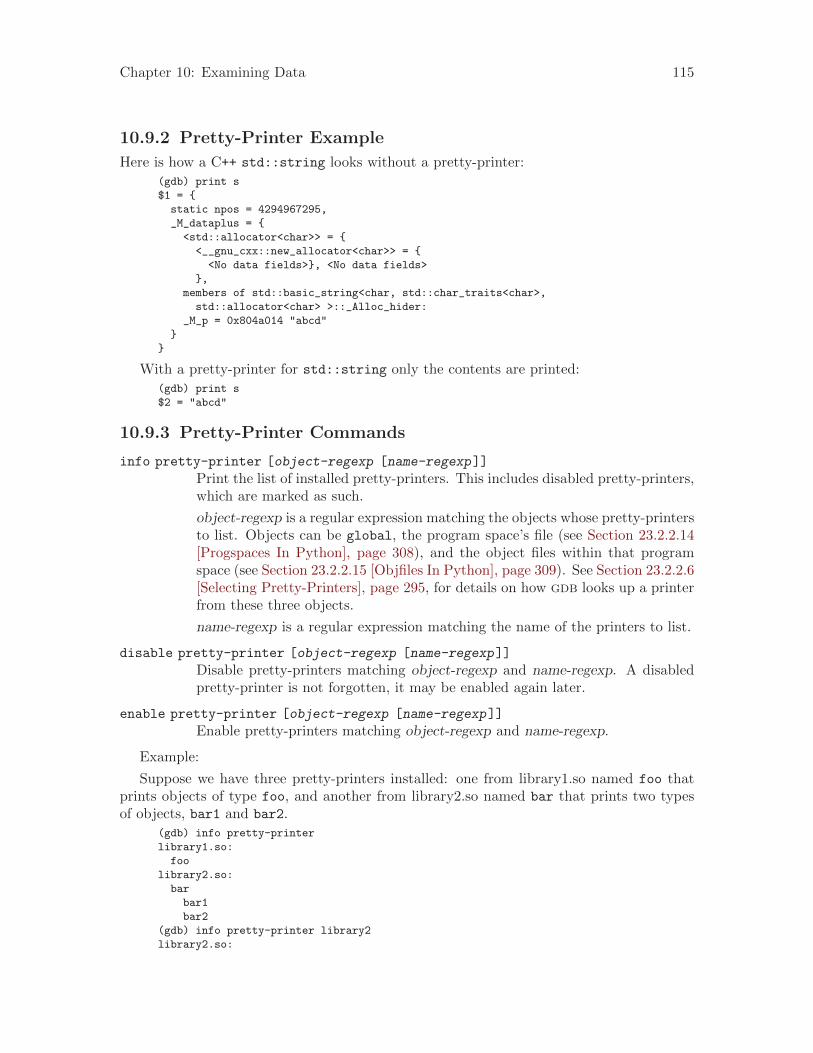
Chapter 10: Examining Data 115
10.9.2 Pretty-Printer Example
Here is how a C++ std::string looks without a pretty-printer:
(gdb) print s
$1 = {
static npos = 4294967295,
_M_dataplus = {
<std::allocator<char>> = {
<__gnu_cxx::new_allocator<char>> = {
<No data fields>}, <No data fields>
},
members of std::basic_string<char, std::char_traits<char>,
std::allocator<char> >::_Alloc_hider:
_M_p = 0x804a014 "abcd"
}
}
With a pretty-printer for std::string only the contents are printed:
(gdb) print s
$2 = "abcd"
10.9.3 Pretty-Printer Commands
info pretty-printer [object-regexp [name-regexp]]
Print the list of installed pretty-printers. This includes disabled pretty-printers,which are marked as such.
object-regexp is a regular expression matching the objects whose pretty-printersto list. Objects can be global, the program space’s file (see Section 23.2.2.14[Progspaces In Python], page 308), and the object files within that programspace (see Section 23.2.2.15 [Objfiles In Python], page 309). See Section 23.2.2.6[Selecting Pretty-Printers], page 295, for details on how gdb looks up a printerfrom these three objects.
name-regexp is a regular expression matching the name of the printers to list.
disable pretty-printer [object-regexp [name-regexp]]
Disable pretty-printers matching object-regexp and name-regexp. A disabledpretty-printer is not forgotten, it may be enabled again later.
enable pretty-printer [object-regexp [name-regexp]]
Enable pretty-printers matching object-regexp and name-regexp.
Example:
Suppose we have three pretty-printers installed: one from library1.so named foo thatprints objects of type foo, and another from library2.so named bar that prints two typesof objects, bar1 and bar2.
(gdb) info pretty-printer
library1.so:
foo
library2.so:
bar
bar1
bar2
(gdb) info pretty-printer library2
library2.so:
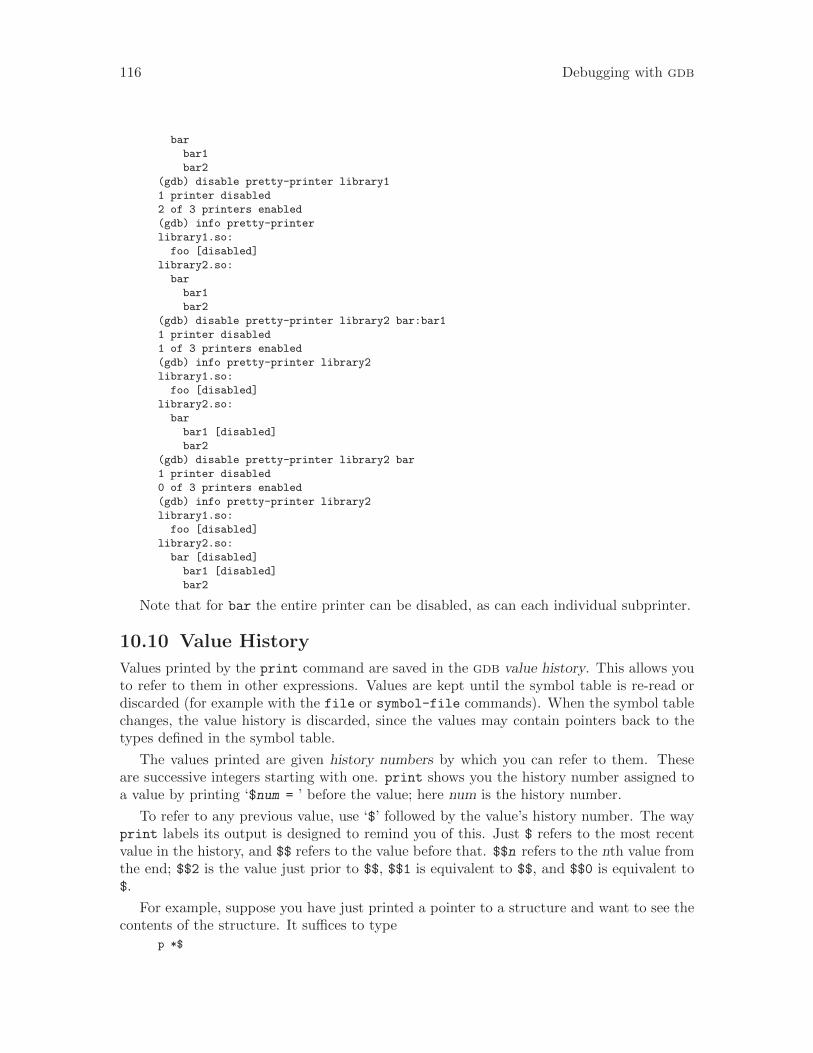
116 Debugging with gdb
bar
bar1
bar2
(gdb) disable pretty-printer library1
1 printer disabled
2 of 3 printers enabled
(gdb) info pretty-printer
library1.so:
foo [disabled]
library2.so:
bar
bar1
bar2
(gdb) disable pretty-printer library2 bar:bar1
1 printer disabled
1 of 3 printers enabled
(gdb) info pretty-printer library2
library1.so:
foo [disabled]
library2.so:
bar
bar1 [disabled]
bar2
(gdb) disable pretty-printer library2 bar
1 printer disabled
0 of 3 printers enabled
(gdb) info pretty-printer library2
library1.so:
foo [disabled]
library2.so:
bar [disabled]
bar1 [disabled]
bar2
Note that for bar the entire printer can be disabled, as can each individual subprinter.
10.10 Value History
Values printed by the print command are saved in the gdb value history. This allows youto refer to them in other expressions. Values are kept until the symbol table is re-read ordiscarded (for example with the file or symbol-file commands). When the symbol tablechanges, the value history is discarded, since the values may contain pointers back to thetypes defined in the symbol table.
The values printed are given history numbers by which you can refer to them. Theseare successive integers starting with one. print shows you the history number assigned toa value by printing ‘$num = ’ before the value; here num is the history number.
To refer to any previous value, use ‘$’ followed by the value’s history number. The wayprint labels its output is designed to remind you of this. Just $ refers to the most recentvalue in the history, and $$ refers to the value before that. $$n refers to the nth value fromthe end; $$2 is the value just prior to $$, $$1 is equivalent to $$, and $$0 is equivalent to$.
For example, suppose you have just printed a pointer to a structure and want to see thecontents of the structure. It suffices to type
p *$
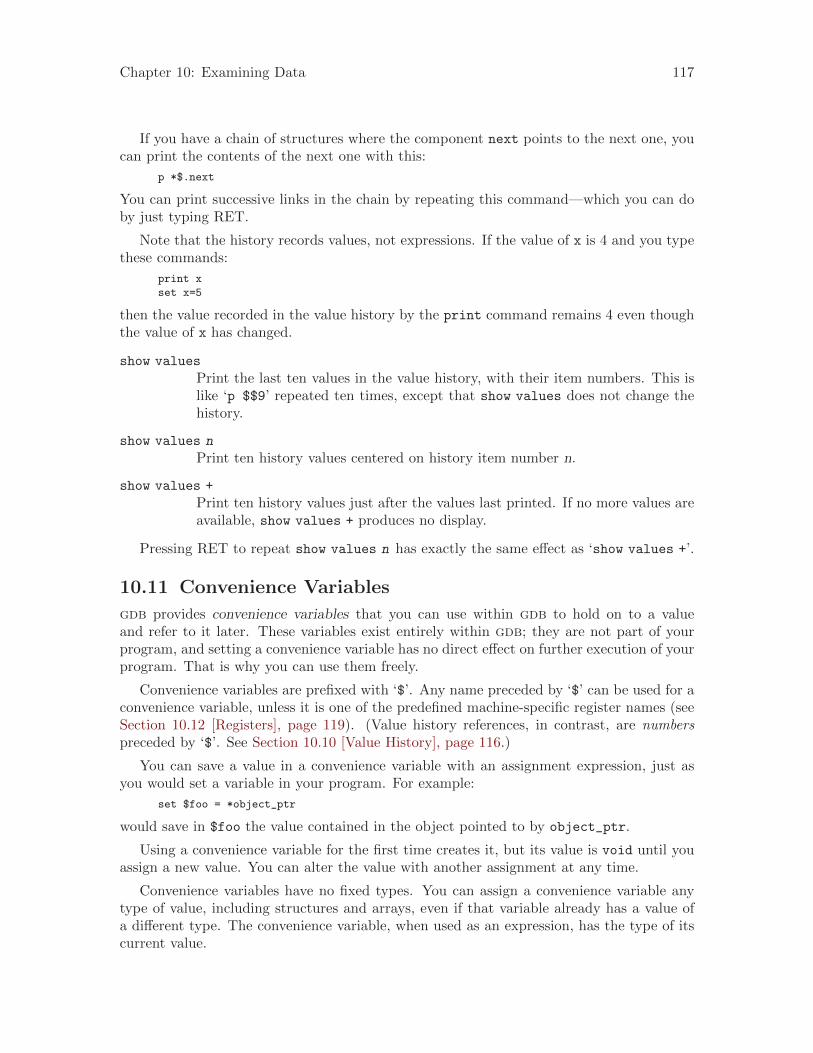
Chapter 10: Examining Data 117
If you have a chain of structures where the component next points to the next one, youcan print the contents of the next one with this:
p *$.next
You can print successive links in the chain by repeating this command—which you can doby just typing RET.
Note that the history records values, not expressions. If the value of x is 4 and you typethese commands:
print x
set x=5
then the value recorded in the value history by the print command remains 4 even thoughthe value of x has changed.
show values
Print the last ten values in the value history, with their item numbers. This islike ‘p $$9’ repeated ten times, except that show values does not change thehistory.
show values n
Print ten history values centered on history item number n.
show values +
Print ten history values just after the values last printed. If no more values areavailable, show values + produces no display.
Pressing RET to repeat show values n has exactly the same effect as ‘show values +’.
10.11 Convenience Variables
gdb provides convenience variables that you can use within gdb to hold on to a valueand refer to it later. These variables exist entirely within gdb; they are not part of yourprogram, and setting a convenience variable has no direct effect on further execution of yourprogram. That is why you can use them freely.
Convenience variables are prefixed with ‘$’. Any name preceded by ‘$’ can be used for aconvenience variable, unless it is one of the predefined machine-specific register names (seeSection 10.12 [Registers], page 119). (Value history references, in contrast, are numberspreceded by ‘$’. See Section 10.10 [Value History], page 116.)
You can save a value in a convenience variable with an assignment expression, just asyou would set a variable in your program. For example:
set $foo = *object_ptr
would save in $foo the value contained in the object pointed to by object_ptr.
Using a convenience variable for the first time creates it, but its value is void until youassign a new value. You can alter the value with another assignment at any time.
Convenience variables have no fixed types. You can assign a convenience variable anytype of value, including structures and arrays, even if that variable already has a value ofa different type. The convenience variable, when used as an expression, has the type of itscurrent value.
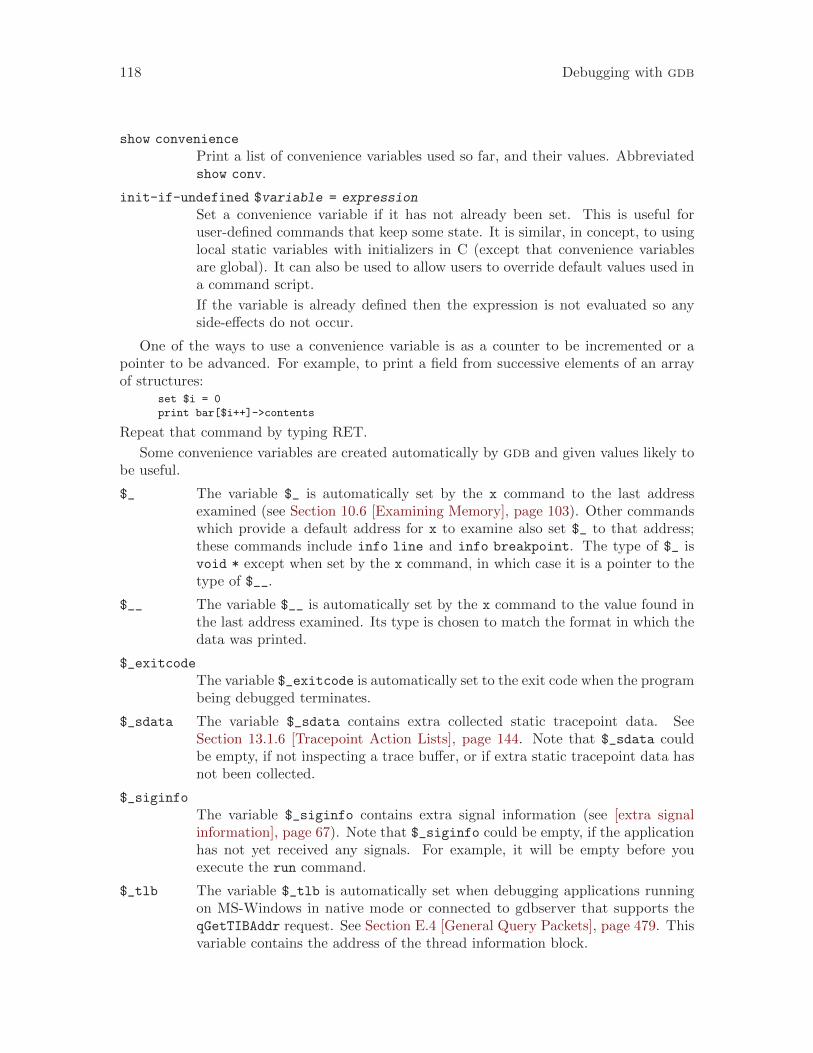
118 Debugging with gdb
show convenience
Print a list of convenience variables used so far, and their values. Abbreviatedshow conv.
init-if-undefined $variable = expression
Set a convenience variable if it has not already been set. This is useful foruser-defined commands that keep some state. It is similar, in concept, to usinglocal static variables with initializers in C (except that convenience variablesare global). It can also be used to allow users to override default values used ina command script.
If the variable is already defined then the expression is not evaluated so anyside-effects do not occur.
One of the ways to use a convenience variable is as a counter to be incremented or apointer to be advanced. For example, to print a field from successive elements of an arrayof structures:
set $i = 0
print bar[$i++]->contents
Repeat that command by typing RET.
Some convenience variables are created automatically by gdb and given values likely tobe useful.
$_ The variable $_ is automatically set by the x command to the last addressexamined (see Section 10.6 [Examining Memory], page 103). Other commandswhich provide a default address for x to examine also set $_ to that address;these commands include info line and info breakpoint. The type of $_ isvoid * except when set by the x command, in which case it is a pointer to thetype of $__.
$__ The variable $__ is automatically set by the x command to the value found inthe last address examined. Its type is chosen to match the format in which thedata was printed.
$_exitcode
The variable $_exitcode is automatically set to the exit code when the programbeing debugged terminates.
$_sdata The variable $_sdata contains extra collected static tracepoint data. SeeSection 13.1.6 [Tracepoint Action Lists], page 144. Note that $_sdata couldbe empty, if not inspecting a trace buffer, or if extra static tracepoint data hasnot been collected.
$_siginfo
The variable $_siginfo contains extra signal information (see [extra signalinformation], page 67). Note that $_siginfo could be empty, if the applicationhas not yet received any signals. For example, it will be empty before youexecute the run command.
$_tlb The variable $_tlb is automatically set when debugging applications runningon MS-Windows in native mode or connected to gdbserver that supports theqGetTIBAddr request. See Section E.4 [General Query Packets], page 479. Thisvariable contains the address of the thread information block.
Chapter 10: Examining Data 119
On HP-UX systems, if you refer to a function or variable name that begins with a dollarsign, gdb searches for a user or system name first, before it searches for a conveniencevariable.
gdb also supplies some convenience functions. These have a syntax similar to conve-nience variables. A convenience function can be used in an expression just like an ordinaryfunction; however, a convenience function is implemented internally to gdb.
help function
Print a list of all convenience functions.
10.12 Registers
You can refer to machine register contents, in expressions, as variables with names startingwith ‘$’. The names of registers are different for each machine; use info registers to seethe names used on your machine.
info registers
Print the names and values of all registers except floating-point and vectorregisters (in the selected stack frame).
info all-registers
Print the names and values of all registers, including floating-point and vectorregisters (in the selected stack frame).
info registers regname ...
Print the relativized value of each specified register regname. As discussed indetail below, register values are normally relative to the selected stack frame.regname may be any register name valid on the machine you are using, with orwithout the initial ‘$’.
gdb has four “standard” register names that are available (in expressions) on mostmachines—whenever they do not conflict with an architecture’s canonical mnemonics forregisters. The register names $pc and $sp are used for the program counter register andthe stack pointer. $fp is used for a register that contains a pointer to the current stackframe, and $ps is used for a register that contains the processor status. For example, youcould print the program counter in hex with
p/x $pc
or print the instruction to be executed next with
x/i $pc
or add four to the stack pointer2 with
set $sp += 4
Whenever possible, these four standard register names are available on your machineeven though the machine has different canonical mnemonics, so long as there is no conflict.The info registers command shows the canonical names. For example, on the SPARC,
2 This is a way of removing one word from the stack, on machines where stacks grow downward in memory(most machines, nowadays). This assumes that the innermost stack frame is selected; setting $sp is notallowed when other stack frames are selected. To pop entire frames off the stack, regardless of machinearchitecture, use return; see Section 17.4 [Returning from a Function], page 197.
120 Debugging with gdb
info registers displays the processor status register as $psr but you can also refer to itas $ps; and on x86-based machines $ps is an alias for the eflags register.
gdb always considers the contents of an ordinary register as an integer when the registeris examined in this way. Some machines have special registers which can hold nothing butfloating point; these registers are considered to have floating point values. There is no wayto refer to the contents of an ordinary register as floating point value (although you canprint it as a floating point value with ‘print/f $regname ’).
Some registers have distinct “raw” and “virtual” data formats. This means that the dataformat in which the register contents are saved by the operating system is not the sameone that your program normally sees. For example, the registers of the 68881 floating pointcoprocessor are always saved in “extended” (raw) format, but all C programs expect to workwith “double” (virtual) format. In such cases, gdb normally works with the virtual formatonly (the format that makes sense for your program), but the info registers commandprints the data in both formats.
Some machines have special registers whose contents can be interpreted in several differ-ent ways. For example, modern x86-based machines have SSE and MMX registers that canhold several values packed together in several different formats. gdb refers to such registersin struct notation:
(gdb) print $xmm1
$1 = {
v4_float = {0, 3.43859137e-038, 1.54142831e-044, 1.821688e-044},
v2_double = {9.92129282474342e-303, 2.7585945287983262e-313},
v16_int8 = "\000\000\000\000\3706;\001\v\000\000\000\r\000\000",
v8_int16 = {0, 0, 14072, 315, 11, 0, 13, 0},
v4_int32 = {0, 20657912, 11, 13},
v2_int64 = {88725056443645952, 55834574859},
uint128 = 0x0000000d0000000b013b36f800000000
}
To set values of such registers, you need to tell gdb which view of the register you wish tochange, as if you were assigning value to a struct member:
(gdb) set $xmm1.uint128 = 0x000000000000000000000000FFFFFFFF
Normally, register values are relative to the selected stack frame (see Section 8.3 [Select-ing a Frame], page 84). This means that you get the value that the register would containif all stack frames farther in were exited and their saved registers restored. In order to seethe true contents of hardware registers, you must select the innermost frame (with ‘frame0’).
However, gdb must deduce where registers are saved, from the machine code generatedby your compiler. If some registers are not saved, or if gdb is unable to locate the savedregisters, the selected stack frame makes no difference.
10.13 Floating Point Hardware
Depending on the configuration, gdb may be able to give you more information about thestatus of the floating point hardware.
info float
Display hardware-dependent information about the floating point unit. Theexact contents and layout vary depending on the floating point chip. Currently,‘info float’ is supported on the ARM and x86 machines.
Chapter 10: Examining Data 121
10.14 Vector Unit
Depending on the configuration, gdb may be able to give you more information about thestatus of the vector unit.
info vector
Display information about the vector unit. The exact contents and layout varydepending on the hardware.
10.15 Operating System Auxiliary Information
gdb provides interfaces to useful OS facilities that can help you debug your program.
When gdb runs on a Posix system (such as GNU or Unix machines), it interfaces with theinferior via the ptrace system call. The operating system creates a special sata structure,called struct user, for this interface. You can use the command info udot to display thecontents of this data structure.
info udot Display the contents of the struct user maintained by the OS kernel for theprogram being debugged. gdb displays the contents of struct user as a listof hex numbers, similar to the examine command.
Some operating systems supply an auxiliary vector to programs at startup. This is akinto the arguments and environment that you specify for a program, but contains a system-dependent variety of binary values that tell system libraries important details about thehardware, operating system, and process. Each value’s purpose is identified by an inte-ger tag; the meanings are well-known but system-specific. Depending on the configurationand operating system facilities, gdb may be able to show you this information. For re-mote targets, this functionality may further depend on the remote stub’s support of the‘qXfer:auxv:read’ packet, see [qXfer auxiliary vector read], page 492.
info auxv Display the auxiliary vector of the inferior, which can be either a live processor a core dump file. gdb prints each tag value numerically, and also showsnames and text descriptions for recognized tags. Some values in the vector arenumbers, some bit masks, and some pointers to strings or other data. gdbdisplays each value in the most appropriate form for a recognized tag, and inhexadecimal for an unrecognized tag.
On some targets, gdb can access operating-system-specific information and display it touser, without interpretation. For remote targets, this functionality depends on the remotestub’s support of the ‘qXfer:osdata:read’ packet, see [qXfer osdata read], page 494.
info os List the types of OS information available for the target. If the target does notreturn a list of possible types, this command will report an error.
info os processes
Display the list of processes on the target. For each process, gdb prints theprocess identifier, the name of the user, and the command corresponding to theprocess.
122 Debugging with gdb
10.16 Memory Region Attributes
Memory region attributes allow you to describe special handling required by regions ofyour target’s memory. gdb uses attributes to determine whether to allow certain typesof memory accesses; whether to use specific width accesses; and whether to cache targetmemory. By default the description of memory regions is fetched from the target (if thecurrent target supports this), but the user can override the fetched regions.
Defined memory regions can be individually enabled and disabled. When a memoryregion is disabled, gdb uses the default attributes when accessing memory in that region.Similarly, if no memory regions have been defined, gdb uses the default attributes whenaccessing all memory.
When a memory region is defined, it is given a number to identify it; to enable, disable,or remove a memory region, you specify that number.
mem lower upper attributes...
Define a memory region bounded by lower and upper with attributesattributes . . . , and add it to the list of regions monitored by gdb. Note thatupper == 0 is a special case: it is treated as the target’s maximum memoryaddress. (0xffff on 16 bit targets, 0xffffffff on 32 bit targets, etc.)
mem auto Discard any user changes to the memory regions and use target-supplied regions,if available, or no regions if the target does not support.
delete mem nums...
Remove memory regions nums . . . from the list of regions monitored by gdb.
disable mem nums...
Disable monitoring of memory regions nums . . . . A disabled memory region isnot forgotten. It may be enabled again later.
enable mem nums...
Enable monitoring of memory regions nums . . . .
info mem Print a table of all defined memory regions, with the following columns for eachregion:
Memory Region NumberEnabled or Disabled.
Enabled memory regions are marked with ‘y’. Disabled memoryregions are marked with ‘n’.
Lo AddressThe address defining the inclusive lower bound of the memory re-gion.
Hi AddressThe address defining the exclusive upper bound of the memoryregion.
Attributes The list of attributes set for this memory region.
10.16.1 Attributes
Chapter 10: Examining Data 123
10.16.1.1 Memory Access Mode
The access mode attributes set whether gdb may make read or write accesses to a memoryregion.
While these attributes prevent gdb from performing invalid memory accesses, they donothing to prevent the target system, I/O DMA, etc. from accessing memory.
ro Memory is read only.
wo Memory is write only.
rw Memory is read/write. This is the default.
10.16.1.2 Memory Access Size
The access size attribute tells gdb to use specific sized accesses in the memory region. Oftenmemory mapped device registers require specific sized accesses. If no access size attributeis specified, gdb may use accesses of any size.
8 Use 8 bit memory accesses.
16 Use 16 bit memory accesses.
32 Use 32 bit memory accesses.
64 Use 64 bit memory accesses.
10.16.1.3 Data Cache
The data cache attributes set whether gdb will cache target memory. While this generallyimproves performance by reducing debug protocol overhead, it can lead to incorrect resultsbecause gdb does not know about volatile variables or memory mapped device registers.
cache Enable gdb to cache target memory.
nocache Disable gdb from caching target memory. This is the default.
10.16.2 Memory Access Checking
gdb can be instructed to refuse accesses to memory that is not explicitly described. Thiscan be useful if accessing such regions has undesired effects for a specific target, or to providebetter error checking. The following commands control this behaviour.
set mem inaccessible-by-default [on|off]
If on is specified, make gdb treat memory not explicitly described by the mem-ory ranges as non-existent and refuse accesses to such memory. The checks areonly performed if there’s at least one memory range defined. If off is specified,make gdb treat the memory not explicitly described by the memory ranges asRAM. The default value is on.
show mem inaccessible-by-default
Show the current handling of accesses to unknown memory.
124 Debugging with gdb
10.17 Copy Between Memory and a File
You can use the commands dump, append, and restore to copy data between target memoryand a file. The dump and append commands write data to a file, and the restore commandreads data from a file back into the inferior’s memory. Files may be in binary, MotorolaS-record, Intel hex, or Tektronix Hex format; however, gdb can only append to binary files.
dump [format ] memory filename start_addr end_addr
dump [format ] value filename expr
Dump the contents of memory from start addr to end addr, or the value ofexpr, to filename in the given format.
The format parameter may be any one of:
binary Raw binary form.
ihex Intel hex format.
srec Motorola S-record format.
tekhex Tektronix Hex format.
gdb uses the same definitions of these formats as the gnu binary utilities, like‘objdump’ and ‘objcopy’. If format is omitted, gdb dumps the data in rawbinary form.
append [binary] memory filename start_addr end_addr
append [binary] value filename expr
Append the contents of memory from start addr to end addr, or the value ofexpr, to the file filename, in raw binary form. (gdb can only append data tofiles in raw binary form.)
restore filename [binary] bias start end
Restore the contents of file filename into memory. The restore command canautomatically recognize any known bfd file format, except for raw binary. Torestore a raw binary file you must specify the optional keyword binary afterthe filename.
If bias is non-zero, its value will be added to the addresses contained in the file.Binary files always start at address zero, so they will be restored at addressbias. Other bfd files have a built-in location; they will be restored at offset biasfrom that location.
If start and/or end are non-zero, then only data between file offset start andfile offset end will be restored. These offsets are relative to the addresses in thefile, before the bias argument is applied.
10.18 How to Produce a Core File from Your Program
A core file or core dump is a file that records the memory image of a running processand its process status (register values etc.). Its primary use is post-mortem debugging of aprogram that crashed while it ran outside a debugger. A program that crashes automaticallyproduces a core file, unless this feature is disabled by the user. See Section 18.1 [Files],page 201, for information on invoking gdb in the post-mortem debugging mode.
Chapter 10: Examining Data 125
Occasionally, you may wish to produce a core file of the program you are debugging inorder to preserve a snapshot of its state. gdb has a special command for that.
generate-core-file [file]
gcore [file]
Produce a core dump of the inferior process. The optional argument file specifiesthe file name where to put the core dump. If not specified, the file name defaultsto ‘core.pid ’, where pid is the inferior process ID.
Note that this command is implemented only for some systems (as of thiswriting, gnu/Linux, FreeBSD, Solaris, Unixware, and S390).
10.19 Character Sets
If the program you are debugging uses a different character set to represent characters andstrings than the one gdb uses itself, gdb can automatically translate between the charactersets for you. The character set gdb uses we call the host character set; the one the inferiorprogram uses we call the target character set.
For example, if you are running gdb on a gnu/Linux system, which uses the ISO Latin1 character set, but you are using gdb’s remote protocol (see Chapter 20 [Remote Debug-ging], page 219) to debug a program running on an IBM mainframe, which uses the ebcdiccharacter set, then the host character set is Latin-1, and the target character set is ebcdic.If you give gdb the command set target-charset EBCDIC-US, then gdb translates be-tween ebcdic and Latin 1 as you print character or string values, or use character andstring literals in expressions.
gdb has no way to automatically recognize which character set the inferior programuses; you must tell it, using the set target-charset command, described below.
Here are the commands for controlling gdb’s character set support:
set target-charset charset
Set the current target character set to charset. To display the list of supportedtarget character sets, type set target-charset TABTAB.
set host-charset charset
Set the current host character set to charset.
By default, gdb uses a host character set appropriate to the system it is run-ning on; you can override that default using the set host-charset command.On some systems, gdb cannot automatically determine the appropriate hostcharacter set. In this case, gdb uses ‘UTF-8’.
gdb can only use certain character sets as its host character set. If you typeset host-charset TABTAB, gdb will list the host character sets it supports.
set charset charset
Set the current host and target character sets to charset. As above, if you typeset charset TABTAB, gdb will list the names of the character sets that can beused for both host and target.
show charset
Show the names of the current host and target character sets.
126 Debugging with gdb
show host-charset
Show the name of the current host character set.
show target-charset
Show the name of the current target character set.
set target-wide-charset charset
Set the current target’s wide character set to charset. This is the characterset used by the target’s wchar_t type. To display the list of supported widecharacter sets, type set target-wide-charset TABTAB.
show target-wide-charset
Show the name of the current target’s wide character set.
Here is an example of gdb’s character set support in action. Assume that the followingsource code has been placed in the file ‘charset-test.c’:
#include <stdio.h>
char ascii_hello[]
= {72, 101, 108, 108, 111, 44, 32, 119,
111, 114, 108, 100, 33, 10, 0};
char ibm1047_hello[]
= {200, 133, 147, 147, 150, 107, 64, 166,
150, 153, 147, 132, 90, 37, 0};
main ()
{
printf ("Hello, world!\n");
}
In this program, ascii_hello and ibm1047_hello are arrays containing the string‘Hello, world!’ followed by a newline, encoded in the ascii and ibm1047 character sets.
We compile the program, and invoke the debugger on it:
$ gcc -g charset-test.c -o charset-test
$ gdb -nw charset-test
GNU gdb 2001-12-19-cvs
Copyright 2001 Free Software Foundation, Inc.
...
(gdb)
We can use the show charset command to see what character sets gdb is currentlyusing to interpret and display characters and strings:
(gdb) show charset
The current host and target character set is ‘ISO-8859-1’.
(gdb)
For the sake of printing this manual, let’s use ascii as our initial character set:
(gdb) set charset ASCII
(gdb) show charset
The current host and target character set is ‘ASCII’.
(gdb)
Let’s assume that ascii is indeed the correct character set for our host system — inother words, let’s assume that if gdb prints characters using the ascii character set, ourterminal will display them properly. Since our current target character set is also ascii, thecontents of ascii_hello print legibly:
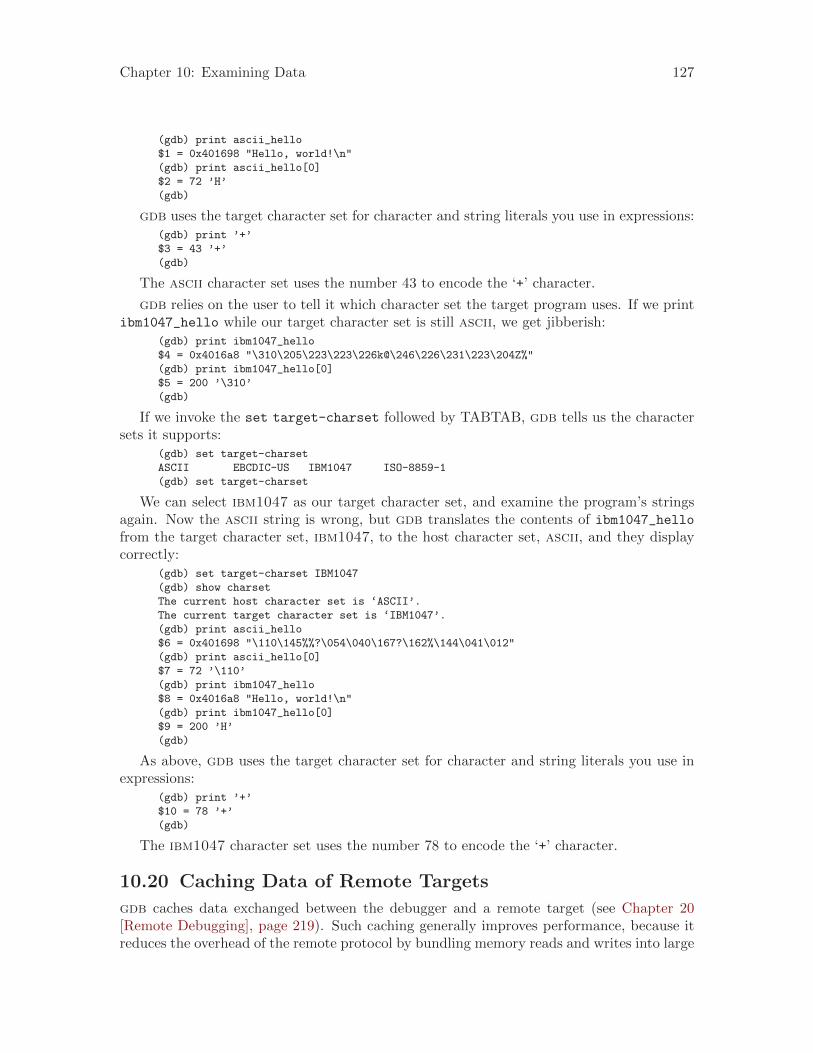
Chapter 10: Examining Data 127
(gdb) print ascii_hello
$1 = 0x401698 "Hello, world!\n"
(gdb) print ascii_hello[0]
$2 = 72 ’H’
(gdb)
gdb uses the target character set for character and string literals you use in expressions:(gdb) print ’+’
$3 = 43 ’+’
(gdb)
The ascii character set uses the number 43 to encode the ‘+’ character.
gdb relies on the user to tell it which character set the target program uses. If we printibm1047_hello while our target character set is still ascii, we get jibberish:
(gdb) print ibm1047_hello
$4 = 0x4016a8 "\310\205\223\223\226k@\246\226\231\223\204Z%"
(gdb) print ibm1047_hello[0]
$5 = 200 ’\310’
(gdb)
If we invoke the set target-charset followed by TABTAB, gdb tells us the charactersets it supports:
(gdb) set target-charset
ASCII EBCDIC-US IBM1047 ISO-8859-1
(gdb) set target-charset
We can select ibm1047 as our target character set, and examine the program’s stringsagain. Now the ascii string is wrong, but gdb translates the contents of ibm1047_hellofrom the target character set, ibm1047, to the host character set, ascii, and they displaycorrectly:
(gdb) set target-charset IBM1047
(gdb) show charset
The current host character set is ‘ASCII’.
The current target character set is ‘IBM1047’.
(gdb) print ascii_hello
$6 = 0x401698 "\110\145%%?\054\040\167?\162%\144\041\012"
(gdb) print ascii_hello[0]
$7 = 72 ’\110’
(gdb) print ibm1047_hello
$8 = 0x4016a8 "Hello, world!\n"
(gdb) print ibm1047_hello[0]
$9 = 200 ’H’
(gdb)
As above, gdb uses the target character set for character and string literals you use inexpressions:
(gdb) print ’+’
$10 = 78 ’+’
(gdb)
The ibm1047 character set uses the number 78 to encode the ‘+’ character.
10.20 Caching Data of Remote Targets
gdb caches data exchanged between the debugger and a remote target (see Chapter 20[Remote Debugging], page 219). Such caching generally improves performance, because itreduces the overhead of the remote protocol by bundling memory reads and writes into large
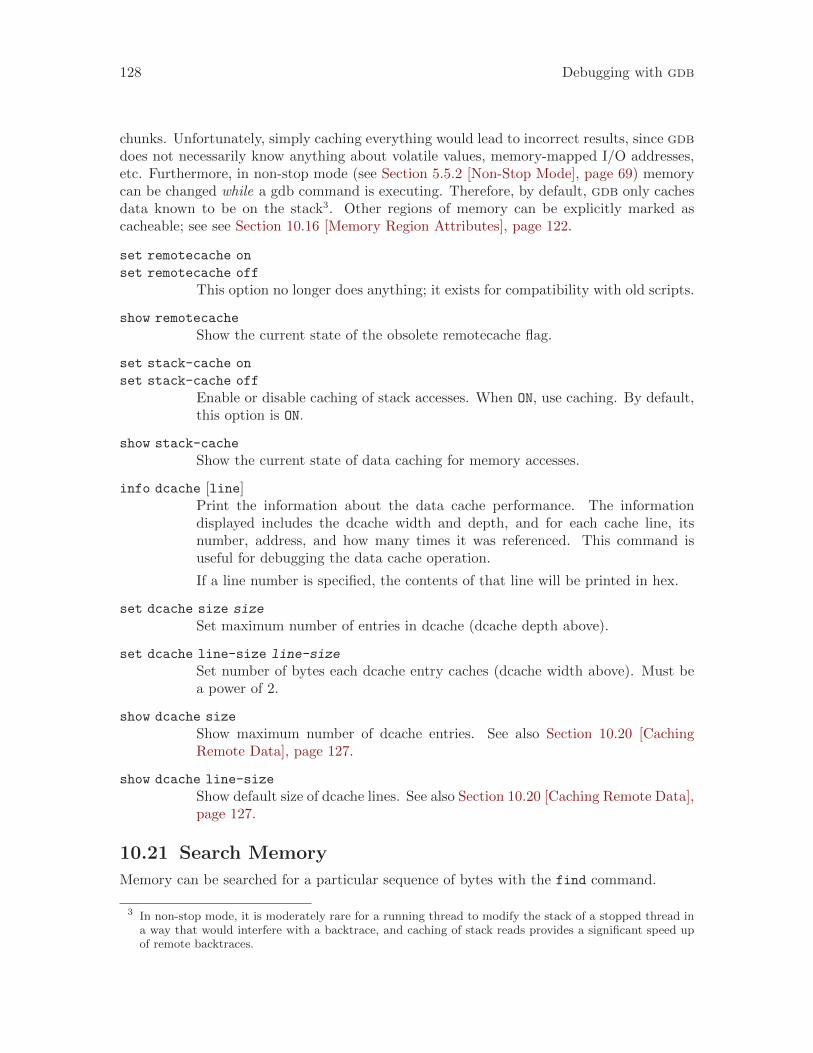
128 Debugging with gdb
chunks. Unfortunately, simply caching everything would lead to incorrect results, since gdbdoes not necessarily know anything about volatile values, memory-mapped I/O addresses,etc. Furthermore, in non-stop mode (see Section 5.5.2 [Non-Stop Mode], page 69) memorycan be changed while a gdb command is executing. Therefore, by default, gdb only cachesdata known to be on the stack3. Other regions of memory can be explicitly marked ascacheable; see see Section 10.16 [Memory Region Attributes], page 122.
set remotecache on
set remotecache off
This option no longer does anything; it exists for compatibility with old scripts.
show remotecache
Show the current state of the obsolete remotecache flag.
set stack-cache on
set stack-cache off
Enable or disable caching of stack accesses. When ON, use caching. By default,this option is ON.
show stack-cache
Show the current state of data caching for memory accesses.
info dcache [line]Print the information about the data cache performance. The informationdisplayed includes the dcache width and depth, and for each cache line, itsnumber, address, and how many times it was referenced. This command isuseful for debugging the data cache operation.
If a line number is specified, the contents of that line will be printed in hex.
set dcache size size
Set maximum number of entries in dcache (dcache depth above).
set dcache line-size line-size
Set number of bytes each dcache entry caches (dcache width above). Must bea power of 2.
show dcache size
Show maximum number of dcache entries. See also Section 10.20 [CachingRemote Data], page 127.
show dcache line-size
Show default size of dcache lines. See also Section 10.20 [Caching Remote Data],page 127.
10.21 Search Memory
Memory can be searched for a particular sequence of bytes with the find command.
3 In non-stop mode, it is moderately rare for a running thread to modify the stack of a stopped thread ina way that would interfere with a backtrace, and caching of stack reads provides a significant speed upof remote backtraces.
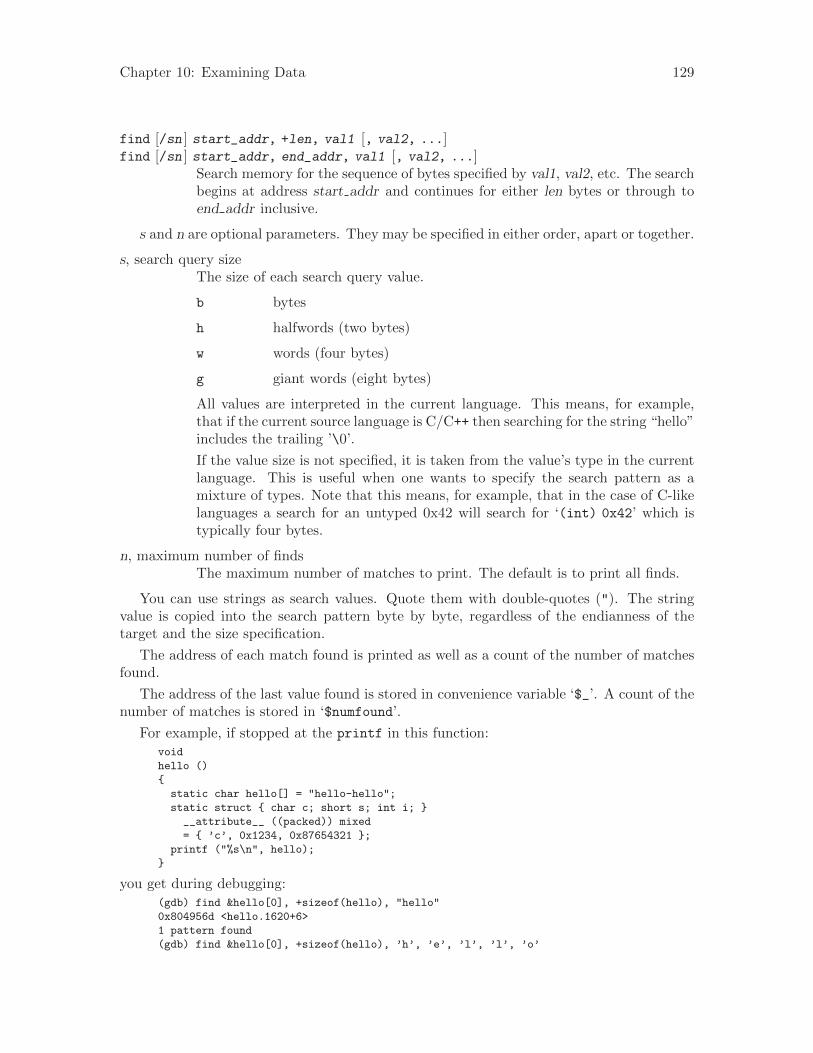
Chapter 10: Examining Data 129
find [/sn ] start_addr, +len, val1 [, val2, ...]find [/sn ] start_addr, end_addr, val1 [, val2, ...]
Search memory for the sequence of bytes specified by val1, val2, etc. The searchbegins at address start addr and continues for either len bytes or through toend addr inclusive.
s and n are optional parameters. They may be specified in either order, apart or together.
s, search query sizeThe size of each search query value.
b bytes
h halfwords (two bytes)
w words (four bytes)
g giant words (eight bytes)
All values are interpreted in the current language. This means, for example,that if the current source language is C/C++ then searching for the string “hello”includes the trailing ’\0’.
If the value size is not specified, it is taken from the value’s type in the currentlanguage. This is useful when one wants to specify the search pattern as amixture of types. Note that this means, for example, that in the case of C-likelanguages a search for an untyped 0x42 will search for ‘(int) 0x42’ which istypically four bytes.
n, maximum number of findsThe maximum number of matches to print. The default is to print all finds.
You can use strings as search values. Quote them with double-quotes ("). The stringvalue is copied into the search pattern byte by byte, regardless of the endianness of thetarget and the size specification.
The address of each match found is printed as well as a count of the number of matchesfound.
The address of the last value found is stored in convenience variable ‘$_’. A count of thenumber of matches is stored in ‘$numfound’.
For example, if stopped at the printf in this function:void
hello ()
{
static char hello[] = "hello-hello";
static struct { char c; short s; int i; }
__attribute__ ((packed)) mixed
= { ’c’, 0x1234, 0x87654321 };
printf ("%s\n", hello);
}
you get during debugging:(gdb) find &hello[0], +sizeof(hello), "hello"
0x804956d <hello.1620+6>
1 pattern found
(gdb) find &hello[0], +sizeof(hello), ’h’, ’e’, ’l’, ’l’, ’o’
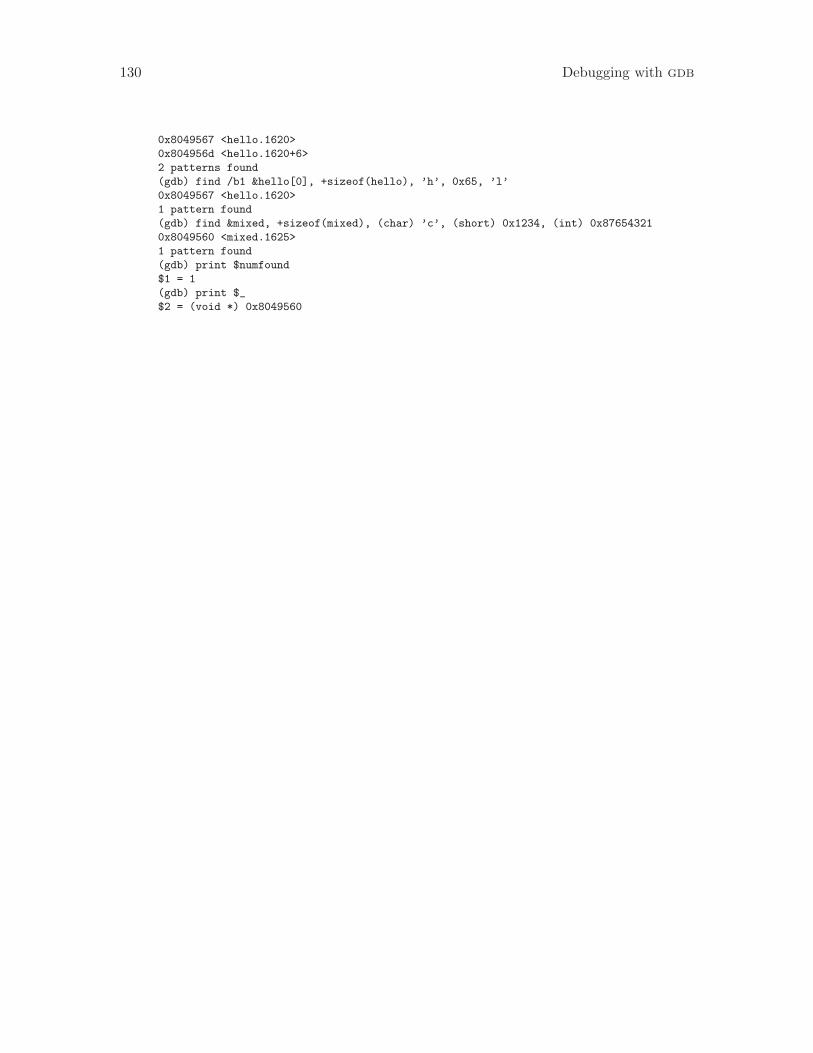
130 Debugging with gdb
0x8049567 <hello.1620>
0x804956d <hello.1620+6>
2 patterns found
(gdb) find /b1 &hello[0], +sizeof(hello), ’h’, 0x65, ’l’
0x8049567 <hello.1620>
1 pattern found
(gdb) find &mixed, +sizeof(mixed), (char) ’c’, (short) 0x1234, (int) 0x87654321
0x8049560 <mixed.1625>
1 pattern found
(gdb) print $numfound
$1 = 1
(gdb) print $_
$2 = (void *) 0x8049560
Chapter 11: Debugging Optimized Code 131
11 Debugging Optimized Code
Almost all compilers support optimization. With optimization disabled, the compiler gen-erates assembly code that corresponds directly to your source code, in a simplistic way.As the compiler applies more powerful optimizations, the generated assembly code divergesfrom your original source code. With help from debugging information generated by thecompiler, gdb can map from the running program back to constructs from your originalsource.
gdb is more accurate with optimization disabled. If you can recompile without opti-mization, it is easier to follow the progress of your program during debugging. But, thereare many cases where you may need to debug an optimized version.
When you debug a program compiled with ‘-g -O’, remember that the optimizer hasrearranged your code; the debugger shows you what is really there. Do not be too surprisedwhen the execution path does not exactly match your source file! An extreme example: ifyou define a variable, but never use it, gdb never sees that variable—because the compileroptimizes it out of existence.
Some things do not work as well with ‘-g -O’ as with just ‘-g’, particularly on machineswith instruction scheduling. If in doubt, recompile with ‘-g’ alone, and if this fixes theproblem, please report it to us as a bug (including a test case!). See Section 10.3 [Variables],page 99, for more information about debugging optimized code.
11.1 Inline Functions
Inlining is an optimization that inserts a copy of the function body directly at each call site,instead of jumping to a shared routine. gdb displays inlined functions just like non-inlinedfunctions. They appear in backtraces. You can view their arguments and local variables,step into them with step, skip them with next, and escape from them with finish. Youcan check whether a function was inlined by using the info frame command.
For gdb to support inlined functions, the compiler must record information about in-lining in the debug information — gcc using the dwarf 2 format does this, and sev-eral other compilers do also. gdb only supports inlined functions when using dwarf 2.Versions of gcc before 4.1 do not emit two required attributes (‘DW_AT_call_file’ and‘DW_AT_call_line’); gdb does not display inlined function calls with earlier versions ofgcc. It instead displays the arguments and local variables of inlined functions as localvariables in the caller.
The body of an inlined function is directly included at its call site; unlike a non-inlinedfunction, there are no instructions devoted to the call. gdb still pretends that the call siteand the start of the inlined function are different instructions. Stepping to the call siteshows the call site, and then stepping again shows the first line of the inlined function, eventhough no additional instructions are executed.
This makes source-level debugging much clearer; you can see both the context of the calland then the effect of the call. Only stepping by a single instruction using stepi or nextidoes not do this; single instruction steps always show the inlined body.
There are some ways that gdb does not pretend that inlined function calls are the sameas normal calls:
132 Debugging with gdb
• You cannot set breakpoints on inlined functions. gdb either reports that there is nosymbol with that name, or else sets the breakpoint only on non-inlined copies of thefunction. This limitation will be removed in a future version of gdb; until then, set abreakpoint by line number on the first line of the inlined function instead.
• Setting breakpoints at the call site of an inlined function may not work, because thecall site does not contain any code. gdb may incorrectly move the breakpoint to thenext line of the enclosing function, after the call. This limitation will be removed ina future version of gdb; until then, set a breakpoint on an earlier line or inside theinlined function instead.
• gdb cannot locate the return value of inlined calls after using the finish command.This is a limitation of compiler-generated debugging information; after finish, youcan step to the next line and print a variable where your program stored the returnvalue.
11.2 Tail Call Frames
Function B can call function C in its very last statement. In unoptimized compilation thecall of C is immediately followed by return instruction at the end of B code. Optimizingcompiler may replace the call and return in function B into one jump to function C instead.Such use of a jump instruction is called tail call.
During execution of function C, there will be no indication in the function call stackframes that it was tail-called from B. If function A regularly calls function B which tail-callsfunction C, then gdb will see A as the caller of C. However, in some cases gdb can determinethat C was tail-called from B, and it will then create fictitious call frame for that, with thereturn address set up as if B called C normally.
This functionality is currently supported only by DWARF 2 debugging format and thecompiler has to produce ‘DW_TAG_GNU_call_site’ tags. With gcc, you need to specify ‘-O-g’ during compilation, to get this information.
info frame command (see Section 8.4 [Frame Info], page 85) will indicate the tail callframe kind by text tail call frame such as in this sample gdb output:
(gdb) x/i $pc - 2
0x40066b <b(int, double)+11>: jmp 0x400640 <c(int, double)>
(gdb) info frame
Stack level 1, frame at 0x7fffffffda30:
rip = 0x40066d in b (amd64-entry-value.cc:59); saved rip 0x4004c5
tail call frame, caller of frame at 0x7fffffffda30
source language c++.
Arglist at unknown address.
Locals at unknown address, Previous frame’s sp is 0x7fffffffda30
The detection of all the possible code path executions can find them ambiguous. There isno execution history stored (possible Chapter 6 [Reverse Execution], page 75 is never usedfor this purpose) and the last known caller could have reached the known callee by multipledifferent jump sequences. In such case gdb still tries to show at least all the unambiguoustop tail callers and all the unambiguous bottom tail calees, if any.
set debug entry-values
When set to on, enables printing of analysis messages for both frame argumentvalues at function entry and tail calls. It will show all the possible valid tail
Chapter 11: Debugging Optimized Code 133
calls code paths it has considered. It will also print the intersection of themwith the final unambiguous (possibly partial or even empty) code path result.
show debug entry-values
Show the current state of analysis messages printing for both frame argumentvalues at function entry and tail calls.
The analysis messages for tail calls can for example show why the virtual tail call framefor function c has not been recognized (due to the indirect reference by variable x):
static void __attribute__((noinline, noclone)) c (void);
void (*x) (void) = c;
static void __attribute__((noinline, noclone)) a (void) { x++; }
static void __attribute__((noinline, noclone)) c (void) { a (); }
int main (void) { x (); return 0; }
Breakpoint 1, DW_OP_GNU_entry_value resolving cannot find
DW_TAG_GNU_call_site 0x40039a in main
a () at t.c:3
3 static void __attribute__((noinline, noclone)) a (void) { x++; }
(gdb) bt
#0 a () at t.c:3
#1 0x000000000040039a in main () at t.c:5
Another possibility is an ambiguous virtual tail call frames resolution:
int i;
static void __attribute__((noinline, noclone)) f (void) { i++; }
static void __attribute__((noinline, noclone)) e (void) { f (); }
static void __attribute__((noinline, noclone)) d (void) { f (); }
static void __attribute__((noinline, noclone)) c (void) { d (); }
static void __attribute__((noinline, noclone)) b (void)
{ if (i) c (); else e (); }
static void __attribute__((noinline, noclone)) a (void) { b (); }
int main (void) { a (); return 0; }
tailcall: initial: 0x4004d2(a) 0x4004ce(b) 0x4004b2(c) 0x4004a2(d)
tailcall: compare: 0x4004d2(a) 0x4004cc(b) 0x400492(e)
tailcall: reduced: 0x4004d2(a) |
(gdb) bt
#0 f () at t.c:2
#1 0x00000000004004d2 in a () at t.c:8
#2 0x0000000000400395 in main () at t.c:9
Frames #0 and #2 are real, #1 is a virtual tail call frame. The code can have possibleexecution paths main->a->b->c->d->f or main->a->b->e->f, gdb cannot find which onefrom the inferior state.
initial: state shows some random possible calling sequence gdb has found. It thenfinds another possible calling sequcen - that one is prefixed by compare:. The non-ambiguous intersection of these two is printed as the reduced: calling sequence. Thatone could have many futher compare: and reduced: statements as long as there remainany non-ambiguous sequence entries.
For the frame of function b in both cases there are different possible $pc values (0x4004ccor 0x4004ce), therefore this frame is also ambigous. The only non-ambiguous frame is theone for function a, therefore this one is displayed to the user while the ambiguous framesare omitted.
134 Debugging with gdb
There can be also reasons why printing of frame argument values at function entry mayfail:
int v;
static void __attribute__((noinline, noclone)) c (int i) { v++; }
static void __attribute__((noinline, noclone)) a (int i);
static void __attribute__((noinline, noclone)) b (int i) { a (i); }
static void __attribute__((noinline, noclone)) a (int i)
{ if (i) b (i - 1); else c (0); }
int main (void) { a (5); return 0; }
(gdb) bt
#0 c (i=i@entry=0) at t.c:2
#1 0x0000000000400428 in a (DW_OP_GNU_entry_value resolving has found
function "a" at 0x400420 can call itself via tail calls
i=<optimized out>) at t.c:6
#2 0x000000000040036e in main () at t.c:7
gdb cannot find out from the inferior state if and how many times did function a callitself (via function b) as these calls would be tail calls. Such tail calls would modify thuei variable, therefore gdb cannot be sure the value it knows would be right - gdb prints<optimized out> instead.
Chapter 12: C Preprocessor Macros 135
12 C Preprocessor Macros
Some languages, such as C and C++, provide a way to define and invoke “preprocessormacros” which expand into strings of tokens. gdb can evaluate expressions containingmacro invocations, show the result of macro expansion, and show a macro’s definition,including where it was defined.
You may need to compile your program specially to provide gdb with information aboutpreprocessor macros. Most compilers do not include macros in their debugging information,even when you compile with the ‘-g’ flag. See Section 4.1 [Compilation], page 25.
A program may define a macro at one point, remove that definition later, and thenprovide a different definition after that. Thus, at different points in the program, a macromay have different definitions, or have no definition at all. If there is a current stack frame,gdb uses the macros in scope at that frame’s source code line. Otherwise, gdb uses themacros in scope at the current listing location; see Section 9.1 [List], page 87.
Whenever gdb evaluates an expression, it always expands any macro invocations presentin the expression. gdb also provides the following commands for working with macrosexplicitly.
macro expand expression
macro exp expression
Show the results of expanding all preprocessor macro invocations in expression.Since gdb simply expands macros, but does not parse the result, expressionneed not be a valid expression; it can be any string of tokens.
macro expand-once expression
macro exp1 expression
(This command is not yet implemented.) Show the results of expanding thosepreprocessor macro invocations that appear explicitly in expression. Macroinvocations appearing in that expansion are left unchanged. This commandallows you to see the effect of a particular macro more clearly, without beingconfused by further expansions. Since gdb simply expands macros, but doesnot parse the result, expression need not be a valid expression; it can be anystring of tokens.
info macro [-a|-all] [--] macro
Show the current definition or all definitions of the named macro, and describethe source location or compiler command-line where that definition was estab-lished. The optional double dash is to signify the end of argument processingand the beginning of macro for non C-like macros where the macro may beginwith a hyphen.
info macros linespec
Show all macro definitions that are in effect at the location specified by line-spec, and describe the source location or compiler command-line where thosedefinitions were established.
macro define macro replacement-list
macro define macro(arglist) replacement-list
Introduce a definition for a preprocessor macro named macro, invocations ofwhich are replaced by the tokens given in replacement-list. The first form of
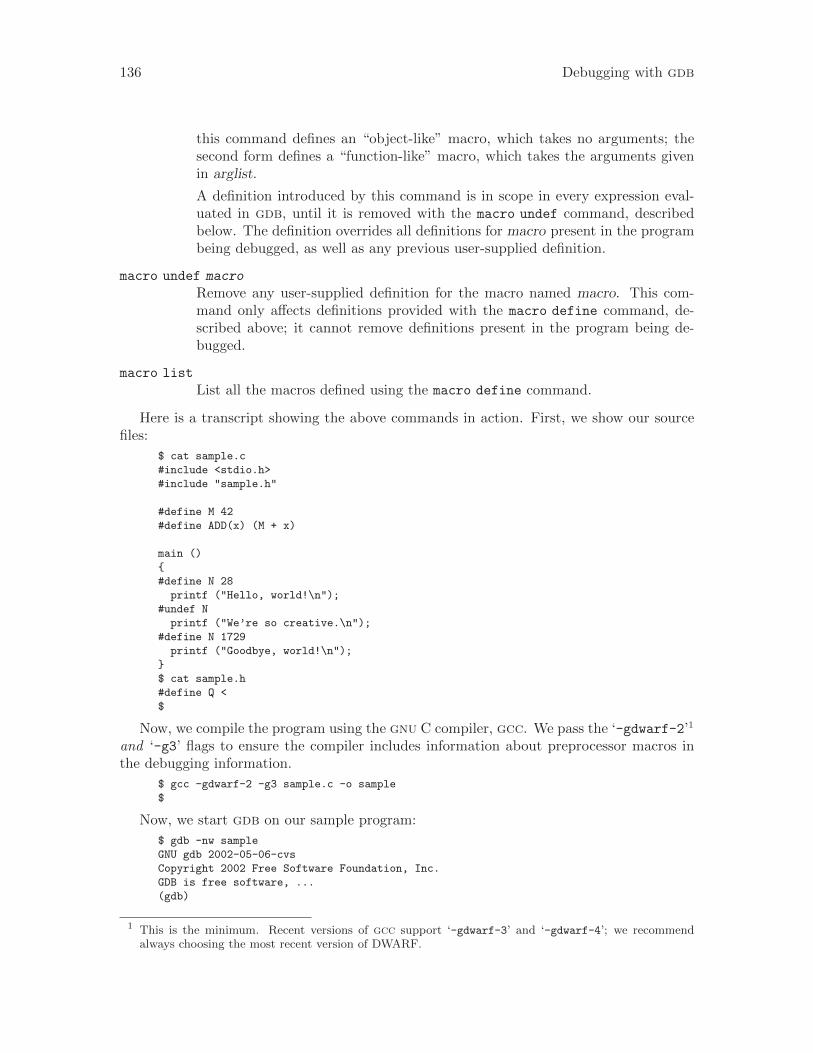
136 Debugging with gdb
this command defines an “object-like” macro, which takes no arguments; thesecond form defines a “function-like” macro, which takes the arguments givenin arglist.
A definition introduced by this command is in scope in every expression eval-uated in gdb, until it is removed with the macro undef command, describedbelow. The definition overrides all definitions for macro present in the programbeing debugged, as well as any previous user-supplied definition.
macro undef macro
Remove any user-supplied definition for the macro named macro. This com-mand only affects definitions provided with the macro define command, de-scribed above; it cannot remove definitions present in the program being de-bugged.
macro list
List all the macros defined using the macro define command.
Here is a transcript showing the above commands in action. First, we show our sourcefiles:
$ cat sample.c
#include <stdio.h>
#include "sample.h"
#define M 42
#define ADD(x) (M + x)
main ()
{
#define N 28
printf ("Hello, world!\n");
#undef N
printf ("We’re so creative.\n");
#define N 1729
printf ("Goodbye, world!\n");
}
$ cat sample.h
#define Q <
$
Now, we compile the program using the gnu C compiler, gcc. We pass the ‘-gdwarf-2’1
and ‘-g3’ flags to ensure the compiler includes information about preprocessor macros inthe debugging information.
$ gcc -gdwarf-2 -g3 sample.c -o sample
$
Now, we start gdb on our sample program:
$ gdb -nw sample
GNU gdb 2002-05-06-cvs
Copyright 2002 Free Software Foundation, Inc.
GDB is free software, ...
(gdb)
1 This is the minimum. Recent versions of gcc support ‘-gdwarf-3’ and ‘-gdwarf-4’; we recommendalways choosing the most recent version of DWARF.
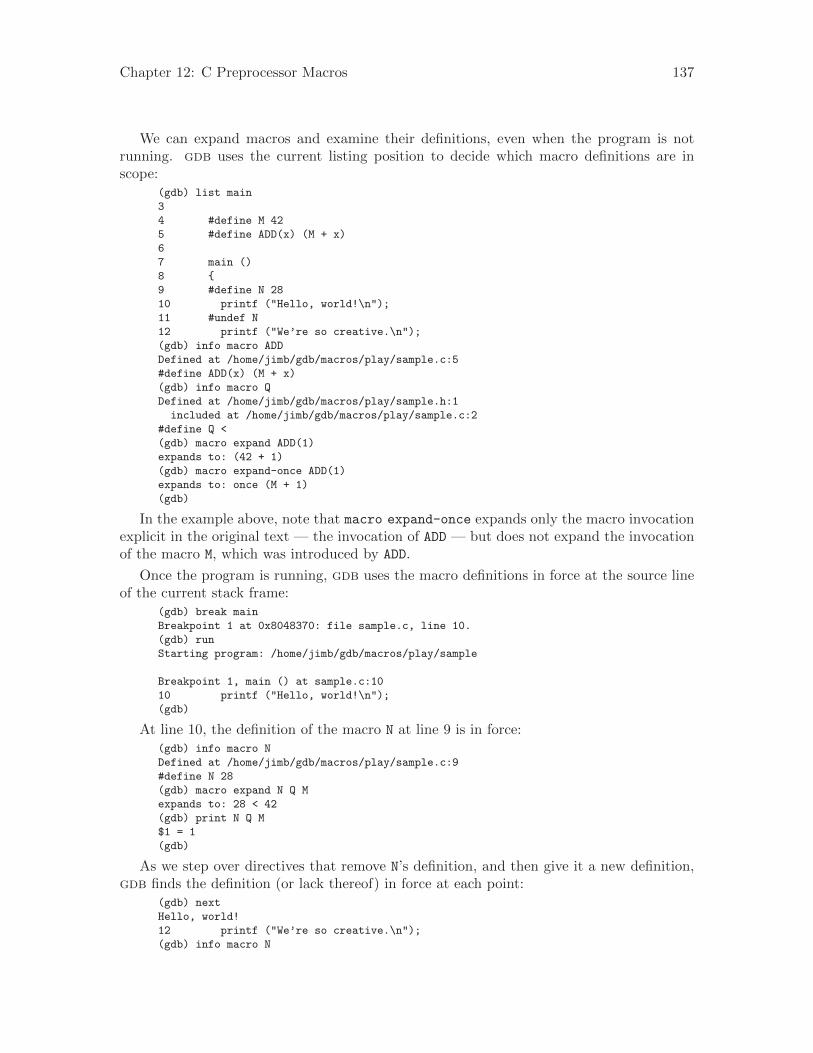
Chapter 12: C Preprocessor Macros 137
We can expand macros and examine their definitions, even when the program is notrunning. gdb uses the current listing position to decide which macro definitions are inscope:
(gdb) list main
3
4 #define M 42
5 #define ADD(x) (M + x)
6
7 main ()
8 {
9 #define N 28
10 printf ("Hello, world!\n");
11 #undef N
12 printf ("We’re so creative.\n");
(gdb) info macro ADD
Defined at /home/jimb/gdb/macros/play/sample.c:5
#define ADD(x) (M + x)
(gdb) info macro Q
Defined at /home/jimb/gdb/macros/play/sample.h:1
included at /home/jimb/gdb/macros/play/sample.c:2
#define Q <
(gdb) macro expand ADD(1)
expands to: (42 + 1)
(gdb) macro expand-once ADD(1)
expands to: once (M + 1)
(gdb)
In the example above, note that macro expand-once expands only the macro invocationexplicit in the original text — the invocation of ADD — but does not expand the invocationof the macro M, which was introduced by ADD.
Once the program is running, gdb uses the macro definitions in force at the source lineof the current stack frame:
(gdb) break main
Breakpoint 1 at 0x8048370: file sample.c, line 10.
(gdb) run
Starting program: /home/jimb/gdb/macros/play/sample
Breakpoint 1, main () at sample.c:10
10 printf ("Hello, world!\n");
(gdb)
At line 10, the definition of the macro N at line 9 is in force:(gdb) info macro N
Defined at /home/jimb/gdb/macros/play/sample.c:9
#define N 28
(gdb) macro expand N Q M
expands to: 28 < 42
(gdb) print N Q M
$1 = 1
(gdb)
As we step over directives that remove N’s definition, and then give it a new definition,gdb finds the definition (or lack thereof) in force at each point:
(gdb) next
Hello, world!
12 printf ("We’re so creative.\n");
(gdb) info macro N
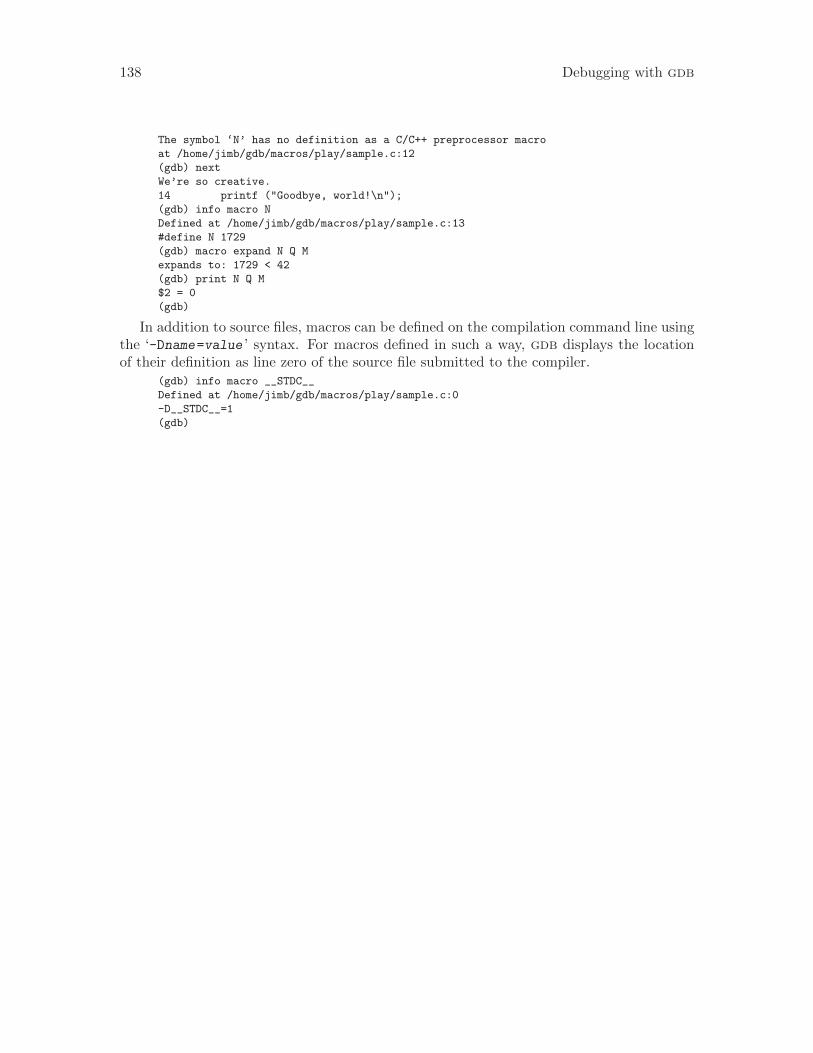
138 Debugging with gdb
The symbol ‘N’ has no definition as a C/C++ preprocessor macro
at /home/jimb/gdb/macros/play/sample.c:12
(gdb) next
We’re so creative.
14 printf ("Goodbye, world!\n");
(gdb) info macro N
Defined at /home/jimb/gdb/macros/play/sample.c:13
#define N 1729
(gdb) macro expand N Q M
expands to: 1729 < 42
(gdb) print N Q M
$2 = 0
(gdb)
In addition to source files, macros can be defined on the compilation command line usingthe ‘-Dname=value ’ syntax. For macros defined in such a way, gdb displays the locationof their definition as line zero of the source file submitted to the compiler.
(gdb) info macro __STDC__
Defined at /home/jimb/gdb/macros/play/sample.c:0
-D__STDC__=1
(gdb)
Chapter 13: Tracepoints 139
13 Tracepoints
In some applications, it is not feasible for the debugger to interrupt the program’s executionlong enough for the developer to learn anything helpful about its behavior. If the program’scorrectness depends on its real-time behavior, delays introduced by a debugger might causethe program to change its behavior drastically, or perhaps fail, even when the code itself iscorrect. It is useful to be able to observe the program’s behavior without interrupting it.
Using gdb’s trace and collect commands, you can specify locations in the program,called tracepoints, and arbitrary expressions to evaluate when those tracepoints are reached.Later, using the tfind command, you can examine the values those expressions had whenthe program hit the tracepoints. The expressions may also denote objects in memory—structures or arrays, for example—whose values gdb should record; while visiting a partic-ular tracepoint, you may inspect those objects as if they were in memory at that moment.However, because gdb records these values without interacting with you, it can do so quicklyand unobtrusively, hopefully not disturbing the program’s behavior.
The tracepoint facility is currently available only for remote targets. See Chapter 19[Targets], page 215. In addition, your remote target must know how to collect trace data.This functionality is implemented in the remote stub; however, none of the stubs distributedwith gdb support tracepoints as of this writing. The format of the remote packets used toimplement tracepoints are described in Section E.6 [Tracepoint Packets], page 496.
It is also possible to get trace data from a file, in a manner reminiscent of corefiles;you specify the filename, and use tfind to search through the file. See Section 13.4 [TraceFiles], page 154, for more details.
This chapter describes the tracepoint commands and features.
13.1 Commands to Set Tracepoints
Before running such a trace experiment, an arbitrary number of tracepoints can be set. Atracepoint is actually a special type of breakpoint (see Section 5.1.1 [Set Breaks], page 44),so you can manipulate it using standard breakpoint commands. For instance, as withbreakpoints, tracepoint numbers are successive integers starting from one, and many of thecommands associated with tracepoints take the tracepoint number as their argument, toidentify which tracepoint to work on.
For each tracepoint, you can specify, in advance, some arbitrary set of data that youwant the target to collect in the trace buffer when it hits that tracepoint. The collected datacan include registers, local variables, or global data. Later, you can use gdb commands toexamine the values these data had at the time the tracepoint was hit.
Tracepoints do not support every breakpoint feature. Ignore counts on tracepoints haveno effect, and tracepoints cannot run gdb commands when they are hit. Tracepoints maynot be thread-specific either.
Some targets may support fast tracepoints, which are inserted in a different way (suchas with a jump instead of a trap), that is faster but possibly restricted in where they maybe installed.
Regular and fast tracepoints are dynamic tracing facilities, meaning that they can beused to insert tracepoints at (almost) any location in the target. Some targets may also sup-port controlling static tracepoints from gdb. With static tracing, a set of instrumentation
140 Debugging with gdb
points, also known as markers, are embedded in the target program, and can be activatedor deactivated by name or address. These are usually placed at locations which facilitateinvestigating what the target is actually doing. gdb’s support for static tracing includesbeing able to list instrumentation points, and attach them with gdb defined high level tra-cepoints that expose the whole range of convenience of gdb’s tracepoints support. Namely,support for collecting registers values and values of global or local (to the instrumentationpoint) variables; tracepoint conditions and trace state variables. The act of installing a gdbstatic tracepoint on an instrumentation point, or marker, is referred to as probing a statictracepoint marker.
gdbserver supports tracepoints on some target systems. See Section 20.3 [Tracepointssupport in gdbserver], page 221.
This section describes commands to set tracepoints and associated conditions and ac-tions.
13.1.1 Create and Delete Tracepoints
trace location
The trace command is very similar to the break command. Its argumentlocation can be a source line, a function name, or an address in the targetprogram. See Section 9.2 [Specify Location], page 88. The trace commanddefines a tracepoint, which is a point in the target program where the debuggerwill briefly stop, collect some data, and then allow the program to continue.Setting a tracepoint or changing its actions takes effect immediately if the re-mote stub supports the ‘InstallInTrace’ feature (see [install tracepoint intracing], page 490). If remote stub doesn’t support the ‘InstallInTrace’ fea-ture, all these changes don’t take effect until the next tstart command, andonce a trace experiment is running, further changes will not have any effectuntil the next trace experiment starts. In addition, gdb supports pendingtracepoints—tracepoints whose address is not yet resolved. (This is similar topending breakpoints.) Pending tracepoints are not downloaded to the targetand not installed until they are resolved. The resolution of pending tracepointsrequires gdb support—when debugging with the remote target, and gdb dis-connects from the remote stub (see [disconnected tracing], page 148), pendingtracepoints can not be resolved (and downloaded to the remote stub) while gdbis disconnected.
Here are some examples of using the trace command:
(gdb) trace foo.c:121 // a source file and line number
(gdb) trace +2 // 2 lines forward
(gdb) trace my function // first source line of function
(gdb) trace *my function // EXACT start address of function
(gdb) trace *0x2117c4 // an address
You can abbreviate trace as tr.
Chapter 13: Tracepoints 141
trace location if cond
Set a tracepoint with condition cond; evaluate the expression cond each timethe tracepoint is reached, and collect data only if the value is nonzero—that is,if cond evaluates as true. See Section 13.1.4 [Tracepoint Conditions], page 143,for more information on tracepoint conditions.
ftrace location [ if cond ]
The ftrace command sets a fast tracepoint. For targets that support them,fast tracepoints will use a more efficient but possibly less general technique totrigger data collection, such as a jump instruction instead of a trap, or somesort of hardware support. It may not be possible to create a fast tracepoint atthe desired location, in which case the command will exit with an explanatorymessage.
gdb handles arguments to ftrace exactly as for trace.
On 32-bit x86-architecture systems, fast tracepoints normally need to be placedat an instruction that is 5 bytes or longer, but can be placed at 4-byte instruc-tions if the low 64K of memory of the target program is available to installtrampolines. Some Unix-type systems, such as gnu/Linux, exclude low ad-dresses from the program’s address space; but for instance with the Linuxkernel it is possible to let gdb use this area by doing a sysctl command to setthe mmap_min_addr kernel parameter, as in
sudo sysctl -w vm.mmap_min_addr=32768
which sets the low address to 32K, which leaves plenty of room for trampolines.The minimum address should be set to a page boundary.
strace location [ if cond ]
The strace command sets a static tracepoint. For targets that support it,setting a static tracepoint probes a static instrumentation point, or marker,found at location. It may not be possible to set a static tracepoint at thedesired location, in which case the command will exit with an explanatorymessage.
gdb handles arguments to strace exactly as for trace, with the addition thatthe user can also specify -m marker as location. This probes the marker iden-tified by the marker string identifier. This identifier depends on the statictracepoint backend library your program is using. You can find all the markeridentifiers in the ‘ID’ field of the info static-tracepoint-markers commandoutput. See Section 13.1.8 [Listing Static Tracepoint Markers], page 147. Forexample, in the following small program using the UST tracing engine:
main ()
{
trace_mark(ust, bar33, "str %s", "FOOBAZ");
}
the marker id is composed of joining the first two arguments to the trace_markcall with a slash, which translates to:
(gdb) info static-tracepoint-markers
Cnt Enb ID Address What
1 n ust/bar33 0x0000000000400ddc in main at stexample.c:22
Data: "str %s"
142 Debugging with gdb
[etc...]
so you may probe the marker above with:
(gdb) strace -m ust/bar33
Static tracepoints accept an extra collect action — collect $_sdata. Thiscollects arbitrary user data passed in the probe point call to the tracing library.In the UST example above, you’ll see that the third argument to trace_mark
is a printf-like format string. The user data is then the result of running thatformating string against the following arguments. Note that info static-
tracepoint-markers command output lists that format string in the ‘Data:’field.
You can inspect this data when analyzing the trace buffer, by printing the$ sdata variable like any other variable available to gdb. See Section 13.1.6[Tracepoint Action Lists], page 144.
The convenience variable $tpnum records the tracepoint number of the mostrecently set tracepoint.
delete tracepoint [num ]Permanently delete one or more tracepoints. With no argument, the default isto delete all tracepoints. Note that the regular delete command can removetracepoints also.
Examples:
(gdb) delete trace 1 2 3 // remove three tracepoints
(gdb) delete trace // remove all tracepoints
You can abbreviate this command as del tr.
13.1.2 Enable and Disable Tracepoints
These commands are deprecated; they are equivalent to plain disable and enable.
disable tracepoint [num ]Disable tracepoint num, or all tracepoints if no argument num is given. A dis-abled tracepoint will have no effect during a trace experiment, but it is not for-gotten. You can re-enable a disabled tracepoint using the enable tracepoint
command. If the command is issued during a trace experiment and the debugtarget has support for disabling tracepoints during a trace experiment, then thechange will be effective immediately. Otherwise, it will be applied to the nexttrace experiment.
enable tracepoint [num ]Enable tracepoint num, or all tracepoints. If this command is issued during atrace experiment and the debug target supports enabling tracepoints during atrace experiment, then the enabled tracepoints will become effective immedi-ately. Otherwise, they will become effective the next time a trace experimentis run.
Chapter 13: Tracepoints 143
13.1.3 Tracepoint Passcounts
passcount [n [num ]]Set the passcount of a tracepoint. The passcount is a way to automaticallystop a trace experiment. If a tracepoint’s passcount is n, then the trace exper-iment will be automatically stopped on the n’th time that tracepoint is hit. Ifthe tracepoint number num is not specified, the passcount command sets thepasscount of the most recently defined tracepoint. If no passcount is given, thetrace experiment will run until stopped explicitly by the user.
Examples:(gdb) passcount 5 2 // Stop on the 5th execution of
// tracepoint 2
(gdb) passcount 12 // Stop on the 12th execution of the
// most recently defined tracepoint.
(gdb) trace foo(gdb) pass 3(gdb) trace bar(gdb) pass 2(gdb) trace baz(gdb) pass 1 // Stop tracing when foo has been
// executed 3 times OR when bar has
// been executed 2 times
// OR when baz has been executed 1 time.
13.1.4 Tracepoint Conditions
The simplest sort of tracepoint collects data every time your program reaches a specifiedplace. You can also specify a condition for a tracepoint. A condition is just a Booleanexpression in your programming language (see Section 10.1 [Expressions], page 97). Atracepoint with a condition evaluates the expression each time your program reaches it,and data collection happens only if the condition is true.
Tracepoint conditions can be specified when a tracepoint is set, by using ‘if’ in thearguments to the trace command. See Section 13.1.1 [Setting Tracepoints], page 140.They can also be set or changed at any time with the condition command, just as withbreakpoints.
Unlike breakpoint conditions, gdb does not actually evaluate the conditional expressionitself. Instead, gdb encodes the expression into an agent expression (see Appendix F [AgentExpressions], page 525) suitable for execution on the target, independently of gdb. Globalvariables become raw memory locations, locals become stack accesses, and so forth.
For instance, suppose you have a function that is usually called frequently, but shouldnot be called after an error has occurred. You could use the following tracepoint commandto collect data about calls of that function that happen while the error code is propagatingthrough the program; an unconditional tracepoint could end up collecting thousands ofuseless trace frames that you would have to search through.
(gdb) trace normal_operation if errcode > 0
13.1.5 Trace State Variables
A trace state variable is a special type of variable that is created and managed by target-sidecode. The syntax is the same as that for GDB’s convenience variables (a string prefixed
144 Debugging with gdb
with “$”), but they are stored on the target. They must be created explicitly, using atvariable command. They are always 64-bit signed integers.
Trace state variables are remembered by gdb, and downloaded to the target along withtracepoint information when the trace experiment starts. There are no intrinsic limits onthe number of trace state variables, beyond memory limitations of the target.
Although trace state variables are managed by the target, you can use them in printcommands and expressions as if they were convenience variables; gdb will get the currentvalue from the target while the trace experiment is running. Trace state variables share thesame namespace as other “$” variables, which means that you cannot have trace state vari-ables with names like $23 or $pc, nor can you have a trace state variable and a conveniencevariable with the same name.
tvariable $name [ = expression ]
The tvariable command creates a new trace state variable named $name ,and optionally gives it an initial value of expression. expression is evaluatedwhen this command is entered; the result will be converted to an integer ifpossible, otherwise gdb will report an error. A subsequent tvariable commandspecifying the same name does not create a variable, but instead assigns thesupplied initial value to the existing variable of that name, overwriting anyprevious initial value. The default initial value is 0.
info tvariables
List all the trace state variables along with their initial values. Their currentvalues may also be displayed, if the trace experiment is currently running.
delete tvariable [ $name ... ]Delete the given trace state variables, or all of them if no arguments are speci-fied.
13.1.6 Tracepoint Action Lists
actions [num ]This command will prompt for a list of actions to be taken when the tracepointis hit. If the tracepoint number num is not specified, this command sets theactions for the one that was most recently defined (so that you can define atracepoint and then say actions without bothering about its number). Youspecify the actions themselves on the following lines, one action at a time, andterminate the actions list with a line containing just end. So far, the onlydefined actions are collect, teval, and while-stepping.
actions is actually equivalent to commands (see Section 5.1.7 [Breakpoint Com-mand Lists], page 59), except that only the defined actions are allowed; anyother gdb command is rejected.
To remove all actions from a tracepoint, type ‘actions num ’ and follow it im-mediately with ‘end’.
(gdb) collect data // collect some data
(gdb) while-stepping 5 // single-step 5 times, collect data
(gdb) end // signals the end of actions.
Chapter 13: Tracepoints 145
In the following example, the action list begins with collect commands in-dicating the things to be collected when the tracepoint is hit. Then, in orderto single-step and collect additional data following the tracepoint, a while-
stepping command is used, followed by the list of things to be collected aftereach step in a sequence of single steps. The while-stepping command is ter-minated by its own separate end command. Lastly, the action list is terminatedby an end command.
(gdb) trace foo(gdb) actionsEnter actions for tracepoint 1, one per line:
> collect bar,baz
> collect $regs
> while-stepping 12
> collect $pc, arr[i]
> end
end
collect[/mods ] expr1, expr2, ...
Collect values of the given expressions when the tracepoint is hit. This com-mand accepts a comma-separated list of any valid expressions. In addition toglobal, static, or local variables, the following special arguments are supported:
$regs Collect all registers.
$args Collect all function arguments.
$locals Collect all local variables.
$_ret Collect the return address. This is helpful if you want to see moreof a backtrace.
$_sdata Collect static tracepoint marker specific data. Only available forstatic tracepoints. See Section 13.1.6 [Tracepoint Action Lists],page 144. On the UST static tracepoints library backend, an in-strumentation point resembles a printf function call. The tracinglibrary is able to collect user specified data formatted to a characterstring using the format provided by the programmer that instru-mented the program. Other backends have similar mechanisms.Here’s an example of a UST marker call:
const char master_name[] = "$your_name";
trace_mark(channel1, marker1, "hello %s", master_name)
In this case, collecting $_sdata collects the string ‘hello$yourname’. When analyzing the trace buffer, you can inspect‘$_sdata’ like any other variable available to gdb.
You can give several consecutive collect commands, each one with a singleargument, or one collect command with several arguments separated by com-mas; the effect is the same.
The optional mods changes the usual handling of the arguments. s requeststhat pointers to chars be handled as strings, in particular collecting the contentsof the memory being pointed at, up to the first zero. The upper bound is bydefault the value of the print elements variable; if s is followed by a decimal
146 Debugging with gdb
number, that is the upper bound instead. So for instance ‘collect/s25 mystr’collects as many as 25 characters at ‘mystr’.
The command info scope (see Chapter 16 [Symbols], page 189) is particularlyuseful for figuring out what data to collect.
teval expr1, expr2, ...
Evaluate the given expressions when the tracepoint is hit. This command ac-cepts a comma-separated list of expressions. The results are discarded, so thisis mainly useful for assigning values to trace state variables (see Section 13.1.5[Trace State Variables], page 143) without adding those values to the tracebuffer, as would be the case if the collect action were used.
while-stepping n
Perform n single-step instruction traces after the tracepoint, collecting new dataafter each step. The while-stepping command is followed by the list of whatto collect while stepping (followed by its own end command):
> while-stepping 12
> collect $regs, myglobal
> end
>
Note that $pc is not automatically collected by while-stepping; you needto explicitly collect that register if you need it. You may abbreviate while-
stepping as ws or stepping.
set default-collect expr1, expr2, ...
This variable is a list of expressions to collect at each tracepoint hit. It iseffectively an additional collect action prepended to every tracepoint actionlist. The expressions are parsed individually for each tracepoint, so for instancea variable named xyz may be interpreted as a global for one tracepoint, and alocal for another, as appropriate to the tracepoint’s location.
show default-collect
Show the list of expressions that are collected by default at each tracepoint hit.
13.1.7 Listing Tracepoints
info tracepoints [num...]Display information about the tracepoint num. If you don’t specify a tracepointnumber, displays information about all the tracepoints defined so far. Theformat is similar to that used for info breakpoints; in fact, info tracepoints
is the same command, simply restricting itself to tracepoints.
A tracepoint’s listing may include additional information specific to tracing:
• its passcount as given by the passcount n command(gdb) info traceNum Type Disp Enb Address What
1 tracepoint keep y 0x0804ab57 in foo() at main.cxx:7
while-stepping 20
collect globfoo, $regs
end
collect globfoo2
end
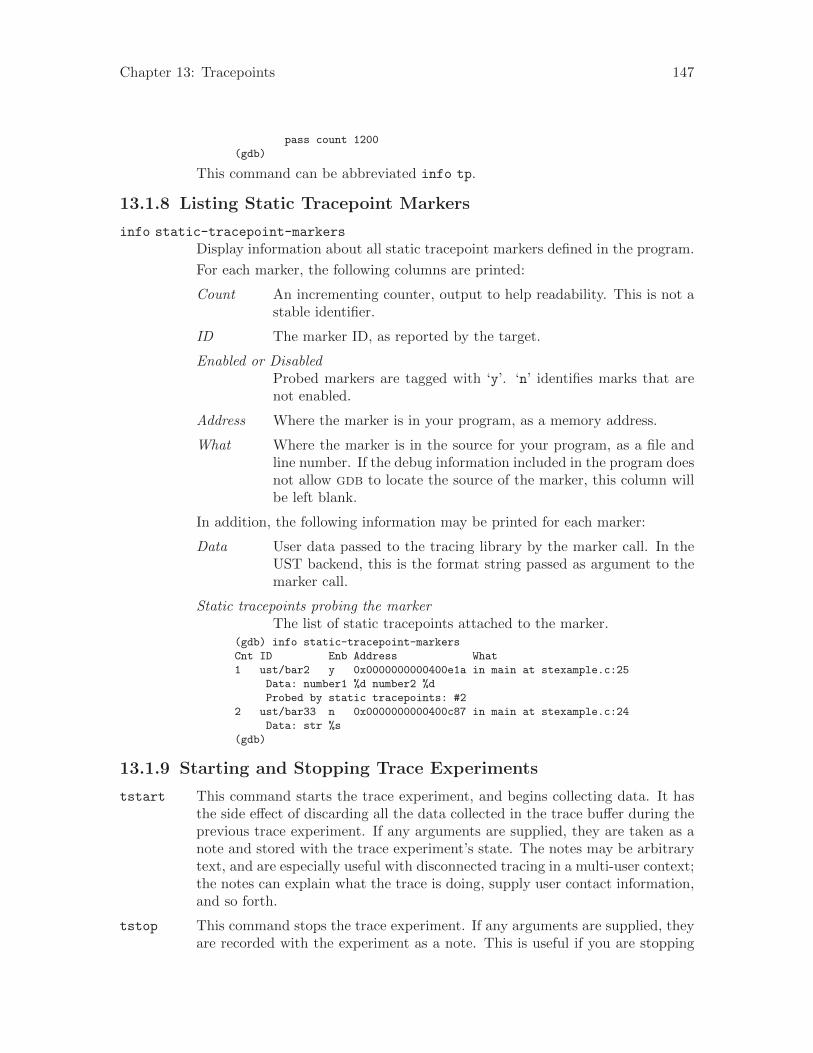
Chapter 13: Tracepoints 147
pass count 1200
(gdb)
This command can be abbreviated info tp.
13.1.8 Listing Static Tracepoint Markers
info static-tracepoint-markers
Display information about all static tracepoint markers defined in the program.
For each marker, the following columns are printed:
Count An incrementing counter, output to help readability. This is not astable identifier.
ID The marker ID, as reported by the target.
Enabled or DisabledProbed markers are tagged with ‘y’. ‘n’ identifies marks that arenot enabled.
Address Where the marker is in your program, as a memory address.
What Where the marker is in the source for your program, as a file andline number. If the debug information included in the program doesnot allow gdb to locate the source of the marker, this column willbe left blank.
In addition, the following information may be printed for each marker:
Data User data passed to the tracing library by the marker call. In theUST backend, this is the format string passed as argument to themarker call.
Static tracepoints probing the markerThe list of static tracepoints attached to the marker.
(gdb) info static-tracepoint-markers
Cnt ID Enb Address What
1 ust/bar2 y 0x0000000000400e1a in main at stexample.c:25
Data: number1 %d number2 %d
Probed by static tracepoints: #2
2 ust/bar33 n 0x0000000000400c87 in main at stexample.c:24
Data: str %s
(gdb)
13.1.9 Starting and Stopping Trace Experiments
tstart This command starts the trace experiment, and begins collecting data. It hasthe side effect of discarding all the data collected in the trace buffer during theprevious trace experiment. If any arguments are supplied, they are taken as anote and stored with the trace experiment’s state. The notes may be arbitrarytext, and are especially useful with disconnected tracing in a multi-user context;the notes can explain what the trace is doing, supply user contact information,and so forth.
tstop This command stops the trace experiment. If any arguments are supplied, theyare recorded with the experiment as a note. This is useful if you are stopping
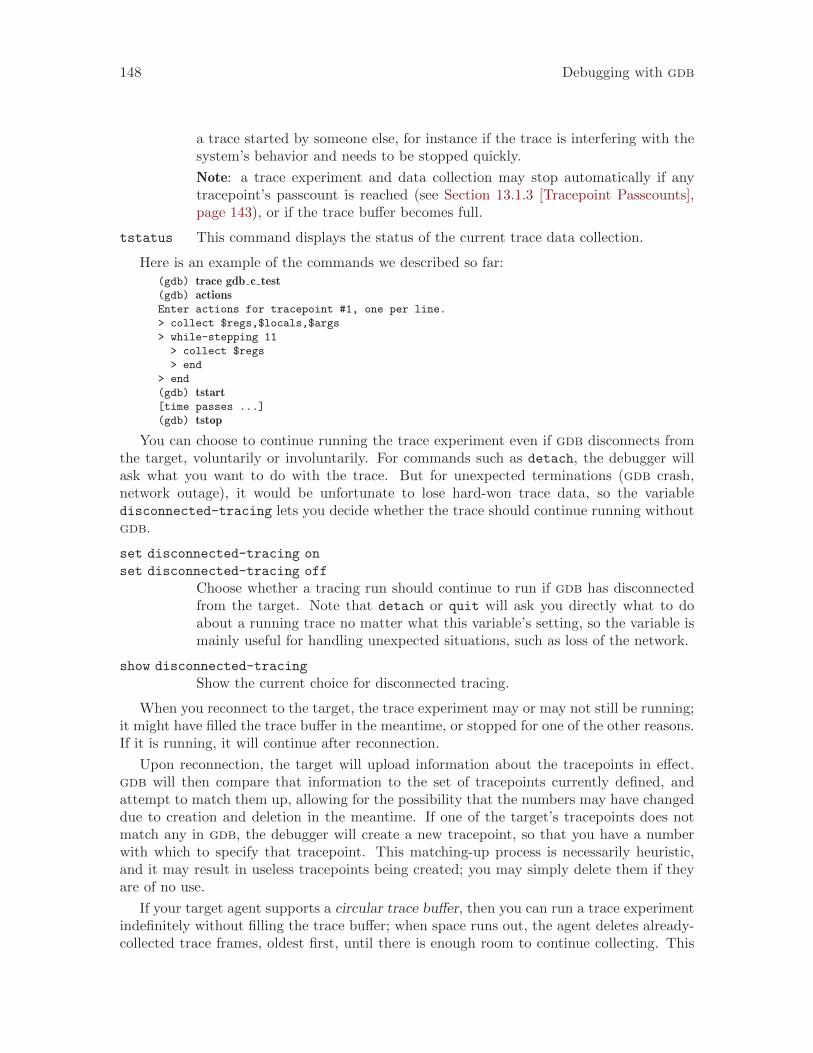
148 Debugging with gdb
a trace started by someone else, for instance if the trace is interfering with thesystem’s behavior and needs to be stopped quickly.
Note: a trace experiment and data collection may stop automatically if anytracepoint’s passcount is reached (see Section 13.1.3 [Tracepoint Passcounts],page 143), or if the trace buffer becomes full.
tstatus This command displays the status of the current trace data collection.
Here is an example of the commands we described so far:(gdb) trace gdb c test(gdb) actionsEnter actions for tracepoint #1, one per line.
> collect $regs,$locals,$args
> while-stepping 11
> collect $regs
> end
> end
(gdb) tstart[time passes ...]
(gdb) tstop
You can choose to continue running the trace experiment even if gdb disconnects fromthe target, voluntarily or involuntarily. For commands such as detach, the debugger willask what you want to do with the trace. But for unexpected terminations (gdb crash,network outage), it would be unfortunate to lose hard-won trace data, so the variabledisconnected-tracing lets you decide whether the trace should continue running withoutgdb.
set disconnected-tracing on
set disconnected-tracing off
Choose whether a tracing run should continue to run if gdb has disconnectedfrom the target. Note that detach or quit will ask you directly what to doabout a running trace no matter what this variable’s setting, so the variable ismainly useful for handling unexpected situations, such as loss of the network.
show disconnected-tracing
Show the current choice for disconnected tracing.
When you reconnect to the target, the trace experiment may or may not still be running;it might have filled the trace buffer in the meantime, or stopped for one of the other reasons.If it is running, it will continue after reconnection.
Upon reconnection, the target will upload information about the tracepoints in effect.gdb will then compare that information to the set of tracepoints currently defined, andattempt to match them up, allowing for the possibility that the numbers may have changeddue to creation and deletion in the meantime. If one of the target’s tracepoints does notmatch any in gdb, the debugger will create a new tracepoint, so that you have a numberwith which to specify that tracepoint. This matching-up process is necessarily heuristic,and it may result in useless tracepoints being created; you may simply delete them if theyare of no use.
If your target agent supports a circular trace buffer, then you can run a trace experimentindefinitely without filling the trace buffer; when space runs out, the agent deletes already-collected trace frames, oldest first, until there is enough room to continue collecting. This
Chapter 13: Tracepoints 149
is especially useful if your tracepoints are being hit too often, and your trace gets termi-nated prematurely because the buffer is full. To ask for a circular trace buffer, simply set‘circular-trace-buffer’ to on. You can set this at any time, including during tracing;if the agent can do it, it will change buffer handling on the fly, otherwise it will not takeeffect until the next run.
set circular-trace-buffer on
set circular-trace-buffer off
Choose whether a tracing run should use a linear or circular buffer for tracedata. A linear buffer will not lose any trace data, but may fill up prematurely,while a circular buffer will discard old trace data, but it will have always roomfor the latest tracepoint hits.
show circular-trace-buffer
Show the current choice for the trace buffer. Note that this may not match theagent’s current buffer handling, nor is it guaranteed to match the setting thatmight have been in effect during a past run, for instance if you are looking atframes from a trace file.
set trace-user text
show trace-user
set trace-notes text
Set the trace run’s notes.
show trace-notes
Show the trace run’s notes.
set trace-stop-notes text
Set the trace run’s stop notes. The handling of the note is as for tstop argu-ments; the set command is convenient way to fix a stop note that is mistakenor incomplete.
show trace-stop-notes
Show the trace run’s stop notes.
13.1.10 Tracepoint Restrictions
There are a number of restrictions on the use of tracepoints. As described above, tracepointdata gathering occurs on the target without interaction from gdb. Thus the full capabilitiesof the debugger are not available during data gathering, and then at data examination time,you will be limited by only having what was collected. The following items describe somecommon problems, but it is not exhaustive, and you may run into additional difficulties notmentioned here.
• Tracepoint expressions are intended to gather objects (lvalues). Thus the full flexibilityof GDB’s expression evaluator is not available. You cannot call functions, cast objectsto aggregate types, access convenience variables or modify values (except by assignmentto trace state variables). Some language features may implicitly call functions (forinstance Objective-C fields with accessors), and therefore cannot be collected either.
• Collection of local variables, either individually or in bulk with $locals or $args,during while-stepping may behave erratically. The stepping action may enter a newscope (for instance by stepping into a function), or the location of the variable may
150 Debugging with gdb
change (for instance it is loaded into a register). The tracepoint data recorded uses thelocation information for the variables that is correct for the tracepoint location. Whenthe tracepoint is created, it is not possible, in general, to determine where the stepsof a while-stepping sequence will advance the program—particularly if a conditionalbranch is stepped.
• Collection of an incompletely-initialized or partially-destroyed object may result insomething that gdb cannot display, or displays in a misleading way.
• When gdb displays a pointer to character it automatically dereferences the pointer toalso display characters of the string being pointed to. However, collecting the pointerduring tracing does not automatically collect the string. You need to explicitly deref-erence the pointer and provide size information if you want to collect not only thepointer, but the memory pointed to. For example, *ptr@50 can be used to collect the50 element array pointed to by ptr.
• It is not possible to collect a complete stack backtrace at a tracepoint. Instead, you maycollect the registers and a few hundred bytes from the stack pointer with somethinglike *(unsigned char *)$esp@300 (adjust to use the name of the actual stack pointerregister on your target architecture, and the amount of stack you wish to capture).Then the backtrace command will show a partial backtrace when using a trace frame.The number of stack frames that can be examined depends on the sizes of the framesin the collected stack. Note that if you ask for a block so large that it goes past thebottom of the stack, the target agent may report an error trying to read from an invalidaddress.
• If you do not collect registers at a tracepoint, gdb can infer that the value of $pcmust be the same as the address of the tracepoint and use that when you are lookingat a trace frame for that tracepoint. However, this cannot work if the tracepoint hasmultiple locations (for instance if it was set in a function that was inlined), or if it hasa while-stepping loop. In those cases gdb will warn you that it can’t infer $pc, anddefault it to zero.
13.2 Using the Collected Data
After the tracepoint experiment ends, you use gdb commands for examining the tracedata. The basic idea is that each tracepoint collects a trace snapshot every time it ishit and another snapshot every time it single-steps. All these snapshots are consecutivelynumbered from zero and go into a buffer, and you can examine them later. The way youexamine them is to focus on a specific trace snapshot. When the remote stub is focused on atrace snapshot, it will respond to all gdb requests for memory and registers by reading fromthe buffer which belongs to that snapshot, rather than from real memory or registers of theprogram being debugged. This means that all gdb commands (print, info registers,backtrace, etc.) will behave as if we were currently debugging the program state as it waswhen the tracepoint occurred. Any requests for data that are not in the buffer will fail.
13.2.1 tfind n
The basic command for selecting a trace snapshot from the buffer is tfind n , which findstrace snapshot number n, counting from zero. If no argument n is given, the next snapshotis selected.
Chapter 13: Tracepoints 151
Here are the various forms of using the tfind command.
tfind start
Find the first snapshot in the buffer. This is a synonym for tfind 0 (since 0 isthe number of the first snapshot).
tfind none
Stop debugging trace snapshots, resume live debugging.
tfind end Same as ‘tfind none’.
tfind No argument means find the next trace snapshot.
tfind - Find the previous trace snapshot before the current one. This permits retracingearlier steps.
tfind tracepoint num
Find the next snapshot associated with tracepoint num. Search proceeds for-ward from the last examined trace snapshot. If no argument num is given, itmeans find the next snapshot collected for the same tracepoint as the currentsnapshot.
tfind pc addr
Find the next snapshot associated with the value addr of the program counter.Search proceeds forward from the last examined trace snapshot. If no argumentaddr is given, it means find the next snapshot with the same value of PC asthe current snapshot.
tfind outside addr1, addr2
Find the next snapshot whose PC is outside the given range of addresses (ex-clusive).
tfind range addr1, addr2
Find the next snapshot whose PC is between addr1 and addr2 (inclusive).
tfind line [file:]nFind the next snapshot associated with the source line n. If the optional argu-ment file is given, refer to line n in that source file. Search proceeds forwardfrom the last examined trace snapshot. If no argument n is given, it means findthe next line other than the one currently being examined; thus saying tfind
line repeatedly can appear to have the same effect as stepping from line toline in a live debugging session.
The default arguments for the tfind commands are specifically designed to make it easyto scan through the trace buffer. For instance, tfind with no argument selects the nexttrace snapshot, and tfind - with no argument selects the previous trace snapshot. So, bygiving one tfind command, and then simply hitting RET repeatedly you can examine allthe trace snapshots in order. Or, by saying tfind - and then hitting RET repeatedly youcan examine the snapshots in reverse order. The tfind line command with no argumentselects the snapshot for the next source line executed. The tfind pc command with noargument selects the next snapshot with the same program counter (PC) as the currentframe. The tfind tracepoint command with no argument selects the next trace snapshotcollected by the same tracepoint as the current one.
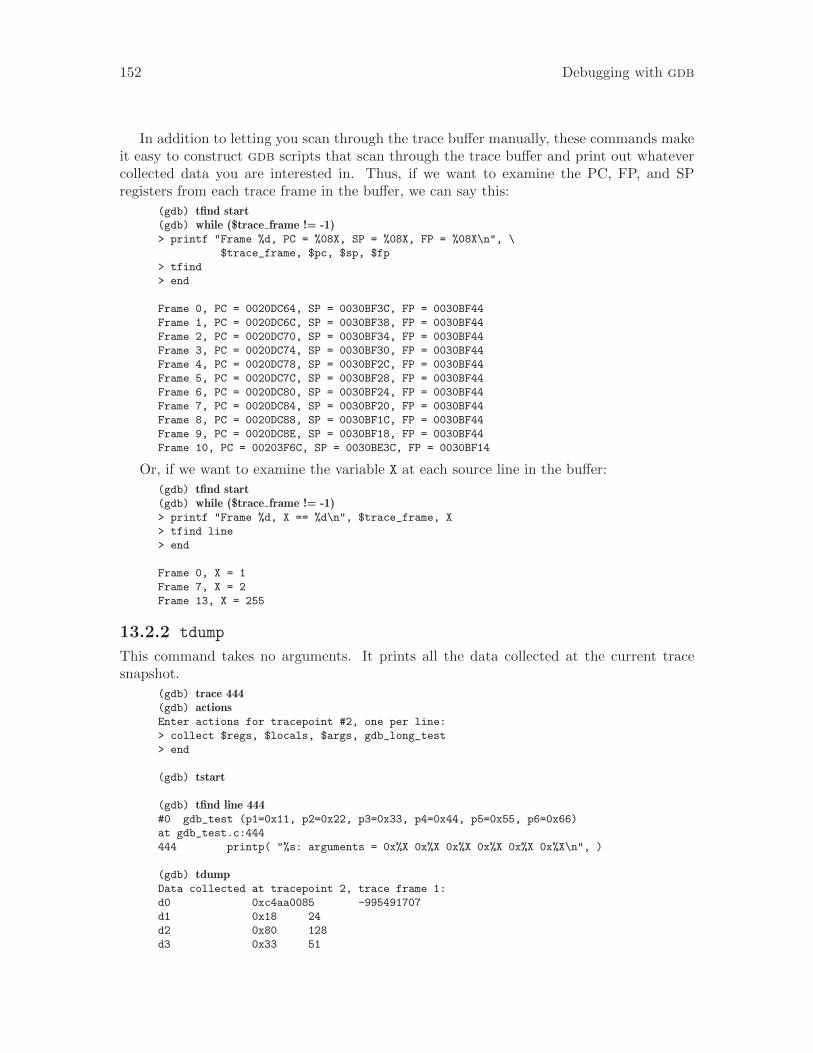
152 Debugging with gdb
In addition to letting you scan through the trace buffer manually, these commands makeit easy to construct gdb scripts that scan through the trace buffer and print out whatevercollected data you are interested in. Thus, if we want to examine the PC, FP, and SPregisters from each trace frame in the buffer, we can say this:
(gdb) tfind start(gdb) while ($trace frame != -1)> printf "Frame %d, PC = %08X, SP = %08X, FP = %08X\n", \
$trace_frame, $pc, $sp, $fp
> tfind
> end
Frame 0, PC = 0020DC64, SP = 0030BF3C, FP = 0030BF44
Frame 1, PC = 0020DC6C, SP = 0030BF38, FP = 0030BF44
Frame 2, PC = 0020DC70, SP = 0030BF34, FP = 0030BF44
Frame 3, PC = 0020DC74, SP = 0030BF30, FP = 0030BF44
Frame 4, PC = 0020DC78, SP = 0030BF2C, FP = 0030BF44
Frame 5, PC = 0020DC7C, SP = 0030BF28, FP = 0030BF44
Frame 6, PC = 0020DC80, SP = 0030BF24, FP = 0030BF44
Frame 7, PC = 0020DC84, SP = 0030BF20, FP = 0030BF44
Frame 8, PC = 0020DC88, SP = 0030BF1C, FP = 0030BF44
Frame 9, PC = 0020DC8E, SP = 0030BF18, FP = 0030BF44
Frame 10, PC = 00203F6C, SP = 0030BE3C, FP = 0030BF14
Or, if we want to examine the variable X at each source line in the buffer:
(gdb) tfind start(gdb) while ($trace frame != -1)> printf "Frame %d, X == %d\n", $trace_frame, X
> tfind line
> end
Frame 0, X = 1
Frame 7, X = 2
Frame 13, X = 255
13.2.2 tdump
This command takes no arguments. It prints all the data collected at the current tracesnapshot.
(gdb) trace 444(gdb) actionsEnter actions for tracepoint #2, one per line:
> collect $regs, $locals, $args, gdb_long_test
> end
(gdb) tstart
(gdb) tfind line 444#0 gdb_test (p1=0x11, p2=0x22, p3=0x33, p4=0x44, p5=0x55, p6=0x66)
at gdb_test.c:444
444 printp( "%s: arguments = 0x%X 0x%X 0x%X 0x%X 0x%X 0x%X\n", )
(gdb) tdumpData collected at tracepoint 2, trace frame 1:
d0 0xc4aa0085 -995491707
d1 0x18 24
d2 0x80 128
d3 0x33 51
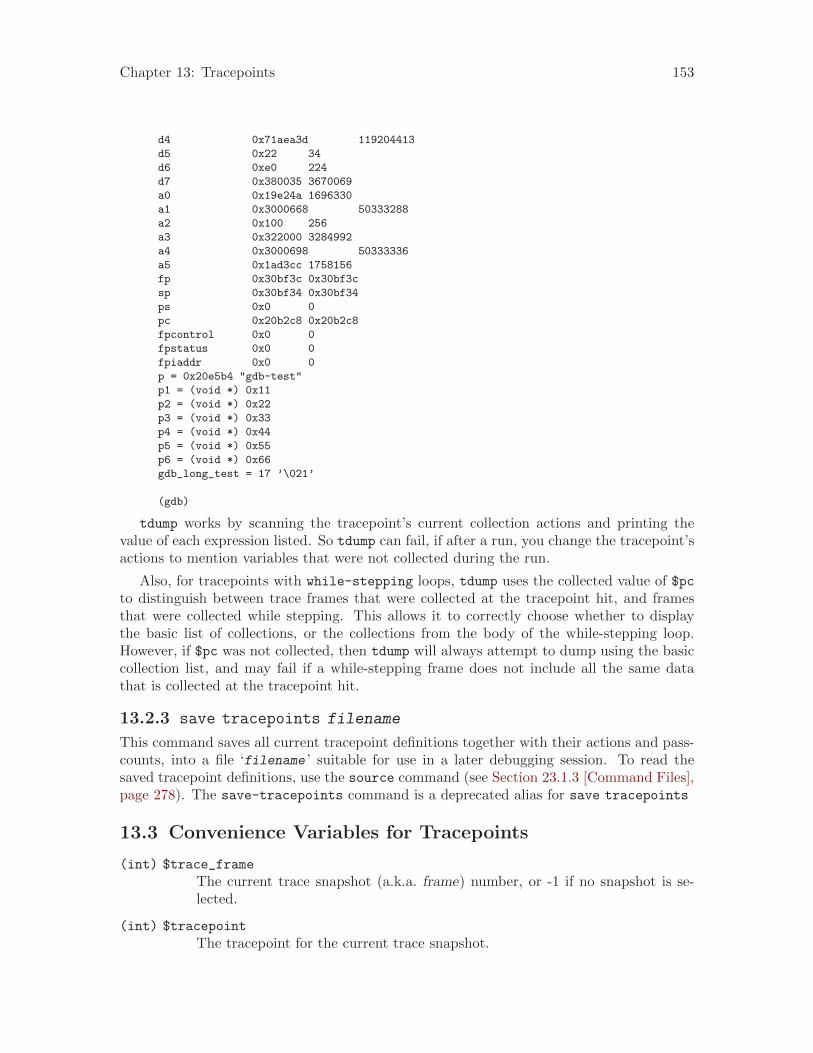
Chapter 13: Tracepoints 153
d4 0x71aea3d 119204413
d5 0x22 34
d6 0xe0 224
d7 0x380035 3670069
a0 0x19e24a 1696330
a1 0x3000668 50333288
a2 0x100 256
a3 0x322000 3284992
a4 0x3000698 50333336
a5 0x1ad3cc 1758156
fp 0x30bf3c 0x30bf3c
sp 0x30bf34 0x30bf34
ps 0x0 0
pc 0x20b2c8 0x20b2c8
fpcontrol 0x0 0
fpstatus 0x0 0
fpiaddr 0x0 0
p = 0x20e5b4 "gdb-test"
p1 = (void *) 0x11
p2 = (void *) 0x22
p3 = (void *) 0x33
p4 = (void *) 0x44
p5 = (void *) 0x55
p6 = (void *) 0x66
gdb_long_test = 17 ’\021’
(gdb)
tdump works by scanning the tracepoint’s current collection actions and printing thevalue of each expression listed. So tdump can fail, if after a run, you change the tracepoint’sactions to mention variables that were not collected during the run.
Also, for tracepoints with while-stepping loops, tdump uses the collected value of $pcto distinguish between trace frames that were collected at the tracepoint hit, and framesthat were collected while stepping. This allows it to correctly choose whether to displaythe basic list of collections, or the collections from the body of the while-stepping loop.However, if $pc was not collected, then tdump will always attempt to dump using the basiccollection list, and may fail if a while-stepping frame does not include all the same datathat is collected at the tracepoint hit.
13.2.3 save tracepoints filename
This command saves all current tracepoint definitions together with their actions and pass-counts, into a file ‘filename ’ suitable for use in a later debugging session. To read thesaved tracepoint definitions, use the source command (see Section 23.1.3 [Command Files],page 278). The save-tracepoints command is a deprecated alias for save tracepoints
13.3 Convenience Variables for Tracepoints
(int) $trace_frame
The current trace snapshot (a.k.a. frame) number, or -1 if no snapshot is se-lected.
(int) $tracepoint
The tracepoint for the current trace snapshot.
154 Debugging with gdb
(int) $trace_line
The line number for the current trace snapshot.
(char []) $trace_file
The source file for the current trace snapshot.
(char []) $trace_func
The name of the function containing $tracepoint.
Note: $trace_file is not suitable for use in printf, use output instead.
Here’s a simple example of using these convenience variables for stepping through all thetrace snapshots and printing some of their data. Note that these are not the same as tracestate variables, which are managed by the target.
(gdb) tfind start
(gdb) while $trace frame != -1> output $trace_file
> printf ", line %d (tracepoint #%d)\n", $trace_line, $tracepoint
> tfind
> end
13.4 Using Trace Files
In some situations, the target running a trace experiment may no longer be available;perhaps it crashed, or the hardware was needed for a different activity. To handle thesecases, you can arrange to dump the trace data into a file, and later use that file as a sourceof trace data, via the target tfile command.
tsave [ -r ] filename
Save the trace data to filename. By default, this command assumes that file-name refers to the host filesystem, so if necessary gdb will copy raw trace dataup from the target and then save it. If the target supports it, you can alsosupply the optional argument -r (“remote”) to direct the target to save thedata directly into filename in its own filesystem, which may be more efficientif the trace buffer is very large. (Note, however, that target tfile can onlyread from files accessible to the host.)
target tfile filename
Use the file named filename as a source of trace data. Commands that examinedata work as they do with a live target, but it is not possible to run any newtrace experiments. tstatus will report the state of the trace run at the momentthe data was saved, as well as the current trace frame you are examining.filename must be on a filesystem accessible to the host.
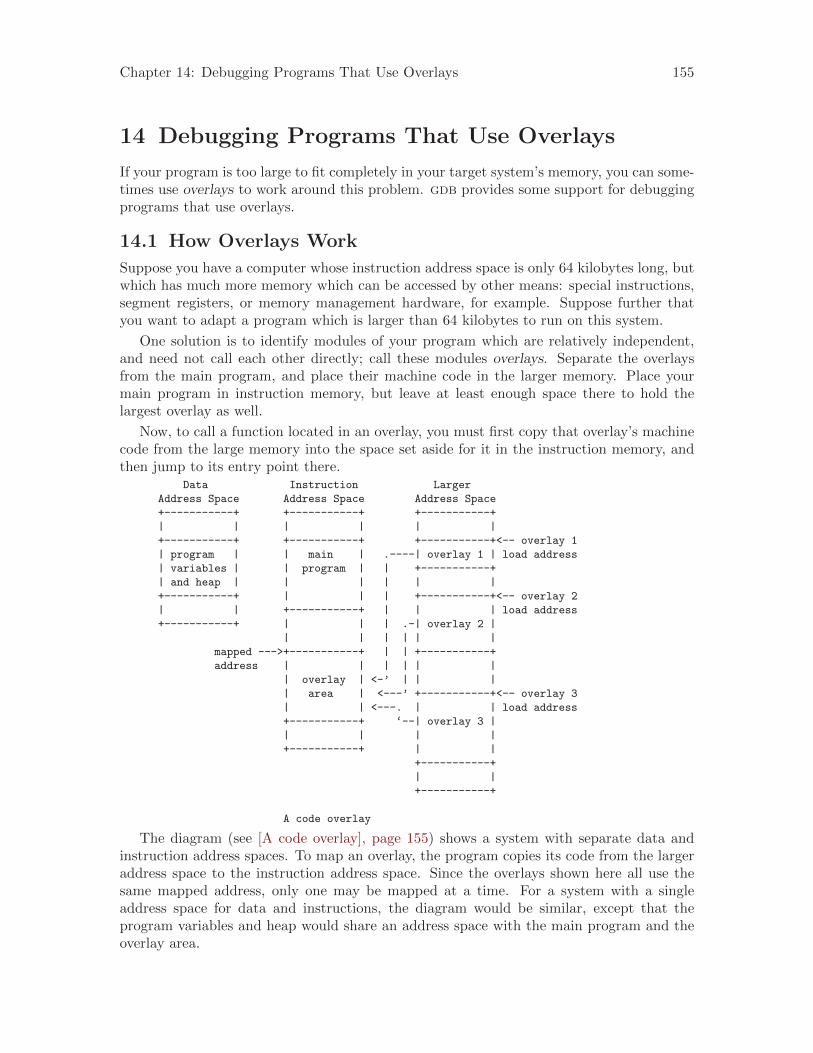
Chapter 14: Debugging Programs That Use Overlays 155
14 Debugging Programs That Use Overlays
If your program is too large to fit completely in your target system’s memory, you can some-times use overlays to work around this problem. gdb provides some support for debuggingprograms that use overlays.
14.1 How Overlays Work
Suppose you have a computer whose instruction address space is only 64 kilobytes long, butwhich has much more memory which can be accessed by other means: special instructions,segment registers, or memory management hardware, for example. Suppose further thatyou want to adapt a program which is larger than 64 kilobytes to run on this system.
One solution is to identify modules of your program which are relatively independent,and need not call each other directly; call these modules overlays. Separate the overlaysfrom the main program, and place their machine code in the larger memory. Place yourmain program in instruction memory, but leave at least enough space there to hold thelargest overlay as well.
Now, to call a function located in an overlay, you must first copy that overlay’s machinecode from the large memory into the space set aside for it in the instruction memory, andthen jump to its entry point there.
Data Instruction Larger
Address Space Address Space Address Space
+-----------+ +-----------+ +-----------+
| | | | | |
+-----------+ +-----------+ +-----------+<-- overlay 1
| program | | main | .----| overlay 1 | load address
| variables | | program | | +-----------+
| and heap | | | | | |
+-----------+ | | | +-----------+<-- overlay 2
| | +-----------+ | | | load address
+-----------+ | | | .-| overlay 2 |
| | | | | |
mapped --->+-----------+ | | +-----------+
address | | | | | |
| overlay | <-’ | | |
| area | <---’ +-----------+<-- overlay 3
| | <---. | | load address
+-----------+ ‘--| overlay 3 |
| | | |
+-----------+ | |
+-----------+
| |
+-----------+
A code overlay
The diagram (see [A code overlay], page 155) shows a system with separate data andinstruction address spaces. To map an overlay, the program copies its code from the largeraddress space to the instruction address space. Since the overlays shown here all use thesame mapped address, only one may be mapped at a time. For a system with a singleaddress space for data and instructions, the diagram would be similar, except that theprogram variables and heap would share an address space with the main program and theoverlay area.
156 Debugging with gdb
An overlay loaded into instruction memory and ready for use is called a mapped overlay;its mapped address is its address in the instruction memory. An overlay not present (or onlypartially present) in instruction memory is called unmapped; its load address is its addressin the larger memory. The mapped address is also called the virtual memory address, orVMA; the load address is also called the load memory address, or LMA.
Unfortunately, overlays are not a completely transparent way to adapt a program tolimited instruction memory. They introduce a new set of global constraints you must keepin mind as you design your program:
• Before calling or returning to a function in an overlay, your program must make surethat overlay is actually mapped. Otherwise, the call or return will transfer control tothe right address, but in the wrong overlay, and your program will probably crash.
• If the process of mapping an overlay is expensive on your system, you will need tochoose your overlays carefully to minimize their effect on your program’s performance.
• The executable file you load onto your system must contain each overlay’s instruc-tions, appearing at the overlay’s load address, not its mapped address. However, eachoverlay’s instructions must be relocated and its symbols defined as if the overlay wereat its mapped address. You can use GNU linker scripts to specify different load andrelocation addresses for pieces of your program; see Section “Overlay Description” inUsing ld: the GNU linker.
• The procedure for loading executable files onto your system must be able to load theircontents into the larger address space as well as the instruction and data spaces.
The overlay system described above is rather simple, and could be improved in manyways:
• If your system has suitable bank switch registers or memory management hardware,you could use those facilities to make an overlay’s load area contents simply appear attheir mapped address in instruction space. This would probably be faster than copyingthe overlay to its mapped area in the usual way.
• If your overlays are small enough, you could set aside more than one overlay area, andhave more than one overlay mapped at a time.
• You can use overlays to manage data, as well as instructions. In general, data overlaysare even less transparent to your design than code overlays: whereas code overlays onlyrequire care when you call or return to functions, data overlays require care every timeyou access the data. Also, if you change the contents of a data overlay, you must copyits contents back out to its load address before you can copy a different data overlayinto the same mapped area.
14.2 Overlay Commands
To use gdb’s overlay support, each overlay in your program must correspond to a separatesection of the executable file. The section’s virtual memory address and load memoryaddress must be the overlay’s mapped and load addresses. Identifying overlays with sectionsallows gdb to determine the appropriate address of a function or variable, depending onwhether the overlay is mapped or not.
gdb’s overlay commands all start with the word overlay; you can abbreviate this as ovor ovly. The commands are:
Chapter 14: Debugging Programs That Use Overlays 157
overlay off
Disable gdb’s overlay support. When overlay support is disabled, gdb assumesthat all functions and variables are always present at their mapped addresses.By default, gdb’s overlay support is disabled.
overlay manual
Enable manual overlay debugging. In this mode, gdb relies on you to tell itwhich overlays are mapped, and which are not, using the overlay map-overlay
and overlay unmap-overlay commands described below.
overlay map-overlay overlay
overlay map overlay
Tell gdb that overlay is now mapped; overlay must be the name of the objectfile section containing the overlay. When an overlay is mapped, gdb assumes itcan find the overlay’s functions and variables at their mapped addresses. gdbassumes that any other overlays whose mapped ranges overlap that of overlayare now unmapped.
overlay unmap-overlay overlay
overlay unmap overlay
Tell gdb that overlay is no longer mapped; overlay must be the name of theobject file section containing the overlay. When an overlay is unmapped, gdbassumes it can find the overlay’s functions and variables at their load addresses.
overlay auto
Enable automatic overlay debugging. In this mode, gdb consults a data struc-ture the overlay manager maintains in the inferior to see which overlays aremapped. For details, see Section 14.3 [Automatic Overlay Debugging], page 158.
overlay load-target
overlay load
Re-read the overlay table from the inferior. Normally, gdb re-reads the tablegdb automatically each time the inferior stops, so this command should onlybe necessary if you have changed the overlay mapping yourself using gdb. Thiscommand is only useful when using automatic overlay debugging.
overlay list-overlays
overlay list
Display a list of the overlays currently mapped, along with their mapped ad-dresses, load addresses, and sizes.
Normally, when gdb prints a code address, it includes the name of the function theaddress falls in:
(gdb) print main
$3 = {int ()} 0x11a0 <main>
When overlay debugging is enabled, gdb recognizes code in unmapped overlays, and printsthe names of unmapped functions with asterisks around them. For example, if foo is afunction in an unmapped overlay, gdb prints it this way:
(gdb) overlay list
No sections are mapped.
(gdb) print foo
158 Debugging with gdb
$5 = {int (int)} 0x100000 <*foo*>
When foo’s overlay is mapped, gdb prints the function’s name normally:
(gdb) overlay list
Section .ov.foo.text, loaded at 0x100000 - 0x100034,
mapped at 0x1016 - 0x104a
(gdb) print foo
$6 = {int (int)} 0x1016 <foo>
When overlay debugging is enabled, gdb can find the correct address for functions andvariables in an overlay, whether or not the overlay is mapped. This allows most gdb com-mands, like break and disassemble, to work normally, even on unmapped code. However,gdb’s breakpoint support has some limitations:
• You can set breakpoints in functions in unmapped overlays, as long as gdb can writeto the overlay at its load address.
• gdb can not set hardware or simulator-based breakpoints in unmapped overlays. How-ever, if you set a breakpoint at the end of your overlay manager (and tell gdb whichoverlays are now mapped, if you are using manual overlay management), gdb will re-setits breakpoints properly.
14.3 Automatic Overlay Debugging
gdb can automatically track which overlays are mapped and which are not, given somesimple co-operation from the overlay manager in the inferior. If you enable automaticoverlay debugging with the overlay auto command (see Section 14.2 [Overlay Commands],page 156), gdb looks in the inferior’s memory for certain variables describing the currentstate of the overlays.
Here are the variables your overlay manager must define to support gdb’s automaticoverlay debugging:
_ovly_table:This variable must be an array of the following structures:
struct
{
/* The overlay’s mapped address. */
unsigned long vma;
/* The size of the overlay, in bytes. */
unsigned long size;
/* The overlay’s load address. */
unsigned long lma;
/* Non-zero if the overlay is currently mapped;
zero otherwise. */
unsigned long mapped;
}
_novlys: This variable must be a four-byte signed integer, holding the total number ofelements in _ovly_table.
To decide whether a particular overlay is mapped or not, gdb looks for an entry in_ovly_table whose vma and lma members equal the VMA and LMA of the overlay’s section
Chapter 14: Debugging Programs That Use Overlays 159
in the executable file. When gdb finds a matching entry, it consults the entry’s mapped
member to determine whether the overlay is currently mapped.
In addition, your overlay manager may define a function called _ovly_debug_event. Ifthis function is defined, gdb will silently set a breakpoint there. If the overlay managerthen calls this function whenever it has changed the overlay table, this will enable gdb toaccurately keep track of which overlays are in program memory, and update any breakpointsthat may be set in overlays. This will allow breakpoints to work even if the overlays arekept in ROM or other non-writable memory while they are not being executed.
14.4 Overlay Sample Program
When linking a program which uses overlays, you must place the overlays at their loadaddresses, while relocating them to run at their mapped addresses. To do this, you mustwrite a linker script (see Section “Overlay Description” in Using ld: the GNU linker). Un-fortunately, since linker scripts are specific to a particular host system, target architecture,and target memory layout, this manual cannot provide portable sample code demonstratinggdb’s overlay support.
However, the gdb source distribution does contain an overlaid program, with linkerscripts for a few systems, as part of its test suite. The program consists of the followingfiles from ‘gdb/testsuite/gdb.base’:
‘overlays.c’The main program file.
‘ovlymgr.c’A simple overlay manager, used by ‘overlays.c’.
‘foo.c’‘bar.c’‘baz.c’‘grbx.c’ Overlay modules, loaded and used by ‘overlays.c’.
‘d10v.ld’‘m32r.ld’ Linker scripts for linking the test program on the d10v-elf and m32r-elf
targets.
You can build the test program using the d10v-elf GCC cross-compiler like this:$ d10v-elf-gcc -g -c overlays.c
$ d10v-elf-gcc -g -c ovlymgr.c
$ d10v-elf-gcc -g -c foo.c
$ d10v-elf-gcc -g -c bar.c
$ d10v-elf-gcc -g -c baz.c
$ d10v-elf-gcc -g -c grbx.c
$ d10v-elf-gcc -g overlays.o ovlymgr.o foo.o bar.o \
baz.o grbx.o -Wl,-Td10v.ld -o overlays
The build process is identical for any other architecture, except that you must substitutethe appropriate compiler and linker script for the target system for d10v-elf-gcc andd10v.ld.

Chapter 15: Using gdb with Different Languages 161
15 Using gdb with Different Languages
Although programming languages generally have common aspects, they are rarely expressedin the same manner. For instance, in ANSI C, dereferencing a pointer p is accomplishedby *p, but in Modula-2, it is accomplished by p^. Values can also be represented (anddisplayed) differently. Hex numbers in C appear as ‘0x1ae’, while in Modula-2 they appearas ‘1AEH’.
Language-specific information is built into gdb for some languages, allowing you toexpress operations like the above in your program’s native language, and allowing gdb tooutput values in a manner consistent with the syntax of your program’s native language.The language you use to build expressions is called the working language.
15.1 Switching Between Source Languages
There are two ways to control the working language—either have gdb set it automatically,or select it manually yourself. You can use the set language command for either purpose.On startup, gdb defaults to setting the language automatically. The working language isused to determine how expressions you type are interpreted, how values are printed, etc.
In addition to the working language, every source file that gdb knows about has itsown working language. For some object file formats, the compiler might indicate whichlanguage a particular source file is in. However, most of the time gdb infers the languagefrom the name of the file. The language of a source file controls whether C++ names aredemangled—this way backtrace can show each frame appropriately for its own language.There is no way to set the language of a source file from within gdb, but you can set thelanguage associated with a filename extension. See Section 15.2 [Displaying the Language],page 162.
This is most commonly a problem when you use a program, such as cfront or f2c, thatgenerates C but is written in another language. In that case, make the program use #linedirectives in its C output; that way gdb will know the correct language of the source codeof the original program, and will display that source code, not the generated C code.
15.1.1 List of Filename Extensions and Languages
If a source file name ends in one of the following extensions, then gdb infers that its languageis the one indicated.
‘.ada’‘.ads’‘.adb’‘.a’ Ada source file.
‘.c’ C source file
‘.C’‘.cc’‘.cp’‘.cpp’‘.cxx’‘.c++’ C++ source file
162 Debugging with gdb
‘.d’ D source file
‘.m’ Objective-C source file
‘.f’‘.F’ Fortran source file
‘.mod’ Modula-2 source file
‘.s’‘.S’ Assembler source file. This actually behaves almost like C, but gdb does not
skip over function prologues when stepping.
In addition, you may set the language associated with a filename extension. SeeSection 15.2 [Displaying the Language], page 162.
15.1.2 Setting the Working Language
If you allow gdb to set the language automatically, expressions are interpreted the sameway in your debugging session and your program.
If you wish, you may set the language manually. To do this, issue the command ‘setlanguage lang ’, where lang is the name of a language, such as c or modula-2. For a listof the supported languages, type ‘set language’.
Setting the language manually prevents gdb from updating the working language au-tomatically. This can lead to confusion if you try to debug a program when the workinglanguage is not the same as the source language, when an expression is acceptable to bothlanguages—but means different things. For instance, if the current source file were writtenin C, and gdb was parsing Modula-2, a command such as:
print a = b + c
might not have the effect you intended. In C, this means to add b and c and place theresult in a. The result printed would be the value of a. In Modula-2, this means to comparea to the result of b+c, yielding a BOOLEAN value.
15.1.3 Having gdb Infer the Source Language
To have gdb set the working language automatically, use ‘set language local’ or ‘setlanguage auto’. gdb then infers the working language. That is, when your program stopsin a frame (usually by encountering a breakpoint), gdb sets the working language to thelanguage recorded for the function in that frame. If the language for a frame is unknown(that is, if the function or block corresponding to the frame was defined in a source file thatdoes not have a recognized extension), the current working language is not changed, andgdb issues a warning.
This may not seem necessary for most programs, which are written entirely in one sourcelanguage. However, program modules and libraries written in one source language can beused by a main program written in a different source language. Using ‘set language auto’in this case frees you from having to set the working language manually.
15.2 Displaying the Language
The following commands help you find out which language is the working language, andalso what language source files were written in.
Chapter 15: Using gdb with Different Languages 163
show language
Display the current working language. This is the language you can use withcommands such as print to build and compute expressions that may involvevariables in your program.
info frame
Display the source language for this frame. This language becomes the workinglanguage if you use an identifier from this frame. See Section 8.4 [Informationabout a Frame], page 85, to identify the other information listed here.
info source
Display the source language of this source file. See Chapter 16 [Examining theSymbol Table], page 189, to identify the other information listed here.
In unusual circumstances, you may have source files with extensions not in the standardlist. You can then set the extension associated with a language explicitly:
set extension-language ext language
Tell gdb that source files with extension ext are to be assumed as written inthe source language language.
info extensions
List all the filename extensions and the associated languages.
15.3 Type and Range Checking
Warning: In this release, the gdb commands for type and range checking areincluded, but they do not yet have any effect. This section documents theintended facilities.
Some languages are designed to guard you against making seemingly common errorsthrough a series of compile- and run-time checks. These include checking the type ofarguments to functions and operators, and making sure mathematical overflows are caughtat run time. Checks such as these help to ensure a program’s correctness once it has beencompiled by eliminating type mismatches, and providing active checks for range errors whenyour program is running.
gdb can check for conditions like the above if you wish. Although gdb does not checkthe statements in your program, it can check expressions entered directly into gdb forevaluation via the print command, for example. As with the working language, gdb canalso decide whether or not to check automatically based on your program’s source language.See Section 15.4 [Supported Languages], page 165, for the default settings of supportedlanguages.
15.3.1 An Overview of Type Checking
Some languages, such as Modula-2, are strongly typed, meaning that the arguments tooperators and functions have to be of the correct type, otherwise an error occurs. Thesechecks prevent type mismatch errors from ever causing any run-time problems. For example,
1 + 2 ⇒ 3
buterror 1 + 2.3
164 Debugging with gdb
The second example fails because the CARDINAL 1 is not type-compatible with the REAL2.3.
For the expressions you use in gdb commands, you can tell the gdb type checker toskip checking; to treat any mismatches as errors and abandon the expression; or to onlyissue warnings when type mismatches occur, but evaluate the expression anyway. Whenyou choose the last of these, gdb evaluates expressions like the second example above, butalso issues a warning.
Even if you turn type checking off, there may be other reasons related to type thatprevent gdb from evaluating an expression. For instance, gdb does not know how to addan int and a struct foo. These particular type errors have nothing to do with the languagein use, and usually arise from expressions, such as the one described above, which makelittle sense to evaluate anyway.
Each language defines to what degree it is strict about type. For instance, both Modula-2 and C require the arguments to arithmetical operators to be numbers. In C, enumeratedtypes and pointers can be represented as numbers, so that they are valid arguments tomathematical operators. See Section 15.4 [Supported Languages], page 165, for furtherdetails on specific languages.
gdb provides some additional commands for controlling the type checker:
set check type auto
Set type checking on or off based on the current working language. SeeSection 15.4 [Supported Languages], page 165, for the default settings for eachlanguage.
set check type on
set check type off
Set type checking on or off, overriding the default setting for the current workinglanguage. Issue a warning if the setting does not match the language default.If any type mismatches occur in evaluating an expression while type checkingis on, gdb prints a message and aborts evaluation of the expression.
set check type warn
Cause the type checker to issue warnings, but to always attempt to evaluate theexpression. Evaluating the expression may still be impossible for other reasons.For example, gdb cannot add numbers and structures.
show type Show the current setting of the type checker, and whether or not gdb is settingit automatically.
15.3.2 An Overview of Range Checking
In some languages (such as Modula-2), it is an error to exceed the bounds of a type; this isenforced with run-time checks. Such range checking is meant to ensure program correctnessby making sure computations do not overflow, or indices on an array element access do notexceed the bounds of the array.
For expressions you use in gdb commands, you can tell gdb to treat range errors in oneof three ways: ignore them, always treat them as errors and abandon the expression, orissue warnings but evaluate the expression anyway.
Chapter 15: Using gdb with Different Languages 165
A range error can result from numerical overflow, from exceeding an array index bound,or when you type a constant that is not a member of any type. Some languages, however,do not treat overflows as an error. In many implementations of C, mathematical overflowcauses the result to “wrap around” to lower values—for example, if m is the largest integervalue, and s is the smallest, then
m + 1 ⇒ s
This, too, is specific to individual languages, and in some cases specific to individualcompilers or machines. See Section 15.4 [Supported Languages], page 165, for furtherdetails on specific languages.
gdb provides some additional commands for controlling the range checker:
set check range auto
Set range checking on or off based on the current working language. SeeSection 15.4 [Supported Languages], page 165, for the default settings for eachlanguage.
set check range on
set check range off
Set range checking on or off, overriding the default setting for the current work-ing language. A warning is issued if the setting does not match the languagedefault. If a range error occurs and range checking is on, then a message isprinted and evaluation of the expression is aborted.
set check range warn
Output messages when the gdb range checker detects a range error, but at-tempt to evaluate the expression anyway. Evaluating the expression may stillbe impossible for other reasons, such as accessing memory that the process doesnot own (a typical example from many Unix systems).
show range
Show the current setting of the range checker, and whether or not it is beingset automatically by gdb.
15.4 Supported Languages
gdb supports C, C++, D, Objective-C, Fortran, Java, OpenCL C, Pascal, assembly, Modula-2, and Ada. Some gdb features may be used in expressions regardless of the languageyou use: the gdb @ and :: operators, and the ‘{type}addr’ construct (see Section 10.1[Expressions], page 97) can be used with the constructs of any supported language.
The following sections detail to what degree each source language is supported by gdb.These sections are not meant to be language tutorials or references, but serve only as areference guide to what the gdb expression parser accepts, and what input and outputformats should look like for different languages. There are many good books written oneach of these languages; please look to these for a language reference or tutorial.
15.4.1 C and C++
Since C and C++ are so closely related, many features of gdb apply to both languages.Whenever this is the case, we discuss those languages together.
166 Debugging with gdb
The C++ debugging facilities are jointly implemented by the C++ compiler and gdb.Therefore, to debug your C++ code effectively, you must compile your C++ programs witha supported C++ compiler, such as gnu g++, or the HP ANSI C++ compiler (aCC).
15.4.1.1 C and C++ Operators
Operators must be defined on values of specific types. For instance, + is defined on numbers,but not on structures. Operators are often defined on groups of types.
For the purposes of C and C++, the following definitions hold:
• Integral types include int with any of its storage-class specifiers; char; enum; and, forC++, bool.
• Floating-point types include float, double, and long double (if supported by thetarget platform).
• Pointer types include all types defined as (type *).
• Scalar types include all of the above.
The following operators are supported. They are listed here in order of increasing prece-dence:
, The comma or sequencing operator. Expressions in a comma-separated list areevaluated from left to right, with the result of the entire expression being thelast expression evaluated.
= Assignment. The value of an assignment expression is the value assigned. De-fined on scalar types.
op= Used in an expression of the form a op= b , and translated to a = a op b . op=and = have the same precedence. op is any one of the operators |, ^, &, <<, >>,+, -, *, /, %.
?: The ternary operator. a ? b : c can be thought of as: if a then b else c. ashould be of an integral type.
|| Logical or. Defined on integral types.
&& Logical and. Defined on integral types.
| Bitwise or. Defined on integral types.
^ Bitwise exclusive-or. Defined on integral types.
& Bitwise and. Defined on integral types.
==, != Equality and inequality. Defined on scalar types. The value of these expressionsis 0 for false and non-zero for true.
<, >, <=, >=Less than, greater than, less than or equal, greater than or equal. Defined onscalar types. The value of these expressions is 0 for false and non-zero for true.
<<, >> left shift, and right shift. Defined on integral types.
@ The gdb “artificial array” operator (see Section 10.1 [Expressions], page 97).
+, - Addition and subtraction. Defined on integral types, floating-point types andpointer types.
Chapter 15: Using gdb with Different Languages 167
*, /, % Multiplication, division, and modulus. Multiplication and division are definedon integral and floating-point types. Modulus is defined on integral types.
++, -- Increment and decrement. When appearing before a variable, the operation isperformed before the variable is used in an expression; when appearing after it,the variable’s value is used before the operation takes place.
* Pointer dereferencing. Defined on pointer types. Same precedence as ++.
& Address operator. Defined on variables. Same precedence as ++.
For debugging C++, gdb implements a use of ‘&’ beyond what is allowed in theC++ language itself: you can use ‘&(&ref)’ to examine the address where a C++reference variable (declared with ‘&ref ’) is stored.
- Negative. Defined on integral and floating-point types. Same precedence as ++.
! Logical negation. Defined on integral types. Same precedence as ++.
~ Bitwise complement operator. Defined on integral types. Same precedence as++.
., -> Structure member, and pointer-to-structure member. For convenience, gdbregards the two as equivalent, choosing whether to dereference a pointer basedon the stored type information. Defined on struct and union data.
.*, ->* Dereferences of pointers to members.
[] Array indexing. a[i] is defined as *(a+i). Same precedence as ->.
() Function parameter list. Same precedence as ->.
:: C++ scope resolution operator. Defined on struct, union, and class types.
:: Doubled colons also represent the gdb scope operator (see Section 10.1 [Ex-pressions], page 97). Same precedence as ::, above.
If an operator is redefined in the user code, gdb usually attempts to invoke the redefinedversion instead of using the operator’s predefined meaning.
15.4.1.2 C and C++ Constants
gdb allows you to express the constants of C and C++ in the following ways:
• Integer constants are a sequence of digits. Octal constants are specified by a leading‘0’ (i.e. zero), and hexadecimal constants by a leading ‘0x’ or ‘0X’. Constants may alsoend with a letter ‘l’, specifying that the constant should be treated as a long value.
• Floating point constants are a sequence of digits, followed by a decimal point, followedby a sequence of digits, and optionally followed by an exponent. An exponent is ofthe form: ‘e[[+]|-]nnn ’, where nnn is another sequence of digits. The ‘+’ is optionalfor positive exponents. A floating-point constant may also end with a letter ‘f’ or ‘F’,specifying that the constant should be treated as being of the float (as opposed to thedefault double) type; or with a letter ‘l’ or ‘L’, which specifies a long double constant.
• Enumerated constants consist of enumerated identifiers, or their integral equivalents.
168 Debugging with gdb
• Character constants are a single character surrounded by single quotes (’), or anumber—the ordinal value of the corresponding character (usually its ascii value).Within quotes, the single character may be represented by a letter or by escapesequences, which are of the form ‘\nnn ’, where nnn is the octal representation ofthe character’s ordinal value; or of the form ‘\x ’, where ‘x ’ is a predefined specialcharacter—for example, ‘\n’ for newline.
Wide character constants can be written by prefixing a character constant with ‘L’,as in C. For example, ‘L’x’’ is the wide form of ‘x’. The target wide character set isused when computing the value of this constant (see Section 10.19 [Character Sets],page 125).
• String constants are a sequence of character constants surrounded by double quotes (").Any valid character constant (as described above) may appear. Double quotes withinthe string must be preceded by a backslash, so for instance ‘"a\"b’c"’ is a string offive characters.
Wide string constants can be written by prefixing a string constant with ‘L’, as in C.The target wide character set is used when computing the value of this constant (seeSection 10.19 [Character Sets], page 125).
• Pointer constants are an integral value. You can also write pointers to constants usingthe C operator ‘&’.
• Array constants are comma-separated lists surrounded by braces ‘{’ and ‘}’; for ex-ample, ‘{1,2,3}’ is a three-element array of integers, ‘{{1,2}, {3,4}, {5,6}}’ is athree-by-two array, and ‘{&"hi", &"there", &"fred"}’ is a three-element array ofpointers.
15.4.1.3 C++ Expressions
gdb expression handling can interpret most C++ expressions.
Warning: gdb can only debug C++ code if you use the proper compiler andthe proper debug format. Currently, gdb works best when debugging C++ codethat is compiled with the most recent version of gcc possible. The DWARFdebugging format is preferred; gcc defaults to this on most popular platforms.Other compilers and/or debug formats are likely to work badly or not at allwhen using gdb to debug C++ code. See Section 4.1 [Compilation], page 25.
1. Member function calls are allowed; you can use expressions like
count = aml->GetOriginal(x, y)
2. While a member function is active (in the selected stack frame), your expressions havethe same namespace available as the member function; that is, gdb allows implicitreferences to the class instance pointer this following the same rules as C++. using
declarations in the current scope are also respected by gdb.
3. You can call overloaded functions; gdb resolves the function call to the right definition,with some restrictions. gdb does not perform overload resolution involving user-definedtype conversions, calls to constructors, or instantiations of templates that do not existin the program. It also cannot handle ellipsis argument lists or default arguments.
It does perform integral conversions and promotions, floating-point promotions, arith-metic conversions, pointer conversions, conversions of class objects to base classes, and
Chapter 15: Using gdb with Different Languages 169
standard conversions such as those of functions or arrays to pointers; it requires anexact match on the number of function arguments.
Overload resolution is always performed, unless you have specified set overload-
resolution off. See Section 15.4.1.7 [gdb Features for C++], page 170.
You must specify set overload-resolution off in order to use an explicit functionsignature to call an overloaded function, as in
p ’foo(char,int)’(’x’, 13)
The gdb command-completion facility can simplify this; see Section 3.2 [CommandCompletion], page 19.
4. gdb understands variables declared as C++ references; you can use them in expressionsjust as you do in C++ source—they are automatically dereferenced.
In the parameter list shown when gdb displays a frame, the values of reference variablesare not displayed (unlike other variables); this avoids clutter, since references are oftenused for large structures. The address of a reference variable is always shown, unlessyou have specified ‘set print address off’.
5. gdb supports the C++ name resolution operator ::—your expressions can use it just asexpressions in your program do. Since one scope may be defined in another, you can use:: repeatedly if necessary, for example in an expression like ‘scope1::scope2::name ’.gdb also allows resolving name scope by reference to source files, in both C and C++debugging (see Section 10.3 [Program Variables], page 99).
6. gdb performs argument-dependent lookup, following the C++ specification.
15.4.1.4 C and C++ Defaults
If you allow gdb to set type and range checking automatically, they both default to off
whenever the working language changes to C or C++. This happens regardless of whetheryou or gdb selects the working language.
If you allow gdb to set the language automatically, it recognizes source files whose namesend with ‘.c’, ‘.C’, or ‘.cc’, etc, and when gdb enters code compiled from one of these files,it sets the working language to C or C++. See Section 15.1.3 [Having gdb Infer the SourceLanguage], page 162, for further details.
15.4.1.5 C and C++ Type and Range Checks
By default, when gdb parses C or C++ expressions, type checking is not used. However, ifyou turn type checking on, gdb considers two variables type equivalent if:
• The two variables are structured and have the same structure, union, or enumeratedtag.
• The two variables have the same type name, or types that have been declared equivalentthrough typedef.
Range checking, if turned on, is done on mathematical operations. Array indices are notchecked, since they are often used to index a pointer that is not itself an array.
15.4.1.6 gdb and C
The set print union and show print union commands apply to the union type. Whenset to ‘on’, any union that is inside a struct or class is also printed. Otherwise, it appearsas ‘{...}’.
170 Debugging with gdb
The @ operator aids in the debugging of dynamic arrays, formed with pointers and amemory allocation function. See Section 10.1 [Expressions], page 97.
15.4.1.7 gdb Features for C++
Some gdb commands are particularly useful with C++, and some are designed specificallyfor use with C++. Here is a summary:
breakpoint menusWhen you want a breakpoint in a function whose name is overloaded, gdbhas the capability to display a menu of possible breakpoint locations to helpyou specify which function definition you want. See Section 10.2 [AmbiguousExpressions], page 98.
rbreak regex
Setting breakpoints using regular expressions is helpful for setting breakpointson overloaded functions that are not members of any special classes. SeeSection 5.1.1 [Setting Breakpoints], page 44.
catch throw
catch catch
Debug C++ exception handling using these commands. See Section 5.1.3 [Set-ting Catchpoints], page 52.
ptype typename
Print inheritance relationships as well as other information for type typename.See Chapter 16 [Examining the Symbol Table], page 189.
set print demangle
show print demangle
set print asm-demangle
show print asm-demangle
Control whether C++ symbols display in their source form, both when displayingcode as C++ source and when displaying disassemblies. See Section 10.8 [PrintSettings], page 106.
set print object
show print object
Choose whether to print derived (actual) or declared types of objects. SeeSection 10.8 [Print Settings], page 106.
set print vtbl
show print vtbl
Control the format for printing virtual function tables. See Section 10.8 [PrintSettings], page 106. (The vtbl commands do not work on programs compiledwith the HP ANSI C++ compiler (aCC).)
set overload-resolution on
Enable overload resolution for C++ expression evaluation. The default is on. Foroverloaded functions, gdb evaluates the arguments and searches for a functionwhose signature matches the argument types, using the standard C++ conver-sion rules (see Section 15.4.1.3 [C++ Expressions], page 168, for details). If itcannot find a match, it emits a message.
Chapter 15: Using gdb with Different Languages 171
set overload-resolution off
Disable overload resolution for C++ expression evaluation. For overloaded func-tions that are not class member functions, gdb chooses the first function ofthe specified name that it finds in the symbol table, whether or not its argu-ments are of the correct type. For overloaded functions that are class memberfunctions, gdb searches for a function whose signature exactly matches theargument types.
show overload-resolution
Show the current setting of overload resolution.
Overloaded symbol namesYou can specify a particular definition of an overloaded symbol, using the samenotation that is used to declare such symbols in C++: type symbol(types)
rather than just symbol. You can also use the gdb command-line word com-pletion facilities to list the available choices, or to finish the type list for you.See Section 3.2 [Command Completion], page 19, for details on how to do this.
15.4.1.8 Decimal Floating Point format
gdb can examine, set and perform computations with numbers in decimal floating point for-mat, which in the C language correspond to the _Decimal32, _Decimal64 and _Decimal128
types as specified by the extension to support decimal floating-point arithmetic.
There are two encodings in use, depending on the architecture: BID (Binary IntegerDecimal) for x86 and x86-64, and DPD (Densely Packed Decimal) for PowerPC. gdb willuse the appropriate encoding for the configured target.
Because of a limitation in ‘libdecnumber’, the library used by gdb to manipulate decimalfloating point numbers, it is not possible to convert (using a cast, for example) integers widerthan 32-bit to decimal float.
In addition, in order to imitate gdb’s behaviour with binary floating point computations,error checking in decimal float operations ignores underflow, overflow and divide by zeroexceptions.
In the PowerPC architecture, gdb provides a set of pseudo-registers to inspect_Decimal128 values stored in floating point registers. See Section 21.4.7 [PowerPC],page 263 for more details.
15.4.2 D
gdb can be used to debug programs written in D and compiled with GDC, LDC or DMDcompilers. Currently gdb supports only one D specific feature — dynamic arrays.
15.4.3 Objective-C
This section provides information about some commands and command options that areuseful for debugging Objective-C code. See also Chapter 16 [Symbols], page 189, andChapter 16 [Symbols], page 189, for a few more commands specific to Objective-C support.
15.4.3.1 Method Names in Commands
The following commands have been extended to accept Objective-C method names as linespecifications:
172 Debugging with gdb
• clear
• break
• info line
• jump
• list
A fully qualified Objective-C method name is specified as
-[Class methodName]
where the minus sign is used to indicate an instance method and a plus sign (not shown)is used to indicate a class method. The class name Class and method name methodNameare enclosed in brackets, similar to the way messages are specified in Objective-C sourcecode. For example, to set a breakpoint at the create instance method of class Fruit inthe program currently being debugged, enter:
break -[Fruit create]
To list ten program lines around the initialize class method, enter:
list +[NSText initialize]
In the current version of gdb, the plus or minus sign is required. In future versions ofgdb, the plus or minus sign will be optional, but you can use it to narrow the search. It isalso possible to specify just a method name:
break create
You must specify the complete method name, including any colons. If your program’ssource files contain more than one create method, you’ll be presented with a numberedlist of classes that implement that method. Indicate your choice by number, or type ‘0’ toexit if none apply.
As another example, to clear a breakpoint established at the makeKeyAndOrderFront:
method of the NSWindow class, enter:
clear -[NSWindow makeKeyAndOrderFront:]
15.4.3.2 The Print Command With Objective-C
The print command has also been extended to accept methods. For example:
print -[object hash]
will tell gdb to send the hash message to object and print the result. Also, an additionalcommand has been added, print-object or po for short, which is meant to print thedescription of an object. However, this command may only work with certain Objective-Clibraries that have a particular hook function, _NSPrintForDebugger, defined.
15.4.4 OpenCL C
This section provides information about gdbs OpenCL C support.
15.4.4.1 OpenCL C Datatypes
gdb supports the builtin scalar and vector datatypes specified by OpenCL 1.1. In additionthe half- and double-precision floating point data types of the cl_khr_fp16 and cl_khr_
fp64 OpenCL extensions are also known to gdb.
Chapter 15: Using gdb with Different Languages 173
15.4.4.2 OpenCL C Expressions
gdb supports accesses to vector components including the access as lvalue where possible.Since OpenCL C is based on C99 most C expressions supported by gdb can be used aswell.
15.4.4.3 OpenCL C Operators
gdb supports the operators specified by OpenCL 1.1 for scalar and vector data types.
15.4.5 Fortran
gdb can be used to debug programs written in Fortran, but it currently supports only thefeatures of Fortran 77 language.
Some Fortran compilers (gnu Fortran 77 and Fortran 95 compilers among them) appendan underscore to the names of variables and functions. When you debug programs com-piled by those compilers, you will need to refer to variables and functions with a trailingunderscore.
15.4.5.1 Fortran Operators and Expressions
Operators must be defined on values of specific types. For instance, + is defined on numbers,but not on characters or other non- arithmetic types. Operators are often defined on groupsof types.
** The exponentiation operator. It raises the first operand to the power of thesecond one.
: The range operator. Normally used in the form of array(low:high) to representa section of array.
% The access component operator. Normally used to access elements in derivedtypes. Also suitable for unions. As unions aren’t part of regular Fortran, thiscan only happen when accessing a register that uses a gdbarch-defined uniontype.
15.4.5.2 Fortran Defaults
Fortran symbols are usually case-insensitive, so gdb by default uses case-insensitive matchesfor Fortran symbols. You can change that with the ‘set case-insensitive’ command, seeChapter 16 [Symbols], page 189, for the details.
15.4.5.3 Special Fortran Commands
gdb has some commands to support Fortran-specific features, such as displaying commonblocks.
info common [common-name ]This command prints the values contained in the Fortran COMMON block whosename is common-name. With no argument, the names of all COMMON blocksvisible at the current program location are printed.
174 Debugging with gdb
15.4.6 Pascal
Debugging Pascal programs which use sets, subranges, file variables, or nested functionsdoes not currently work. gdb does not support entering expressions, printing values, orsimilar features using Pascal syntax.
The Pascal-specific command set print pascal_static-members controls whetherstatic members of Pascal objects are displayed. See Section 10.8 [Print Settings], page 106.
15.4.7 Modula-2
The extensions made to gdb to support Modula-2 only support output from the gnuModula-2 compiler (which is currently being developed). Other Modula-2 compilers are notcurrently supported, and attempting to debug executables produced by them is most likelyto give an error as gdb reads in the executable’s symbol table.
15.4.7.1 Operators
Operators must be defined on values of specific types. For instance, + is defined on numbers,but not on structures. Operators are often defined on groups of types. For the purposes ofModula-2, the following definitions hold:
• Integral types consist of INTEGER, CARDINAL, and their subranges.
• Character types consist of CHAR and its subranges.
• Floating-point types consist of REAL.
• Pointer types consist of anything declared as POINTER TO type .
• Scalar types consist of all of the above.
• Set types consist of SET and BITSET types.
• Boolean types consist of BOOLEAN.
The following operators are supported, and appear in order of increasing precedence:
, Function argument or array index separator.
:= Assignment. The value of var := value is value.
<, > Less than, greater than on integral, floating-point, or enumerated types.
<=, >= Less than or equal to, greater than or equal to on integral, floating-point andenumerated types, or set inclusion on set types. Same precedence as <.
=, <>, # Equality and two ways of expressing inequality, valid on scalar types. Sameprecedence as <. In gdb scripts, only <> is available for inequality, since #
conflicts with the script comment character.
IN Set membership. Defined on set types and the types of their members. Sameprecedence as <.
OR Boolean disjunction. Defined on boolean types.
AND, & Boolean conjunction. Defined on boolean types.
@ The gdb “artificial array” operator (see Section 10.1 [Expressions], page 97).
+, - Addition and subtraction on integral and floating-point types, or union anddifference on set types.
Chapter 15: Using gdb with Different Languages 175
* Multiplication on integral and floating-point types, or set intersection on settypes.
/ Division on floating-point types, or symmetric set difference on set types. Sameprecedence as *.
DIV, MOD Integer division and remainder. Defined on integral types. Same precedence as*.
- Negative. Defined on INTEGER and REAL data.
^ Pointer dereferencing. Defined on pointer types.
NOT Boolean negation. Defined on boolean types. Same precedence as ^.
. RECORD field selector. Defined on RECORD data. Same precedence as ^.
[] Array indexing. Defined on ARRAY data. Same precedence as ^.
() Procedure argument list. Defined on PROCEDURE objects. Same precedence as^.
::, . gdb and Modula-2 scope operators.
Warning: Set expressions and their operations are not yet supported, so gdbtreats the use of the operator IN, or the use of operators +, -, *, /, =, , <>, #,<=, and >= on sets as an error.
15.4.7.2 Built-in Functions and Procedures
Modula-2 also makes available several built-in procedures and functions. In describing these,the following metavariables are used:
a represents an ARRAY variable.
c represents a CHAR constant or variable.
i represents a variable or constant of integral type.
m represents an identifier that belongs to a set. Generally used in the same func-tion with the metavariable s. The type of s should be SET OF mtype (wheremtype is the type of m).
n represents a variable or constant of integral or floating-point type.
r represents a variable or constant of floating-point type.
t represents a type.
v represents a variable.
x represents a variable or constant of one of many types. See the explanation ofthe function for details.
All Modula-2 built-in procedures also return a result, described below.
ABS(n) Returns the absolute value of n.
CAP(c) If c is a lower case letter, it returns its upper case equivalent, otherwise itreturns its argument.
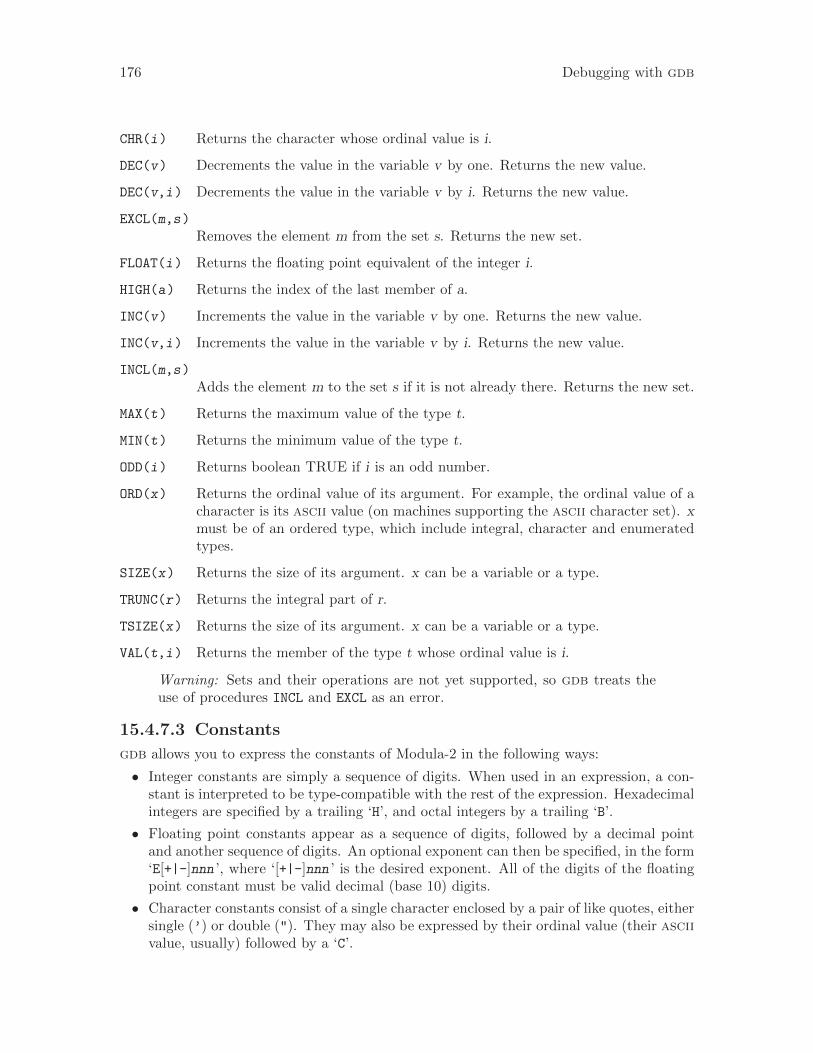
176 Debugging with gdb
CHR(i) Returns the character whose ordinal value is i.
DEC(v) Decrements the value in the variable v by one. Returns the new value.
DEC(v,i) Decrements the value in the variable v by i. Returns the new value.
EXCL(m,s)
Removes the element m from the set s. Returns the new set.
FLOAT(i) Returns the floating point equivalent of the integer i.
HIGH(a) Returns the index of the last member of a.
INC(v) Increments the value in the variable v by one. Returns the new value.
INC(v,i) Increments the value in the variable v by i. Returns the new value.
INCL(m,s)
Adds the element m to the set s if it is not already there. Returns the new set.
MAX(t) Returns the maximum value of the type t.
MIN(t) Returns the minimum value of the type t.
ODD(i) Returns boolean TRUE if i is an odd number.
ORD(x) Returns the ordinal value of its argument. For example, the ordinal value of acharacter is its ascii value (on machines supporting the ascii character set). xmust be of an ordered type, which include integral, character and enumeratedtypes.
SIZE(x) Returns the size of its argument. x can be a variable or a type.
TRUNC(r) Returns the integral part of r.
TSIZE(x) Returns the size of its argument. x can be a variable or a type.
VAL(t,i) Returns the member of the type t whose ordinal value is i.
Warning: Sets and their operations are not yet supported, so gdb treats theuse of procedures INCL and EXCL as an error.
15.4.7.3 Constants
gdb allows you to express the constants of Modula-2 in the following ways:
• Integer constants are simply a sequence of digits. When used in an expression, a con-stant is interpreted to be type-compatible with the rest of the expression. Hexadecimalintegers are specified by a trailing ‘H’, and octal integers by a trailing ‘B’.
• Floating point constants appear as a sequence of digits, followed by a decimal pointand another sequence of digits. An optional exponent can then be specified, in the form‘E[+|-]nnn ’, where ‘[+|-]nnn ’ is the desired exponent. All of the digits of the floatingpoint constant must be valid decimal (base 10) digits.
• Character constants consist of a single character enclosed by a pair of like quotes, eithersingle (’) or double ("). They may also be expressed by their ordinal value (their asciivalue, usually) followed by a ‘C’.
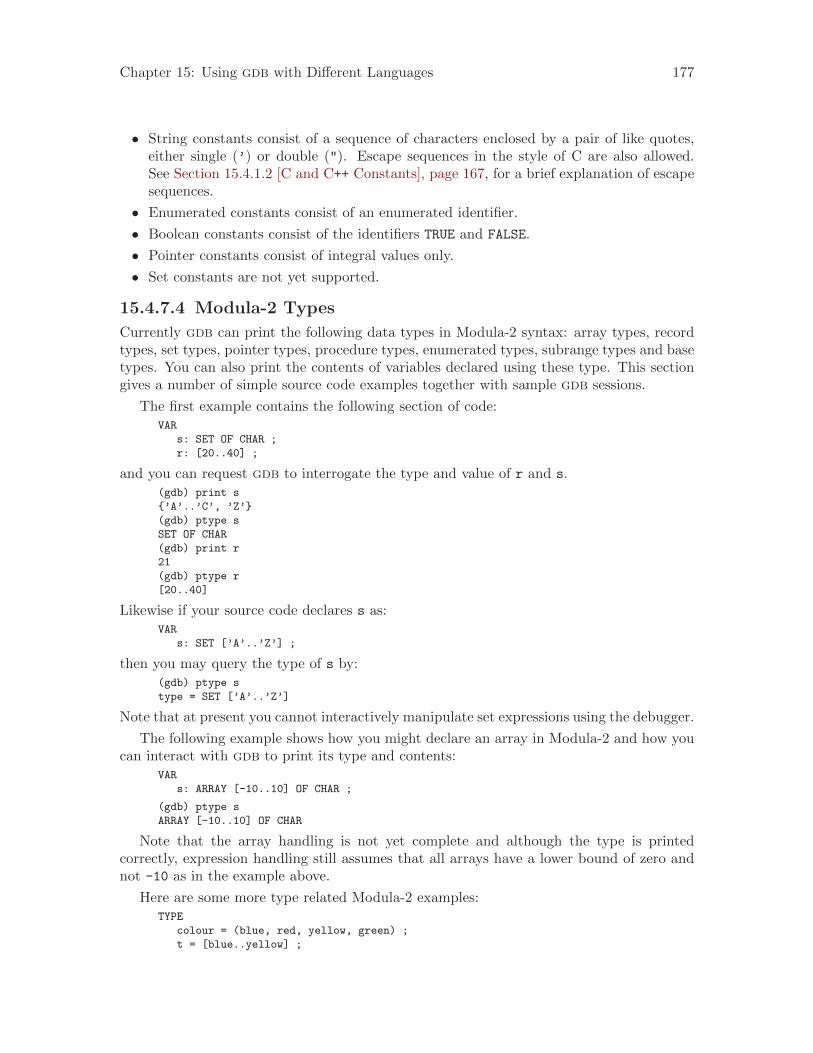
Chapter 15: Using gdb with Different Languages 177
• String constants consist of a sequence of characters enclosed by a pair of like quotes,either single (’) or double ("). Escape sequences in the style of C are also allowed.See Section 15.4.1.2 [C and C++ Constants], page 167, for a brief explanation of escapesequences.
• Enumerated constants consist of an enumerated identifier.
• Boolean constants consist of the identifiers TRUE and FALSE.
• Pointer constants consist of integral values only.
• Set constants are not yet supported.
15.4.7.4 Modula-2 Types
Currently gdb can print the following data types in Modula-2 syntax: array types, recordtypes, set types, pointer types, procedure types, enumerated types, subrange types and basetypes. You can also print the contents of variables declared using these type. This sectiongives a number of simple source code examples together with sample gdb sessions.
The first example contains the following section of code:VAR
s: SET OF CHAR ;
r: [20..40] ;
and you can request gdb to interrogate the type and value of r and s.(gdb) print s
{’A’..’C’, ’Z’}
(gdb) ptype s
SET OF CHAR
(gdb) print r
21
(gdb) ptype r
[20..40]
Likewise if your source code declares s as:VAR
s: SET [’A’..’Z’] ;
then you may query the type of s by:(gdb) ptype s
type = SET [’A’..’Z’]
Note that at present you cannot interactively manipulate set expressions using the debugger.
The following example shows how you might declare an array in Modula-2 and how youcan interact with gdb to print its type and contents:
VAR
s: ARRAY [-10..10] OF CHAR ;
(gdb) ptype s
ARRAY [-10..10] OF CHAR
Note that the array handling is not yet complete and although the type is printedcorrectly, expression handling still assumes that all arrays have a lower bound of zero andnot -10 as in the example above.
Here are some more type related Modula-2 examples:TYPE
colour = (blue, red, yellow, green) ;
t = [blue..yellow] ;
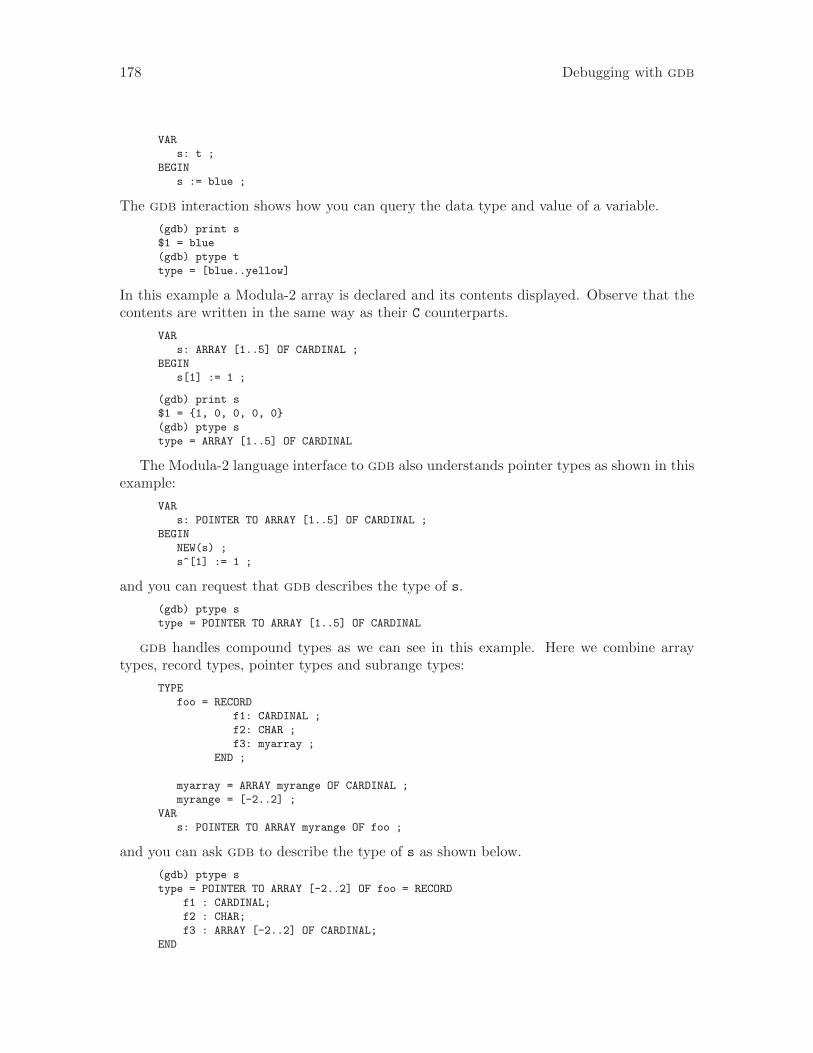
178 Debugging with gdb
VAR
s: t ;
BEGIN
s := blue ;
The gdb interaction shows how you can query the data type and value of a variable.
(gdb) print s
$1 = blue
(gdb) ptype t
type = [blue..yellow]
In this example a Modula-2 array is declared and its contents displayed. Observe that thecontents are written in the same way as their C counterparts.
VAR
s: ARRAY [1..5] OF CARDINAL ;
BEGIN
s[1] := 1 ;
(gdb) print s
$1 = {1, 0, 0, 0, 0}
(gdb) ptype s
type = ARRAY [1..5] OF CARDINAL
The Modula-2 language interface to gdb also understands pointer types as shown in thisexample:
VAR
s: POINTER TO ARRAY [1..5] OF CARDINAL ;
BEGIN
NEW(s) ;
s^[1] := 1 ;
and you can request that gdb describes the type of s.
(gdb) ptype s
type = POINTER TO ARRAY [1..5] OF CARDINAL
gdb handles compound types as we can see in this example. Here we combine arraytypes, record types, pointer types and subrange types:
TYPE
foo = RECORD
f1: CARDINAL ;
f2: CHAR ;
f3: myarray ;
END ;
myarray = ARRAY myrange OF CARDINAL ;
myrange = [-2..2] ;
VAR
s: POINTER TO ARRAY myrange OF foo ;
and you can ask gdb to describe the type of s as shown below.
(gdb) ptype s
type = POINTER TO ARRAY [-2..2] OF foo = RECORD
f1 : CARDINAL;
f2 : CHAR;
f3 : ARRAY [-2..2] OF CARDINAL;
END
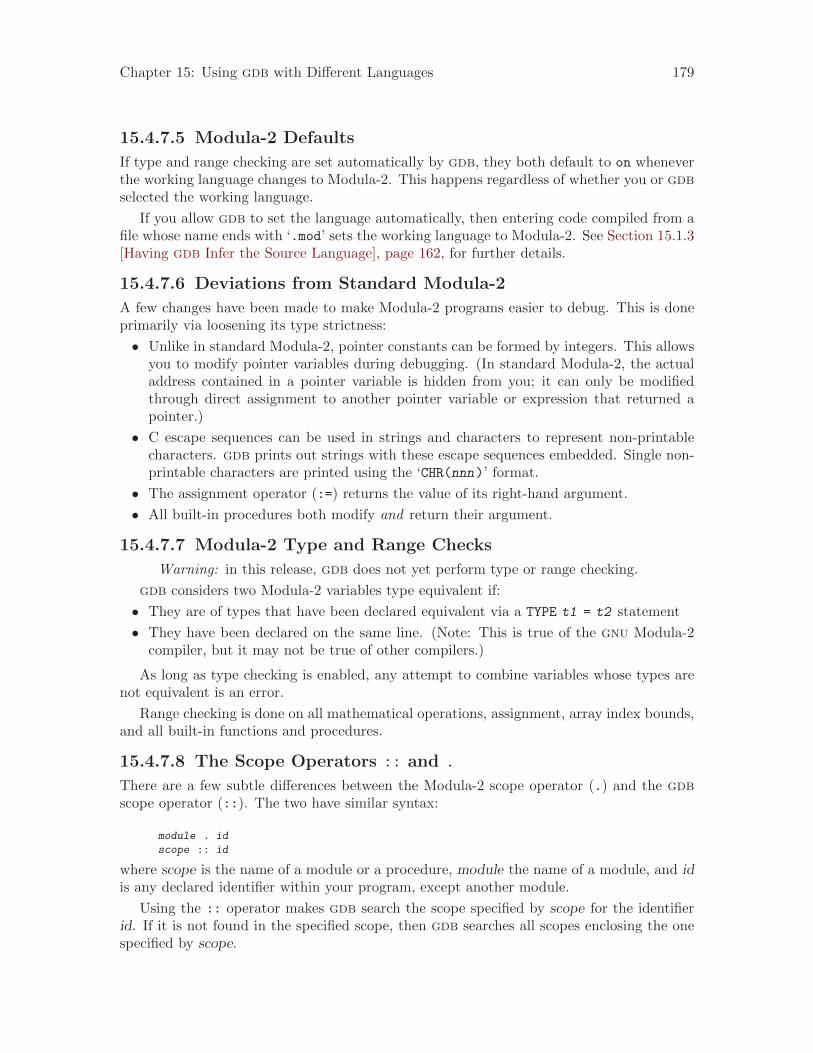
Chapter 15: Using gdb with Different Languages 179
15.4.7.5 Modula-2 Defaults
If type and range checking are set automatically by gdb, they both default to on wheneverthe working language changes to Modula-2. This happens regardless of whether you or gdbselected the working language.
If you allow gdb to set the language automatically, then entering code compiled from afile whose name ends with ‘.mod’ sets the working language to Modula-2. See Section 15.1.3[Having gdb Infer the Source Language], page 162, for further details.
15.4.7.6 Deviations from Standard Modula-2
A few changes have been made to make Modula-2 programs easier to debug. This is doneprimarily via loosening its type strictness:
• Unlike in standard Modula-2, pointer constants can be formed by integers. This allowsyou to modify pointer variables during debugging. (In standard Modula-2, the actualaddress contained in a pointer variable is hidden from you; it can only be modifiedthrough direct assignment to another pointer variable or expression that returned apointer.)
• C escape sequences can be used in strings and characters to represent non-printablecharacters. gdb prints out strings with these escape sequences embedded. Single non-printable characters are printed using the ‘CHR(nnn)’ format.
• The assignment operator (:=) returns the value of its right-hand argument.
• All built-in procedures both modify and return their argument.
15.4.7.7 Modula-2 Type and Range Checks
Warning: in this release, gdb does not yet perform type or range checking.
gdb considers two Modula-2 variables type equivalent if:
• They are of types that have been declared equivalent via a TYPE t1 = t2 statement
• They have been declared on the same line. (Note: This is true of the gnu Modula-2compiler, but it may not be true of other compilers.)
As long as type checking is enabled, any attempt to combine variables whose types arenot equivalent is an error.
Range checking is done on all mathematical operations, assignment, array index bounds,and all built-in functions and procedures.
15.4.7.8 The Scope Operators :: and .
There are a few subtle differences between the Modula-2 scope operator (.) and the gdbscope operator (::). The two have similar syntax:
module . id
scope :: id
where scope is the name of a module or a procedure, module the name of a module, and idis any declared identifier within your program, except another module.
Using the :: operator makes gdb search the scope specified by scope for the identifierid. If it is not found in the specified scope, then gdb searches all scopes enclosing the onespecified by scope.
180 Debugging with gdb
Using the . operator makes gdb search the current scope for the identifier specified byid that was imported from the definition module specified by module. With this operator,it is an error if the identifier id was not imported from definition module module, or if id isnot an identifier in module.
15.4.7.9 gdb and Modula-2
Some gdb commands have little use when debugging Modula-2 programs. Five subcom-mands of set print and show print apply specifically to C and C++: ‘vtbl’, ‘demangle’,‘asm-demangle’, ‘object’, and ‘union’. The first four apply to C++, and the last to the Cunion type, which has no direct analogue in Modula-2.
The @ operator (see Section 10.1 [Expressions], page 97), while available with any lan-guage, is not useful with Modula-2. Its intent is to aid the debugging of dynamic arrays,which cannot be created in Modula-2 as they can in C or C++. However, because an addresscan be specified by an integral constant, the construct ‘{type}adrexp ’ is still useful.
In gdb scripts, the Modula-2 inequality operator # is interpreted as the beginning of acomment. Use <> instead.
15.4.8 Ada
The extensions made to gdb for Ada only support output from the gnu Ada (GNAT)compiler. Other Ada compilers are not currently supported, and attempting to debugexecutables produced by them is most likely to be difficult.
15.4.8.1 Introduction
The Ada mode of gdb supports a fairly large subset of Ada expression syntax, with someextensions. The philosophy behind the design of this subset is
• That gdb should provide basic literals and access to operations for arithmetic, deref-erencing, field selection, indexing, and subprogram calls, leaving more sophisticatedcomputations to subprograms written into the program (which therefore may be calledfrom gdb).
• That type safety and strict adherence to Ada language restrictions are not particularlyimportant to the gdb user.
• That brevity is important to the gdb user.
Thus, for brevity, the debugger acts as if all names declared in user-written packagesare directly visible, even if they are not visible according to Ada rules, thus making itunnecessary to fully qualify most names with their packages, regardless of context. Wherethis causes ambiguity, gdb asks the user’s intent.
The debugger will start in Ada mode if it detects an Ada main program. As for otherlanguages, it will enter Ada mode when stopped in a program that was translated from anAda source file.
While in Ada mode, you may use ‘--’ for comments. This is useful mostly for docu-menting command files. The standard gdb comment (‘#’) still works at the beginning of aline in Ada mode, but not in the middle (to allow based literals).
The debugger supports limited overloading. Given a subprogram call in which the func-tion symbol has multiple definitions, it will use the number of actual parameters and some
Chapter 15: Using gdb with Different Languages 181
information about their types to attempt to narrow the set of definitions. It also makesvery limited use of context, preferring procedures to functions in the context of the call
command, and functions to procedures elsewhere.
15.4.8.2 Omissions from Ada
Here are the notable omissions from the subset:
• Only a subset of the attributes are supported:
− ’First, ’Last, and ’Length on array objects (not on types and subtypes).
− ’Min and ’Max.
− ’Pos and ’Val.
− ’Tag.
− ’Range on array objects (not subtypes), but only as the right operand of themembership (in) operator.
− ’Access, ’Unchecked_Access, and ’Unrestricted_Access (a GNAT extension).
− ’Address.
• The names in Characters.Latin_1 are not available and concatenation is not imple-mented. Thus, escape characters in strings are not currently available.
• Equality tests (‘=’ and ‘/=’) on arrays test for bitwise equality of representations. Theywill generally work correctly for strings and arrays whose elements have integer orenumeration types. They may not work correctly for arrays whose element types haveuser-defined equality, for arrays of real values (in particular, IEEE-conformant floatingpoint, because of negative zeroes and NaNs), and for arrays whose elements containunused bits with indeterminate values.
• The other component-by-component array operations (and, or, xor, not, and relationaltests other than equality) are not implemented.
• There is limited support for array and record aggregates. They are permitted only onthe right sides of assignments, as in these examples:
(gdb) set An_Array := (1, 2, 3, 4, 5, 6)
(gdb) set An_Array := (1, others => 0)
(gdb) set An_Array := (0|4 => 1, 1..3 => 2, 5 => 6)
(gdb) set A_2D_Array := ((1, 2, 3), (4, 5, 6), (7, 8, 9))
(gdb) set A_Record := (1, "Peter", True);
(gdb) set A_Record := (Name => "Peter", Id => 1, Alive => True)
Changing a discriminant’s value by assigning an aggregate has an undefined effect ifthat discriminant is used within the record. However, you can first modify discriminantsby directly assigning to them (which normally would not be allowed in Ada), and thenperforming an aggregate assignment. For example, given a variable A_Rec declared tohave a type such as:
type Rec (Len : Small_Integer := 0) is record
Id : Integer;
Vals : IntArray (1 .. Len);
end record;
you can assign a value with a different size of Vals with two assignments:
(gdb) set A_Rec.Len := 4
(gdb) set A_Rec := (Id => 42, Vals => (1, 2, 3, 4))
182 Debugging with gdb
As this example also illustrates, gdb is very loose about the usual rules concerningaggregates. You may leave out some of the components of an array or record aggre-gate (such as the Len component in the assignment to A_Rec above); they will retaintheir original values upon assignment. You may freely use dynamic values as indices incomponent associations. You may even use overlapping or redundant component asso-ciations, although which component values are assigned in such cases is not defined.
• Calls to dispatching subprograms are not implemented.
• The overloading algorithm is much more limited (i.e., less selective) than that of realAda. It makes only limited use of the context in which a subexpression appears toresolve its meaning, and it is much looser in its rules for allowing type matches. As aresult, some function calls will be ambiguous, and the user will be asked to choose theproper resolution.
• The new operator is not implemented.
• Entry calls are not implemented.
• Aside from printing, arithmetic operations on the native VAX floating-point formatsare not supported.
• It is not possible to slice a packed array.
• The names True and False, when not part of a qualified name, are interpreted as ifimplicitly prefixed by Standard, regardless of context. Should your program redefinethese names in a package or procedure (at best a dubious practice), you will have touse fully qualified names to access their new definitions.
15.4.8.3 Additions to Ada
As it does for other languages, gdbmakes certain generic extensions to Ada (see Section 10.1[Expressions], page 97):
• If the expression E is a variable residing in memory (typically a local variable or arrayelement) and N is a positive integer, then E@N displays the values of E and the N-1adjacent variables following it in memory as an array. In Ada, this operator is generallynot necessary, since its prime use is in displaying parts of an array, and slicing willusually do this in Ada. However, there are occasional uses when debugging programsin which certain debugging information has been optimized away.
• B::var means “the variable named var that appears in function or file B.” When B isa file name, you must typically surround it in single quotes.
• The expression {type} addr means “the variable of type type that appears at addressaddr.”
• A name starting with ‘$’ is a convenience variable (see Section 10.11 [ConvenienceVars], page 117) or a machine register (see Section 10.12 [Registers], page 119).
In addition, gdb provides a few other shortcuts and outright additions specific to Ada:
• The assignment statement is allowed as an expression, returning its right-hand operandas its value. Thus, you may enter
(gdb) set x := y + 3
(gdb) print A(tmp := y + 1)
• The semicolon is allowed as an “operator,” returning as its value the value of its right-hand operand. This allows, for example, complex conditional breaks:
Chapter 15: Using gdb with Different Languages 183
(gdb) break f
(gdb) condition 1 (report(i); k += 1; A(k) > 100)
• Rather than use catenation and symbolic character names to introduce special charac-ters into strings, one may instead use a special bracket notation, which is also used toprint strings. A sequence of characters of the form ‘["XX"]’ within a string or characterliteral denotes the (single) character whose numeric encoding is XX in hexadecimal.The sequence of characters ‘["""]’ also denotes a single quotation mark in strings. Forexample,
"One line.["0a"]Next line.["0a"]"
contains an ASCII newline character (Ada.Characters.Latin_1.LF) after each period.
• The subtype used as a prefix for the attributes ’Pos, ’Min, and ’Max is optional (andis ignored in any case). For example, it is valid to write
(gdb) print ’max(x, y)
• When printing arrays, gdb uses positional notation when the array has a lower boundof 1, and uses a modified named notation otherwise. For example, a one-dimensionalarray of three integers with a lower bound of 3 might print as
(3 => 10, 17, 1)
That is, in contrast to valid Ada, only the first component has a => clause.
• You may abbreviate attributes in expressions with any unique, multi-character subse-quence of their names (an exact match gets preference). For example, you may usea’len, a’gth, or a’lh in place of a’length.
• Since Ada is case-insensitive, the debugger normally maps identifiers you type to lowercase. The GNAT compiler uses upper-case characters for some of its internal identifiers,which are normally of no interest to users. For the rare occasions when you actuallyhave to look at them, enclose them in angle brackets to avoid the lower-case mapping.For example,
(gdb) print <JMPBUF_SAVE>[0]
• Printing an object of class-wide type or dereferencing an access-to-class-wide value willdisplay all the components of the object’s specific type (as indicated by its run-timetag). Likewise, component selection on such a value will operate on the specific typeof the object.
15.4.8.4 Stopping at the Very Beginning
It is sometimes necessary to debug the program during elaboration, and before reaching themain procedure. As defined in the Ada Reference Manual, the elaboration code is invokedfrom a procedure called adainit. To run your program up to the beginning of elaboration,simply use the following two commands: tbreak adainit and run.
15.4.8.5 Extensions for Ada Tasks
Support for Ada tasks is analogous to that for threads (see Section 4.10 [Threads], page 35).gdb provides the following task-related commands:
info tasks
This command shows a list of current Ada tasks, as in the following example:
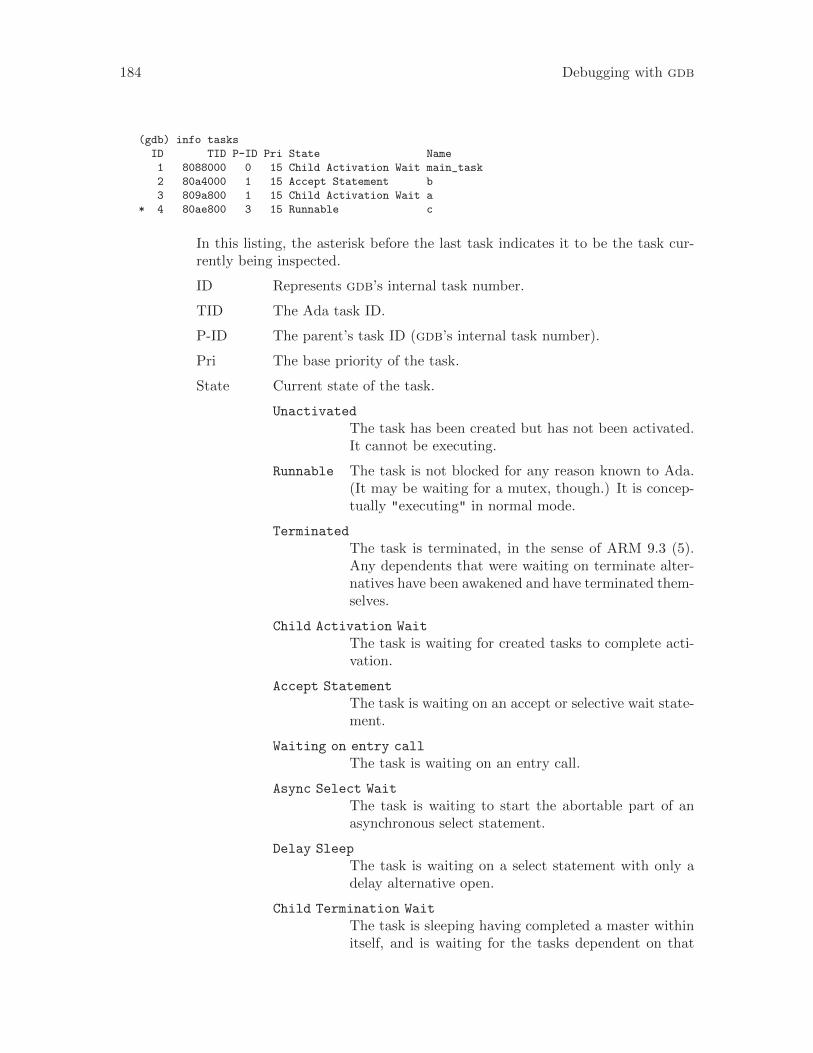
184 Debugging with gdb
(gdb) info tasks
ID TID P-ID Pri State Name
1 8088000 0 15 Child Activation Wait main_task
2 80a4000 1 15 Accept Statement b
3 809a800 1 15 Child Activation Wait a
* 4 80ae800 3 15 Runnable c
In this listing, the asterisk before the last task indicates it to be the task cur-rently being inspected.
ID Represents gdb’s internal task number.
TID The Ada task ID.
P-ID The parent’s task ID (gdb’s internal task number).
Pri The base priority of the task.
State Current state of the task.
Unactivated
The task has been created but has not been activated.It cannot be executing.
Runnable The task is not blocked for any reason known to Ada.(It may be waiting for a mutex, though.) It is concep-tually "executing" in normal mode.
Terminated
The task is terminated, in the sense of ARM 9.3 (5).Any dependents that were waiting on terminate alter-natives have been awakened and have terminated them-selves.
Child Activation Wait
The task is waiting for created tasks to complete acti-vation.
Accept Statement
The task is waiting on an accept or selective wait state-ment.
Waiting on entry call
The task is waiting on an entry call.
Async Select Wait
The task is waiting to start the abortable part of anasynchronous select statement.
Delay Sleep
The task is waiting on a select statement with only adelay alternative open.
Child Termination Wait
The task is sleeping having completed a master withinitself, and is waiting for the tasks dependent on that
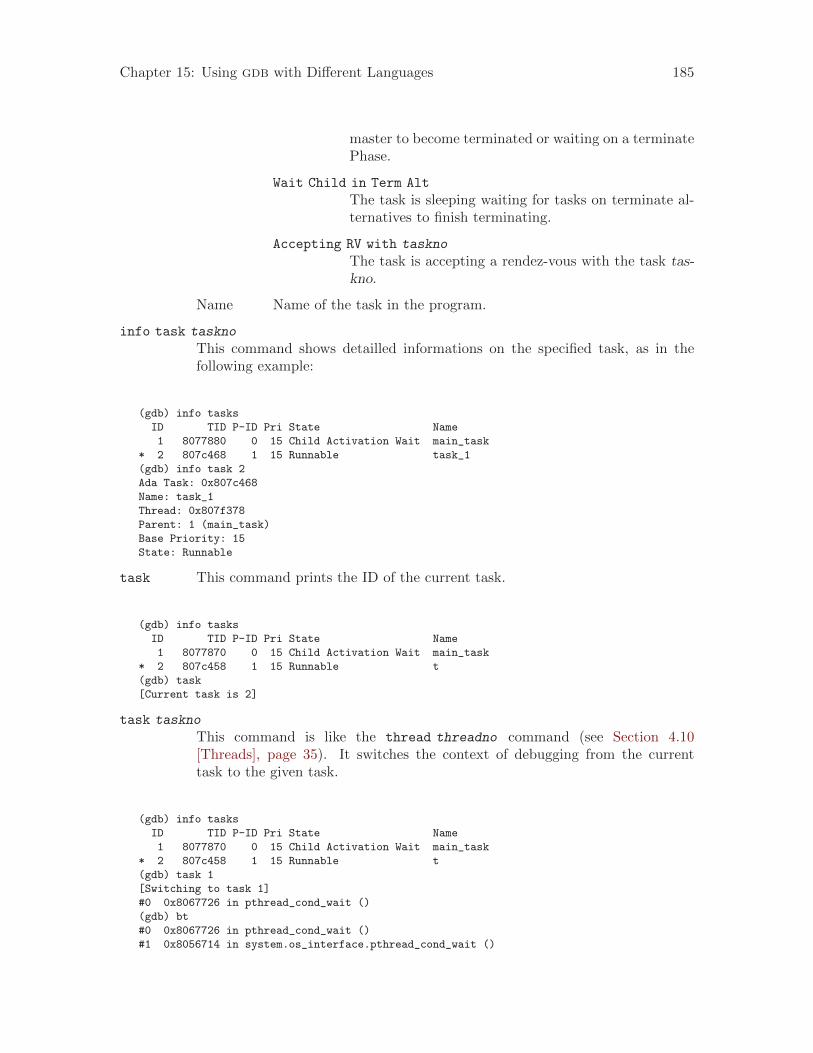
Chapter 15: Using gdb with Different Languages 185
master to become terminated or waiting on a terminatePhase.
Wait Child in Term Alt
The task is sleeping waiting for tasks on terminate al-ternatives to finish terminating.
Accepting RV with taskno
The task is accepting a rendez-vous with the task tas-kno.
Name Name of the task in the program.
info task taskno
This command shows detailled informations on the specified task, as in thefollowing example:
(gdb) info tasks
ID TID P-ID Pri State Name
1 8077880 0 15 Child Activation Wait main_task
* 2 807c468 1 15 Runnable task_1
(gdb) info task 2
Ada Task: 0x807c468
Name: task_1
Thread: 0x807f378
Parent: 1 (main_task)
Base Priority: 15
State: Runnable
task This command prints the ID of the current task.
(gdb) info tasks
ID TID P-ID Pri State Name
1 8077870 0 15 Child Activation Wait main_task
* 2 807c458 1 15 Runnable t
(gdb) task
[Current task is 2]
task taskno
This command is like the thread threadno command (see Section 4.10[Threads], page 35). It switches the context of debugging from the currenttask to the given task.
(gdb) info tasks
ID TID P-ID Pri State Name
1 8077870 0 15 Child Activation Wait main_task
* 2 807c458 1 15 Runnable t
(gdb) task 1
[Switching to task 1]
#0 0x8067726 in pthread_cond_wait ()
(gdb) bt
#0 0x8067726 in pthread_cond_wait ()
#1 0x8056714 in system.os_interface.pthread_cond_wait ()
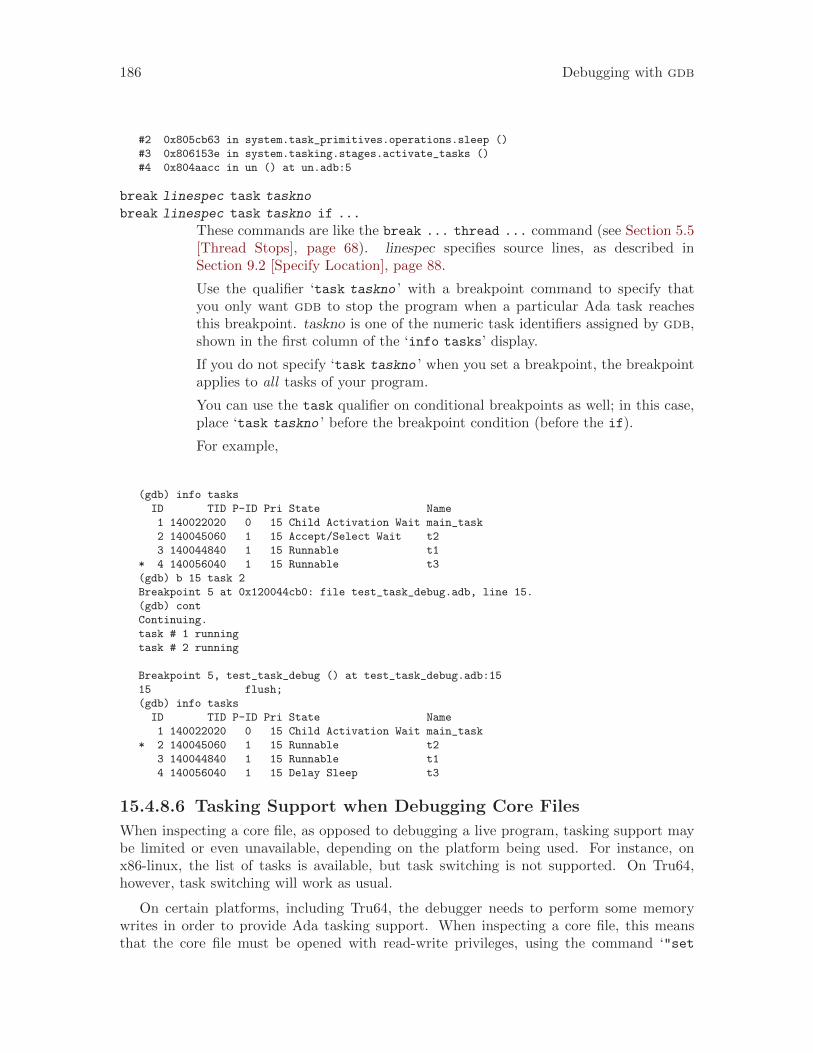
186 Debugging with gdb
#2 0x805cb63 in system.task_primitives.operations.sleep ()
#3 0x806153e in system.tasking.stages.activate_tasks ()
#4 0x804aacc in un () at un.adb:5
break linespec task taskno
break linespec task taskno if ...
These commands are like the break ... thread ... command (see Section 5.5[Thread Stops], page 68). linespec specifies source lines, as described inSection 9.2 [Specify Location], page 88.
Use the qualifier ‘task taskno ’ with a breakpoint command to specify thatyou only want gdb to stop the program when a particular Ada task reachesthis breakpoint. taskno is one of the numeric task identifiers assigned by gdb,shown in the first column of the ‘info tasks’ display.
If you do not specify ‘task taskno ’ when you set a breakpoint, the breakpointapplies to all tasks of your program.
You can use the task qualifier on conditional breakpoints as well; in this case,place ‘task taskno ’ before the breakpoint condition (before the if).
For example,
(gdb) info tasks
ID TID P-ID Pri State Name
1 140022020 0 15 Child Activation Wait main_task
2 140045060 1 15 Accept/Select Wait t2
3 140044840 1 15 Runnable t1
* 4 140056040 1 15 Runnable t3
(gdb) b 15 task 2
Breakpoint 5 at 0x120044cb0: file test_task_debug.adb, line 15.
(gdb) cont
Continuing.
task # 1 running
task # 2 running
Breakpoint 5, test_task_debug () at test_task_debug.adb:15
15 flush;
(gdb) info tasks
ID TID P-ID Pri State Name
1 140022020 0 15 Child Activation Wait main_task
* 2 140045060 1 15 Runnable t2
3 140044840 1 15 Runnable t1
4 140056040 1 15 Delay Sleep t3
15.4.8.6 Tasking Support when Debugging Core Files
When inspecting a core file, as opposed to debugging a live program, tasking support maybe limited or even unavailable, depending on the platform being used. For instance, onx86-linux, the list of tasks is available, but task switching is not supported. On Tru64,however, task switching will work as usual.
On certain platforms, including Tru64, the debugger needs to perform some memorywrites in order to provide Ada tasking support. When inspecting a core file, this meansthat the core file must be opened with read-write privileges, using the command ‘"set
Chapter 15: Using gdb with Different Languages 187
write on"’ (see Section 17.6 [Patching], page 199). Under these circumstances, you shouldmake a backup copy of the core file before inspecting it with gdb.
15.4.8.7 Tasking Support when using the Ravenscar Profile
The Ravenscar Profile is a subset of the Ada tasking features, specifically designed forsystems with safety-critical real-time requirements.
set ravenscar task-switching on
Allows task switching when debugging a program that uses the Ravenscar Pro-file. This is the default.
set ravenscar task-switching off
Turn off task switching when debugging a program that uses the RavenscarProfile. This is mostly intended to disable the code that adds support for theRavenscar Profile, in case a bug in either gdb or in the Ravenscar runtime ispreventing gdb from working properly. To be effective, this command shouldbe run before the program is started.
show ravenscar task-switching
Show whether it is possible to switch from task to task in a program using theRavenscar Profile.
15.4.8.8 Known Peculiarities of Ada Mode
Besides the omissions listed previously (see Section 15.4.8.2 [Omissions from Ada],page 181), we know of several problems with and limitations of Ada mode in gdb, someof which will be fixed with planned future releases of the debugger and the GNU Adacompiler.
• Static constants that the compiler chooses not to materialize as objects in storage areinvisible to the debugger.
• Named parameter associations in function argument lists are ignored (the argumentlists are treated as positional).
• Many useful library packages are currently invisible to the debugger.
• Fixed-point arithmetic, conversions, input, and output is carried out using floating-point arithmetic, and may give results that only approximate those on the host machine.
• The GNAT compiler never generates the prefix Standard for any of the standardsymbols defined by the Ada language. gdb knows about this: it will strip the prefixfrom names when you use it, and will never look for a name you have so qualifiedamong local symbols, nor match against symbols in other packages or subprograms. Ifyou have defined entities anywhere in your program other than parameters and localvariables whose simple names match names in Standard, GNAT’s lack of qualificationhere can cause confusion. When this happens, you can usually resolve the confusionby qualifying the problematic names with package Standard explicitly.
Older versions of the compiler sometimes generate erroneous debugging information,resulting in the debugger incorrectly printing the value of affected entities. In some cases,the debugger is able to work around an issue automatically. In other cases, the debugger isable to work around the issue, but the work-around has to be specifically enabled.
188 Debugging with gdb
set ada trust-PAD-over-XVS on
Configure GDB to strictly follow the GNAT encoding when computing thevalue of Ada entities, particularly when PAD and PAD___XVS types are involved(see ada/exp_dbug.ads in the GCC sources for a complete description of theencoding used by the GNAT compiler). This is the default.
set ada trust-PAD-over-XVS off
This is related to the encoding using by the GNAT compiler. If gdb sometimesprints the wrong value for certain entities, changing ada trust-PAD-over-XVS
to off activates a work-around which may fix the issue. It is always safe to setada trust-PAD-over-XVS to off, but this incurs a slight performance penalty,so it is recommended to leave this setting to on unless necessary.
15.5 Unsupported Languages
In addition to the other fully-supported programming languages, gdb also provides apseudo-language, called minimal. It does not represent a real programming language, butprovides a set of capabilities close to what the C or assembly languages provide. This shouldallow most simple operations to be performed while debugging an application that uses alanguage currently not supported by gdb.
If the language is set to auto, gdb will automatically select this language if the currentframe corresponds to an unsupported language.
Chapter 16: Examining the Symbol Table 189
16 Examining the Symbol Table
The commands described in this chapter allow you to inquire about the symbols (namesof variables, functions and types) defined in your program. This information is inherent inthe text of your program and does not change as your program executes. gdb finds it inyour program’s symbol table, in the file indicated when you started gdb (see Section 2.1.1[Choosing Files], page 12), or by one of the file-management commands (see Section 18.1[Commands to Specify Files], page 201).
Occasionally, you may need to refer to symbols that contain unusual characters, whichgdb ordinarily treats as word delimiters. The most frequent case is in referring to staticvariables in other source files (see Section 10.3 [Program Variables], page 99). File namesare recorded in object files as debugging symbols, but gdb would ordinarily parse a typicalfile name, like ‘foo.c’, as the three words ‘foo’ ‘.’ ‘c’. To allow gdb to recognize ‘foo.c’as a single symbol, enclose it in single quotes; for example,
p ’foo.c’::x
looks up the value of x in the scope of the file ‘foo.c’.
set case-sensitive on
set case-sensitive off
set case-sensitive auto
Normally, when gdb looks up symbols, it matches their names with case sensi-tivity determined by the current source language. Occasionally, you may wishto control that. The command set case-sensitive lets you do that by specify-ing on for case-sensitive matches or off for case-insensitive ones. If you specifyauto, case sensitivity is reset to the default suitable for the source language.The default is case-sensitive matches for all languages except for Fortran, forwhich the default is case-insensitive matches.
show case-sensitive
This command shows the current setting of case sensitivity for symbols lookups.
info address symbol
Describe where the data for symbol is stored. For a register variable, this sayswhich register it is kept in. For a non-register local variable, this prints thestack-frame offset at which the variable is always stored.
Note the contrast with ‘print &symbol ’, which does not work at all for a regis-ter variable, and for a stack local variable prints the exact address of the currentinstantiation of the variable.
info symbol addr
Print the name of a symbol which is stored at the address addr. If no symbolis stored exactly at addr, gdb prints the nearest symbol and an offset from it:
(gdb) info symbol 0x54320
_initialize_vx + 396 in section .text
This is the opposite of the info address command. You can use it to find outthe name of a variable or a function given its address.
For dynamically linked executables, the name of executable or shared librarycontaining the symbol is also printed:
190 Debugging with gdb
(gdb) info symbol 0x400225
_start + 5 in section .text of /tmp/a.out
(gdb) info symbol 0x2aaaac2811cf
__read_nocancel + 6 in section .text of /usr/lib64/libc.so.6
whatis [arg]
Print the data type of arg, which can be either an expression or a name of adata type. With no argument, print the data type of $, the last value in thevalue history.
If arg is an expression (see Section 10.1 [Expressions], page 97), it is not actuallyevaluated, and any side-effecting operations (such as assignments or functioncalls) inside it do not take place.
If arg is a variable or an expression, whatis prints its literal type as it is usedin the source code. If the type was defined using a typedef, whatis will notprint the data type underlying the typedef. If the type of the variable or theexpression is a compound data type, such as struct or class, whatis neverprints their fields or methods. It just prints the struct/class name (a.k.a.its tag). If you want to see the members of such a compound data type, useptype.
If arg is a type name that was defined using typedef, whatis unrolls only onelevel of that typedef. Unrolling means that whatis will show the underlyingtype used in the typedef declaration of arg. However, if that underlying typeis also a typedef, whatis will not unroll it.
For C code, the type names may also have the form ‘class class-name ’,‘struct struct-tag ’, ‘union union-tag ’ or ‘enum enum-tag ’.
ptype [arg]
ptype accepts the same arguments as whatis, but prints a detailed descriptionof the type, instead of just the name of the type. See Section 10.1 [Expressions],page 97.
Contrary to whatis, ptype always unrolls any typedefs in its argument dec-laration, whether the argument is a variable, expression, or a data type. Thismeans that ptype of a variable or an expression will not print literally its typeas present in the source code—use whatis for that. typedefs at the pointeror reference targets are also unrolled. Only typedefs of fields, methods andinner class typedefs of structs, classes and unions are not unrolled evenwith ptype.
For example, for this variable declaration:
typedef double real_t;
struct complex { real_t real; double imag; };
typedef struct complex complex_t;
complex_t var;
real_t *real_pointer_var;
the two commands give this output:
Chapter 16: Examining the Symbol Table 191
(gdb) whatis var
type = complex_t
(gdb) ptype var
type = struct complex {
real_t real;
double imag;
}
(gdb) whatis complex_t
type = struct complex
(gdb) whatis struct complex
type = struct complex
(gdb) ptype struct complex
type = struct complex {
real_t real;
double imag;
}
(gdb) whatis real_pointer_var
type = real_t *
(gdb) ptype real_pointer_var
type = double *
As with whatis, using ptype without an argument refers to the type of $, thelast value in the value history.
Sometimes, programs use opaque data types or incomplete specifications ofcomplex data structure. If the debug information included in the programdoes not allow gdb to display a full declaration of the data type, it will say‘<incomplete type>’. For example, given these declarations:
struct foo;
struct foo *fooptr;
but no definition for struct foo itself, gdb will say:(gdb) ptype foo
$1 = <incomplete type>
“Incomplete type” is C terminology for data types that are not completelyspecified.
info types regexp
info types
Print a brief description of all types whose names match the regular expressionregexp (or all types in your program, if you supply no argument). Each completetypename is matched as though it were a complete line; thus, ‘i type value’gives information on all types in your program whose names include the stringvalue, but ‘i type ^value$’ gives information only on types whose completename is value.
This command differs from ptype in two ways: first, like whatis, it does notprint a detailed description; second, it lists all source files where a type isdefined.
info scope location
List all the variables local to a particular scope. This command accepts alocation argument—a function name, a source line, or an address preceded bya ‘*’, and prints all the variables local to the scope defined by that location.(See Section 9.2 [Specify Location], page 88, for details about supported formsof location.) For example:
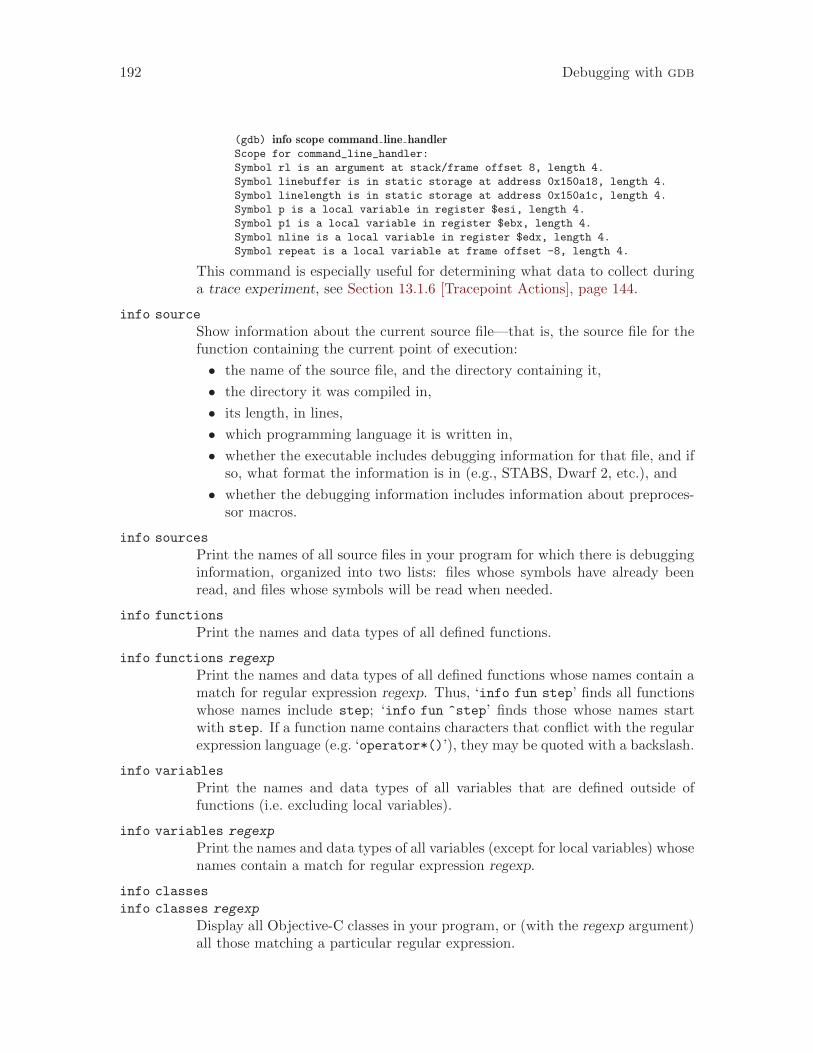
192 Debugging with gdb
(gdb) info scope command line handlerScope for command_line_handler:
Symbol rl is an argument at stack/frame offset 8, length 4.
Symbol linebuffer is in static storage at address 0x150a18, length 4.
Symbol linelength is in static storage at address 0x150a1c, length 4.
Symbol p is a local variable in register $esi, length 4.
Symbol p1 is a local variable in register $ebx, length 4.
Symbol nline is a local variable in register $edx, length 4.
Symbol repeat is a local variable at frame offset -8, length 4.
This command is especially useful for determining what data to collect duringa trace experiment, see Section 13.1.6 [Tracepoint Actions], page 144.
info source
Show information about the current source file—that is, the source file for thefunction containing the current point of execution:
• the name of the source file, and the directory containing it,
• the directory it was compiled in,
• its length, in lines,
• which programming language it is written in,
• whether the executable includes debugging information for that file, and ifso, what format the information is in (e.g., STABS, Dwarf 2, etc.), and
• whether the debugging information includes information about preproces-sor macros.
info sources
Print the names of all source files in your program for which there is debugginginformation, organized into two lists: files whose symbols have already beenread, and files whose symbols will be read when needed.
info functions
Print the names and data types of all defined functions.
info functions regexp
Print the names and data types of all defined functions whose names contain amatch for regular expression regexp. Thus, ‘info fun step’ finds all functionswhose names include step; ‘info fun ^step’ finds those whose names startwith step. If a function name contains characters that conflict with the regularexpression language (e.g. ‘operator*()’), they may be quoted with a backslash.
info variables
Print the names and data types of all variables that are defined outside offunctions (i.e. excluding local variables).
info variables regexp
Print the names and data types of all variables (except for local variables) whosenames contain a match for regular expression regexp.
info classes
info classes regexp
Display all Objective-C classes in your program, or (with the regexp argument)all those matching a particular regular expression.
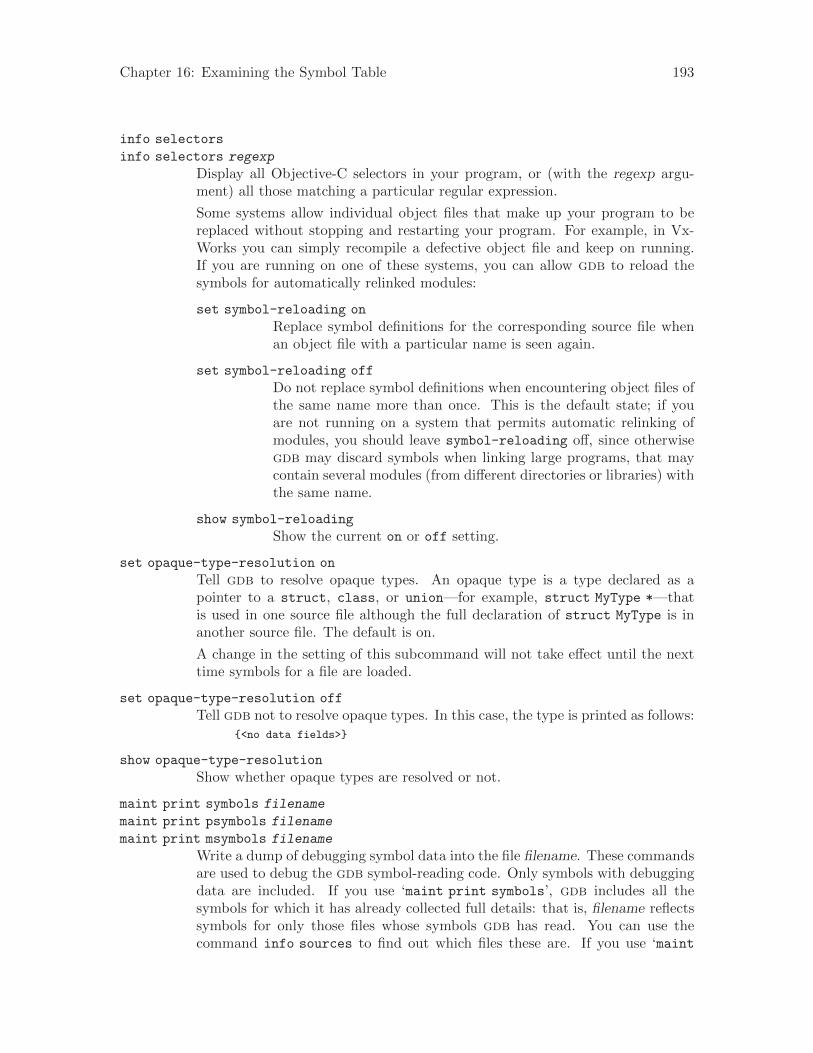
Chapter 16: Examining the Symbol Table 193
info selectors
info selectors regexp
Display all Objective-C selectors in your program, or (with the regexp argu-ment) all those matching a particular regular expression.
Some systems allow individual object files that make up your program to bereplaced without stopping and restarting your program. For example, in Vx-Works you can simply recompile a defective object file and keep on running.If you are running on one of these systems, you can allow gdb to reload thesymbols for automatically relinked modules:
set symbol-reloading on
Replace symbol definitions for the corresponding source file whenan object file with a particular name is seen again.
set symbol-reloading off
Do not replace symbol definitions when encountering object files ofthe same name more than once. This is the default state; if youare not running on a system that permits automatic relinking ofmodules, you should leave symbol-reloading off, since otherwisegdb may discard symbols when linking large programs, that maycontain several modules (from different directories or libraries) withthe same name.
show symbol-reloading
Show the current on or off setting.
set opaque-type-resolution on
Tell gdb to resolve opaque types. An opaque type is a type declared as apointer to a struct, class, or union—for example, struct MyType *—thatis used in one source file although the full declaration of struct MyType is inanother source file. The default is on.
A change in the setting of this subcommand will not take effect until the nexttime symbols for a file are loaded.
set opaque-type-resolution off
Tell gdb not to resolve opaque types. In this case, the type is printed as follows:
{<no data fields>}
show opaque-type-resolution
Show whether opaque types are resolved or not.
maint print symbols filename
maint print psymbols filename
maint print msymbols filename
Write a dump of debugging symbol data into the file filename. These commandsare used to debug the gdb symbol-reading code. Only symbols with debuggingdata are included. If you use ‘maint print symbols’, gdb includes all thesymbols for which it has already collected full details: that is, filename reflectssymbols for only those files whose symbols gdb has read. You can use thecommand info sources to find out which files these are. If you use ‘maint
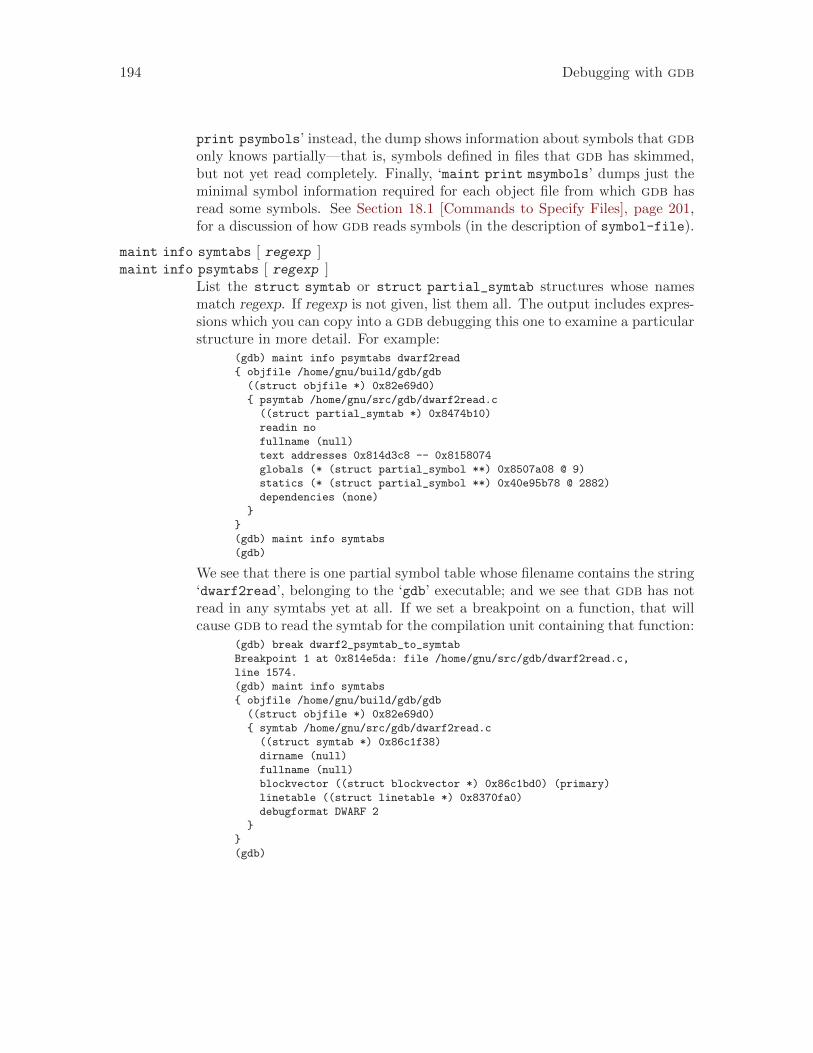
194 Debugging with gdb
print psymbols’ instead, the dump shows information about symbols that gdbonly knows partially—that is, symbols defined in files that gdb has skimmed,but not yet read completely. Finally, ‘maint print msymbols’ dumps just theminimal symbol information required for each object file from which gdb hasread some symbols. See Section 18.1 [Commands to Specify Files], page 201,for a discussion of how gdb reads symbols (in the description of symbol-file).
maint info symtabs [ regexp ]maint info psymtabs [ regexp ]
List the struct symtab or struct partial_symtab structures whose namesmatch regexp. If regexp is not given, list them all. The output includes expres-sions which you can copy into a gdb debugging this one to examine a particularstructure in more detail. For example:
(gdb) maint info psymtabs dwarf2read
{ objfile /home/gnu/build/gdb/gdb
((struct objfile *) 0x82e69d0)
{ psymtab /home/gnu/src/gdb/dwarf2read.c
((struct partial_symtab *) 0x8474b10)
readin no
fullname (null)
text addresses 0x814d3c8 -- 0x8158074
globals (* (struct partial_symbol **) 0x8507a08 @ 9)
statics (* (struct partial_symbol **) 0x40e95b78 @ 2882)
dependencies (none)
}
}
(gdb) maint info symtabs
(gdb)
We see that there is one partial symbol table whose filename contains the string‘dwarf2read’, belonging to the ‘gdb’ executable; and we see that gdb has notread in any symtabs yet at all. If we set a breakpoint on a function, that willcause gdb to read the symtab for the compilation unit containing that function:
(gdb) break dwarf2_psymtab_to_symtab
Breakpoint 1 at 0x814e5da: file /home/gnu/src/gdb/dwarf2read.c,
line 1574.
(gdb) maint info symtabs
{ objfile /home/gnu/build/gdb/gdb
((struct objfile *) 0x82e69d0)
{ symtab /home/gnu/src/gdb/dwarf2read.c
((struct symtab *) 0x86c1f38)
dirname (null)
fullname (null)
blockvector ((struct blockvector *) 0x86c1bd0) (primary)
linetable ((struct linetable *) 0x8370fa0)
debugformat DWARF 2
}
}
(gdb)
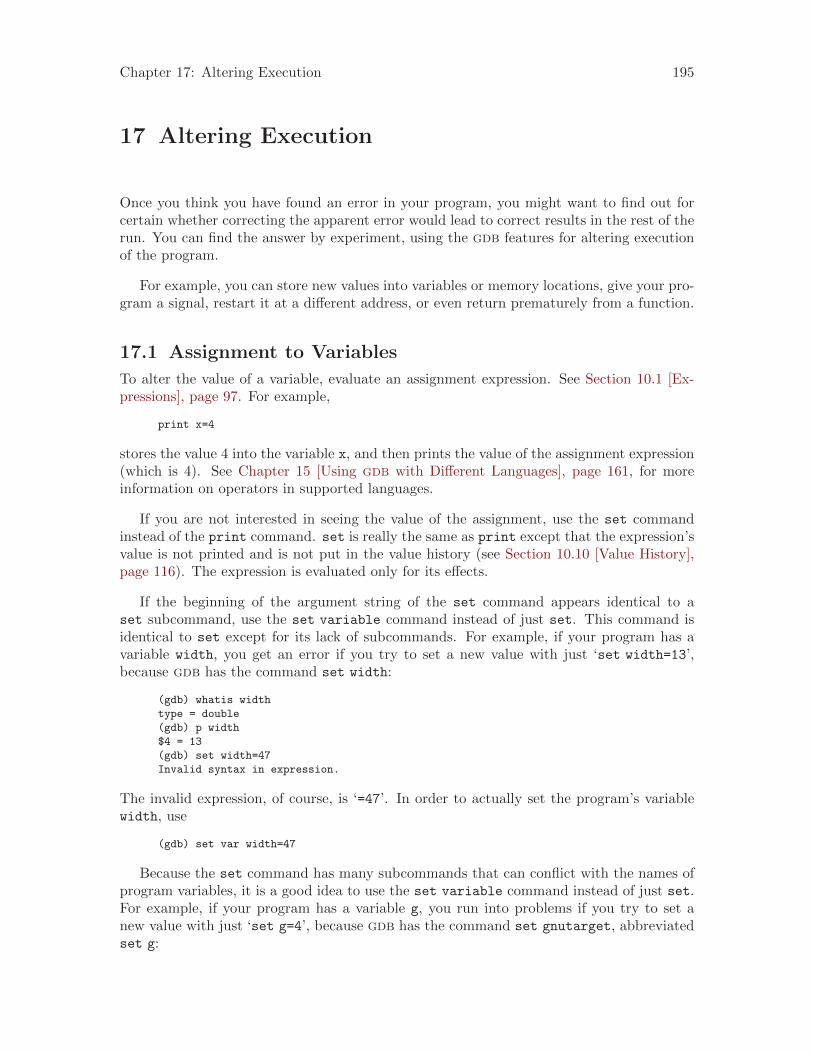
Chapter 17: Altering Execution 195
17 Altering Execution
Once you think you have found an error in your program, you might want to find out forcertain whether correcting the apparent error would lead to correct results in the rest of therun. You can find the answer by experiment, using the gdb features for altering executionof the program.
For example, you can store new values into variables or memory locations, give your pro-gram a signal, restart it at a different address, or even return prematurely from a function.
17.1 Assignment to Variables
To alter the value of a variable, evaluate an assignment expression. See Section 10.1 [Ex-pressions], page 97. For example,
print x=4
stores the value 4 into the variable x, and then prints the value of the assignment expression(which is 4). See Chapter 15 [Using gdb with Different Languages], page 161, for moreinformation on operators in supported languages.
If you are not interested in seeing the value of the assignment, use the set commandinstead of the print command. set is really the same as print except that the expression’svalue is not printed and is not put in the value history (see Section 10.10 [Value History],page 116). The expression is evaluated only for its effects.
If the beginning of the argument string of the set command appears identical to aset subcommand, use the set variable command instead of just set. This command isidentical to set except for its lack of subcommands. For example, if your program has avariable width, you get an error if you try to set a new value with just ‘set width=13’,because gdb has the command set width:
(gdb) whatis width
type = double
(gdb) p width
$4 = 13
(gdb) set width=47
Invalid syntax in expression.
The invalid expression, of course, is ‘=47’. In order to actually set the program’s variablewidth, use
(gdb) set var width=47
Because the set command has many subcommands that can conflict with the names ofprogram variables, it is a good idea to use the set variable command instead of just set.For example, if your program has a variable g, you run into problems if you try to set anew value with just ‘set g=4’, because gdb has the command set gnutarget, abbreviatedset g:
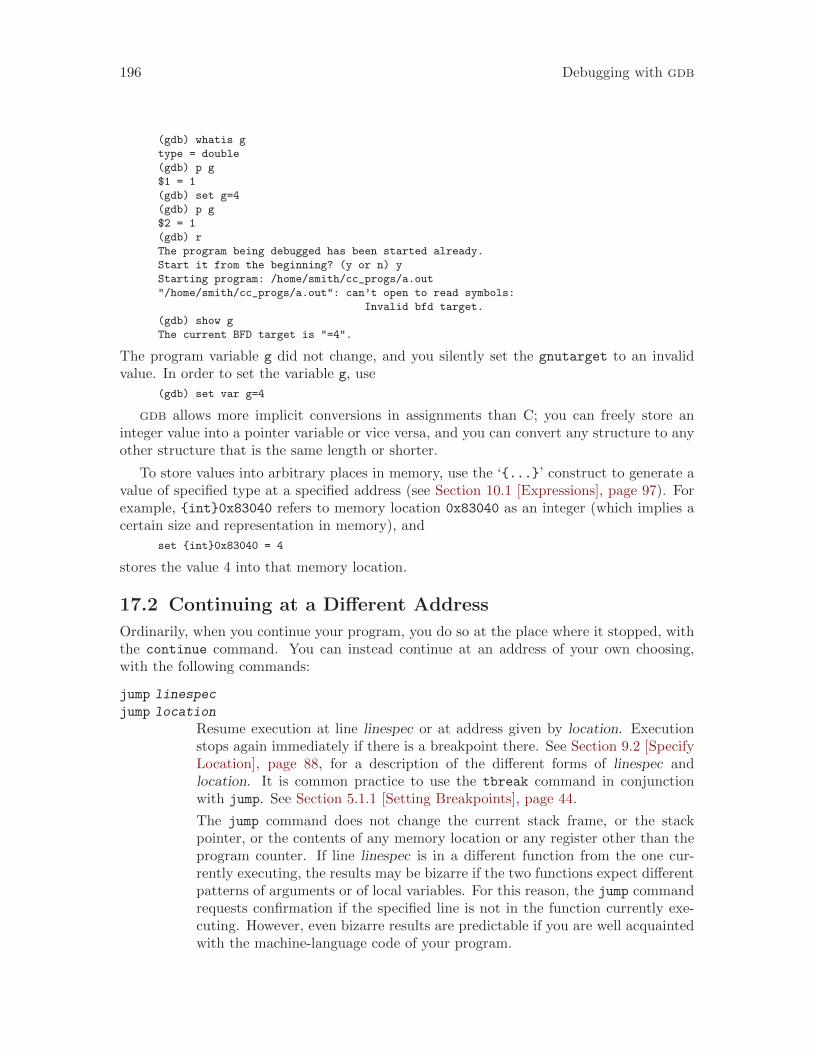
196 Debugging with gdb
(gdb) whatis g
type = double
(gdb) p g
$1 = 1
(gdb) set g=4
(gdb) p g
$2 = 1
(gdb) r
The program being debugged has been started already.
Start it from the beginning? (y or n) y
Starting program: /home/smith/cc_progs/a.out
"/home/smith/cc_progs/a.out": can’t open to read symbols:
Invalid bfd target.
(gdb) show g
The current BFD target is "=4".
The program variable g did not change, and you silently set the gnutarget to an invalidvalue. In order to set the variable g, use
(gdb) set var g=4
gdb allows more implicit conversions in assignments than C; you can freely store aninteger value into a pointer variable or vice versa, and you can convert any structure to anyother structure that is the same length or shorter.
To store values into arbitrary places in memory, use the ‘{...}’ construct to generate avalue of specified type at a specified address (see Section 10.1 [Expressions], page 97). Forexample, {int}0x83040 refers to memory location 0x83040 as an integer (which implies acertain size and representation in memory), and
set {int}0x83040 = 4
stores the value 4 into that memory location.
17.2 Continuing at a Different Address
Ordinarily, when you continue your program, you do so at the place where it stopped, withthe continue command. You can instead continue at an address of your own choosing,with the following commands:
jump linespec
jump location
Resume execution at line linespec or at address given by location. Executionstops again immediately if there is a breakpoint there. See Section 9.2 [SpecifyLocation], page 88, for a description of the different forms of linespec andlocation. It is common practice to use the tbreak command in conjunctionwith jump. See Section 5.1.1 [Setting Breakpoints], page 44.
The jump command does not change the current stack frame, or the stackpointer, or the contents of any memory location or any register other than theprogram counter. If line linespec is in a different function from the one cur-rently executing, the results may be bizarre if the two functions expect differentpatterns of arguments or of local variables. For this reason, the jump commandrequests confirmation if the specified line is not in the function currently exe-cuting. However, even bizarre results are predictable if you are well acquaintedwith the machine-language code of your program.
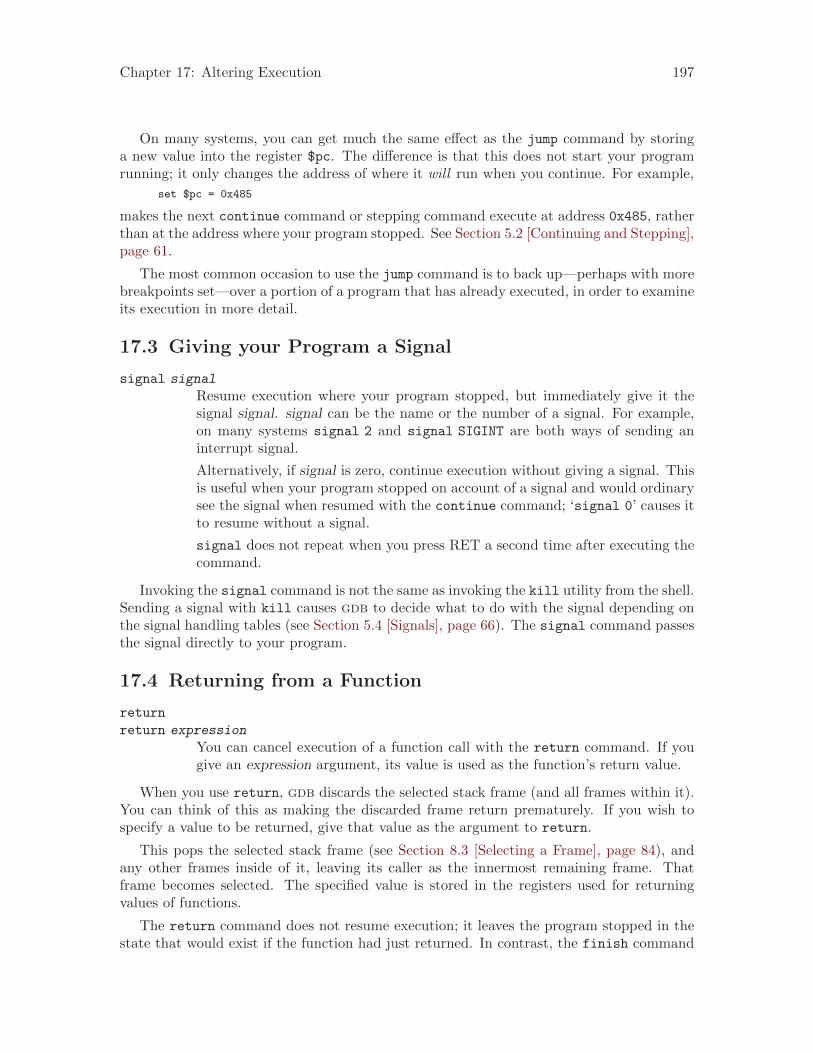
Chapter 17: Altering Execution 197
On many systems, you can get much the same effect as the jump command by storinga new value into the register $pc. The difference is that this does not start your programrunning; it only changes the address of where it will run when you continue. For example,
set $pc = 0x485
makes the next continue command or stepping command execute at address 0x485, ratherthan at the address where your program stopped. See Section 5.2 [Continuing and Stepping],page 61.
The most common occasion to use the jump command is to back up—perhaps with morebreakpoints set—over a portion of a program that has already executed, in order to examineits execution in more detail.
17.3 Giving your Program a Signal
signal signal
Resume execution where your program stopped, but immediately give it thesignal signal. signal can be the name or the number of a signal. For example,on many systems signal 2 and signal SIGINT are both ways of sending aninterrupt signal.
Alternatively, if signal is zero, continue execution without giving a signal. Thisis useful when your program stopped on account of a signal and would ordinarysee the signal when resumed with the continue command; ‘signal 0’ causes itto resume without a signal.
signal does not repeat when you press RET a second time after executing thecommand.
Invoking the signal command is not the same as invoking the kill utility from the shell.Sending a signal with kill causes gdb to decide what to do with the signal depending onthe signal handling tables (see Section 5.4 [Signals], page 66). The signal command passesthe signal directly to your program.
17.4 Returning from a Function
return
return expression
You can cancel execution of a function call with the return command. If yougive an expression argument, its value is used as the function’s return value.
When you use return, gdb discards the selected stack frame (and all frames within it).You can think of this as making the discarded frame return prematurely. If you wish tospecify a value to be returned, give that value as the argument to return.
This pops the selected stack frame (see Section 8.3 [Selecting a Frame], page 84), andany other frames inside of it, leaving its caller as the innermost remaining frame. Thatframe becomes selected. The specified value is stored in the registers used for returningvalues of functions.
The return command does not resume execution; it leaves the program stopped in thestate that would exist if the function had just returned. In contrast, the finish command
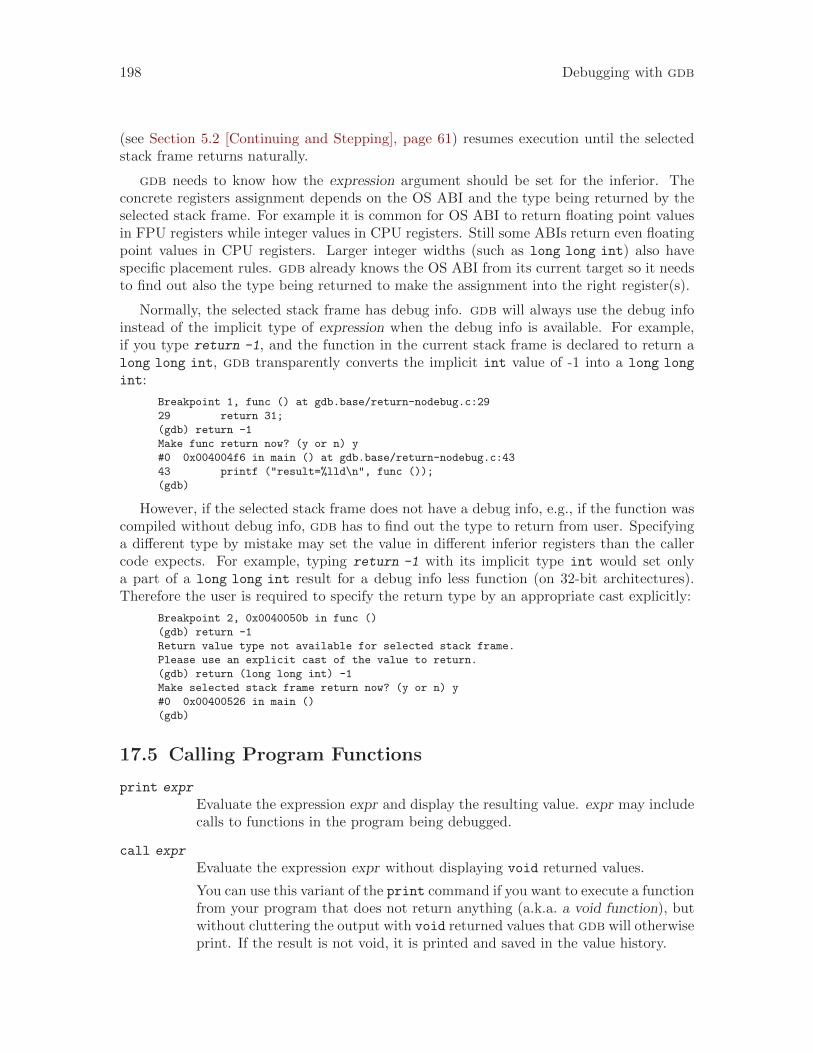
198 Debugging with gdb
(see Section 5.2 [Continuing and Stepping], page 61) resumes execution until the selectedstack frame returns naturally.
gdb needs to know how the expression argument should be set for the inferior. Theconcrete registers assignment depends on the OS ABI and the type being returned by theselected stack frame. For example it is common for OS ABI to return floating point valuesin FPU registers while integer values in CPU registers. Still some ABIs return even floatingpoint values in CPU registers. Larger integer widths (such as long long int) also havespecific placement rules. gdb already knows the OS ABI from its current target so it needsto find out also the type being returned to make the assignment into the right register(s).
Normally, the selected stack frame has debug info. gdb will always use the debug infoinstead of the implicit type of expression when the debug info is available. For example,if you type return -1, and the function in the current stack frame is declared to return along long int, gdb transparently converts the implicit int value of -1 into a long long
int:
Breakpoint 1, func () at gdb.base/return-nodebug.c:29
29 return 31;
(gdb) return -1
Make func return now? (y or n) y
#0 0x004004f6 in main () at gdb.base/return-nodebug.c:43
43 printf ("result=%lld\n", func ());
(gdb)
However, if the selected stack frame does not have a debug info, e.g., if the function wascompiled without debug info, gdb has to find out the type to return from user. Specifyinga different type by mistake may set the value in different inferior registers than the callercode expects. For example, typing return -1 with its implicit type int would set onlya part of a long long int result for a debug info less function (on 32-bit architectures).Therefore the user is required to specify the return type by an appropriate cast explicitly:
Breakpoint 2, 0x0040050b in func ()
(gdb) return -1
Return value type not available for selected stack frame.
Please use an explicit cast of the value to return.
(gdb) return (long long int) -1
Make selected stack frame return now? (y or n) y
#0 0x00400526 in main ()
(gdb)
17.5 Calling Program Functions
print expr
Evaluate the expression expr and display the resulting value. expr may includecalls to functions in the program being debugged.
call expr
Evaluate the expression expr without displaying void returned values.
You can use this variant of the print command if you want to execute a functionfrom your program that does not return anything (a.k.a. a void function), butwithout cluttering the output with void returned values that gdb will otherwiseprint. If the result is not void, it is printed and saved in the value history.
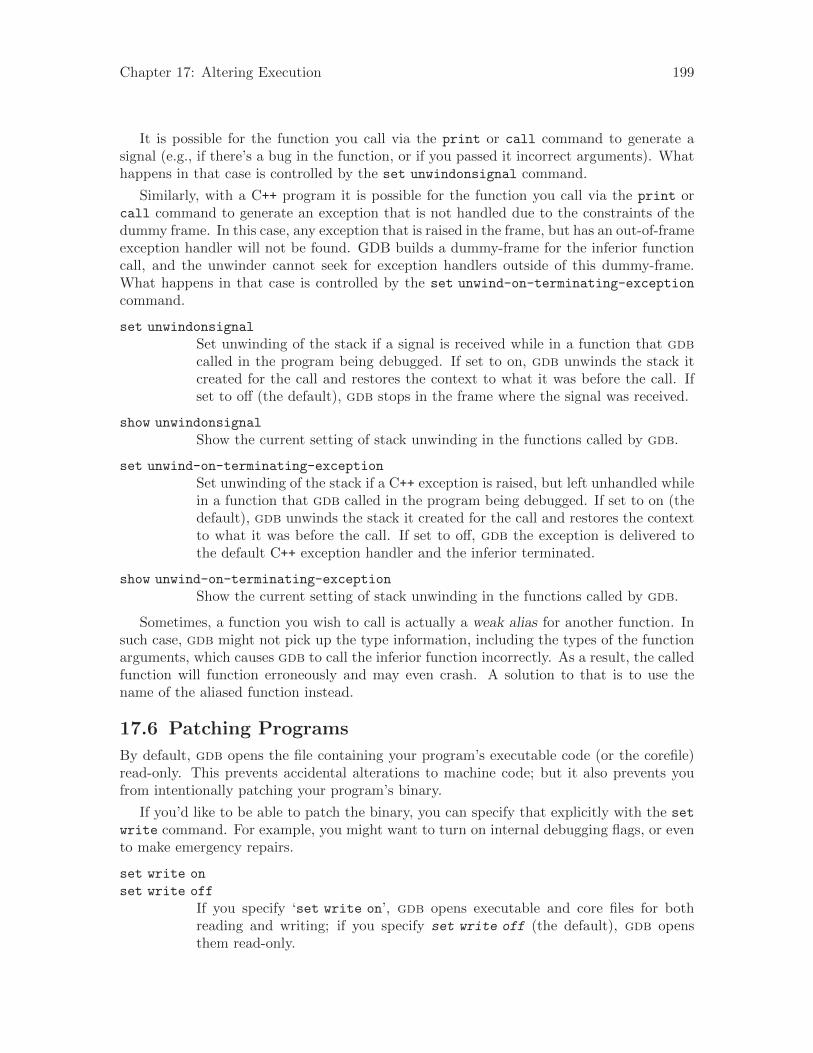
Chapter 17: Altering Execution 199
It is possible for the function you call via the print or call command to generate asignal (e.g., if there’s a bug in the function, or if you passed it incorrect arguments). Whathappens in that case is controlled by the set unwindonsignal command.
Similarly, with a C++ program it is possible for the function you call via the print orcall command to generate an exception that is not handled due to the constraints of thedummy frame. In this case, any exception that is raised in the frame, but has an out-of-frameexception handler will not be found. GDB builds a dummy-frame for the inferior functioncall, and the unwinder cannot seek for exception handlers outside of this dummy-frame.What happens in that case is controlled by the set unwind-on-terminating-exception
command.
set unwindonsignal
Set unwinding of the stack if a signal is received while in a function that gdbcalled in the program being debugged. If set to on, gdb unwinds the stack itcreated for the call and restores the context to what it was before the call. Ifset to off (the default), gdb stops in the frame where the signal was received.
show unwindonsignal
Show the current setting of stack unwinding in the functions called by gdb.
set unwind-on-terminating-exception
Set unwinding of the stack if a C++ exception is raised, but left unhandled whilein a function that gdb called in the program being debugged. If set to on (thedefault), gdb unwinds the stack it created for the call and restores the contextto what it was before the call. If set to off, gdb the exception is delivered tothe default C++ exception handler and the inferior terminated.
show unwind-on-terminating-exception
Show the current setting of stack unwinding in the functions called by gdb.
Sometimes, a function you wish to call is actually a weak alias for another function. Insuch case, gdb might not pick up the type information, including the types of the functionarguments, which causes gdb to call the inferior function incorrectly. As a result, the calledfunction will function erroneously and may even crash. A solution to that is to use thename of the aliased function instead.
17.6 Patching Programs
By default, gdb opens the file containing your program’s executable code (or the corefile)read-only. This prevents accidental alterations to machine code; but it also prevents youfrom intentionally patching your program’s binary.
If you’d like to be able to patch the binary, you can specify that explicitly with the setwrite command. For example, you might want to turn on internal debugging flags, or evento make emergency repairs.
set write on
set write off
If you specify ‘set write on’, gdb opens executable and core files for bothreading and writing; if you specify set write off (the default), gdb opensthem read-only.

200 Debugging with gdb
If you have already loaded a file, you must load it again (using the exec-file
or core-file command) after changing set write, for your new setting to takeeffect.
show write
Display whether executable files and core files are opened for writing as well asreading.
Chapter 18: gdb Files 201
18 gdb Files
gdb needs to know the file name of the program to be debugged, both in order to read itssymbol table and in order to start your program. To debug a core dump of a previous run,you must also tell gdb the name of the core dump file.
18.1 Commands to Specify Files
You may want to specify executable and core dump file names. The usual way to do this isat start-up time, using the arguments to gdb’s start-up commands (see Chapter 2 [GettingIn and Out of gdb], page 11).
Occasionally it is necessary to change to a different file during a gdb session. Or youmay run gdb and forget to specify a file you want to use. Or you are debugging a remotetarget via gdbserver (see Section 20.3 [Using the gdbserver Program], page 221). In thesesituations the gdb commands to specify new files are useful.
file filename
Use filename as the program to be debugged. It is read for its symbols and forthe contents of pure memory. It is also the program executed when you usethe run command. If you do not specify a directory and the file is not foundin the gdb working directory, gdb uses the environment variable PATH as a listof directories to search, just as the shell does when looking for a program torun. You can change the value of this variable, for both gdb and your program,using the path command.
You can load unlinked object ‘.o’ files into gdb using the file command. Youwill not be able to “run” an object file, but you can disassemble functions andinspect variables. Also, if the underlying BFD functionality supports it, youcould use gdb -write to patch object files using this technique. Note that gdbcan neither interpret nor modify relocations in this case, so branches and someinitialized variables will appear to go to the wrong place. But this feature isstill handy from time to time.
file file with no argument makes gdb discard any information it has on bothexecutable file and the symbol table.
exec-file [ filename ]Specify that the program to be run (but not the symbol table) is found in file-name. gdb searches the environment variable PATH if necessary to locate yourprogram. Omitting filename means to discard information on the executablefile.
symbol-file [ filename ]Read symbol table information from file filename. PATH is searched when nec-essary. Use the file command to get both symbol table and program to runfrom the same file.
symbol-file with no argument clears out gdb information on your program’ssymbol table.
The symbol-file command causes gdb to forget the contents of some break-points and auto-display expressions. This is because they may contain pointers
202 Debugging with gdb
to the internal data recording symbols and data types, which are part of theold symbol table data being discarded inside gdb.
symbol-file does not repeat if you press RET again after executing it once.
When gdb is configured for a particular environment, it understands debugginginformation in whatever format is the standard generated for that environment;you may use either a gnu compiler, or other compilers that adhere to the localconventions. Best results are usually obtained from gnu compilers; for example,using gcc you can generate debugging information for optimized code.
For most kinds of object files, with the exception of old SVR3 systems usingCOFF, the symbol-file command does not normally read the symbol table infull right away. Instead, it scans the symbol table quickly to find which sourcefiles and which symbols are present. The details are read later, one source fileat a time, as they are needed.
The purpose of this two-stage reading strategy is to make gdb start up faster.For the most part, it is invisible except for occasional pauses while the symboltable details for a particular source file are being read. (The set verbose
command can turn these pauses into messages if desired. See Section 22.7[Optional Warnings and Messages], page 270.)
We have not implemented the two-stage strategy for COFF yet. When thesymbol table is stored in COFF format, symbol-file reads the symbol tabledata in full right away. Note that “stabs-in-COFF” still does the two-stagestrategy, since the debug info is actually in stabs format.
symbol-file [ -readnow ] filenamefile [ -readnow ] filename
You can override the gdb two-stage strategy for reading symbol tables by us-ing the ‘-readnow’ option with any of the commands that load symbol tableinformation, if you want to be sure gdb has the entire symbol table available.
core-file [filename ]core Specify the whereabouts of a core dump file to be used as the “contents of
memory”. Traditionally, core files contain only some parts of the address spaceof the process that generated them; gdb can access the executable file itself forother parts.
core-file with no argument specifies that no core file is to be used.
Note that the core file is ignored when your program is actually running undergdb. So, if you have been running your program and you wish to debug a corefile instead, you must kill the subprocess in which the program is running. Todo this, use the kill command (see Section 4.8 [Killing the Child Process],page 32).
add-symbol-file filename address
add-symbol-file filename address [ -readnow ]add-symbol-file filename address -s section address ...
The add-symbol-file command reads additional symbol table informationfrom the file filename. You would use this command when filename has beendynamically loaded (by some other means) into the program that is running.
Chapter 18: gdb Files 203
address should be the memory address at which the file has been loaded; gdbcannot figure this out for itself. You can additionally specify an arbitrarynumber of ‘-s section address ’ pairs, to give an explicit section name andbase address for that section. You can specify any address as an expression.
The symbol table of the file filename is added to the symbol table originally readwith the symbol-file command. You can use the add-symbol-file commandany number of times; the new symbol data thus read keeps adding to the old.To discard all old symbol data instead, use the symbol-file command withoutany arguments.
Although filename is typically a shared library file, an executable file, or someother object file which has been fully relocated for loading into a process, youcan also load symbolic information from relocatable ‘.o’ files, as long as:
• the file’s symbolic information refers only to linker symbols defined in thatfile, not to symbols defined by other object files,
• every section the file’s symbolic information refers to has actually beenloaded into the inferior, as it appears in the file, and
• you can determine the address at which every section was loaded, andprovide these to the add-symbol-file command.
Some embedded operating systems, like Sun Chorus and VxWorks, can loadrelocatable files into an already running program; such systems typically makethe requirements above easy to meet. However, it’s important to recognize thatmany native systems use complex link procedures (.linkonce section factoringand C++ constructor table assembly, for example) that make the requirementsdifficult to meet. In general, one cannot assume that using add-symbol-file
to read a relocatable object file’s symbolic information will have the same effectas linking the relocatable object file into the program in the normal way.
add-symbol-file does not repeat if you press RET after using it.
add-symbol-file-from-memory address
Load symbols from the given address in a dynamically loaded object file whoseimage is mapped directly into the inferior’s memory. For example, the Linuxkernel maps a syscall DSO into each process’s address space; this DSO provideskernel-specific code for some system calls. The argument can be any expres-sion whose evaluation yields the address of the file’s shared object file header.For this command to work, you must have used symbol-file or exec-file
commands in advance.
add-shared-symbol-files library-file
assf library-file
The add-shared-symbol-files command can currently be used only in theCygwin build of gdb on MS-Windows OS, where it is an alias for the dll-
symbols command (see Section 21.1.5 [Cygwin Native], page 239). gdb auto-matically looks for shared libraries, however if gdb does not find yours, you caninvoke add-shared-symbol-files. It takes one argument: the shared library’sfile name. assf is a shorthand alias for add-shared-symbol-files.
204 Debugging with gdb
section section addr
The section command changes the base address of the named section of theexec file to addr. This can be used if the exec file does not contain sectionaddresses, (such as in the a.out format), or when the addresses specified in thefile itself are wrong. Each section must be changed separately. The info files
command, described below, lists all the sections and their addresses.
info files
info target
info files and info target are synonymous; both print the current target(see Chapter 19 [Specifying a Debugging Target], page 215), including thenames of the executable and core dump files currently in use by gdb, andthe files from which symbols were loaded. The command help target lists allpossible targets rather than current ones.
maint info sections
Another command that can give you extra information about program sectionsis maint info sections. In addition to the section information displayed byinfo files, this command displays the flags and file offset of each section inthe executable and core dump files. In addition, maint info sections providesthe following command options (which may be arbitrarily combined):
ALLOBJ Display sections for all loaded object files, including shared li-braries.
sections Display info only for named sections.
section-flags
Display info only for sections for which section-flags are true. Thesection flags that gdb currently knows about are:
ALLOC Section will have space allocated in the process whenloaded. Set for all sections except those containing de-bug information.
LOAD Section will be loaded from the file into the child pro-cess memory. Set for pre-initialized code and data,clear for .bss sections.
RELOC Section needs to be relocated before loading.
READONLY Section cannot be modified by the child process.
CODE Section contains executable code only.
DATA Section contains data only (no executable code).
ROM Section will reside in ROM.
CONSTRUCTOR
Section contains data for constructor/destructor lists.
HAS_CONTENTS
Section is not empty.
Chapter 18: gdb Files 205
NEVER_LOAD
An instruction to the linker to not output the section.
COFF_SHARED_LIBRARY
A notification to the linker that the section containsCOFF shared library information.
IS_COMMON
Section contains common symbols.
set trust-readonly-sections on
Tell gdb that readonly sections in your object file really are read-only (i.e.that their contents will not change). In that case, gdb can fetch values fromthese sections out of the object file, rather than from the target program. Forsome targets (notably embedded ones), this can be a significant enhancementto debugging performance.
The default is off.
set trust-readonly-sections off
Tell gdb not to trust readonly sections. This means that the contents of thesection might change while the program is running, and must therefore befetched from the target when needed.
show trust-readonly-sections
Show the current setting of trusting readonly sections.
All file-specifying commands allow both absolute and relative file names as arguments.gdb always converts the file name to an absolute file name and remembers it that way.
gdb supports gnu/Linux, MS-Windows, HP-UX, SunOS, SVr4, Irix, and IBM RS/6000AIX shared libraries.
On MS-Windows gdb must be linked with the Expat library to support shared libraries.See [Expat], page 453.
gdb automatically loads symbol definitions from shared libraries when you use the runcommand, or when you examine a core file. (Before you issue the run command, gdbdoes not understand references to a function in a shared library, however—unless you aredebugging a core file).
On HP-UX, if the program loads a library explicitly, gdb automatically loads the symbolsat the time of the shl_load call.
There are times, however, when you may wish to not automatically load symbol defini-tions from shared libraries, such as when they are particularly large or there are many ofthem.
To control the automatic loading of shared library symbols, use the commands:
set auto-solib-add mode
If mode is on, symbols from all shared object libraries will be loaded auto-matically when the inferior begins execution, you attach to an independentlystarted inferior, or when the dynamic linker informs gdb that a new libraryhas been loaded. If mode is off, symbols must be loaded manually, using thesharedlibrary command. The default value is on.
206 Debugging with gdb
If your program uses lots of shared libraries with debug info that takes largeamounts of memory, you can decrease the gdb memory footprint by prevent-ing it from automatically loading the symbols from shared libraries. To thatend, type set auto-solib-add off before running the inferior, then load eachlibrary whose debug symbols you do need with sharedlibrary regexp , whereregexp is a regular expression that matches the libraries whose symbols youwant to be loaded.
show auto-solib-add
Display the current autoloading mode.
To explicitly load shared library symbols, use the sharedlibrary command:
info share regex
info sharedlibrary regex
Print the names of the shared libraries which are currently loaded that matchregex. If regex is omitted then print all shared libraries that are loaded.
sharedlibrary regex
share regex
Load shared object library symbols for files matching a Unix regular expression.As with files loaded automatically, it only loads shared libraries required by yourprogram for a core file or after typing run. If regex is omitted all shared librariesrequired by your program are loaded.
nosharedlibrary
Unload all shared object library symbols. This discards all symbols that havebeen loaded from all shared libraries. Symbols from shared libraries that wereloaded by explicit user requests are not discarded.
Sometimes you may wish that gdb stops and gives you control when any of sharedlibrary events happen. Use the set stop-on-solib-events command for this:
set stop-on-solib-events
This command controls whether gdb should give you control when the dynamiclinker notifies it about some shared library event. The most common event ofinterest is loading or unloading of a new shared library.
show stop-on-solib-events
Show whether gdb stops and gives you control when shared library eventshappen.
Shared libraries are also supported in many cross or remote debugging configurations.gdb needs to have access to the target’s libraries; this can be accomplished either byproviding copies of the libraries on the host system, or by asking gdb to automaticallyretrieve the libraries from the target. If copies of the target libraries are provided, they needto be the same as the target libraries, although the copies on the target can be stripped aslong as the copies on the host are not.
For remote debugging, you need to tell gdb where the target libraries are, so that itcan load the correct copies—otherwise, it may try to load the host’s libraries. gdb has twovariables to specify the search directories for target libraries.
Chapter 18: gdb Files 207
set sysroot path
Use path as the system root for the program being debugged. Any absoluteshared library paths will be prefixed with path; many runtime loaders store theabsolute paths to the shared library in the target program’s memory. If youuse set sysroot to find shared libraries, they need to be laid out in the sameway that they are on the target, with e.g. a ‘/lib’ and ‘/usr/lib’ hierarchyunder path.
If path starts with the sequence ‘remote:’, gdb will retrieve the target librariesfrom the remote system. This is only supported when using a remote targetthat supports the remote get command (see Section 20.2 [Sending files to aremote system], page 221). The part of path following the initial ‘remote:’ (ifpresent) is used as system root prefix on the remote file system.1
For targets with an MS-DOS based filesystem, such as MS-Windows and Sym-bianOS, gdb tries prefixing a few variants of the target absolute file name withpath. But first, on Unix hosts, gdb converts all backslash directory separatorsinto forward slashes, because the backslash is not a directory separator on Unix:
c:\foo\bar.dll ⇒ c:/foo/bar.dll
Then, gdb attempts prefixing the target file name with path, and looks for theresulting file name in the host file system:
c:/foo/bar.dll ⇒ /path/to/sysroot/c:/foo/bar.dll
If that does not find the shared library, gdb tries removing the ‘:’ characterfrom the drive spec, both for convenience, and, for the case of the host filesystem not supporting file names with colons:
c:/foo/bar.dll ⇒ /path/to/sysroot/c/foo/bar.dll
This makes it possible to have a system root that mirrors a target with morethan one drive. E.g., you may want to setup your local copies of the targetsystem shared libraries like so (note ‘c’ vs ‘z’):
‘/path/to/sysroot/c/sys/bin/foo.dll’
‘/path/to/sysroot/c/sys/bin/bar.dll’
‘/path/to/sysroot/z/sys/bin/bar.dll’
and point the system root at ‘/path/to/sysroot’, so that gdb can find thecorrect copies of both ‘c:\sys\bin\foo.dll’, and ‘z:\sys\bin\bar.dll’.
If that still does not find the shared library, gdb tries removing the whole drivespec from the target file name:
c:/foo/bar.dll ⇒ /path/to/sysroot/foo/bar.dll
This last lookup makes it possible to not care about the drive name, if youdon’t want or need to.
The set solib-absolute-prefix command is an alias for set sysroot.
You can set the default system root by using the configure-time‘--with-sysroot’ option. If the system root is inside gdb’s configured binaryprefix (set with ‘--prefix’ or ‘--exec-prefix’), then the default system rootwill be updated automatically if the installed gdb is moved to a new location.
1 If you want to specify a local system root using a directory that happens to be named ‘remote:’, youneed to use some equivalent variant of the name like ‘./remote:’.
208 Debugging with gdb
show sysroot
Display the current shared library prefix.
set solib-search-path path
If this variable is set, path is a colon-separated list of directories to search forshared libraries. ‘solib-search-path’ is used after ‘sysroot’ fails to locate thelibrary, or if the path to the library is relative instead of absolute. If you wantto use ‘solib-search-path’ instead of ‘sysroot’, be sure to set ‘sysroot’to a nonexistent directory to prevent gdb from finding your host’s libraries.‘sysroot’ is preferred; setting it to a nonexistent directory may interfere withautomatic loading of shared library symbols.
show solib-search-path
Display the current shared library search path.
set target-file-system-kind kind
Set assumed file system kind for target reported file names.
Shared library file names as reported by the target system may not make senseas is on the system gdb is running on. For example, when remote debugging atarget that has MS-DOS based file system semantics, from a Unix host, the tar-get may be reporting to gdb a list of loaded shared libraries with file names suchas ‘c:\Windows\kernel32.dll’. On Unix hosts, there’s no concept of drive let-ters, so the ‘c:\’ prefix is not normally understood as indicating an absolute filename, and neither is the backslash normally considered a directory separatorcharacter. In that case, the native file system would interpret this whole abso-lute file name as a relative file name with no directory components. This wouldmake it impossible to point gdb at a copy of the remote target’s shared librarieson the host using set sysroot, and impractical with set solib-search-path.Setting target-file-system-kind to dos-based tells gdb to interpret suchfile names similarly to how the target would, and to map them to file namesvalid on gdb’s native file system semantics. The value of kind can be "auto",in addition to one of the supported file system kinds. In that case, gdb triesto determine the appropriate file system variant based on the current target’soperating system (see Section 22.6 [Configuring the Current ABI], page 269).The supported file system settings are:
unix Instruct gdb to assume the target file system is of Unix kind. Onlyfile names starting the forward slash (‘/’) character are consideredabsolute, and the directory separator character is also the forwardslash.
dos-based
Instruct gdb to assume the target file system is DOS based. Filenames starting with either a forward slash, or a drive letter followedby a colon (e.g., ‘c:’), are considered absolute, and both the slash(‘/’) and the backslash (‘\\’) characters are considered directoryseparators.
auto Instruct gdb to use the file system kind associated with the targetoperating system (see Section 22.6 [Configuring the Current ABI],page 269). This is the default.
Chapter 18: gdb Files 209
When processing file names provided by the user, gdb frequently needs to comparethem to the file names recorded in the program’s debug info. Normally, gdb comparesjust the base names of the files as strings, which is reasonably fast even for very largeprograms. (The base name of a file is the last portion of its name, after stripping all theleading directories.) This shortcut in comparison is based upon the assumption that filescannot have more than one base name. This is usually true, but references to files that usesymlinks or similar filesystem facilities violate that assumption. If your program recordsfiles using such facilities, or if you provide file names to gdb using symlinks etc., you canset basenames-may-differ to true to instruct gdb to completely canonicalize each pairof file names it needs to compare. This will make file-name comparisons accurate, but at aprice of a significant slowdown.
set basenames-may-differ
Set whether a source file may have multiple base names.
show basenames-may-differ
Show whether a source file may have multiple base names.
18.2 Debugging Information in Separate Files
gdb allows you to put a program’s debugging information in a file separate from the exe-cutable itself, in a way that allows gdb to find and load the debugging information automat-ically. Since debugging information can be very large—sometimes larger than the executablecode itself—some systems distribute debugging information for their executables in separatefiles, which users can install only when they need to debug a problem.
gdb supports two ways of specifying the separate debug info file:
• The executable contains a debug link that specifies the name of the separate debuginfo file. The separate debug file’s name is usually ‘executable.debug’, where exe-cutable is the name of the corresponding executable file without leading directories(e.g., ‘ls.debug’ for ‘/usr/bin/ls’). In addition, the debug link specifies a 32-bitCyclic Redundancy Check (CRC) checksum for the debug file, which gdb uses to val-idate that the executable and the debug file came from the same build.
• The executable contains a build ID, a unique bit string that is also present in thecorresponding debug info file. (This is supported only on some operating systems,notably those which use the ELF format for binary files and the gnu Binutils.) Formore details about this feature, see the description of the ‘--build-id’ command-lineoption in Section “Command Line Options” in The GNU Linker. The debug info file’sname is not specified explicitly by the build ID, but can be computed from the buildID, see below.
Depending on the way the debug info file is specified, gdb uses two different methods oflooking for the debug file:
• For the “debug link” method, gdb looks up the named file in the directory of theexecutable file, then in a subdirectory of that directory named ‘.debug’, and finallyunder the global debug directory, in a subdirectory whose name is identical to theleading directories of the executable’s absolute file name.
• For the “build ID” method, gdb looks in the ‘.build-id’ subdirectory of the globaldebug directory for a file named ‘nn/nnnnnnnn.debug’, where nn are the first 2 hex
210 Debugging with gdb
characters of the build ID bit string, and nnnnnnnn are the rest of the bit string. (Realbuild ID strings are 32 or more hex characters, not 10.)
So, for example, suppose you ask gdb to debug ‘/usr/bin/ls’, which has a debug linkthat specifies the file ‘ls.debug’, and a build ID whose value in hex is abcdef1234. Ifthe global debug directory is ‘/usr/lib/debug’, then gdb will look for the following debuginformation files, in the indicated order:
− ‘/usr/lib/debug/.build-id/ab/cdef1234.debug’
− ‘/usr/bin/ls.debug’
− ‘/usr/bin/.debug/ls.debug’
− ‘/usr/lib/debug/usr/bin/ls.debug’.
You can set the global debugging info directory’s name, and view the name gdb iscurrently using.
set debug-file-directory directories
Set the directories which gdb searches for separate debugging information filesto directory. Multiple directory components can be set concatenating them bya directory separator.
show debug-file-directory
Show the directories gdb searches for separate debugging information files.
A debug link is a special section of the executable file named .gnu_debuglink. Thesection must contain:
• A filename, with any leading directory components removed, followed by a zero byte,
• zero to three bytes of padding, as needed to reach the next four-byte boundary withinthe section, and
• a four-byte CRC checksum, stored in the same endianness used for the executable fileitself. The checksum is computed on the debugging information file’s full contents bythe function given below, passing zero as the crc argument.
Any executable file format can carry a debug link, as long as it can contain a sectionnamed .gnu_debuglink with the contents described above.
The build ID is a special section in the executable file (and in other ELF binary files thatgdb may consider). This section is often named .note.gnu.build-id, but that name isnot mandatory. It contains unique identification for the built files—the ID remains the sameacross multiple builds of the same build tree. The default algorithm SHA1 produces 160bits (40 hexadecimal characters) of the content for the build ID string. The same sectionwith an identical value is present in the original built binary with symbols, in its strippedvariant, and in the separate debugging information file.
The debugging information file itself should be an ordinary executable, containing a fullset of linker symbols, sections, and debugging information. The sections of the debugginginformation file should have the same names, addresses, and sizes as the original file, butthey need not contain any data—much like a .bss section in an ordinary executable.
The gnu binary utilities (Binutils) package includes the ‘objcopy’ utility that can pro-duce the separated executable / debugging information file pairs using the following com-mands:
Chapter 18: gdb Files 211
objcopy --only-keep-debug foo foo.debug
strip -g foo
These commands remove the debugging information from the executable file ‘foo’ and placeit in the file ‘foo.debug’. You can use the first, second or both methods to link the twofiles:
• The debug link method needs the following additional command to also leave behinda debug link in ‘foo’:
objcopy --add-gnu-debuglink=foo.debug foo
Ulrich Drepper’s ‘elfutils’ package, starting with version 0.53, contains a version ofthe strip command such that the command strip foo -f foo.debug has the samefunctionality as the two objcopy commands and the ln -s command above, together.
• Build ID gets embedded into the main executable using ld --build-id or the gcccounterpart gcc -Wl,--build-id. Build ID support plus compatibility fixes for debugfiles separation are present in gnu binary utilities (Binutils) package since version 2.18.
The CRC used in .gnu_debuglink is the CRC-32 defined in IEEE 802.3 using thepolynomial:
x32 + x26 + x23 + x22 + x16 + x12 + x11
+ x10 + x8 + x7 + x5 + x4 + x2 + x + 1
The function is computed byte at a time, taking the least significant bit of each bytefirst. The initial pattern 0xffffffff is used, to ensure leading zeros affect the CRC andthe final result is inverted to ensure trailing zeros also affect the CRC.
Note: This is the same CRC polynomial as used in handling the Remote Serial ProtocolqCRC packet (see Appendix E [gdb Remote Serial Protocol], page 467). However in thecase of the Remote Serial Protocol, the CRC is computed most significant bit first, and theresult is not inverted, so trailing zeros have no effect on the CRC value.
To complete the description, we show below the code of the function which produces theCRC used in .gnu_debuglink. Inverting the initially supplied crc argument means that aninitial call to this function passing in zero will start computing the CRC using 0xffffffff.
unsigned long
gnu_debuglink_crc32 (unsigned long crc,
unsigned char *buf, size_t len)
{
static const unsigned long crc32_table[256] =
{
0x00000000, 0x77073096, 0xee0e612c, 0x990951ba, 0x076dc419,
0x706af48f, 0xe963a535, 0x9e6495a3, 0x0edb8832, 0x79dcb8a4,
0xe0d5e91e, 0x97d2d988, 0x09b64c2b, 0x7eb17cbd, 0xe7b82d07,
0x90bf1d91, 0x1db71064, 0x6ab020f2, 0xf3b97148, 0x84be41de,
0x1adad47d, 0x6ddde4eb, 0xf4d4b551, 0x83d385c7, 0x136c9856,
0x646ba8c0, 0xfd62f97a, 0x8a65c9ec, 0x14015c4f, 0x63066cd9,
0xfa0f3d63, 0x8d080df5, 0x3b6e20c8, 0x4c69105e, 0xd56041e4,
0xa2677172, 0x3c03e4d1, 0x4b04d447, 0xd20d85fd, 0xa50ab56b,
0x35b5a8fa, 0x42b2986c, 0xdbbbc9d6, 0xacbcf940, 0x32d86ce3,
0x45df5c75, 0xdcd60dcf, 0xabd13d59, 0x26d930ac, 0x51de003a,
0xc8d75180, 0xbfd06116, 0x21b4f4b5, 0x56b3c423, 0xcfba9599,
0xb8bda50f, 0x2802b89e, 0x5f058808, 0xc60cd9b2, 0xb10be924,
0x2f6f7c87, 0x58684c11, 0xc1611dab, 0xb6662d3d, 0x76dc4190,
0x01db7106, 0x98d220bc, 0xefd5102a, 0x71b18589, 0x06b6b51f,
0x9fbfe4a5, 0xe8b8d433, 0x7807c9a2, 0x0f00f934, 0x9609a88e,
212 Debugging with gdb
0xe10e9818, 0x7f6a0dbb, 0x086d3d2d, 0x91646c97, 0xe6635c01,
0x6b6b51f4, 0x1c6c6162, 0x856530d8, 0xf262004e, 0x6c0695ed,
0x1b01a57b, 0x8208f4c1, 0xf50fc457, 0x65b0d9c6, 0x12b7e950,
0x8bbeb8ea, 0xfcb9887c, 0x62dd1ddf, 0x15da2d49, 0x8cd37cf3,
0xfbd44c65, 0x4db26158, 0x3ab551ce, 0xa3bc0074, 0xd4bb30e2,
0x4adfa541, 0x3dd895d7, 0xa4d1c46d, 0xd3d6f4fb, 0x4369e96a,
0x346ed9fc, 0xad678846, 0xda60b8d0, 0x44042d73, 0x33031de5,
0xaa0a4c5f, 0xdd0d7cc9, 0x5005713c, 0x270241aa, 0xbe0b1010,
0xc90c2086, 0x5768b525, 0x206f85b3, 0xb966d409, 0xce61e49f,
0x5edef90e, 0x29d9c998, 0xb0d09822, 0xc7d7a8b4, 0x59b33d17,
0x2eb40d81, 0xb7bd5c3b, 0xc0ba6cad, 0xedb88320, 0x9abfb3b6,
0x03b6e20c, 0x74b1d29a, 0xead54739, 0x9dd277af, 0x04db2615,
0x73dc1683, 0xe3630b12, 0x94643b84, 0x0d6d6a3e, 0x7a6a5aa8,
0xe40ecf0b, 0x9309ff9d, 0x0a00ae27, 0x7d079eb1, 0xf00f9344,
0x8708a3d2, 0x1e01f268, 0x6906c2fe, 0xf762575d, 0x806567cb,
0x196c3671, 0x6e6b06e7, 0xfed41b76, 0x89d32be0, 0x10da7a5a,
0x67dd4acc, 0xf9b9df6f, 0x8ebeeff9, 0x17b7be43, 0x60b08ed5,
0xd6d6a3e8, 0xa1d1937e, 0x38d8c2c4, 0x4fdff252, 0xd1bb67f1,
0xa6bc5767, 0x3fb506dd, 0x48b2364b, 0xd80d2bda, 0xaf0a1b4c,
0x36034af6, 0x41047a60, 0xdf60efc3, 0xa867df55, 0x316e8eef,
0x4669be79, 0xcb61b38c, 0xbc66831a, 0x256fd2a0, 0x5268e236,
0xcc0c7795, 0xbb0b4703, 0x220216b9, 0x5505262f, 0xc5ba3bbe,
0xb2bd0b28, 0x2bb45a92, 0x5cb36a04, 0xc2d7ffa7, 0xb5d0cf31,
0x2cd99e8b, 0x5bdeae1d, 0x9b64c2b0, 0xec63f226, 0x756aa39c,
0x026d930a, 0x9c0906a9, 0xeb0e363f, 0x72076785, 0x05005713,
0x95bf4a82, 0xe2b87a14, 0x7bb12bae, 0x0cb61b38, 0x92d28e9b,
0xe5d5be0d, 0x7cdcefb7, 0x0bdbdf21, 0x86d3d2d4, 0xf1d4e242,
0x68ddb3f8, 0x1fda836e, 0x81be16cd, 0xf6b9265b, 0x6fb077e1,
0x18b74777, 0x88085ae6, 0xff0f6a70, 0x66063bca, 0x11010b5c,
0x8f659eff, 0xf862ae69, 0x616bffd3, 0x166ccf45, 0xa00ae278,
0xd70dd2ee, 0x4e048354, 0x3903b3c2, 0xa7672661, 0xd06016f7,
0x4969474d, 0x3e6e77db, 0xaed16a4a, 0xd9d65adc, 0x40df0b66,
0x37d83bf0, 0xa9bcae53, 0xdebb9ec5, 0x47b2cf7f, 0x30b5ffe9,
0xbdbdf21c, 0xcabac28a, 0x53b39330, 0x24b4a3a6, 0xbad03605,
0xcdd70693, 0x54de5729, 0x23d967bf, 0xb3667a2e, 0xc4614ab8,
0x5d681b02, 0x2a6f2b94, 0xb40bbe37, 0xc30c8ea1, 0x5a05df1b,
0x2d02ef8d
};
unsigned char *end;
crc = ~crc & 0xffffffff;
for (end = buf + len; buf < end; ++buf)
crc = crc32_table[(crc ^ *buf) & 0xff] ^ (crc >> 8);
return ~crc & 0xffffffff;
}
This computation does not apply to the “build ID” method.
18.3 Index Files Speed Up gdb
When gdb finds a symbol file, it scans the symbols in the file in order to construct aninternal symbol table. This lets most gdb operations work quickly—at the cost of a delayearly on. For large programs, this delay can be quite lengthy, so gdb provides a way tobuild an index, which speeds up startup.
The index is stored as a section in the symbol file. gdb can write the index to a file,then you can put it into the symbol file using objcopy.
To create an index file, use the save gdb-index command:
Chapter 18: gdb Files 213
save gdb-index directory
Create an index file for each symbol file currently known by gdb. Each file isnamed after its corresponding symbol file, with ‘.gdb-index’ appended, and iswritten into the given directory.
Once you have created an index file you can merge it into your symbol file, here named‘symfile’, using objcopy:
$ objcopy --add-section .gdb_index=symfile.gdb-index \
--set-section-flags .gdb_index=readonly symfile symfile
There are currently some limitation on indices. They only work when for DWARFdebugging information, not stabs. And, they do not currently work for programs usingAda.
18.4 Errors Reading Symbol Files
While reading a symbol file, gdb occasionally encounters problems, such as symbol typesit does not recognize, or known bugs in compiler output. By default, gdb does not notifyyou of such problems, since they are relatively common and primarily of interest to peo-ple debugging compilers. If you are interested in seeing information about ill-constructedsymbol tables, you can either ask gdb to print only one message about each such type ofproblem, no matter how many times the problem occurs; or you can ask gdb to print moremessages, to see how many times the problems occur, with the set complaints command(see Section 22.7 [Optional Warnings and Messages], page 270).
The messages currently printed, and their meanings, include:
inner block not inside outer block in symbol
The symbol information shows where symbol scopes begin and end (such as atthe start of a function or a block of statements). This error indicates that aninner scope block is not fully contained in its outer scope blocks.
gdb circumvents the problem by treating the inner block as if it had the samescope as the outer block. In the error message, symbol may be shown as “(don’tknow)” if the outer block is not a function.
block at address out of order
The symbol information for symbol scope blocks should occur in order of in-creasing addresses. This error indicates that it does not do so.
gdb does not circumvent this problem, and has trouble locating symbols inthe source file whose symbols it is reading. (You can often determine whatsource file is affected by specifying set verbose on. See Section 22.7 [OptionalWarnings and Messages], page 270.)
bad block start address patched
The symbol information for a symbol scope block has a start address smallerthan the address of the preceding source line. This is known to occur in theSunOS 4.1.1 (and earlier) C compiler.
gdb circumvents the problem by treating the symbol scope block as startingon the previous source line.
214 Debugging with gdb
bad string table offset in symbol n
Symbol number n contains a pointer into the string table which is larger thanthe size of the string table.
gdb circumvents the problem by considering the symbol to have the name foo,which may cause other problems if many symbols end up with this name.
unknown symbol type 0xnn
The symbol information contains new data types that gdb does not yet knowhow to read. 0xnn is the symbol type of the uncomprehended information, inhexadecimal.
gdb circumvents the error by ignoring this symbol information. This usuallyallows you to debug your program, though certain symbols are not accessible. Ifyou encounter such a problem and feel like debugging it, you can debug gdb withitself, breakpoint on complain, then go up to the function read_dbx_symtab
and examine *bufp to see the symbol.
stub type has NULL name
gdb could not find the full definition for a struct or class.
const/volatile indicator missing (ok if using g++ v1.x), got...
The symbol information for a C++member function is missing some informationthat recent versions of the compiler should have output for it.
info mismatch between compiler and debugger
gdb could not parse a type specification output by the compiler.
18.5 GDB Data Files
gdb will sometimes read an auxiliary data file. These files are kept in a directory known asthe data directory.
You can set the data directory’s name, and view the name gdb is currently using.
set data-directory directory
Set the directory which gdb searches for auxiliary data files to directory.
show data-directory
Show the directory gdb searches for auxiliary data files.
You can set the default data directory by using the configure-time ‘--with-gdb-datadir’option. If the data directory is inside gdb’s configured binary prefix (set with ‘--prefix’or ‘--exec-prefix’), then the default data directory will be updated automatically if theinstalled gdb is moved to a new location.
The data directory may also be specified with the --data-directory command lineoption. See Section 2.1.2 [Mode Options], page 13.
Chapter 19: Specifying a Debugging Target 215
19 Specifying a Debugging Target
A target is the execution environment occupied by your program.
Often, gdb runs in the same host environment as your program; in that case, the de-bugging target is specified as a side effect when you use the file or core commands.When you need more flexibility—for example, running gdb on a physically separate host,or controlling a standalone system over a serial port or a realtime system over a TCP/IPconnection—you can use the target command to specify one of the target types configuredfor gdb (see Section 19.2 [Commands for Managing Targets], page 215).
It is possible to build gdb for several different target architectures. When gdb is builtlike that, you can choose one of the available architectures with the set architecture
command.
set architecture arch
This command sets the current target architecture to arch. The value of archcan be "auto", in addition to one of the supported architectures.
show architecture
Show the current target architecture.
set processor
processor
These are alias commands for, respectively, set architecture and show
architecture.
19.1 Active Targets
There are multiple classes of targets such as: processes, executable files or recording sessions.Core files belong to the process class, making core file and process mutually exclusive.Otherwise, gdb can work concurrently on multiple active targets, one in each class. Thisallows you to (for example) start a process and inspect its activity, while still having access tothe executable file after the process finishes. Or if you start process recording (see Chapter 6[Reverse Execution], page 75) and reverse-step there, you are presented a virtual layer ofthe recording target, while the process target remains stopped at the chronologically lastpoint of the process execution.
Use the core-file and exec-file commands to select a new core file or executabletarget (see Section 18.1 [Commands to Specify Files], page 201). To specify as a target aprocess that is already running, use the attach command (see Section 4.7 [Debugging anAlready-running Process], page 31).
19.2 Commands for Managing Targets
target type parameters
Connects the gdb host environment to a target machine or process. A targetis typically a protocol for talking to debugging facilities. You use the argumenttype to specify the type or protocol of the target machine.
Further parameters are interpreted by the target protocol, but typically includethings like device names or host names to connect with, process numbers, andbaud rates.
216 Debugging with gdb
The target command does not repeat if you press RET again after executingthe command.
help target
Displays the names of all targets available. To display targets currently selected,use either info target or info files (see Section 18.1 [Commands to SpecifyFiles], page 201).
help target name
Describe a particular target, including any parameters necessary to select it.
set gnutarget args
gdb uses its own library BFD to read your files. gdb knows whether it isreading an executable, a core, or a .o file; however, you can specify the fileformat with the set gnutarget command. Unlike most target commands,with gnutarget the target refers to a program, not a machine.
Warning: To specify a file format with set gnutarget, you mustknow the actual BFD name.
See Section 18.1 [Commands to Specify Files], page 201.
show gnutarget
Use the show gnutarget command to display what file format gnutarget is setto read. If you have not set gnutarget, gdb will determine the file format foreach file automatically, and show gnutarget displays ‘The current BDF target
is "auto"’.
Here are some common targets (available, or not, depending on the GDB configuration):
target exec program
An executable file. ‘target exec program ’ is the same as ‘exec-file pro-
gram ’.
target core filename
A core dump file. ‘target core filename ’ is the same as ‘core-file file-
name ’.
target remote medium
A remote system connected to gdb via a serial line or network connection. Thiscommand tells gdb to use its own remote protocol over medium for debugging.See Chapter 20 [Remote Debugging], page 219.
For example, if you have a board connected to ‘/dev/ttya’ on the machinerunning gdb, you could say:
target remote /dev/ttya
target remote supports the load command. This is only useful if you havesome other way of getting the stub to the target system, and you can put itsomewhere in memory where it won’t get clobbered by the download.
target sim [simargs ] ...Builtin CPU simulator. gdb includes simulators for most architectures. Ingeneral,
Chapter 19: Specifying a Debugging Target 217
target sim
load
run
works; however, you cannot assume that a specific memory map, device drivers,or even basic I/O is available, although some simulators do provide these. Forinfo about any processor-specific simulator details, see the appropriate sectionin Section 21.3 [Embedded Processors], page 247.
Some configurations may include these targets as well:
target nrom dev
NetROM ROM emulator. This target only supports downloading.
Different targets are available on different configurations of gdb; your configuration mayhave more or fewer targets.
Many remote targets require you to download the executable’s code once you’ve success-fully established a connection. You may wish to control various aspects of this process.
set hash This command controls whether a hash mark ‘#’ is displayed while downloadinga file to the remote monitor. If on, a hash mark is displayed after each S-recordis successfully downloaded to the monitor.
show hash Show the current status of displaying the hash mark.
set debug monitor
Enable or disable display of communications messages between gdb and theremote monitor.
show debug monitor
Show the current status of displaying communications between gdb and theremote monitor.
load filename
Depending on what remote debugging facilities are configured into gdb, theload command may be available. Where it exists, it is meant to make filename(an executable) available for debugging on the remote system—by downloading,or dynamic linking, for example. load also records the filename symbol tablein gdb, like the add-symbol-file command.
If your gdb does not have a load command, attempting to execute it gets theerror message “You can’t do that when your target is ...”
The file is loaded at whatever address is specified in the executable. For someobject file formats, you can specify the load address when you link the program;for other formats, like a.out, the object file format specifies a fixed address.
Depending on the remote side capabilities, gdb may be able to load programsinto flash memory.
load does not repeat if you press RET again after using it.
218 Debugging with gdb
19.3 Choosing Target Byte Order
Some types of processors, such as the MIPS, PowerPC, and Renesas SH, offer the abilityto run either big-endian or little-endian byte orders. Usually the executable or symbol willinclude a bit to designate the endian-ness, and you will not need to worry about which touse. However, you may still find it useful to adjust gdb’s idea of processor endian-nessmanually.
set endian big
Instruct gdb to assume the target is big-endian.
set endian little
Instruct gdb to assume the target is little-endian.
set endian auto
Instruct gdb to use the byte order associated with the executable.
show endian
Display gdb’s current idea of the target byte order.
Note that these commands merely adjust interpretation of symbolic data on the host,and that they have absolutely no effect on the target system.
Chapter 20: Debugging Remote Programs 219
20 Debugging Remote Programs
If you are trying to debug a program running on a machine that cannot run gdb in theusual way, it is often useful to use remote debugging. For example, you might use remotedebugging on an operating system kernel, or on a small system which does not have ageneral purpose operating system powerful enough to run a full-featured debugger.
Some configurations of gdb have special serial or TCP/IP interfaces to make this workwith particular debugging targets. In addition, gdb comes with a generic serial protocol(specific to gdb, but not specific to any particular target system) which you can use if youwrite the remote stubs—the code that runs on the remote system to communicate withgdb.
Other remote targets may be available in your configuration of gdb; use help target
to list them.
20.1 Connecting to a Remote Target
On the gdb host machine, you will need an unstripped copy of your program, since gdbneeds symbol and debugging information. Start up gdb as usual, using the name of thelocal copy of your program as the first argument.
gdb can communicate with the target over a serial line, or over an IP network using TCP
or UDP. In each case, gdb uses the same protocol for debugging your program; only themedium carrying the debugging packets varies. The target remote command establishesa connection to the target. Its arguments indicate which medium to use:
target remote serial-device
Use serial-device to communicate with the target. For example, to use a serialline connected to the device named ‘/dev/ttyb’:
target remote /dev/ttyb
If you’re using a serial line, you may want to give gdb the ‘--baud’ option, oruse the set remotebaud command (see Section 20.4 [Remote Configuration],page 226) before the target command.
target remote host:port
target remote tcp:host:port
Debug using a TCP connection to port on host. The host may be either a hostname or a numeric IP address; port must be a decimal number. The host couldbe the target machine itself, if it is directly connected to the net, or it mightbe a terminal server which in turn has a serial line to the target.
For example, to connect to port 2828 on a terminal server named manyfarms:
target remote manyfarms:2828
If your remote target is actually running on the same machine as your debuggersession (e.g. a simulator for your target running on the same host), you can omitthe hostname. For example, to connect to port 1234 on your local machine:
target remote :1234
Note that the colon is still required here.
220 Debugging with gdb
target remote udp:host:port
Debug using UDP packets to port on host. For example, to connect to UDP
port 2828 on a terminal server named manyfarms:
target remote udp:manyfarms:2828
When using a UDP connection for remote debugging, you should keep in mindthat the ‘U’ stands for “Unreliable”. UDP can silently drop packets on busy orunreliable networks, which will cause havoc with your debugging session.
target remote | command
Run command in the background and communicate with it using a pipe. Thecommand is a shell command, to be parsed and expanded by the system’s com-mand shell, /bin/sh; it should expect remote protocol packets on its standardinput, and send replies on its standard output. You could use this to run astand-alone simulator that speaks the remote debugging protocol, to make netconnections using programs like ssh, or for other similar tricks.
If command closes its standard output (perhaps by exiting), gdb will try tosend it a SIGTERM signal. (If the program has already exited, this will have noeffect.)
Once the connection has been established, you can use all the usual commands to examineand change data. The remote program is already running; you can use step and continue,and you do not need to use run.
Whenever gdb is waiting for the remote program, if you type the interrupt character(often Ctrl-c), gdb attempts to stop the program. This may or may not succeed, dependingin part on the hardware and the serial drivers the remote system uses. If you type theinterrupt character once again, gdb displays this prompt:
Interrupted while waiting for the program.
Give up (and stop debugging it)? (y or n)
If you type y, gdb abandons the remote debugging session. (If you decide you want totry again later, you can use ‘target remote’ again to connect once more.) If you type n,gdb goes back to waiting.
detach When you have finished debugging the remote program, you can use the detachcommand to release it from gdb control. Detaching from the target normallyresumes its execution, but the results will depend on your particular remotestub. After the detach command, gdb is free to connect to another target.
disconnect
The disconnect command behaves like detach, except that the target is gener-ally not resumed. It will wait for gdb (this instance or another one) to connectand continue debugging. After the disconnect command, gdb is again free toconnect to another target.
monitor cmd
This command allows you to send arbitrary commands directly to the remotemonitor. Since gdb doesn’t care about the commands it sends like this, thiscommand is the way to extend gdb—you can add new commands that onlythe external monitor will understand and implement.
Chapter 20: Debugging Remote Programs 221
20.2 Sending files to a remote system
Some remote targets offer the ability to transfer files over the same connection used tocommunicate with gdb. This is convenient for targets accessible through other means, e.g.gnu/Linux systems running gdbserver over a network interface. For other targets, e.g.embedded devices with only a single serial port, this may be the only way to upload ordownload files.
Not all remote targets support these commands.
remote put hostfile targetfile
Copy file hostfile from the host system (the machine running gdb) to targetfileon the target system.
remote get targetfile hostfile
Copy file targetfile from the target system to hostfile on the host system.
remote delete targetfile
Delete targetfile from the target system.
20.3 Using the gdbserver Program
gdbserver is a control program for Unix-like systems, which allows you to connect yourprogram with a remote gdb via target remote—but without linking in the usual debuggingstub.
gdbserver is not a complete replacement for the debugging stubs, because it requiresessentially the same operating-system facilities that gdb itself does. In fact, a system thatcan run gdbserver to connect to a remote gdb could also run gdb locally! gdbserver issometimes useful nevertheless, because it is a much smaller program than gdb itself. It isalso easier to port than all of gdb, so you may be able to get started more quickly on anew system by using gdbserver. Finally, if you develop code for real-time systems, youmay find that the tradeoffs involved in real-time operation make it more convenient to doas much development work as possible on another system, for example by cross-compiling.You can use gdbserver to make a similar choice for debugging.
gdb and gdbserver communicate via either a serial line or a TCP connection, using thestandard gdb remote serial protocol.
Warning: gdbserver does not have any built-in security. Do not rungdbserver connected to any public network; a gdb connection to gdbserver
provides access to the target system with the same privileges as the userrunning gdbserver.
20.3.1 Running gdbserver
Run gdbserver on the target system. You need a copy of the program you want to debug,including any libraries it requires. gdbserver does not need your program’s symbol table,so you can strip the program if necessary to save space. gdb on the host system does allthe symbol handling.
To use the server, you must tell it how to communicate with gdb; the name of yourprogram; and the arguments for your program. The usual syntax is:
222 Debugging with gdb
target> gdbserver comm program [ args ... ]
comm is either a device name (to use a serial line) or a TCP hostname and portnumber.For example, to debug Emacs with the argument ‘foo.txt’ and communicate with gdbover the serial port ‘/dev/com1’:
target> gdbserver /dev/com1 emacs foo.txt
gdbserver waits passively for the host gdb to communicate with it.
To use a TCP connection instead of a serial line:target> gdbserver host:2345 emacs foo.txt
The only difference from the previous example is the first argument, specifying that youare communicating with the host gdb via TCP. The ‘host:2345’ argument means thatgdbserver is to expect a TCP connection from machine ‘host’ to local TCP port 2345.(Currently, the ‘host’ part is ignored.) You can choose any number you want for the portnumber as long as it does not conflict with any TCP ports already in use on the targetsystem (for example, 23 is reserved for telnet).1 You must use the same port number withthe host gdb target remote command.
20.3.1.1 Attaching to a Running Program
On some targets, gdbserver can also attach to running programs. This is accomplishedvia the --attach argument. The syntax is:
target> gdbserver --attach comm pid
pid is the process ID of a currently running process. It isn’t necessary to point gdbserverat a binary for the running process.
You can debug processes by name instead of process ID if your target has the pidof
utility:target> gdbserver --attach comm ‘pidof program‘
In case more than one copy of program is running, or program has multiple threads,most versions of pidof support the -s option to only return the first process ID.
20.3.1.2 Multi-Process Mode for gdbserver
When you connect to gdbserver using target remote, gdbserver debugs the specified pro-gram only once. When the program exits, or you detach from it, gdb closes the connectionand gdbserver exits.
If you connect using target extended-remote, gdbserver enters multi-process mode.When the debugged program exits, or you detach from it, gdb stays connected to gdbservereven though no program is running. The run and attach commands instruct gdbserverto run or attach to a new program. The run command uses set remote exec-file (see[set remote exec-file], page 227) to select the program to run. Command line arguments aresupported, except for wildcard expansion and I/O redirection (see Section 4.3 [Arguments],page 28).
To start gdbserver without supplying an initial command to run or process ID to attach,use the ‘--multi’ command line option. Then you can connect using target extended-
remote and start the program you want to debug.
1 If you choose a port number that conflicts with another service, gdbserver prints an error message andexits.
Chapter 20: Debugging Remote Programs 223
In multi-process mode gdbserver does not automatically exit unless you use the option‘--once’. You can terminate it by using monitor exit (see [Monitor Commands for gdb-server], page 224). Note that the conditions under which gdbserver terminates dependon how gdb connects to it (target remote or target extended-remote). The ‘--multi’option to gdbserver has no influence on that.
20.3.1.3 TCP port allocation lifecycle of gdbserver
This section applies only when gdbserver is run to listen on a TCP port.
gdbserver normally terminates after all of its debugged processes have terminated intarget remote mode. On the other hand, for target extended-remote, gdbserver staysrunning even with no processes left. gdb normally terminates the spawned debugged pro-cess on its exit, which normally also terminates gdbserver in the target remote mode.Therefore, when the connection drops unexpectedly, and gdb cannot ask gdbserver to killits debugged processes, gdbserver stays running even in the target remote mode.
When gdbserver stays running, gdb can connect to it again later. Such reconnectingis useful for features like [disconnected tracing], page 148. For completeness, at most onegdb can be connected at a time.
By default, gdbserver keeps the listening TCP port open, so that additional connectionsare possible. However, if you start gdbserver with the ‘--once’ option, it will stop listeningfor any further connection attempts after connecting to the first gdb session. This meansno further connections to gdbserver will be possible after the first one. It also meansgdbserver will terminate after the first connection with remote gdb has closed, even forunexpectedly closed connections and even in the target extended-remote mode. The‘--once’ option allows reusing the same port number for connecting to multiple instancesof gdbserver running on the same host, since each instance closes its port after the firstconnection.
20.3.1.4 Other Command-Line Arguments for gdbserver
The ‘--debug’ option tells gdbserver to display extra status information about the de-bugging process. The ‘--remote-debug’ option tells gdbserver to display remote protocoldebug output. These options are intended for gdbserver development and for bug reportsto the developers.
The ‘--wrapper’ option specifies a wrapper to launch programs for debugging. Theoption should be followed by the name of the wrapper, then any command-line argumentsto pass to the wrapper, then -- indicating the end of the wrapper arguments.
gdbserver runs the specified wrapper program with a combined command line includingthe wrapper arguments, then the name of the program to debug, then any arguments to theprogram. The wrapper runs until it executes your program, and then gdb gains control.
You can use any program that eventually calls execve with its arguments as a wrapper.Several standard Unix utilities do this, e.g. env and nohup. Any Unix shell script endingwith exec "$@" will also work.
For example, you can use env to pass an environment variable to the debugged program,without setting the variable in gdbserver’s environment:
$ gdbserver --wrapper env LD_PRELOAD=libtest.so -- :2222 ./testprog
224 Debugging with gdb
20.3.2 Connecting to gdbserver
Run gdb on the host system.
First make sure you have the necessary symbol files. Load symbols for your applicationusing the file command before you connect. Use set sysroot to locate target libraries(unless your gdb was compiled with the correct sysroot using --with-sysroot).
The symbol file and target libraries must exactly match the executable and libraries onthe target, with one exception: the files on the host system should not be stripped, even ifthe files on the target system are. Mismatched or missing files will lead to confusing resultsduring debugging. On gnu/Linux targets, mismatched or missing files may also preventgdbserver from debugging multi-threaded programs.
Connect to your target (see Section 20.1 [Connecting to a Remote Target], page 219).For TCP connections, you must start up gdbserver prior to using the target remote
command. Otherwise you may get an error whose text depends on the host system, butwhich usually looks something like ‘Connection refused’. Don’t use the load commandin gdb when using gdbserver, since the program is already on the target.
20.3.3 Monitor Commands for gdbserver
During a gdb session using gdbserver, you can use the monitor command to send specialrequests to gdbserver. Here are the available commands.
monitor help
List the available monitor commands.
monitor set debug 0
monitor set debug 1
Disable or enable general debugging messages.
monitor set remote-debug 0
monitor set remote-debug 1
Disable or enable specific debugging messages associated with the remote pro-tocol (see Appendix E [Remote Protocol], page 467).
monitor set libthread-db-search-path [PATH]
When this command is issued, path is a colon-separated list of directoriesto search for libthread_db (see Section 4.10 [set libthread-db-search-path],page 35). If you omit path, ‘libthread-db-search-path’ will be reset to itsdefault value.
The special entry ‘$pdir’ for ‘libthread-db-search-path’ is not supported ingdbserver.
monitor exit
Tell gdbserver to exit immediately. This command should be followed bydisconnect to close the debugging session. gdbserver will detach from anyattached processes and kill any processes it created. Use monitor exit to ter-minate gdbserver at the end of a multi-process mode debug session.
20.3.4 Tracepoints support in gdbserver
On some targets, gdbserver supports tracepoints, fast tracepoints and static tracepoints.
Chapter 20: Debugging Remote Programs 225
For fast or static tracepoints to work, a special library called the in-process agent (IPA),must be loaded in the inferior process. This library is built and distributed as an inte-gral part of gdbserver. In addition, support for static tracepoints requires building thein-process agent library with static tracepoints support. At present, the UST (LTTngUserspace Tracer, http://lttng.org/ust) tracing engine is supported. This support isautomatically available if UST development headers are found in the standard include pathwhen gdbserver is built, or if gdbserver was explicitly configured using ‘--with-ust’ topoint at such headers. You can explicitly disable the support using ‘--with-ust=no’.
There are several ways to load the in-process agent in your program:
Specifying it as dependency at link time
You can link your program dynamically with the in-process agent library. Onmost systems, this is accomplished by adding -linproctrace to the link com-mand.
Using the system’s preloading mechanisms
You can force loading the in-process agent at startup time by using your sys-tem’s support for preloading shared libraries. Many Unixes support the conceptof preloading user defined libraries. In most cases, you do that by specifyingLD_PRELOAD=libinproctrace.so in the environment. See also the descriptionof gdbserver’s ‘--wrapper’ command line option.
Using gdb to force loading the agent at run time
On some systems, you can force the inferior to load a shared library, by callinga dynamic loader function in the inferior that takes care of dynamically lookingup and loading a shared library. On most Unix systems, the function is dlopen.You’ll use the call command for that. For example:
(gdb) call dlopen ("libinproctrace.so", ...)
Note that on most Unix systems, for the dlopen function to be available, theprogram needs to be linked with -ldl.
On systems that have a userspace dynamic loader, like most Unix systems, when youconnect to gdbserver using target remote, you’ll find that the program is stopped atthe dynamic loader’s entry point, and no shared library has been loaded in the program’saddress space yet, including the in-process agent. In that case, before being able to use anyof the fast or static tracepoints features, you need to let the loader run and load the sharedlibraries. The simplest way to do that is to run the program to the main procedure. E.g.,if debugging a C or C++ program, start gdbserver like so:
$ gdbserver :9999 myprogram
Start GDB and connect to gdbserver like so, and run to main:$ gdb myprogram
(gdb) target remote myhost:9999
0x00007f215893ba60 in ?? () from /lib64/ld-linux-x86-64.so.2
(gdb) b main
(gdb) continue
The in-process tracing agent library should now be loaded into the process; you canconfirm it with the info sharedlibrary command, which will list ‘libinproctrace.so’as loaded in the process. You are now ready to install fast tracepoints, list static tracepointmarkers, probe static tracepoints markers, and start tracing.
226 Debugging with gdb
20.4 Remote Configuration
This section documents the configuration options available when debugging remote pro-grams. For the options related to the File I/O extensions of the remote protocol, see[system], page 516.
set remoteaddresssize bits
Set the maximum size of address in a memory packet to the specified numberof bits. gdb will mask off the address bits above that number, when it passesaddresses to the remote target. The default value is the number of bits in thetarget’s address.
show remoteaddresssize
Show the current value of remote address size in bits.
set remotebaud n
Set the baud rate for the remote serial I/O to n baud. The value is used to setthe speed of the serial port used for debugging remote targets.
show remotebaud
Show the current speed of the remote connection.
set remotebreak
If set to on, gdb sends a BREAK signal to the remote when you type Ctrl-c
to interrupt the program running on the remote. If set to off, gdb sends the‘Ctrl-C’ character instead. The default is off, since most remote systems expectto see ‘Ctrl-C’ as the interrupt signal.
show remotebreak
Show whether gdb sends BREAK or ‘Ctrl-C’ to interrupt the remote program.
set remoteflow on
set remoteflow off
Enable or disable hardware flow control (RTS/CTS) on the serial port used tocommunicate to the remote target.
show remoteflow
Show the current setting of hardware flow control.
set remotelogbase base
Set the base (a.k.a. radix) of logging serial protocol communications to base.Supported values of base are: ascii, octal, and hex. The default is ascii.
show remotelogbase
Show the current setting of the radix for logging remote serial protocol.
set remotelogfile file
Record remote serial communications on the named file. The default is not torecord at all.
show remotelogfile.
Show the current setting of the file name on which to record the serial commu-nications.
Chapter 20: Debugging Remote Programs 227
set remotetimeout num
Set the timeout limit to wait for the remote target to respond to num seconds.The default is 2 seconds.
show remotetimeout
Show the current number of seconds to wait for the remote target responses.
set remote hardware-watchpoint-limit limit
set remote hardware-breakpoint-limit limit
Restrict gdb to using limit remote hardware breakpoint or watchpoints. Alimit of -1, the default, is treated as unlimited.
set remote hardware-watchpoint-length-limit limit
Restrict gdb to using limit bytes for the maximum length of a remote hardwarewatchpoint. A limit of -1, the default, is treated as unlimited.
show remote hardware-watchpoint-length-limit
Show the current limit (in bytes) of the maximum length of a remote hardwarewatchpoint.
set remote exec-file filename
show remote exec-file
Select the file used for run with target extended-remote. This should be setto a filename valid on the target system. If it is not set, the target will use adefault filename (e.g. the last program run).
set remote interrupt-sequence
Allow the user to select one of ‘Ctrl-C’, a BREAK or ‘BREAK-g’ as the sequenceto the remote target in order to interrupt the execution. ‘Ctrl-C’ is a default.Some system prefers BREAK which is high level of serial line for some certaintime. Linux kernel prefers ‘BREAK-g’, a.k.a Magic SysRq g. It is BREAK signalfollowed by character g.
show interrupt-sequence
Show which of ‘Ctrl-C’, BREAK or BREAK-g is sent by gdb to interrupt theremote program. BREAK-g is BREAK signal followed by g and also known asMagic SysRq g.
set remote interrupt-on-connect
Specify whether interrupt-sequence is sent to remote target when gdb connectsto it. This is mostly needed when you debug Linux kernel. Linux kernel expectsBREAK followed by g which is known as Magic SysRq g in order to connect gdb.
show interrupt-on-connect
Show whether interrupt-sequence is sent to remote target when gdb connectsto it.
set tcp auto-retry on
Enable auto-retry for remote TCP connections. This is useful if the remotedebugging agent is launched in parallel with gdb; there is a race conditionbecause the agent may not become ready to accept the connection before gdbattempts to connect. When auto-retry is enabled, if the initial attempt to
228 Debugging with gdb
connect fails, gdb reattempts to establish the connection using the timeoutspecified by set tcp connect-timeout.
set tcp auto-retry off
Do not auto-retry failed TCP connections.
show tcp auto-retry
Show the current auto-retry setting.
set tcp connect-timeout seconds
Set the timeout for establishing a TCP connection to the remote target toseconds. The timeout affects both polling to retry failed connections (enabledby set tcp auto-retry on) and waiting for connections that are merely slowto complete, and represents an approximate cumulative value.
show tcp connect-timeout
Show the current connection timeout setting.
The gdb remote protocol autodetects the packets supported by your debugging stub. Ifyou need to override the autodetection, you can use these commands to enable or disableindividual packets. Each packet can be set to ‘on’ (the remote target supports this packet),‘off’ (the remote target does not support this packet), or ‘auto’ (detect remote targetsupport for this packet). They all default to ‘auto’. For more information about eachpacket, see Appendix E [Remote Protocol], page 467.
During normal use, you should not have to use any of these commands. If you do, thatmay be a bug in your remote debugging stub, or a bug in gdb. You may want to reportthe problem to the gdb developers.
For each packet name, the command to enable or disable the packet is set remote
name-packet. The available settings are:
Command Name Remote Packet Related Features
fetch-register p info registers
set-register P set
binary-download X load, set
read-aux-vector qXfer:auxv:read info auxv
symbol-lookup qSymbol Detecting multiplethreads
attach vAttach attach
verbose-resume vCont Stepping or resum-ing multiple threads
run vRun run
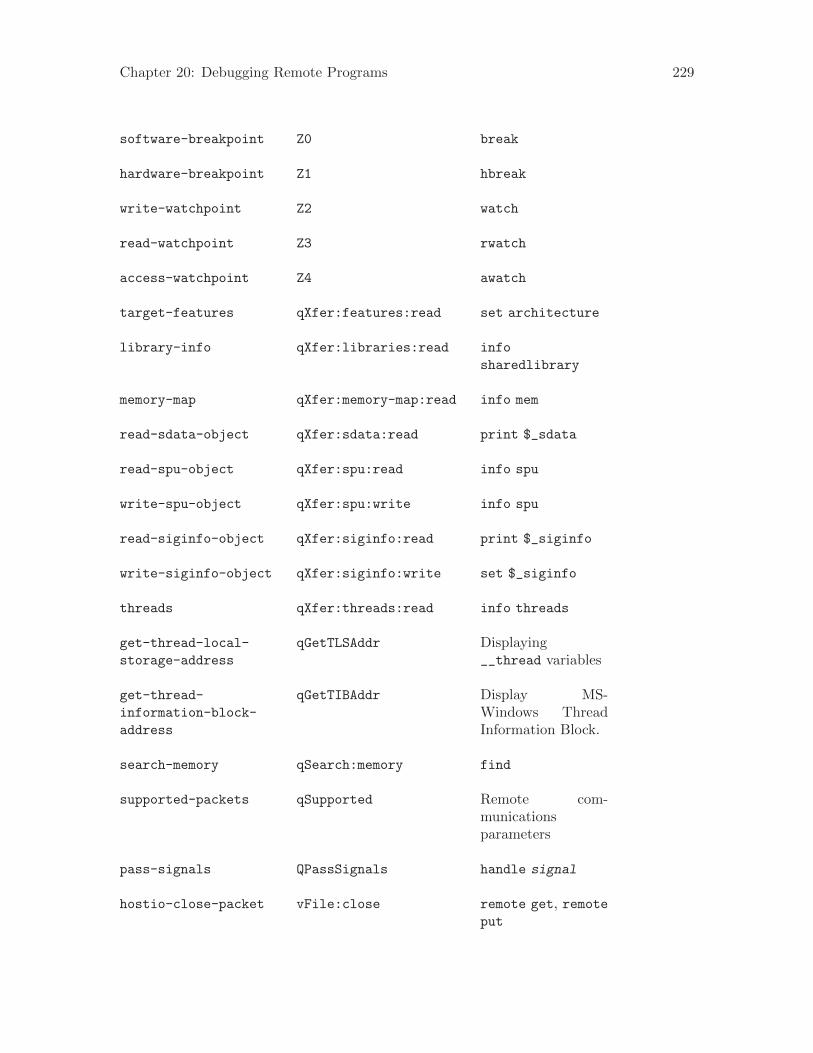
Chapter 20: Debugging Remote Programs 229
software-breakpoint Z0 break
hardware-breakpoint Z1 hbreak
write-watchpoint Z2 watch
read-watchpoint Z3 rwatch
access-watchpoint Z4 awatch
target-features qXfer:features:read set architecture
library-info qXfer:libraries:read info
sharedlibrary
memory-map qXfer:memory-map:read info mem
read-sdata-object qXfer:sdata:read print $_sdata
read-spu-object qXfer:spu:read info spu
write-spu-object qXfer:spu:write info spu
read-siginfo-object qXfer:siginfo:read print $_siginfo
write-siginfo-object qXfer:siginfo:write set $_siginfo
threads qXfer:threads:read info threads
get-thread-local-
storage-address
qGetTLSAddr Displaying__thread variables
get-thread-
information-block-
address
qGetTIBAddr Display MS-Windows ThreadInformation Block.
search-memory qSearch:memory find
supported-packets qSupported Remote com-municationsparameters
pass-signals QPassSignals handle signal
hostio-close-packet vFile:close remote get, remoteput
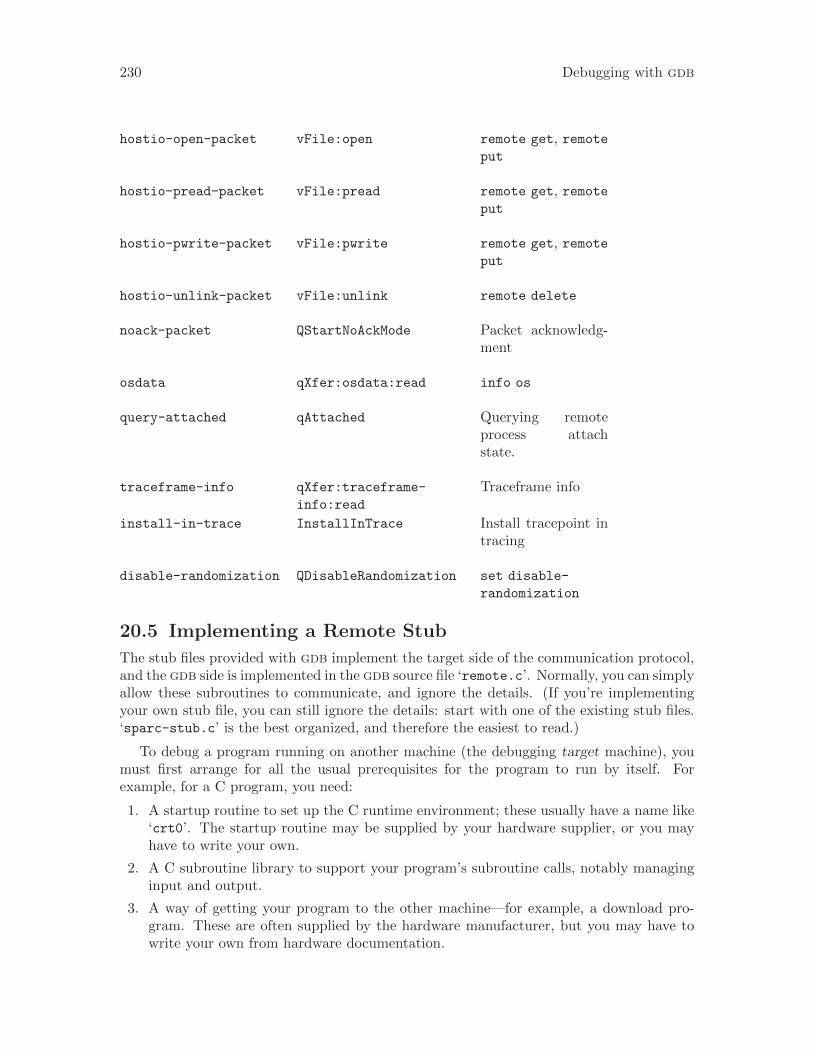
230 Debugging with gdb
hostio-open-packet vFile:open remote get, remoteput
hostio-pread-packet vFile:pread remote get, remoteput
hostio-pwrite-packet vFile:pwrite remote get, remoteput
hostio-unlink-packet vFile:unlink remote delete
noack-packet QStartNoAckMode Packet acknowledg-ment
osdata qXfer:osdata:read info os
query-attached qAttached Querying remoteprocess attachstate.
traceframe-info qXfer:traceframe-
info:read
Traceframe info
install-in-trace InstallInTrace Install tracepoint intracing
disable-randomization QDisableRandomization set disable-
randomization
20.5 Implementing a Remote Stub
The stub files provided with gdb implement the target side of the communication protocol,and the gdb side is implemented in the gdb source file ‘remote.c’. Normally, you can simplyallow these subroutines to communicate, and ignore the details. (If you’re implementingyour own stub file, you can still ignore the details: start with one of the existing stub files.‘sparc-stub.c’ is the best organized, and therefore the easiest to read.)
To debug a program running on another machine (the debugging target machine), youmust first arrange for all the usual prerequisites for the program to run by itself. Forexample, for a C program, you need:
1. A startup routine to set up the C runtime environment; these usually have a name like‘crt0’. The startup routine may be supplied by your hardware supplier, or you mayhave to write your own.
2. A C subroutine library to support your program’s subroutine calls, notably managinginput and output.
3. A way of getting your program to the other machine—for example, a download pro-gram. These are often supplied by the hardware manufacturer, but you may have towrite your own from hardware documentation.
Chapter 20: Debugging Remote Programs 231
The next step is to arrange for your program to use a serial port to communicate withthe machine where gdb is running (the host machine). In general terms, the scheme lookslike this:
On the host,gdb already understands how to use this protocol; when everything else isset up, you can simply use the ‘target remote’ command (see Chapter 19[Specifying a Debugging Target], page 215).
On the target,you must link with your program a few special-purpose subroutines that imple-ment the gdb remote serial protocol. The file containing these subroutines iscalled a debugging stub.
On certain remote targets, you can use an auxiliary program gdbserver insteadof linking a stub into your program. See Section 20.3 [Using the gdbserver
Program], page 221, for details.
The debugging stub is specific to the architecture of the remote machine; for example,use ‘sparc-stub.c’ to debug programs on sparc boards.
These working remote stubs are distributed with gdb:
i386-stub.c
For Intel 386 and compatible architectures.
m68k-stub.c
For Motorola 680x0 architectures.
sh-stub.c
For Renesas SH architectures.
sparc-stub.c
For sparc architectures.
sparcl-stub.c
For Fujitsu sparclite architectures.
The ‘README’ file in the gdb distribution may list other recently added stubs.
20.5.1 What the Stub Can Do for You
The debugging stub for your architecture supplies these three subroutines:
set_debug_traps
This routine arranges for handle_exception to run when your program stops.You must call this subroutine explicitly near the beginning of your program.
handle_exception
This is the central workhorse, but your program never calls it explicitly—thesetup code arranges for handle_exception to run when a trap is triggered.
handle_exception takes control when your program stops during execution(for example, on a breakpoint), and mediates communications with gdb onthe host machine. This is where the communications protocol is implemented;handle_exception acts as the gdb representative on the target machine. It
232 Debugging with gdb
begins by sending summary information on the state of your program, then con-tinues to execute, retrieving and transmitting any information gdb needs, untilyou execute a gdb command that makes your program resume; at that point,handle_exception returns control to your own code on the target machine.
breakpoint
Use this auxiliary subroutine to make your program contain a breakpoint. De-pending on the particular situation, this may be the only way for gdb to getcontrol. For instance, if your target machine has some sort of interrupt button,you won’t need to call this; pressing the interrupt button transfers control tohandle_exception—in effect, to gdb. On some machines, simply receivingcharacters on the serial port may also trigger a trap; again, in that situation,you don’t need to call breakpoint from your own program—simply running‘target remote’ from the host gdb session gets control.
Call breakpoint if none of these is true, or if you simply want to make certainyour program stops at a predetermined point for the start of your debuggingsession.
20.5.2 What You Must Do for the Stub
The debugging stubs that come with gdb are set up for a particular chip architecture, butthey have no information about the rest of your debugging target machine.
First of all you need to tell the stub how to communicate with the serial port.
int getDebugChar()
Write this subroutine to read a single character from the serial port. It may beidentical to getchar for your target system; a different name is used to allowyou to distinguish the two if you wish.
void putDebugChar(int)
Write this subroutine to write a single character to the serial port. It may beidentical to putchar for your target system; a different name is used to allowyou to distinguish the two if you wish.
If you want gdb to be able to stop your program while it is running, you need to usean interrupt-driven serial driver, and arrange for it to stop when it receives a ^C (‘\003’,the control-C character). That is the character which gdb uses to tell the remote systemto stop.
Getting the debugging target to return the proper status to gdb probably requireschanges to the standard stub; one quick and dirty way is to just execute a breakpointinstruction (the “dirty” part is that gdb reports a SIGTRAP instead of a SIGINT).
Other routines you need to supply are:
void exceptionHandler (int exception_number, void *exception_address)
Write this function to install exception address in the exception handling ta-bles. You need to do this because the stub does not have any way of knowingwhat the exception handling tables on your target system are like (for example,the processor’s table might be in rom, containing entries which point to a tablein ram). exception number is the exception number which should be changed;its meaning is architecture-dependent (for example, different numbers might
Chapter 20: Debugging Remote Programs 233
represent divide by zero, misaligned access, etc). When this exception occurs,control should be transferred directly to exception address, and the processorstate (stack, registers, and so on) should be just as it is when a processor excep-tion occurs. So if you want to use a jump instruction to reach exception address,it should be a simple jump, not a jump to subroutine.
For the 386, exception address should be installed as an interrupt gate so thatinterrupts are masked while the handler runs. The gate should be at privilegelevel 0 (the most privileged level). The sparc and 68k stubs are able to maskinterrupts themselves without help from exceptionHandler.
void flush_i_cache()
On sparc and sparclite only, write this subroutine to flush the instructioncache, if any, on your target machine. If there is no instruction cache, thissubroutine may be a no-op.
On target machines that have instruction caches, gdb requires this function tomake certain that the state of your program is stable.
You must also make sure this library routine is available:
void *memset(void *, int, int)
This is the standard library function memset that sets an area of memory to aknown value. If you have one of the free versions of libc.a, memset can be foundthere; otherwise, you must either obtain it from your hardware manufacturer,or write your own.
If you do not use the GNU C compiler, you may need other standard library subroutinesas well; this varies from one stub to another, but in general the stubs are likely to use anyof the common library subroutines which gcc generates as inline code.
20.5.3 Putting it All Together
In summary, when your program is ready to debug, you must follow these steps.
1. Make sure you have defined the supporting low-level routines (see Section 20.5.2 [WhatYou Must Do for the Stub], page 232):
getDebugChar, putDebugChar,flush_i_cache, memset, exceptionHandler.
2. Insert these lines near the top of your program:
set_debug_traps();
breakpoint();
3. For the 680x0 stub only, you need to provide a variable called exceptionHook. Nor-mally you just use:
void (*exceptionHook)() = 0;
but if before calling set_debug_traps, you set it to point to a function in your program,that function is called when gdb continues after stopping on a trap (for example, buserror). The function indicated by exceptionHook is called with one parameter: an int
which is the exception number.
4. Compile and link together: your program, the gdb debugging stub for your targetarchitecture, and the supporting subroutines.

234 Debugging with gdb
5. Make sure you have a serial connection between your target machine and the gdb host,and identify the serial port on the host.
6. Download your program to your target machine (or get it there by whatever means themanufacturer provides), and start it.
7. Start gdb on the host, and connect to the target (see Section 20.1 [Connecting to aRemote Target], page 219).
Chapter 21: Configuration-Specific Information 235
21 Configuration-Specific Information
While nearly all gdb commands are available for all native and cross versions of the de-bugger, there are some exceptions. This chapter describes things that are only available incertain configurations.
There are three major categories of configurations: native configurations, where the hostand target are the same, embedded operating system configurations, which are usually thesame for several different processor architectures, and bare embedded processors, which arequite different from each other.
21.1 Native
This section describes details specific to particular native configurations.
21.1.1 HP-UX
On HP-UX systems, if you refer to a function or variable name that begins with a dollarsign, gdb searches for a user or system name first, before it searches for a conveniencevariable.
21.1.2 BSD libkvm Interface
BSD-derived systems (FreeBSD/NetBSD/OpenBSD) have a kernel memory interface thatprovides a uniform interface for accessing kernel virtual memory images, including livesystems and crash dumps. gdb uses this interface to allow you to debug live kernels andkernel crash dumps on many native BSD configurations. This is implemented as a specialkvm debugging target. For debugging a live system, load the currently running kernel intogdb and connect to the kvm target:
(gdb) target kvm
For debugging crash dumps, provide the file name of the crash dump as an argument:(gdb) target kvm /var/crash/bsd.0
Once connected to the kvm target, the following commands are available:
kvm pcb Set current context from the Process Control Block (PCB) address.
kvm proc Set current context from proc address. This command isn’t available on modernFreeBSD systems.
21.1.3 SVR4 Process Information
Many versions of SVR4 and compatible systems provide a facility called ‘/proc’ that canbe used to examine the image of a running process using file-system subroutines. If gdb isconfigured for an operating system with this facility, the command info proc is available toreport information about the process running your program, or about any process runningon your system. info proc works only on SVR4 systems that include the procfs code. Thisincludes, as of this writing, gnu/Linux, OSF/1 (Digital Unix), Solaris, Irix, and Unixware,but not HP-UX, for example.
info proc
info proc process-id
Summarize available information about any running process. If a process IDis specified by process-id, display information about that process; otherwise

236 Debugging with gdb
display information about the program being debugged. The summary includesthe debugged process ID, the command line used to invoke it, its current workingdirectory, and its executable file’s absolute file name.
On some systems, process-id can be of the form ‘[pid]/tid ’ which specifiesa certain thread ID within a process. If the optional pid part is missing, itmeans a thread from the process being debugged (the leading ‘/’ still needs tobe present, or else gdb will interpret the number as a process ID rather than athread ID).
info proc mappings
Report the memory address space ranges accessible in the program, with in-formation on whether the process has read, write, or execute access rights toeach range. On gnu/Linux systems, each memory range includes the objectfile which is mapped to that range, instead of the memory access rights to thatrange.
info proc stat
info proc status
These subcommands are specific to gnu/Linux systems. They show the process-related information, including the user ID and group ID; how many threads arethere in the process; its virtual memory usage; the signals that are pending,blocked, and ignored; its TTY; its consumption of system and user time; itsstack size; its ‘nice’ value; etc. For more information, see the ‘proc’ man page(type man 5 proc from your shell prompt).
info proc all
Show all the information about the process described under all of the aboveinfo proc subcommands.
set procfs-trace
This command enables and disables tracing of procfs API calls.
show procfs-trace
Show the current state of procfs API call tracing.
set procfs-file file
Tell gdb to write procfs API trace to the named file. gdb appends the traceinfo to the previous contents of the file. The default is to display the trace onthe standard output.
show procfs-file
Show the file to which procfs API trace is written.
proc-trace-entry
proc-trace-exit
proc-untrace-entry
proc-untrace-exit
These commands enable and disable tracing of entries into and exits from thesyscall interface.
info pidlist
For QNX Neutrino only, this command displays the list of all the processes andall the threads within each process.
Chapter 21: Configuration-Specific Information 237
info meminfo
For QNX Neutrino only, this command displays the list of all mapinfos.
21.1.4 Features for Debugging djgpp Programs
djgpp is a port of the gnu development tools to MS-DOS and MS-Windows. djgppprograms are 32-bit protected-mode programs that use the DPMI (DOS Protected-ModeInterface) API to run on top of real-mode DOS systems and their emulations.
gdb supports native debugging of djgpp programs, and defines a few commands specificto the djgpp port. This subsection describes those commands.
info dos This is a prefix of djgpp-specific commands which print information about thetarget system and important OS structures.
info dos sysinfo
This command displays assorted information about the underlying platform:the CPU type and features, the OS version and flavor, the DPMI version, andthe available conventional and DPMI memory.
info dos gdt
info dos ldt
info dos idt
These 3 commands display entries from, respectively, Global, Local, and Inter-rupt Descriptor Tables (GDT, LDT, and IDT). The descriptor tables are datastructures which store a descriptor for each segment that is currently in use.The segment’s selector is an index into a descriptor table; the table entry forthat index holds the descriptor’s base address and limit, and its attributes andaccess rights.
A typical djgpp program uses 3 segments: a code segment, a data segment(used for both data and the stack), and a DOS segment (which allows access toDOS/BIOS data structures and absolute addresses in conventional memory).However, the DPMI host will usually define additional segments in order tosupport the DPMI environment.
These commands allow to display entries from the descriptor tables. Withoutan argument, all entries from the specified table are displayed. An argument,which should be an integer expression, means display a single entry whose indexis given by the argument. For example, here’s a convenient way to displayinformation about the debugged program’s data segment:
(gdb) info dos ldt $ds
0x13f: base=0x11970000 limit=0x0009ffff 32-Bit Data (Read/Write, Exp-up)
This comes in handy when you want to see whether a pointer is outside thedata segment’s limit (i.e. garbled).
info dos pde
info dos pte
These two commands display entries from, respectively, the Page Directory andthe Page Tables. Page Directories and Page Tables are data structures whichcontrol how virtual memory addresses are mapped into physical addresses. APage Table includes an entry for every page of memory that is mapped into the
238 Debugging with gdb
program’s address space; there may be several Page Tables, each one holdingup to 4096 entries. A Page Directory has up to 4096 entries, one each for everyPage Table that is currently in use.
Without an argument, info dos pde displays the entire Page Directory, andinfo dos pte displays all the entries in all of the Page Tables. An argument,an integer expression, given to the info dos pde command means display onlythat entry from the Page Directory table. An argument given to the info dos
pte command means display entries from a single Page Table, the one pointedto by the specified entry in the Page Directory.
These commands are useful when your program uses DMA (Direct MemoryAccess), which needs physical addresses to program the DMA controller.
These commands are supported only with some DPMI servers.
info dos address-pte addr
This command displays the Page Table entry for a specified linear address. Theargument addr is a linear address which should already have the appropriatesegment’s base address added to it, because this command accepts addresseswhich may belong to any segment. For example, here’s how to display the PageTable entry for the page where a variable i is stored:(gdb) info dos address-pte __djgpp_base_address + (char *)&i
Page Table entry for address 0x11a00d30:
Base=0x02698000 Dirty Acc. Not-Cached Write-Back Usr Read-Write +0xd30
This says that i is stored at offset 0xd30 from the page whose physical baseaddress is 0x02698000, and shows all the attributes of that page.
Note that you must cast the addresses of variables to a char *, since otherwisethe value of __djgpp_base_address, the base address of all variables and func-tions in a djgpp program, will be added using the rules of C pointer arithmetics:if i is declared an int, gdb will add 4 times the value of __djgpp_base_addressto the address of i.
Here’s another example, it displays the Page Table entry for the transfer buffer:(gdb) info dos address-pte *((unsigned *)&_go32_info_block + 3)
Page Table entry for address 0x29110:
Base=0x00029000 Dirty Acc. Not-Cached Write-Back Usr Read-Write +0x110
(The + 3 offset is because the transfer buffer’s address is the 3rd member of the_go32_info_block structure.) The output clearly shows that this DPMI servermaps the addresses in conventional memory 1:1, i.e. the physical (0x00029000+ 0x110) and linear (0x29110) addresses are identical.
This command is supported only with some DPMI servers.
In addition to native debugging, the DJGPP port supports remote debugging via a serialdata link. The following commands are specific to remote serial debugging in the DJGPPport of gdb.
set com1base addr
This command sets the base I/O port address of the ‘COM1’ serial port.
set com1irq irq
This command sets the Interrupt Request (IRQ) line to use for the ‘COM1’ serialport.
Chapter 21: Configuration-Specific Information 239
There are similar commands ‘set com2base’, ‘set com3irq’, etc. for setting theport address and the IRQ lines for the other 3 COM ports.
The related commands ‘show com1base’, ‘show com1irq’ etc. display the cur-rent settings of the base address and the IRQ lines used by the COM ports.
info serial
This command prints the status of the 4 DOS serial ports. For each port,it prints whether it’s active or not, its I/O base address and IRQ number,whether it uses a 16550-style FIFO, its baudrate, and the counts of variouserrors encountered so far.
21.1.5 Features for Debugging MS Windows PE Executables
gdb supports native debugging of MSWindows programs, including DLLs with and withoutsymbolic debugging information.
MS-Windows programs that call SetConsoleMode to switch off the special meaning ofthe ‘Ctrl-C’ keystroke cannot be interrupted by typing C-c. For this reason, gdb on MS-Windows supports C-BREAK as an alternative interrupt key sequence, which can be used tointerrupt the debuggee even if it ignores C-c.
There are various additional Cygwin-specific commands, described in this section. Work-ing with DLLs that have no debugging symbols is described in Section 21.1.5.1 [Non-debugDLL Symbols], page 240.
info w32 This is a prefix of MS Windows-specific commands which print informationabout the target system and important OS structures.
info w32 selector
This command displays information returned by the Win32 APIGetThreadSelectorEntry function. It takes an optional argument that isevaluated to a long value to give the information about this given selector.Without argument, this command displays information about the six segmentregisters.
info w32 thread-information-block
This command displays thread specific information stored in the Thread Infor-mation Block (readable on the X86 CPU family using $fs selector for 32-bitprograms and $gs for 64-bit programs).
info dll This is a Cygwin-specific alias of info shared.
dll-symbols
This command loads symbols from a dll similarly to add-sym command butwithout the need to specify a base address.
set cygwin-exceptions mode
Ifmode is on, gdb will break on exceptions that happen inside the Cygwin DLL.If mode is off, gdb will delay recognition of exceptions, and may ignore someexceptions which seem to be caused by internal Cygwin DLL “bookkeeping”.This option is meant primarily for debugging the Cygwin DLL itself; the defaultvalue is off to avoid annoying gdb users with false SIGSEGV signals.
240 Debugging with gdb
show cygwin-exceptions
Displays whether gdb will break on exceptions that happen inside the CygwinDLL itself.
set new-console mode
If mode is on the debuggee will be started in a new console on next start. Ifmode is off, the debuggee will be started in the same console as the debugger.
show new-console
Displays whether a new console is used when the debuggee is started.
set new-group mode
This boolean value controls whether the debuggee should start a new group orstay in the same group as the debugger. This affects the way the Windows OShandles ‘Ctrl-C’.
show new-group
Displays current value of new-group boolean.
set debugevents
This boolean value adds debug output concerning kernel events related to thedebuggee seen by the debugger. This includes events that signal thread andprocess creation and exit, DLL loading and unloading, console interrupts, anddebugging messages produced by the Windows OutputDebugString API call.
set debugexec
This boolean value adds debug output concerning execute events (such as re-sume thread) seen by the debugger.
set debugexceptions
This boolean value adds debug output concerning exceptions in the debuggeeseen by the debugger.
set debugmemory
This boolean value adds debug output concerning debuggee memory reads andwrites by the debugger.
set shell This boolean values specifies whether the debuggee is called via a shell or di-rectly (default value is on).
show shell
Displays if the debuggee will be started with a shell.
21.1.5.1 Support for DLLs without Debugging Symbols
Very often on windows, some of the DLLs that your program relies on do not include sym-bolic debugging information (for example, ‘kernel32.dll’). When gdb doesn’t recognizeany debugging symbols in a DLL, it relies on the minimal amount of symbolic informationcontained in the DLL’s export table. This section describes working with such symbols,known internally to gdb as “minimal symbols”.
Note that before the debugged program has started execution, no DLLs will have beenloaded. The easiest way around this problem is simply to start the program — either bysetting a breakpoint or letting the program run once to completion. It is also possible
Chapter 21: Configuration-Specific Information 241
to force gdb to load a particular DLL before starting the executable — see the sharedlibrary information in Section 18.1 [Files], page 201, or the dll-symbols command inSection 21.1.5 [Cygwin Native], page 239. Currently, explicitly loading symbols from aDLL with no debugging information will cause the symbol names to be duplicated in gdb’slookup table, which may adversely affect symbol lookup performance.
21.1.5.2 DLL Name Prefixes
In keeping with the naming conventions used by the Microsoft debugging tools, DLLexport symbols are made available with a prefix based on the DLL name, for instanceKERNEL32!CreateFileA. The plain name is also entered into the symbol table, soCreateFileA is often sufficient. In some cases there will be name clashes within a program(particularly if the executable itself includes full debugging symbols) necessitating the useof the fully qualified name when referring to the contents of the DLL. Use single-quotesaround the name to avoid the exclamation mark (“!”) being interpreted as a languageoperator.
Note that the internal name of the DLL may be all upper-case, even though the filename of the DLL is lower-case, or vice-versa. Since symbols within gdb are case-sensitivethis may cause some confusion. If in doubt, try the info functions and info variables
commands or even maint print msymbols (see Chapter 16 [Symbols], page 189). Here’s anexample:
(gdb) info function CreateFileA
All functions matching regular expression "CreateFileA":
Non-debugging symbols:
0x77e885f4 CreateFileA
0x77e885f4 KERNEL32!CreateFileA
(gdb) info function !
All functions matching regular expression "!":
Non-debugging symbols:
0x6100114c cygwin1!__assert
0x61004034 cygwin1!_dll_crt0@0
0x61004240 cygwin1!dll_crt0(per_process *)
[etc...]
21.1.5.3 Working with Minimal Symbols
Symbols extracted from a DLL’s export table do not contain very much type information.All that gdb can do is guess whether a symbol refers to a function or variable dependingon the linker section that contains the symbol. Also note that the actual contents of thememory contained in a DLL are not available unless the program is running. This meansthat you cannot examine the contents of a variable or disassemble a function within a DLLwithout a running program.
Variables are generally treated as pointers and dereferenced automatically. For thisreason, it is often necessary to prefix a variable name with the address-of operator (“&”)and provide explicit type information in the command. Here’s an example of the type ofproblem:
(gdb) print ’cygwin1!__argv’
$1 = 268572168
242 Debugging with gdb
(gdb) x ’cygwin1!__argv’
0x10021610: "\230y\""
And two possible solutions:
(gdb) print ((char **)’cygwin1!__argv’)[0]
$2 = 0x22fd98 "/cygdrive/c/mydirectory/myprogram"
(gdb) x/2x &’cygwin1!__argv’
0x610c0aa8 <cygwin1!__argv>: 0x10021608 0x00000000
(gdb) x/x 0x10021608
0x10021608: 0x0022fd98
(gdb) x/s 0x0022fd98
0x22fd98: "/cygdrive/c/mydirectory/myprogram"
Setting a break point within a DLL is possible even before the program starts execu-tion. However, under these circumstances, gdb can’t examine the initial instructions of thefunction in order to skip the function’s frame set-up code. You can work around this byusing “*&” to set the breakpoint at a raw memory address:
(gdb) break *&’python22!PyOS_Readline’
Breakpoint 1 at 0x1e04eff0
The author of these extensions is not entirely convinced that setting a break point withina shared DLL like ‘kernel32.dll’ is completely safe.
21.1.6 Commands Specific to gnu Hurd Systems
This subsection describes gdb commands specific to the gnu Hurd native debugging.
set signals
set sigs This command toggles the state of inferior signal interception by gdb. Machexceptions, such as breakpoint traps, are not affected by this command. sigs
is a shorthand alias for signals.
show signals
show sigs Show the current state of intercepting inferior’s signals.
set signal-thread
set sigthread
This command tells gdb which thread is the libc signal thread. That threadis run when a signal is delivered to a running process. set sigthread is theshorthand alias of set signal-thread.
show signal-thread
show sigthread
These two commands show which thread will run when the inferior is delivereda signal.
set stopped
This commands tells gdb that the inferior process is stopped, as with theSIGSTOP signal. The stopped process can be continued by delivering a signalto it.
show stopped
This command shows whether gdb thinks the debuggee is stopped.
Chapter 21: Configuration-Specific Information 243
set exceptions
Use this command to turn off trapping of exceptions in the inferior. Whenexception trapping is off, neither breakpoints nor single-stepping will work. Torestore the default, set exception trapping on.
show exceptions
Show the current state of trapping exceptions in the inferior.
set task pause
This command toggles task suspension when gdb has control. Setting it to ontakes effect immediately, and the task is suspended whenever gdb gets control.Setting it to off will take effect the next time the inferior is continued. If thisoption is set to off, you can use set thread default pause on or set thread
pause on (see below) to pause individual threads.
show task pause
Show the current state of task suspension.
set task detach-suspend-count
This command sets the suspend count the task will be left with when gdbdetaches from it.
show task detach-suspend-count
Show the suspend count the task will be left with when detaching.
set task exception-port
set task excp
This command sets the task exception port to which gdb will forward excep-tions. The argument should be the value of the send rights of the task. set
task excp is a shorthand alias.
set noninvasive
This command switches gdb to a mode that is the least invasive as far asinterfering with the inferior is concerned. This is the same as using set task
pause, set exceptions, and set signals to values opposite to the defaults.
info send-rights
info receive-rights
info port-rights
info port-sets
info dead-names
info ports
info psets
These commands display information about, respectively, send rights, receiverights, port rights, port sets, and dead names of a task. There are also shorthandaliases: info ports for info port-rights and info psets for info port-
sets.
set thread pause
This command toggles current thread suspension when gdb has control. Settingit to on takes effect immediately, and the current thread is suspended whenevergdb gets control. Setting it to off will take effect the next time the inferior is
244 Debugging with gdb
continued. Normally, this command has no effect, since when gdb has control,the whole task is suspended. However, if you used set task pause off (seeabove), this command comes in handy to suspend only the current thread.
show thread pause
This command shows the state of current thread suspension.
set thread run
This command sets whether the current thread is allowed to run.
show thread run
Show whether the current thread is allowed to run.
set thread detach-suspend-count
This command sets the suspend count gdb will leave on a thread when de-taching. This number is relative to the suspend count found by gdb when itnotices the thread; use set thread takeover-suspend-count to force it to anabsolute value.
show thread detach-suspend-count
Show the suspend count gdb will leave on the thread when detaching.
set thread exception-port
set thread excp
Set the thread exception port to which to forward exceptions. This overridesthe port set by set task exception-port (see above). set thread excp is theshorthand alias.
set thread takeover-suspend-count
Normally, gdb’s thread suspend counts are relative to the value gdb findswhen it notices each thread. This command changes the suspend counts to beabsolute instead.
set thread default
show thread default
Each of the above set thread commands has a set thread default counter-part (e.g., set thread default pause, set thread default exception-port,etc.). The thread default variety of commands sets the default thread prop-erties for all threads; you can then change the properties of individual threadswith the non-default commands.
21.1.7 QNX Neutrino
gdb provides the following commands specific to the QNX Neutrino target:
set debug nto-debug
When set to on, enables debugging messages specific to the QNX Neutrinosupport.
show debug nto-debug
Show the current state of QNX Neutrino messages.
Chapter 21: Configuration-Specific Information 245
21.1.8 Darwin
gdb provides the following commands specific to the Darwin target:
set debug darwin num
When set to a non zero value, enables debugging messages specific to the Darwinsupport. Higher values produce more verbose output.
show debug darwin
Show the current state of Darwin messages.
set debug mach-o num
When set to a non zero value, enables debugging messages while gdb is readingDarwin object files. (Mach-O is the file format used on Darwin for objectand executable files.) Higher values produce more verbose output. This is acommand to diagnose problems internal to gdb and should not be needed innormal usage.
show debug mach-o
Show the current state of Mach-O file messages.
set mach-exceptions on
set mach-exceptions off
On Darwin, faults are first reported as a Mach exception and are then mappedto a Posix signal. Use this command to turn on trapping of Mach exceptionsin the inferior. This might be sometimes useful to better understand the causeof a fault. The default is off.
show mach-exceptions
Show the current state of exceptions trapping.
21.2 Embedded Operating Systems
This section describes configurations involving the debugging of embedded operating sys-tems that are available for several different architectures.
gdb includes the ability to debug programs running on various real-time operating sys-tems.
21.2.1 Using gdb with VxWorks
target vxworks machinename
A VxWorks system, attached via TCP/IP. The argument machinename is thetarget system’s machine name or IP address.
On VxWorks, load links filename dynamically on the current target system as well asadding its symbols in gdb.
gdb enables developers to spawn and debug tasks running on networked VxWorks targetsfrom a Unix host. Already-running tasks spawned from the VxWorks shell can also bedebugged. gdb uses code that runs on both the Unix host and on the VxWorks target.The program gdb is installed and executed on the Unix host. (It may be installed with thename vxgdb, to distinguish it from a gdb for debugging programs on the host itself.)
246 Debugging with gdb
VxWorks-timeout args
All VxWorks-based targets now support the option vxworks-timeout. Thisoption is set by the user, and args represents the number of seconds gdb waitsfor responses to rpc’s. You might use this if your VxWorks target is a slowsoftware simulator or is on the far side of a thin network line.
The following information on connecting to VxWorks was current when this manual wasproduced; newer releases of VxWorks may use revised procedures.
To use gdb with VxWorks, you must rebuild your VxWorks kernel to include the remotedebugging interface routines in the VxWorks library ‘rdb.a’. To do this, define INCLUDE_
RDB in the VxWorks configuration file ‘configAll.h’ and rebuild your VxWorks kernel. Theresulting kernel contains ‘rdb.a’, and spawns the source debugging task tRdbTask whenVxWorks is booted. For more information on configuring and remaking VxWorks, see themanufacturer’s manual.
Once you have included ‘rdb.a’ in your VxWorks system image and set your Unixexecution search path to find gdb, you are ready to run gdb. From your Unix host, rungdb (or vxgdb, depending on your installation).
gdb comes up showing the prompt:(vxgdb)
21.2.1.1 Connecting to VxWorks
The gdb command target lets you connect to a VxWorks target on the network. Toconnect to a target whose host name is “tt”, type:
(vxgdb) target vxworks tt
gdb displays messages like these:Attaching remote machine across net...
Connected to tt.
gdb then attempts to read the symbol tables of any object modules loaded into theVxWorks target since it was last booted. gdb locates these files by searching the directorieslisted in the command search path (see Section 4.4 [Your Program’s Environment], page 29);if it fails to find an object file, it displays a message such as:
prog.o: No such file or directory.
When this happens, add the appropriate directory to the search path with the gdbcommand path, and execute the target command again.
21.2.1.2 VxWorks Download
If you have connected to the VxWorks target and you want to debug an object that hasnot yet been loaded, you can use the gdb load command to download a file from Unixto VxWorks incrementally. The object file given as an argument to the load commandis actually opened twice: first by the VxWorks target in order to download the code,then by gdb in order to read the symbol table. This can lead to problems if the currentworking directories on the two systems differ. If both systems have NFS mounted thesame filesystems, you can avoid these problems by using absolute paths. Otherwise, it issimplest to set the working directory on both systems to the directory in which the object fileresides, and then to reference the file by its name, without any path. For instance, a program‘prog.o’ may reside in ‘vxpath/vw/demo/rdb’ in VxWorks and in ‘hostpath/vw/demo/rdb’on the host. To load this program, type this on VxWorks:
Chapter 21: Configuration-Specific Information 247
-> cd "vxpath/vw/demo/rdb"
Then, in gdb, type:
(vxgdb) cd hostpath/vw/demo/rdb
(vxgdb) load prog.o
gdb displays a response similar to this:
Reading symbol data from wherever/vw/demo/rdb/prog.o... done.
You can also use the load command to reload an object module after editing and recom-piling the corresponding source file. Note that this makes gdb delete all currently-definedbreakpoints, auto-displays, and convenience variables, and to clear the value history. (Thisis necessary in order to preserve the integrity of debugger’s data structures that referencethe target system’s symbol table.)
21.2.1.3 Running Tasks
You can also attach to an existing task using the attach command as follows:
(vxgdb) attach task
where task is the VxWorks hexadecimal task ID. The task can be running or suspendedwhen you attach to it. Running tasks are suspended at the time of attachment.
21.3 Embedded Processors
This section goes into details specific to particular embedded configurations.
Whenever a specific embedded processor has a simulator, gdb allows to send an arbitrarycommand to the simulator.
sim command
Send an arbitrary command string to the simulator. Consult the documentationfor the specific simulator in use for information about acceptable commands.
21.3.1 ARM
target rdi dev
ARM Angel monitor, via RDI library interface to ADP protocol. You may usethis target to communicate with both boards running the Angel monitor, orwith the EmbeddedICE JTAG debug device.
target rdp dev
ARM Demon monitor.
gdb provides the following ARM-specific commands:
set arm disassembler
This commands selects from a list of disassembly styles. The "std" style is thestandard style.
show arm disassembler
Show the current disassembly style.
set arm apcs32
This command toggles ARM operation mode between 32-bit and 26-bit.
248 Debugging with gdb
show arm apcs32
Display the current usage of the ARM 32-bit mode.
set arm fpu fputype
This command sets the ARM floating-point unit (FPU) type. The argumentfputype can be one of these:
auto Determine the FPU type by querying the OS ABI.
softfpa Software FPU, with mixed-endian doubles on little-endian ARMprocessors.
fpa GCC-compiled FPA co-processor.
softvfp Software FPU with pure-endian doubles.
vfp VFP co-processor.
show arm fpu
Show the current type of the FPU.
set arm abi
This command forces gdb to use the specified ABI.
show arm abi
Show the currently used ABI.
set arm fallback-mode (arm|thumb|auto)
gdb uses the symbol table, when available, to determine whether instructionsare ARM or Thumb. This command controls gdb’s default behavior when thesymbol table is not available. The default is ‘auto’, which causes gdb to usethe current execution mode (from the T bit in the CPSR register).
show arm fallback-mode
Show the current fallback instruction mode.
set arm force-mode (arm|thumb|auto)
This command overrides use of the symbol table to determine whether instruc-tions are ARM or Thumb. The default is ‘auto’, which causes gdb to use thesymbol table and then the setting of ‘set arm fallback-mode’.
show arm force-mode
Show the current forced instruction mode.
set debug arm
Toggle whether to display ARM-specific debugging messages from the ARMtarget support subsystem.
show debug arm
Show whether ARM-specific debugging messages are enabled.
The following commands are available when an ARM target is debugged using the RDIinterface:
rdilogfile [file ]Set the filename for the ADP (Angel Debugger Protocol) packet log. With anargument, sets the log file to the specified file. With no argument, show thecurrent log file name. The default log file is ‘rdi.log’.
Chapter 21: Configuration-Specific Information 249
rdilogenable [arg ]Control logging of ADP packets. With an argument of 1 or "yes" enableslogging, with an argument 0 or "no" disables it. With no arguments displaysthe current setting. When logging is enabled, ADP packets exchanged betweengdb and the RDI target device are logged to a file.
set rdiromatzero
Tell gdb whether the target has ROM at address 0. If on, vector catching isdisabled, so that zero address can be used. If off (the default), vector catchingis enabled. For this command to take effect, it needs to be invoked prior to thetarget rdi command.
show rdiromatzero
Show the current setting of ROM at zero address.
set rdiheartbeat
Enable or disable RDI heartbeat packets. It is not recommended to turn on thisoption, since it confuses ARM and EPI JTAG interface, as well as the Angelmonitor.
show rdiheartbeat
Show the setting of RDI heartbeat packets.
target sim [simargs ] ...The gdb ARM simulator accepts the following optional arguments.
--swi-support=type
Tell the simulator which SWI interfaces to support. type may be acomma separated list of the following values. The default value isall.
none
demon
angel
redboot
all
21.3.2 Renesas M32R/D and M32R/SDI
target m32r dev
Renesas M32R/D ROM monitor.
target m32rsdi dev
Renesas M32R SDI server, connected via parallel port to the board.
The following gdb commands are specific to the M32R monitor:
set download-path path
Set the default path for finding downloadable srec files.
show download-path
Show the default path for downloadable srec files.
250 Debugging with gdb
set board-address addr
Set the IP address for the M32R-EVA target board.
show board-address
Show the current IP address of the target board.
set server-address addr
Set the IP address for the download server, which is the gdb’s host machine.
show server-address
Display the IP address of the download server.
upload [file ]Upload the specified srec file via the monitor’s Ethernet upload capability. Ifno file argument is given, the current executable file is uploaded.
tload [file ]Test the upload command.
The following commands are available for M32R/SDI:
sdireset This command resets the SDI connection.
sdistatus
This command shows the SDI connection status.
debug_chaos
Instructs the remote that M32R/Chaos debugging is to be used.
use_debug_dma
Instructs the remote to use the DEBUG DMA method of accessing memory.
use_mon_code
Instructs the remote to use the MON CODE method of accessing memory.
use_ib_break
Instructs the remote to set breakpoints by IB break.
use_dbt_break
Instructs the remote to set breakpoints by DBT.
21.3.3 M68k
The Motorola m68k configuration includes ColdFire support, and a target command for thefollowing ROM monitor.
target dbug dev
dBUG ROM monitor for Motorola ColdFire.
21.3.4 MicroBlaze
The MicroBlaze is a soft-core processor supported on various Xilinx FPGAs, such as Spar-tan or Virtex series. Boards with these processors usually have JTAG ports which connectto a host system running the Xilinx Embedded Development Kit (EDK) or Software De-velopment Kit (SDK). This host system is used to download the configuration bitstreamto the target FPGA. The Xilinx Microprocessor Debugger (XMD) program communicates
Chapter 21: Configuration-Specific Information 251
with the target board using the JTAG interface and presents a gdbserver interface to theboard. By default xmd uses port 1234. (While it is possible to change this default port, itrequires the use of undocumented xmd commands. Contact Xilinx support if you need todo this.)
Use these GDB commands to connect to the MicroBlaze target processor.
target remote :1234
Use this command to connect to the target if you are running gdb on the samesystem as xmd.
target remote xmd-host:1234
Use this command to connect to the target if it is connected to xmd running ona different system named xmd-host.
load Use this command to download a program to the MicroBlaze target.
set debug microblaze n
Enable MicroBlaze-specific debugging messages if non-zero.
show debug microblaze n
Show MicroBlaze-specific debugging level.
21.3.5 MIPS Embedded
gdb can use the MIPS remote debugging protocol to talk to a MIPS board attached to aserial line. This is available when you configure gdb with ‘--target=mips-idt-ecoff’.
Use these gdb commands to specify the connection to your target board:
target mips port
To run a program on the board, start up gdb with the name of your programas the argument. To connect to the board, use the command ‘target mips
port ’, where port is the name of the serial port connected to the board. If theprogram has not already been downloaded to the board, you may use the loadcommand to download it. You can then use all the usual gdb commands.
For example, this sequence connects to the target board through a serial port,and loads and runs a program called prog through the debugger:
host$ gdb prog
gdb is free software and ...
(gdb) target mips /dev/ttyb
(gdb) load prog
(gdb) run
target mips hostname:portnumber
On some gdb host configurations, you can specify a TCP connection (for in-stance, to a serial line managed by a terminal concentrator) instead of a serialport, using the syntax ‘hostname:portnumber ’.
target pmon port
PMON ROM monitor.
target ddb port
NEC’s DDB variant of PMON for Vr4300.
252 Debugging with gdb
target lsi port
LSI variant of PMON.
target r3900 dev
Densan DVE-R3900 ROM monitor for Toshiba R3900 Mips.
target array dev
Array Tech LSI33K RAID controller board.
gdb also supports these special commands for MIPS targets:
set mipsfpu double
set mipsfpu single
set mipsfpu none
set mipsfpu auto
show mipsfpu
If your target board does not support the MIPS floating point coprocessor, youshould use the command ‘set mipsfpu none’ (if you need this, you may wish toput the command in your gdb init file). This tells gdb how to find the returnvalue of functions which return floating point values. It also allows gdb to avoidsaving the floating point registers when calling functions on the board. If youare using a floating point coprocessor with only single precision floating pointsupport, as on the r4650 processor, use the command ‘set mipsfpu single’.The default double precision floating point coprocessor may be selected using‘set mipsfpu double’.
In previous versions the only choices were double precision or no floating point,so ‘set mipsfpu on’ will select double precision and ‘set mipsfpu off’ will se-lect no floating point.
As usual, you can inquire about the mipsfpu variable with ‘show mipsfpu’.
set timeout seconds
set retransmit-timeout seconds
show timeout
show retransmit-timeout
You can control the timeout used while waiting for a packet, in the MIPS remoteprotocol, with the set timeout seconds command. The default is 5 seconds.Similarly, you can control the timeout used while waiting for an acknowledg-ment of a packet with the set retransmit-timeout seconds command. Thedefault is 3 seconds. You can inspect both values with show timeout and show
retransmit-timeout. (These commands are only available when gdb is con-figured for ‘--target=mips-idt-ecoff’.)
The timeout set by set timeout does not apply when gdb is waiting for yourprogram to stop. In that case, gdb waits forever because it has no way ofknowing how long the program is going to run before stopping.
set syn-garbage-limit num
Limit the maximum number of characters gdb should ignore when it tries tosynchronize with the remote target. The default is 10 characters. Setting thelimit to -1 means there’s no limit.
Chapter 21: Configuration-Specific Information 253
show syn-garbage-limit
Show the current limit on the number of characters to ignore when trying tosynchronize with the remote system.
set monitor-prompt prompt
Tell gdb to expect the specified prompt string from the remote monitor. Thedefault depends on the target:
pmon target‘PMON’
ddb target ‘NEC010’
lsi target ‘PMON>’
show monitor-prompt
Show the current strings gdb expects as the prompt from the remote monitor.
set monitor-warnings
Enable or disable monitor warnings about hardware breakpoints. This has effectonly for the lsi target. When on, gdb will display warning messages whosecodes are returned by the lsi PMON monitor for breakpoint commands.
show monitor-warnings
Show the current setting of printing monitor warnings.
pmon command
This command allows sending an arbitrary command string to the monitor.The monitor must be in debug mode for this to work.
21.3.6 OpenRISC 1000
See OR1k Architecture document (www.opencores.org) for more information about plat-form and commands.
target jtag jtag://host:port
Connects to remote JTAG server. JTAG remote server can be either an or1ksimor JTAG server, connected via parallel port to the board.
Example: target jtag jtag://localhost:9999
or1ksim command
If connected to or1ksim OpenRISC 1000 Architectural Simulator, proprietarycommands can be executed.
info or1k spr
Displays spr groups.
info or1k spr group
info or1k spr groupno
Displays register names in selected group.
info or1k spr group register
info or1k spr register
info or1k spr groupno registerno
info or1k spr registerno
Shows information about specified spr register.
254 Debugging with gdb
spr group register value
spr register value
spr groupno registerno value
spr registerno value
Writes value to specified spr register.
Some implementations of OpenRISC 1000 Architecture also have hardware trace. It isvery similar to gdb trace, except it does not interfere with normal program execution andis thus much faster. Hardware breakpoints/watchpoint triggers can be set using:
$LEA/$LDATA
Load effective address/data
$SEA/$SDATA
Store effective address/data
$AEA/$ADATA
Access effective address ($SEA or $LEA) or data ($SDATA/$LDATA)
$FETCH Fetch data
When triggered, it can capture low level data, like: PC, LSEA, LDATA, SDATA, READSPR,WRITESPR, INSTR.
htrace commands:
hwatch conditional
Set hardware watchpoint on combination of Load/Store Effective Address(es)or Data. For example:
hwatch ($LEA == my_var) && ($LDATA < 50) || ($SEA == my_var) &&
($SDATA >= 50)
hwatch ($LEA == my_var) && ($LDATA < 50) || ($SEA == my_var) &&
($SDATA >= 50)
htrace info
Display information about current HW trace configuration.
htrace trigger conditional
Set starting criteria for HW trace.
htrace qualifier conditional
Set acquisition qualifier for HW trace.
htrace stop conditional
Set HW trace stopping criteria.
htrace record [data]*
Selects the data to be recorded, when qualifier is met and HW trace was trig-gered.
htrace enable
htrace disable
Enables/disables the HW trace.
Chapter 21: Configuration-Specific Information 255
htrace rewind [filename]
Clears currently recorded trace data.
If filename is specified, new trace file is made and any newly collected data willbe written there.
htrace print [start [len]]
Prints trace buffer, using current record configuration.
htrace mode continuous
Set continuous trace mode.
htrace mode suspend
Set suspend trace mode.
21.3.7 PowerPC Embedded
gdb supports using the DVC (Data Value Compare) register to implement in hardwaresimple hardware watchpoint conditions of the form:
(gdb) watch ADDRESS|VARIABLE \
if ADDRESS|VARIABLE == CONSTANT EXPRESSION
The DVC register will be automatically used when gdb detects such pattern in a con-dition expression, and the created watchpoint uses one debug register (either the exact-
watchpoints option is on and the variable is scalar, or the variable has a length of onebyte). This feature is available in native gdb running on a Linux kernel version 2.6.34 ornewer.
When running on PowerPC embedded processors, gdb automatically uses ranged hard-ware watchpoints, unless the exact-watchpoints option is on, in which case watchpointsusing only one debug register are created when watching variables of scalar types.
You can create an artificial array to watch an arbitrary memory region using one of thefollowing commands (see Section 10.1 [Expressions], page 97):
(gdb) watch *((char *) address)@length
(gdb) watch {char[length]} address
PowerPC embedded processors support masked watchpoints. See the discussion aboutthe mask argument in Section 5.1.2 [Set Watchpoints], page 49.
PowerPC embedded processors support hardware accelerated ranged breakpoints. Aranged breakpoint stops execution of the inferior whenever it executes an instruction atany address within the range it specifies. To set a ranged breakpoint in gdb, use thebreak-range command.
gdb provides the following PowerPC-specific commands:
break-range start-location, end-location
Set a breakpoint for an address range. start-location and end-location canspecify a function name, a line number, an offset of lines from the current line orfrom the start location, or an address of an instruction (see Section 9.2 [SpecifyLocation], page 88, for a list of all the possible ways to specify a location.) Thebreakpoint will stop execution of the inferior whenever it executes an instructionat any address within the specified range, (including start-location and end-location.)
256 Debugging with gdb
set powerpc soft-float
show powerpc soft-float
Force gdb to use (or not use) a software floating point calling convention. Bydefault, gdb selects the calling convention based on the selected architectureand the provided executable file.
set powerpc vector-abi
show powerpc vector-abi
Force gdb to use the specified calling convention for vector arguments andreturn values. The valid options are ‘auto’; ‘generic’, to avoid vector registerseven if they are present; ‘altivec’, to use AltiVec registers; and ‘spe’ to useSPE registers. By default, gdb selects the calling convention based on theselected architecture and the provided executable file.
set powerpc exact-watchpoints
show powerpc exact-watchpoints
Allow gdb to use only one debug register when watching a variable of scalartype, thus assuming that the variable is accessed through the address of its firstbyte.
target dink32 dev
DINK32 ROM monitor.
target ppcbug dev
target ppcbug1 dev
PPCBUG ROM monitor for PowerPC.
target sds dev
SDS monitor, running on a PowerPC board (such as Motorola’s ADS).
The following commands specific to the SDS protocol are supported by gdb:
set sdstimeout nsec
Set the timeout for SDS protocol reads to be nsec seconds. The default is 2seconds.
show sdstimeout
Show the current value of the SDS timeout.
sds command
Send the specified command string to the SDS monitor.
21.3.8 HP PA Embedded
target op50n dev
OP50N monitor, running on an OKI HPPA board.
target w89k dev
W89K monitor, running on a Winbond HPPA board.
21.3.9 Tsqware Sparclet
gdb enables developers to debug tasks running on Sparclet targets from a Unix host. gdbuses code that runs on both the Unix host and on the Sparclet target. The program gdb isinstalled and executed on the Unix host.
Chapter 21: Configuration-Specific Information 257
remotetimeout args
gdb supports the option remotetimeout. This option is set by the user, andargs represents the number of seconds gdb waits for responses.
When compiling for debugging, include the options ‘-g’ to get debug information and‘-Ttext’ to relocate the program to where you wish to load it on the target. You may alsowant to add the options ‘-n’ or ‘-N’ in order to reduce the size of the sections. Example:
sparclet-aout-gcc prog.c -Ttext 0x12010000 -g -o prog -N
You can use objdump to verify that the addresses are what you intended:
sparclet-aout-objdump --headers --syms prog
Once you have set your Unix execution search path to find gdb, you are ready to run gdb.From your Unix host, run gdb (or sparclet-aout-gdb, depending on your installation).
gdb comes up showing the prompt:
(gdbslet)
21.3.9.1 Setting File to Debug
The gdb command file lets you choose with program to debug.
(gdbslet) file prog
gdb then attempts to read the symbol table of ‘prog’. gdb locates the file by searchingthe directories listed in the command search path. If the file was compiled with debuginformation (option ‘-g’), source files will be searched as well. gdb locates the sourcefiles by searching the directories listed in the directory search path (see Section 4.4 [YourProgram’s Environment], page 29). If it fails to find a file, it displays a message such as:
prog: No such file or directory.
When this happens, add the appropriate directories to the search paths with the gdbcommands path and dir, and execute the target command again.
21.3.9.2 Connecting to Sparclet
The gdb command target lets you connect to a Sparclet target. To connect to a target onserial port “ttya”, type:
(gdbslet) target sparclet /dev/ttya
Remote target sparclet connected to /dev/ttya
main () at ../prog.c:3
gdb displays messages like these:
Connected to ttya.
21.3.9.3 Sparclet Download
Once connected to the Sparclet target, you can use the gdb load command to download thefile from the host to the target. The file name and load offset should be given as argumentsto the load command. Since the file format is aout, the program must be loaded to thestarting address. You can use objdump to find out what this value is. The load offset is anoffset which is added to the VMA (virtual memory address) of each of the file’s sections.For instance, if the program ‘prog’ was linked to text address 0x1201000, with data at0x12010160 and bss at 0x12010170, in gdb, type:
258 Debugging with gdb
(gdbslet) load prog 0x12010000
Loading section .text, size 0xdb0 vma 0x12010000
If the code is loaded at a different address then what the program was linked to, youmay need to use the section and add-symbol-file commands to tell gdb where to mapthe symbol table.
21.3.9.4 Running and Debugging
You can now begin debugging the task using gdb’s execution control commands, b, step,run, etc. See the gdb manual for the list of commands.
(gdbslet) b main
Breakpoint 1 at 0x12010000: file prog.c, line 3.
(gdbslet) run
Starting program: prog
Breakpoint 1, main (argc=1, argv=0xeffff21c) at prog.c:3
3 char *symarg = 0;
(gdbslet) step
4 char *execarg = "hello!";
(gdbslet)
21.3.10 Fujitsu Sparclite
target sparclite dev
Fujitsu sparclite boards, used only for the purpose of loading. You must use anadditional command to debug the program. For example: target remote devusing gdb standard remote protocol.
21.3.11 Zilog Z8000
When configured for debugging Zilog Z8000 targets, gdb includes a Z8000 simulator.
For the Z8000 family, ‘target sim’ simulates either the Z8002 (the unsegmented variantof the Z8000 architecture) or the Z8001 (the segmented variant). The simulator recognizeswhich architecture is appropriate by inspecting the object code.
target sim args
Debug programs on a simulated CPU. If the simulator supports setup options,specify them via args.
After specifying this target, you can debug programs for the simulated CPU in the samestyle as programs for your host computer; use the file command to load a new programimage, the run command to run your program, and so on.
As well as making available all the usual machine registers (see Section 10.12 [Registers],page 119), the Z8000 simulator provides three additional items of information as speciallynamed registers:
cycles Counts clock-ticks in the simulator.
insts Counts instructions run in the simulator.
time Execution time in 60ths of a second.
You can refer to these values in gdb expressions with the usual conventions; for example,‘b fputc if $cycles>5000’ sets a conditional breakpoint that suspends only after at least5000 simulated clock ticks.
Chapter 21: Configuration-Specific Information 259
21.3.12 Atmel AVR
When configured for debugging the Atmel AVR, gdb supports the following AVR-specificcommands:
info io_registers
This command displays information about the AVR I/O registers. For eachregister, gdb prints its number and value.
21.3.13 CRIS
When configured for debugging CRIS, gdb provides the following CRIS-specific commands:
set cris-version ver
Set the current CRIS version to ver, either ‘10’ or ‘32’. The CRIS version affectsregister names and sizes. This command is useful in case autodetection of theCRIS version fails.
show cris-version
Show the current CRIS version.
set cris-dwarf2-cfi
Set the usage of DWARF-2 CFI for CRIS debugging. The default is ‘on’.Change to ‘off’ when using gcc-cris whose version is below R59.
show cris-dwarf2-cfi
Show the current state of using DWARF-2 CFI.
set cris-mode mode
Set the current CRIS mode tomode. It should only be changed when debuggingin guru mode, in which case it should be set to ‘guru’ (the default is ‘normal’).
show cris-mode
Show the current CRIS mode.
21.3.14 Renesas Super-H
For the Renesas Super-H processor, gdb provides these commands:
regs Show the values of all Super-H registers.
set sh calling-convention convention
Set the calling-convention used when calling functions from gdb. Allowed val-ues are ‘gcc’, which is the default setting, and ‘renesas’. With the ‘gcc’ setting,functions are called using the gcc calling convention. If the DWARF-2 infor-mation of the called function specifies that the function follows the Renesascalling convention, the function is called using the Renesas calling convention.If the calling convention is set to ‘renesas’, the Renesas calling convention isalways used, regardless of the DWARF-2 information. This can be used tooverride the default of ‘gcc’ if debug information is missing, or the compilerdoes not emit the DWARF-2 calling convention entry for a function.
show sh calling-convention
Show the current calling convention setting.
260 Debugging with gdb
21.4 Architectures
This section describes characteristics of architectures that affect all uses of gdb with thearchitecture, both native and cross.
21.4.1 x86 Architecture-specific Issues
set struct-convention mode
Set the convention used by the inferior to return structs and unions fromfunctions to mode. Possible values of mode are "pcc", "reg", and "default"
(the default). "default" or "pcc" means that structs are returned on thestack, while "reg" means that a struct or a union whose size is 1, 2, 4, or 8bytes will be returned in a register.
show struct-convention
Show the current setting of the convention to return structs from functions.
21.4.2 A29K
set rstack_high_address address
On AMD 29000 family processors, registers are saved in a separate registerstack. There is no way for gdb to determine the extent of this stack. Normally,gdb just assumes that the stack is “large enough”. This may result in gdbreferencing memory locations that do not exist. If necessary, you can get aroundthis problem by specifying the ending address of the register stack with the setrstack_high_address command. The argument should be an address, whichyou probably want to precede with ‘0x’ to specify in hexadecimal.
show rstack_high_address
Display the current limit of the register stack, on AMD 29000 family processors.
21.4.3 Alpha
See the following section.
21.4.4 MIPS
Alpha- and MIPS-based computers use an unusual stack frame, which sometimes requiresgdb to search backward in the object code to find the beginning of a function.
To improve response time (especially for embedded applications, where gdb may berestricted to a slow serial line for this search) you may want to limit the size of this search,using one of these commands:
set heuristic-fence-post limit
Restrict gdb to examining at most limit bytes in its search for the beginningof a function. A value of 0 (the default) means there is no limit. However,except for 0, the larger the limit the more bytes heuristic-fence-post mustsearch and therefore the longer it takes to run. You should only need to usethis command when debugging a stripped executable.
show heuristic-fence-post
Display the current limit.
Chapter 21: Configuration-Specific Information 261
These commands are available only when gdb is configured for debugging programs onAlpha or MIPS processors.
Several MIPS-specific commands are available when debugging MIPS programs:
set mips abi arg
Tell gdb which MIPS ABI is used by the inferior. Possible values of arg are:
‘auto’ The default ABI associated with the current binary (this is thedefault).
‘o32’
‘o64’
‘n32’
‘n64’
‘eabi32’
‘eabi64’
show mips abi
Show the MIPS ABI used by gdb to debug the inferior.
set mipsfpu
show mipsfpu
See Section 21.3.5 [MIPS Embedded], page 251.
set mips mask-address arg
This command determines whether the most-significant 32 bits of 64-bit MIPSaddresses are masked off. The argument arg can be ‘on’, ‘off’, or ‘auto’. Thelatter is the default setting, which lets gdb determine the correct value.
show mips mask-address
Show whether the upper 32 bits of MIPS addresses are masked off or not.
set remote-mips64-transfers-32bit-regs
This command controls compatibility with 64-bit MIPS targets that transferdata in 32-bit quantities. If you have an old MIPS 64 target that transfers 32bits for some registers, like sr and fsr, and 64 bits for other registers, set thisoption to ‘on’.
show remote-mips64-transfers-32bit-regs
Show the current setting of compatibility with older MIPS 64 targets.
set debug mips
This command turns on and off debugging messages for the MIPS-specific targetcode in gdb.
show debug mips
Show the current setting of MIPS debugging messages.
262 Debugging with gdb
21.4.5 HPPA
When gdb is debugging the HP PA architecture, it provides the following special commands:
set debug hppa
This command determines whether HPPA architecture-specific debugging mes-sages are to be displayed.
show debug hppa
Show whether HPPA debugging messages are displayed.
maint print unwind address
This command displays the contents of the unwind table entry at the givenaddress.
21.4.6 Cell Broadband Engine SPU architecture
When gdb is debugging the Cell Broadband Engine SPU architecture, it provides thefollowing special commands:
info spu event
Display SPU event facility status. Shows current event mask and pending eventstatus.
info spu signal
Display SPU signal notification facility status. Shows pending signal-controlword and signal notification mode of both signal notification channels.
info spu mailbox
Display SPU mailbox facility status. Shows all pending entries, in order of pro-cessing, in each of the SPU Write Outbound, SPU Write Outbound Interrupt,and SPU Read Inbound mailboxes.
info spu dma
Display MFC DMA status. Shows all pending commands in the MFC DMAqueue. For each entry, opcode, tag, class IDs, effective and local store addressesand transfer size are shown.
info spu proxydma
Display MFC Proxy-DMA status. Shows all pending commands in the MFCProxy-DMA queue. For each entry, opcode, tag, class IDs, effective and localstore addresses and transfer size are shown.
When gdb is debugging a combined PowerPC/SPU application on the Cell BroadbandEngine, it provides in addition the following special commands:
set spu stop-on-load arg
Set whether to stop for new SPE threads. When set to on, gdb will give controlto the user when a new SPE thread enters its main function. The default isoff.
show spu stop-on-load
Show whether to stop for new SPE threads.
Chapter 21: Configuration-Specific Information 263
set spu auto-flush-cache arg
Set whether to automatically flush the software-managed cache. When set to on,gdb will automatically cause the SPE software-managed cache to be flushedwhenever SPE execution stops. This provides a consistent view of PowerPCmemory that is accessed via the cache. If an application does not use thesoftware-managed cache, this option has no effect.
show spu auto-flush-cache
Show whether to automatically flush the software-managed cache.
21.4.7 PowerPC
When gdb is debugging the PowerPC architecture, it provides a set of pseudo-registers toenable inspection of 128-bit wide Decimal Floating Point numbers stored in the floatingpoint registers. These values must be stored in two consecutive registers, always startingat an even register like f0 or f2.
The pseudo-registers go from $dl0 through $dl15, and are formed by joining theeven/odd register pairs f0 and f1 for $dl0, f2 and f3 for $dl1 and so on.
For POWER7 processors, gdb provides a set of pseudo-registers, the 64-bit wide Ex-tended Floating Point Registers (‘f32’ through ‘f63’).

Chapter 22: Controlling gdb 265
22 Controlling gdb
You can alter the way gdb interacts with you by using the set command. For commandscontrolling how gdb displays data, see Section 10.8 [Print Settings], page 106. Other settingsare described here.
22.1 Prompt
gdb indicates its readiness to read a command by printing a string called the prompt.This string is normally ‘(gdb)’. You can change the prompt string with the set prompt
command. For instance, when debugging gdb with gdb, it is useful to change the promptin one of the gdb sessions so that you can always tell which one you are talking to.
Note: set prompt does not add a space for you after the prompt you set. This allowsyou to set a prompt which ends in a space or a prompt that does not.
set prompt newprompt
Directs gdb to use newprompt as its prompt string henceforth.
show prompt
Prints a line of the form: ‘Gdb’s prompt is: your-prompt ’
Versions of gdb that ship with Python scripting enabled have prompt extensions. Thecommands for interacting with these extensions are:
set extended-prompt prompt
Set an extended prompt that allows for substitutions. See Section 23.2.4.3[gdb.prompt], page 325, for a list of escape sequences that can be used forsubstitution. Any escape sequences specified as part of the prompt string arereplaced with the corresponding strings each time the prompt is displayed.
For example:set extended-prompt Current working directory: \w (gdb)
Note that when an extended-prompt is set, it takes control of the prompt hookhook. See [prompt hook], page 285, for further information.
show extended-prompt
Prints the extended prompt. Any escape sequences specified as part of theprompt string with set extended-prompt, are replaced with the correspondingstrings each time the prompt is displayed.
22.2 Command Editing
gdb reads its input commands via the Readline interface. This gnu library provides consis-tent behavior for programs which provide a command line interface to the user. Advantagesare gnu Emacs-style or vi-style inline editing of commands, csh-like history substitution,and a storage and recall of command history across debugging sessions.
You may control the behavior of command line editing in gdb with the command set.
set editing
set editing on
Enable command line editing (enabled by default).
266 Debugging with gdb
set editing off
Disable command line editing.
show editing
Show whether command line editing is enabled.
See Chapter 31 [Command Line Editing], page 423, for more details about the Readlineinterface. Users unfamiliar with gnu Emacs or vi are encouraged to read that chapter.
22.3 Command History
gdb can keep track of the commands you type during your debugging sessions, so thatyou can be certain of precisely what happened. Use these commands to manage the gdbcommand history facility.
gdb uses the gnu History library, a part of the Readline package, to provide the historyfacility. See Chapter 32 [Using History Interactively], page 445, for the detailed descriptionof the History library.
To issue a command to gdb without affecting certain aspects of the state which is seenby users, prefix it with ‘server ’ (see Section 28.2 [Server Prefix], page 412). This meansthat this command will not affect the command history, nor will it affect gdb’s notion ofwhich command to repeat if RET is pressed on a line by itself.
The server prefix does not affect the recording of values into the value history; to printa value without recording it into the value history, use the output command instead of theprint command.
Here is the description of gdb commands related to command history.
set history filename fname
Set the name of the gdb command history file to fname. This is the file wheregdb reads an initial command history list, and where it writes the commandhistory from this session when it exits. You can access this list through historyexpansion or through the history command editing characters listed below.This file defaults to the value of the environment variable GDBHISTFILE, or to‘./.gdb_history’ (‘./_gdb_history’ on MS-DOS) if this variable is not set.
set history save
set history save on
Record command history in a file, whose name may be specified with the set
history filename command. By default, this option is disabled.
set history save off
Stop recording command history in a file.
set history size size
Set the number of commands which gdb keeps in its history list. This defaultsto the value of the environment variable HISTSIZE, or to 256 if this variable isnot set.
History expansion assigns special meaning to the character !. See Section 32.1.1 [EventDesignators], page 445, for more details.
Since ! is also the logical not operator in C, history expansion is off by default. If youdecide to enable history expansion with the set history expansion on command, you may
Chapter 22: Controlling gdb 267
sometimes need to follow ! (when it is used as logical not, in an expression) with a spaceor a tab to prevent it from being expanded. The readline history facilities do not attemptsubstitution on the strings != and !(, even when history expansion is enabled.
The commands to control history expansion are:
set history expansion on
set history expansion
Enable history expansion. History expansion is off by default.
set history expansion off
Disable history expansion.
show history
show history filename
show history save
show history size
show history expansion
These commands display the state of the gdb history parameters. show
history by itself displays all four states.
show commands
Display the last ten commands in the command history.
show commands n
Print ten commands centered on command number n.
show commands +
Print ten commands just after the commands last printed.
22.4 Screen Size
Certain commands to gdb may produce large amounts of information output to the screen.To help you read all of it, gdb pauses and asks you for input at the end of each page ofoutput. Type RET when you want to continue the output, or q to discard the remainingoutput. Also, the screen width setting determines when to wrap lines of output. Dependingon what is being printed, gdb tries to break the line at a readable place, rather than simplyletting it overflow onto the following line.
Normally gdb knows the size of the screen from the terminal driver software. Forexample, on Unix gdb uses the termcap data base together with the value of the TERM
environment variable and the stty rows and stty cols settings. If this is not correct, youcan override it with the set height and set width commands:
set height lpp
show height
set width cpl
show width
These set commands specify a screen height of lpp lines and a screen width ofcpl characters. The associated show commands display the current settings.
If you specify a height of zero lines, gdb does not pause during output no matterhow long the output is. This is useful if output is to a file or to an editor buffer.
268 Debugging with gdb
Likewise, you can specify ‘set width 0’ to prevent gdb from wrapping its out-put.
set pagination on
set pagination off
Turn the output pagination on or off; the default is on. Turning pagination offis the alternative to set height 0. Note that running gdb with the ‘--batch’option (see Section 2.1.2 [Mode Options], page 13) also automatically disablespagination.
show pagination
Show the current pagination mode.
22.5 Numbers
You can always enter numbers in octal, decimal, or hexadecimal in gdb by the usualconventions: octal numbers begin with ‘0’, decimal numbers end with ‘.’, and hexadecimalnumbers begin with ‘0x’. Numbers that neither begin with ‘0’ or ‘0x’, nor end with a ‘.’are, by default, entered in base 10; likewise, the default display for numbers—when noparticular format is specified—is base 10. You can change the default base for both inputand output with the commands described below.
set input-radix base
Set the default base for numeric input. Supported choices for base are decimal8, 10, or 16. base must itself be specified either unambiguously or using thecurrent input radix; for example, any of
set input-radix 012
set input-radix 10.
set input-radix 0xa
sets the input base to decimal. On the other hand, ‘set input-radix 10’ leavesthe input radix unchanged, no matter what it was, since ‘10’, being without anyleading or trailing signs of its base, is interpreted in the current radix. Thus,if the current radix is 16, ‘10’ is interpreted in hex, i.e. as 16 decimal, whichdoesn’t change the radix.
set output-radix base
Set the default base for numeric display. Supported choices for base are decimal8, 10, or 16. base must itself be specified either unambiguously or using thecurrent input radix.
show input-radix
Display the current default base for numeric input.
show output-radix
Display the current default base for numeric display.
set radix [base ]show radix
These commands set and show the default base for both input and outputof numbers. set radix sets the radix of input and output to the same base;without an argument, it resets the radix back to its default value of 10.
Chapter 22: Controlling gdb 269
22.6 Configuring the Current ABI
gdb can determine the ABI (Application Binary Interface) of your application automati-cally. However, sometimes you need to override its conclusions. Use these commands tomanage gdb’s view of the current ABI.
One gdb configuration can debug binaries for multiple operating system targets, eithervia remote debugging or native emulation. gdb will autodetect the OS ABI (OperatingSystem ABI) in use, but you can override its conclusion using the set osabi command. Oneexample where this is useful is in debugging of binaries which use an alternate C library (e.g.uClibc for gnu/Linux) which does not have the same identifying marks that the standardC library for your platform provides.
show osabi
Show the OS ABI currently in use.
set osabi With no argument, show the list of registered available OS ABI’s.
set osabi abi
Set the current OS ABI to abi.
Generally, the way that an argument of type float is passed to a function depends onwhether the function is prototyped. For a prototyped (i.e. ANSI/ISO style) function, floatarguments are passed unchanged, according to the architecture’s convention for float. Forunprototyped (i.e. K&R style) functions, float arguments are first promoted to type doubleand then passed.
Unfortunately, some forms of debug information do not reliably indicate whether a func-tion is prototyped. If gdb calls a function that is not marked as prototyped, it consultsset coerce-float-to-double.
set coerce-float-to-double
set coerce-float-to-double on
Arguments of type float will be promoted to double when passed to an un-prototyped function. This is the default setting.
set coerce-float-to-double off
Arguments of type float will be passed directly to unprototyped functions.
show coerce-float-to-double
Show the current setting of promoting float to double.
gdb needs to know the ABI used for your program’s C++ objects. The correct C++ ABIdepends on which C++ compiler was used to build your application. gdb only fully supportsprograms with a single C++ ABI; if your program contains code using multiple C++ ABI’sor if gdb can not identify your program’s ABI correctly, you can tell gdb which ABI to use.Currently supported ABI’s include “gnu-v2”, for g++ versions before 3.0, “gnu-v3”, for g++versions 3.0 and later, and “hpaCC” for the HP ANSI C++ compiler. Other C++ compilersmay use the “gnu-v2” or “gnu-v3” ABI’s as well. The default setting is “auto”.
show cp-abi
Show the C++ ABI currently in use.
set cp-abi
With no argument, show the list of supported C++ ABI’s.
270 Debugging with gdb
set cp-abi abi
set cp-abi auto
Set the current C++ ABI to abi, or return to automatic detection.
22.7 Optional Warnings and Messages
By default, gdb is silent about its inner workings. If you are running on a slow machine,you may want to use the set verbose command. This makes gdb tell you when it does alengthy internal operation, so you will not think it has crashed.
Currently, the messages controlled by set verbose are those which announce that thesymbol table for a source file is being read; see symbol-file in Section 18.1 [Commands toSpecify Files], page 201.
set verbose on
Enables gdb output of certain informational messages.
set verbose off
Disables gdb output of certain informational messages.
show verbose
Displays whether set verbose is on or off.
By default, if gdb encounters bugs in the symbol table of an object file, it is silent; but ifyou are debugging a compiler, you may find this information useful (see Section 18.4 [ErrorsReading Symbol Files], page 213).
set complaints limit
Permits gdb to output limit complaints about each type of unusual symbolsbefore becoming silent about the problem. Set limit to zero to suppress all com-plaints; set it to a large number to prevent complaints from being suppressed.
show complaints
Displays how many symbol complaints gdb is permitted to produce.
By default, gdb is cautious, and asks what sometimes seems to be a lot of stupidquestions to confirm certain commands. For example, if you try to run a program which isalready running:
(gdb) run
The program being debugged has been started already.
Start it from the beginning? (y or n)
If you are willing to unflinchingly face the consequences of your own commands, you candisable this “feature”:
set confirm off
Disables confirmation requests. Note that running gdb with the ‘--batch’option (see Section 2.1.2 [Mode Options], page 13) also automatically disablesconfirmation requests.
set confirm on
Enables confirmation requests (the default).
show confirm
Displays state of confirmation requests.
Chapter 22: Controlling gdb 271
If you need to debug user-defined commands or sourced files you may find it useful toenable command tracing. In this mode each command will be printed as it is executed, pre-fixed with one or more ‘+’ symbols, the quantity denoting the call depth of each command.
set trace-commands on
Enable command tracing.
set trace-commands off
Disable command tracing.
show trace-commands
Display the current state of command tracing.
22.8 Optional Messages about Internal Happenings
gdb has commands that enable optional debugging messages from various gdb subsystems;normally these commands are of interest to gdb maintainers, or when reporting a bug. Thissection documents those commands.
set exec-done-display
Turns on or off the notification of asynchronous commands’ completion. Whenon, gdb will print a message when an asynchronous command finishes its exe-cution. The default is off.
show exec-done-display
Displays the current setting of asynchronous command completion notification.
set debug arch
Turns on or off display of gdbarch debugging info. The default is off
show debug arch
Displays the current state of displaying gdbarch debugging info.
set debug aix-thread
Display debugging messages about inner workings of the AIX thread module.
show debug aix-thread
Show the current state of AIX thread debugging info display.
set debug check-physname
Check the results of the “physname” computation. When reading DWARFdebugging information for C++, gdb attempts to compute each entity’s name.gdb can do this computation in two different ways, depending on exactly whatinformation is present. When enabled, this setting causes gdb to compute thenames both ways and display any discrepancies.
show debug check-physname
Show the current state of “physname” checking.
set debug dwarf2-die
Dump DWARF2 DIEs after they are read in. The value is the number of nestinglevels to print. A value of zero turns off the display.
272 Debugging with gdb
show debug dwarf2-die
Show the current state of DWARF2 DIE debugging.
set debug displaced
Turns on or off display of gdb debugging info for the displaced stepping support.The default is off.
show debug displaced
Displays the current state of displaying gdb debugging info related to displacedstepping.
set debug event
Turns on or off display of gdb event debugging info. The default is off.
show debug event
Displays the current state of displaying gdb event debugging info.
set debug expression
Turns on or off display of debugging info about gdb expression parsing. Thedefault is off.
show debug expression
Displays the current state of displaying debugging info about gdb expressionparsing.
set debug frame
Turns on or off display of gdb frame debugging info. The default is off.
show debug frame
Displays the current state of displaying gdb frame debugging info.
set debug gnu-nat
Turns on or off debugging messages from the gnu/Hurd debug support.
show debug gnu-nat
Show the current state of gnu/Hurd debugging messages.
set debug infrun
Turns on or off display of gdb debugging info for running the inferior. Thedefault is off. ‘infrun.c’ contains GDB’s runtime state machine used for im-plementing operations such as single-stepping the inferior.
show debug infrun
Displays the current state of gdb inferior debugging.
set debug jit
Turns on or off debugging messages from JIT debug support.
show debug jit
Displays the current state of gdb JIT debugging.
set debug lin-lwp
Turns on or off debugging messages from the Linux LWP debug support.
show debug lin-lwp
Show the current state of Linux LWP debugging messages.
Chapter 22: Controlling gdb 273
set debug observer
Turns on or off display of gdb observer debugging. This includes info such asthe notification of observable events.
show debug observer
Displays the current state of observer debugging.
set debug overload
Turns on or off display of gdb C++ overload debugging info. This includes infosuch as ranking of functions, etc. The default is off.
show debug overload
Displays the current state of displaying gdb C++ overload debugging info.
set debug parser
Turns on or off the display of expression parser debugging output. Internally,this sets the yydebug variable in the expression parser. See Section “TracingYour Parser” in Bison, for details. The default is off.
show debug parser
Show the current state of expression parser debugging.
set debug remote
Turns on or off display of reports on all packets sent back and forth across theserial line to the remote machine. The info is printed on the gdb standardoutput stream. The default is off.
show debug remote
Displays the state of display of remote packets.
set debug serial
Turns on or off display of gdb serial debugging info. The default is off.
show debug serial
Displays the current state of displaying gdb serial debugging info.
set debug solib-frv
Turns on or off debugging messages for FR-V shared-library code.
show debug solib-frv
Display the current state of FR-V shared-library code debugging messages.
set debug target
Turns on or off display of gdb target debugging info. This info includes whatis going on at the target level of GDB, as it happens. The default is 0. Set itto 1 to track events, and to 2 to also track the value of large memory transfers.Changes to this flag do not take effect until the next time you connect to atarget or use the run command.
show debug target
Displays the current state of displaying gdb target debugging info.
set debug timestamp
Turns on or off display of timestamps with gdb debugging info. When enabled,seconds and microseconds are displayed before each debugging message.
274 Debugging with gdb
show debug timestamp
Displays the current state of displaying timestamps with gdb debugging info.
set debugvarobj
Turns on or off display of gdb variable object debugging info. The default isoff.
show debugvarobj
Displays the current state of displaying gdb variable object debugging info.
set debug xml
Turns on or off debugging messages for built-in XML parsers.
show debug xml
Displays the current state of XML debugging messages.
22.9 Other Miscellaneous Settings
set interactive-mode
If on, forces gdb to assume that GDB was started in a terminal. In practice,this means that gdb should wait for the user to answer queries generated bycommands entered at the command prompt. If off, forces gdb to operate inthe opposite mode, and it uses the default answers to all queries. If auto (thedefault), gdb tries to determine whether its standard input is a terminal, andworks in interactive-mode if it is, non-interactively otherwise.
In the vast majority of cases, the debugger should be able to guess correctlywhich mode should be used. But this setting can be useful in certain specificcases, such as running a MinGW gdb inside a cygwin window.
show interactive-mode
Displays whether the debugger is operating in interactive mode or not.
Chapter 23: Extending gdb 275
23 Extending gdb
gdb provides three mechanisms for extension. The first is based on composition of gdbcommands, the second is based on the Python scripting language, and the third is fordefining new aliases of existing commands.
To facilitate the use of the first two extensions, gdb is capable of evaluating the contentsof a file. When doing so, gdb can recognize which scripting language is being used bylooking at the filename extension. Files with an unrecognized filename extension are alwaystreated as a gdb Command Files. See Section 23.1.3 [Command files], page 278.
You can control how gdb evaluates these files with the following setting:
set script-extension off
All scripts are always evaluated as gdb Command Files.
set script-extension soft
The debugger determines the scripting language based on filename extension.If this scripting language is supported, gdb evaluates the script using thatlanguage. Otherwise, it evaluates the file as a gdb Command File.
set script-extension strict
The debugger determines the scripting language based on filename extension,and evaluates the script using that language. If the language is not supported,then the evaluation fails.
show script-extension
Display the current value of the script-extension option.
23.1 Canned Sequences of Commands
Aside from breakpoint commands (see Section 5.1.7 [Breakpoint Command Lists], page 59),gdb provides two ways to store sequences of commands for execution as a unit: user-definedcommands and command files.
23.1.1 User-defined Commands
A user-defined command is a sequence of gdb commands to which you assign a new nameas a command. This is done with the define command. User commands may accept up to10 arguments separated by whitespace. Arguments are accessed within the user commandvia $arg0...$arg9. A trivial example:
define adder
print $arg0 + $arg1 + $arg2
end
To execute the command use:
adder 1 2 3
This defines the command adder, which prints the sum of its three arguments. Note thearguments are text substitutions, so they may reference variables, use complex expressions,or even perform inferior functions calls.
In addition, $argc may be used to find out how many arguments have been passed. Thisexpands to a number in the range 0. . . 10.
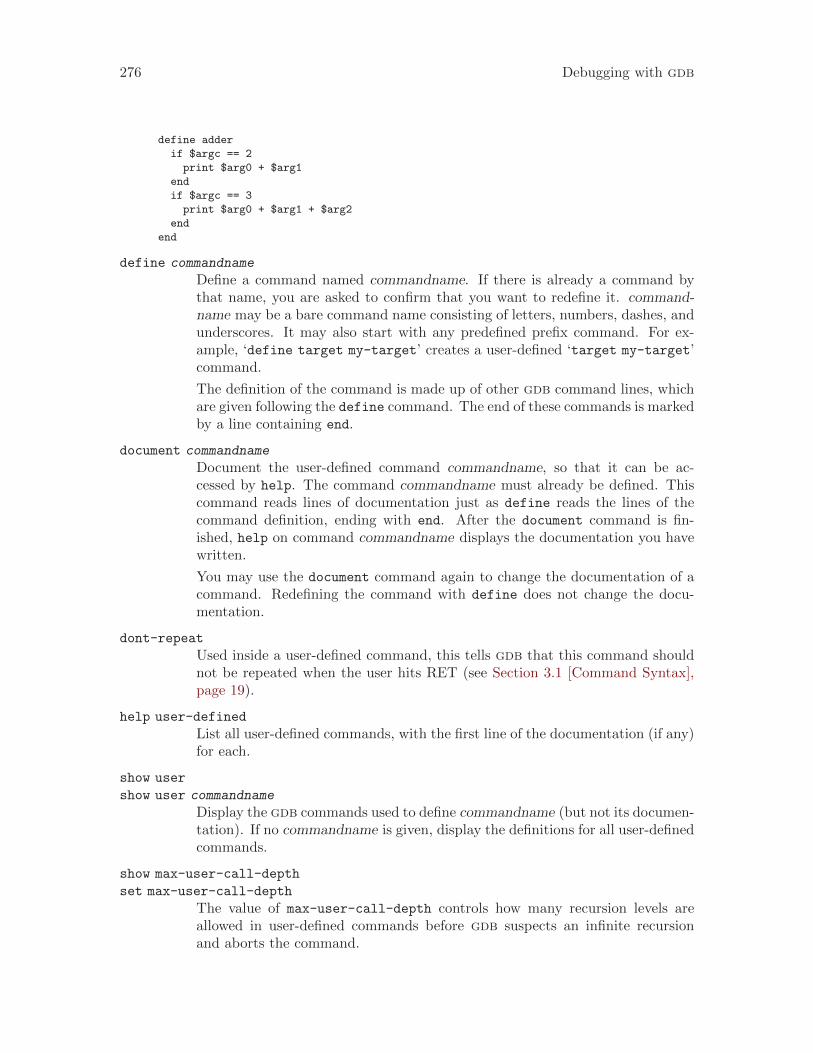
276 Debugging with gdb
define adder
if $argc == 2
print $arg0 + $arg1
end
if $argc == 3
print $arg0 + $arg1 + $arg2
end
end
define commandname
Define a command named commandname. If there is already a command bythat name, you are asked to confirm that you want to redefine it. command-name may be a bare command name consisting of letters, numbers, dashes, andunderscores. It may also start with any predefined prefix command. For ex-ample, ‘define target my-target’ creates a user-defined ‘target my-target’command.
The definition of the command is made up of other gdb command lines, whichare given following the define command. The end of these commands is markedby a line containing end.
document commandname
Document the user-defined command commandname, so that it can be ac-cessed by help. The command commandname must already be defined. Thiscommand reads lines of documentation just as define reads the lines of thecommand definition, ending with end. After the document command is fin-ished, help on command commandname displays the documentation you havewritten.
You may use the document command again to change the documentation of acommand. Redefining the command with define does not change the docu-mentation.
dont-repeat
Used inside a user-defined command, this tells gdb that this command shouldnot be repeated when the user hits RET (see Section 3.1 [Command Syntax],page 19).
help user-defined
List all user-defined commands, with the first line of the documentation (if any)for each.
show user
show user commandname
Display the gdb commands used to define commandname (but not its documen-tation). If no commandname is given, display the definitions for all user-definedcommands.
show max-user-call-depth
set max-user-call-depth
The value of max-user-call-depth controls how many recursion levels areallowed in user-defined commands before gdb suspects an infinite recursionand aborts the command.
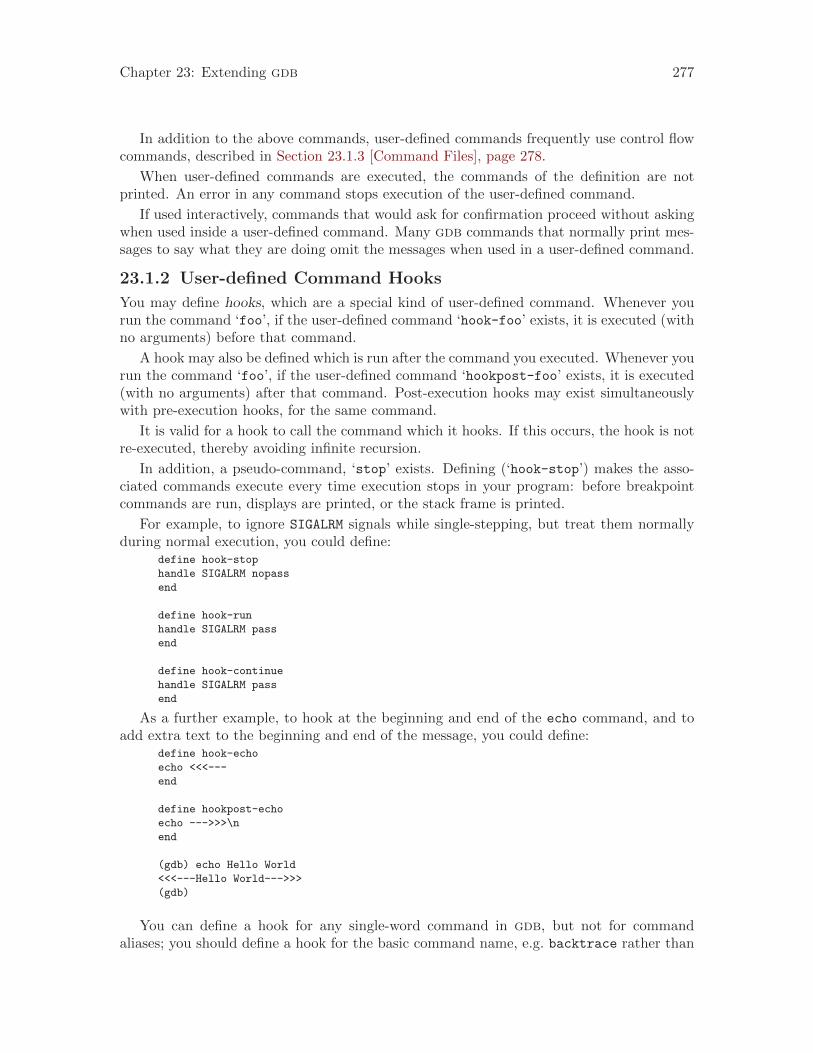
Chapter 23: Extending gdb 277
In addition to the above commands, user-defined commands frequently use control flowcommands, described in Section 23.1.3 [Command Files], page 278.
When user-defined commands are executed, the commands of the definition are notprinted. An error in any command stops execution of the user-defined command.
If used interactively, commands that would ask for confirmation proceed without askingwhen used inside a user-defined command. Many gdb commands that normally print mes-sages to say what they are doing omit the messages when used in a user-defined command.
23.1.2 User-defined Command Hooks
You may define hooks, which are a special kind of user-defined command. Whenever yourun the command ‘foo’, if the user-defined command ‘hook-foo’ exists, it is executed (withno arguments) before that command.
A hook may also be defined which is run after the command you executed. Whenever yourun the command ‘foo’, if the user-defined command ‘hookpost-foo’ exists, it is executed(with no arguments) after that command. Post-execution hooks may exist simultaneouslywith pre-execution hooks, for the same command.
It is valid for a hook to call the command which it hooks. If this occurs, the hook is notre-executed, thereby avoiding infinite recursion.
In addition, a pseudo-command, ‘stop’ exists. Defining (‘hook-stop’) makes the asso-ciated commands execute every time execution stops in your program: before breakpointcommands are run, displays are printed, or the stack frame is printed.
For example, to ignore SIGALRM signals while single-stepping, but treat them normallyduring normal execution, you could define:
define hook-stop
handle SIGALRM nopass
end
define hook-run
handle SIGALRM pass
end
define hook-continue
handle SIGALRM pass
end
As a further example, to hook at the beginning and end of the echo command, and toadd extra text to the beginning and end of the message, you could define:
define hook-echo
echo <<<---
end
define hookpost-echo
echo --->>>\n
end
(gdb) echo Hello World
<<<---Hello World--->>>
(gdb)
You can define a hook for any single-word command in gdb, but not for commandaliases; you should define a hook for the basic command name, e.g. backtrace rather than
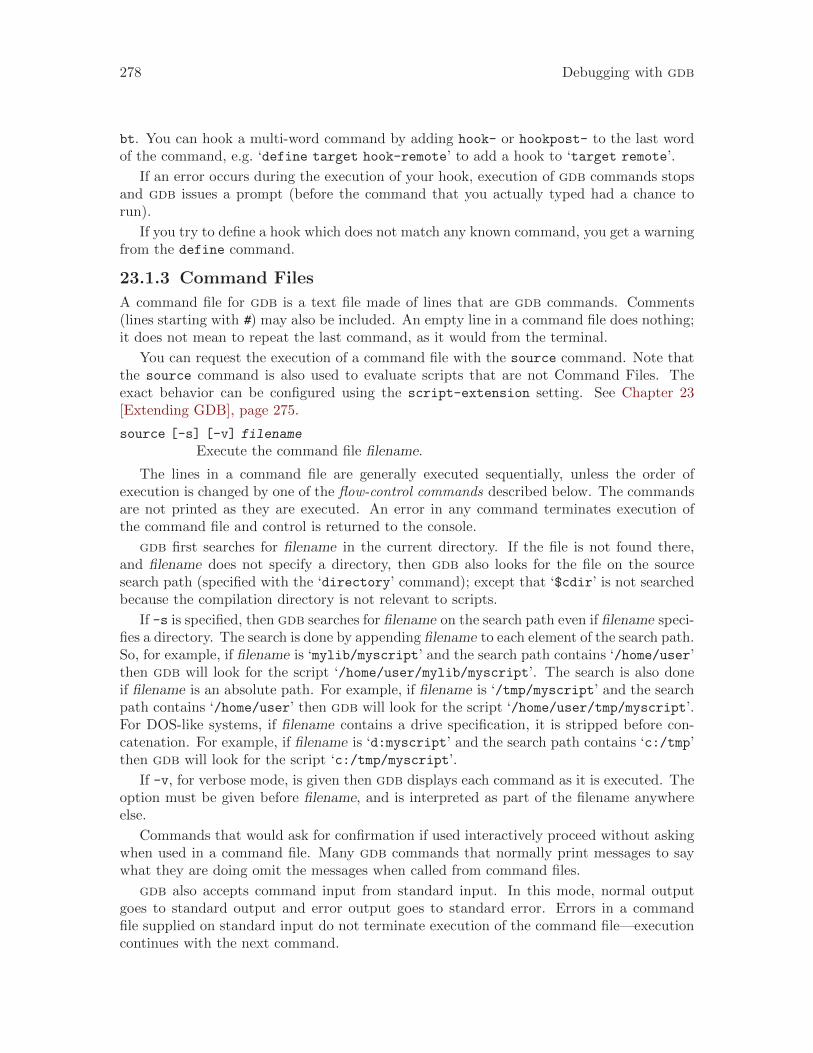
278 Debugging with gdb
bt. You can hook a multi-word command by adding hook- or hookpost- to the last wordof the command, e.g. ‘define target hook-remote’ to add a hook to ‘target remote’.
If an error occurs during the execution of your hook, execution of gdb commands stopsand gdb issues a prompt (before the command that you actually typed had a chance torun).
If you try to define a hook which does not match any known command, you get a warningfrom the define command.
23.1.3 Command Files
A command file for gdb is a text file made of lines that are gdb commands. Comments(lines starting with #) may also be included. An empty line in a command file does nothing;it does not mean to repeat the last command, as it would from the terminal.
You can request the execution of a command file with the source command. Note thatthe source command is also used to evaluate scripts that are not Command Files. Theexact behavior can be configured using the script-extension setting. See Chapter 23[Extending GDB], page 275.
source [-s] [-v] filename
Execute the command file filename.
The lines in a command file are generally executed sequentially, unless the order ofexecution is changed by one of the flow-control commands described below. The commandsare not printed as they are executed. An error in any command terminates execution ofthe command file and control is returned to the console.
gdb first searches for filename in the current directory. If the file is not found there,and filename does not specify a directory, then gdb also looks for the file on the sourcesearch path (specified with the ‘directory’ command); except that ‘$cdir’ is not searchedbecause the compilation directory is not relevant to scripts.
If -s is specified, then gdb searches for filename on the search path even if filename speci-fies a directory. The search is done by appending filename to each element of the search path.So, for example, if filename is ‘mylib/myscript’ and the search path contains ‘/home/user’then gdb will look for the script ‘/home/user/mylib/myscript’. The search is also doneif filename is an absolute path. For example, if filename is ‘/tmp/myscript’ and the searchpath contains ‘/home/user’ then gdb will look for the script ‘/home/user/tmp/myscript’.For DOS-like systems, if filename contains a drive specification, it is stripped before con-catenation. For example, if filename is ‘d:myscript’ and the search path contains ‘c:/tmp’then gdb will look for the script ‘c:/tmp/myscript’.
If -v, for verbose mode, is given then gdb displays each command as it is executed. Theoption must be given before filename, and is interpreted as part of the filename anywhereelse.
Commands that would ask for confirmation if used interactively proceed without askingwhen used in a command file. Many gdb commands that normally print messages to saywhat they are doing omit the messages when called from command files.
gdb also accepts command input from standard input. In this mode, normal outputgoes to standard output and error output goes to standard error. Errors in a commandfile supplied on standard input do not terminate execution of the command file—executioncontinues with the next command.
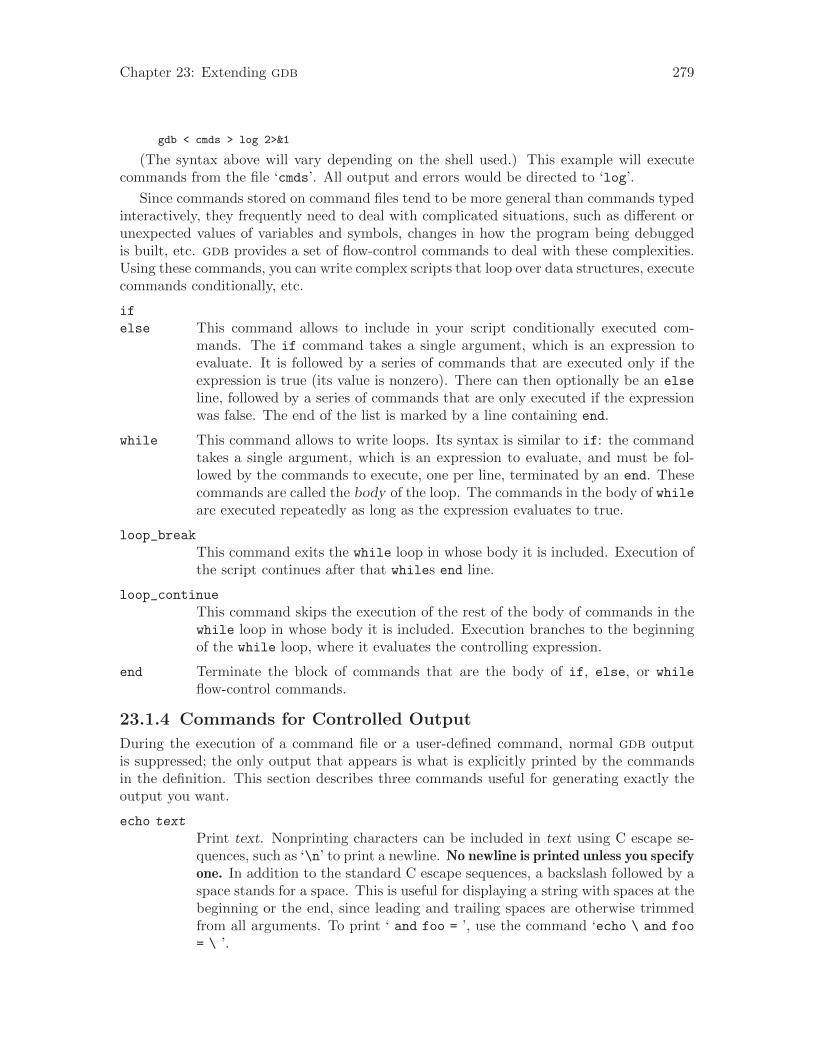
Chapter 23: Extending gdb 279
gdb < cmds > log 2>&1
(The syntax above will vary depending on the shell used.) This example will executecommands from the file ‘cmds’. All output and errors would be directed to ‘log’.
Since commands stored on command files tend to be more general than commands typedinteractively, they frequently need to deal with complicated situations, such as different orunexpected values of variables and symbols, changes in how the program being debuggedis built, etc. gdb provides a set of flow-control commands to deal with these complexities.Using these commands, you can write complex scripts that loop over data structures, executecommands conditionally, etc.
if
else This command allows to include in your script conditionally executed com-mands. The if command takes a single argument, which is an expression toevaluate. It is followed by a series of commands that are executed only if theexpression is true (its value is nonzero). There can then optionally be an else
line, followed by a series of commands that are only executed if the expressionwas false. The end of the list is marked by a line containing end.
while This command allows to write loops. Its syntax is similar to if: the commandtakes a single argument, which is an expression to evaluate, and must be fol-lowed by the commands to execute, one per line, terminated by an end. Thesecommands are called the body of the loop. The commands in the body of whileare executed repeatedly as long as the expression evaluates to true.
loop_break
This command exits the while loop in whose body it is included. Execution ofthe script continues after that whiles end line.
loop_continue
This command skips the execution of the rest of the body of commands in thewhile loop in whose body it is included. Execution branches to the beginningof the while loop, where it evaluates the controlling expression.
end Terminate the block of commands that are the body of if, else, or while
flow-control commands.
23.1.4 Commands for Controlled Output
During the execution of a command file or a user-defined command, normal gdb outputis suppressed; the only output that appears is what is explicitly printed by the commandsin the definition. This section describes three commands useful for generating exactly theoutput you want.
echo text
Print text. Nonprinting characters can be included in text using C escape se-quences, such as ‘\n’ to print a newline. No newline is printed unless you specifyone. In addition to the standard C escape sequences, a backslash followed by aspace stands for a space. This is useful for displaying a string with spaces at thebeginning or the end, since leading and trailing spaces are otherwise trimmedfrom all arguments. To print ‘ and foo = ’, use the command ‘echo \ and foo
= \ ’.
280 Debugging with gdb
A backslash at the end of text can be used, as in C, to continue the commandonto subsequent lines. For example,
echo This is some text\n\
which is continued\n\
onto several lines.\n
produces the same output as
echo This is some text\n
echo which is continued\n
echo onto several lines.\n
output expression
Print the value of expression and nothing but that value: no newlines, no ‘$nn= ’. The value is not entered in the value history either. See Section 10.1[Expressions], page 97, for more information on expressions.
output/fmt expression
Print the value of expression in format fmt. You can use the same formats asfor print. See Section 10.5 [Output Formats], page 102, for more information.
printf template, expressions...
Print the values of one or more expressions under the control of the stringtemplate. To print several values, make expressions be a comma-separatedlist of individual expressions, which may be either numbers or pointers. Theirvalues are printed as specified by template, exactly as a C program would doby executing the code below:
printf (template, expressions...);
As in C printf, ordinary characters in template are printed verbatim, whileconversion specification introduced by the ‘%’ character cause subsequent ex-pressions to be evaluated, their values converted and formatted according totype and style information encoded in the conversion specifications, and thenprinted.
For example, you can print two values in hex like this:
printf "foo, bar-foo = 0x%x, 0x%x\n", foo, bar-foo
printf supports all the standard C conversion specifications, including the flagsand modifiers between the ‘%’ character and the conversion letter, with thefollowing exceptions:
• The argument-ordering modifiers, such as ‘2$’, are not supported.
• The modifier ‘*’ is not supported for specifying precision or width.
• The ‘’’ flag (for separation of digits into groups according to LC_NUMERIC’)is not supported.
• The type modifiers ‘hh’, ‘j’, ‘t’, and ‘z’ are not supported.
• The conversion letter ‘n’ (as in ‘%n’) is not supported.
• The conversion letters ‘a’ and ‘A’ are not supported.
Note that the ‘ll’ type modifier is supported only if the underlying C imple-mentation used to build gdb supports the long long int type, and the ‘L’ typemodifier is supported only if long double type is available.
Chapter 23: Extending gdb 281
As in C, printf supports simple backslash-escape sequences, such as \n, ‘\t’,‘\\’, ‘\"’, ‘\a’, and ‘\f’, that consist of backslash followed by a single character.Octal and hexadecimal escape sequences are not supported.
Additionally, printf supports conversion specifications for DFP (DecimalFloating Point) types using the following length modifiers together with afloating point specifier. letters:
• ‘H’ for printing Decimal32 types.
• ‘D’ for printing Decimal64 types.
• ‘DD’ for printing Decimal128 types.
If the underlying C implementation used to build gdb has support for the threelength modifiers for DFP types, other modifiers such as width and precisionwill also be available for gdb to use.
In case there is no such C support, no additional modifiers will be available andthe value will be printed in the standard way.
Here’s an example of printing DFP types using the above conversion letters:printf "D32: %Hf - D64: %Df - D128: %DDf\n",1.2345df,1.2E10dd,1.2E1dl
eval template, expressions...
Convert the values of one or more expressions under the control of the stringtemplate to a command line, and call it.
23.2 Scripting gdb using Python
You can script gdb using the Python programming language. This feature is available onlyif gdb was configured using ‘--with-python’.
Python scripts used by gdb should be installed in ‘data-directory/python’, wheredata-directory is the data directory as determined at gdb startup (see Section 18.5 [DataFiles], page 214). This directory, known as the python directory, is automatically addedto the Python Search Path in order to allow the Python interpreter to locate all scriptsinstalled at this location.
Additionally, gdb commands and convenience functions which are written inPython and are located in the ‘data-directory/python/gdb/command’ or ‘data-directory/python/gdb/function’ directories are automatically imported when gdbstarts.
23.2.1 Python Commands
gdb provides one command for accessing the Python interpreter, and one related setting:
python [code ]The python command can be used to evaluate Python code.
If given an argument, the python command will evaluate the argument as aPython command. For example:
(gdb) python print 23
23
If you do not provide an argument to python, it will act as a multi-line com-mand, like define. In this case, the Python script is made up of subsequent
282 Debugging with gdb
command lines, given after the python command. This command list is termi-nated using a line containing end. For example:
(gdb) python
Type python script
End with a line saying just "end".
>print 23
>end
23
set python print-stack
By default, gdb will print only the message component of a Python exceptionwhen an error occurs in a Python script. This can be controlled using set
python print-stack: if full, then full Python stack printing is enabled; ifnone, then Python stack and message printing is disabled; if message, thedefault, only the message component of the error is printed.
It is also possible to execute a Python script from the gdb interpreter:
source ‘script-name’
The script name must end with ‘.py’ and gdb must be configured to recognizethe script language based on filename extension using the script-extension
setting. See Chapter 23 [Extending GDB], page 275.
python execfile ("script-name")
This method is based on the execfile Python built-in function, and thus isalways available.
23.2.2 Python API
At startup, gdb overrides Python’s sys.stdout and sys.stderr to print using gdb’soutput-paging streams. A Python program which outputs to one of these streams mayhave its output interrupted by the user (see Section 22.4 [Screen Size], page 267). In thissituation, a Python KeyboardInterrupt exception is thrown.
23.2.2.1 Basic Python
gdb introduces a new Python module, named gdb. All methods and classes added by gdbare placed in this module. gdb automatically imports the gdb module for use in all scriptsevaluated by the python command.
[Variable]gdb.PYTHONDIRA string containing the python directory (see Section 23.2 [Python], page 281).
[Function]gdb.execute (command [, from tty [, to string]])Evaluate command, a string, as a gdb CLI command. If a GDB exception happenswhile command runs, it is translated as described in Section 23.2.2.2 [ExceptionHandling], page 285.
from tty specifies whether gdb ought to consider this command as having originatedfrom the user invoking it interactively. It must be a boolean value. If omitted, itdefaults to False.
By default, any output produced by command is sent to gdb’s standard output. Ifthe to string parameter is True, then output will be collected by gdb.execute and
Chapter 23: Extending gdb 283
returned as a string. The default is False, in which case the return value is None.If to string is True, the gdb virtual terminal will be temporarily set to unlimitedwidth and height, and its pagination will be disabled; see Section 22.4 [Screen Size],page 267.
[Function]gdb.breakpoints ()Return a sequence holding all of gdb’s breakpoints. See Section 23.2.2.20 [BreakpointsIn Python], page 317, for more information.
[Function]gdb.parameter (parameter)Return the value of a gdb parameter. parameter is a string naming the parameter tolook up; parameter may contain spaces if the parameter has a multi-part name. Forexample, ‘print object’ is a valid parameter name.
If the named parameter does not exist, this function throws a gdb.error (seeSection 23.2.2.2 [Exception Handling], page 285). Otherwise, the parameter’s valueis converted to a Python value of the appropriate type, and returned.
[Function]gdb.history (number)Return a value from gdb’s value history (see Section 10.10 [Value History], page 116).number indicates which history element to return. If number is negative, then gdbwill take its absolute value and count backward from the last element (i.e., the mostrecent element) to find the value to return. If number is zero, then gdb will returnthe most recent element. If the element specified by number doesn’t exist in the valuehistory, a gdb.error exception will be raised.
If no exception is raised, the return value is always an instance of gdb.Value (seeSection 23.2.2.3 [Values From Inferior], page 286).
[Function]gdb.parse_and_eval (expression)Parse expression as an expression in the current language, evaluate it, and return theresult as a gdb.Value. expression must be a string.
This function can be useful when implementing a new command (see Section 23.2.2.11[Commands In Python], page 302), as it provides a way to parse the command’sargument as an expression. It is also useful simply to compute values, for example, it isthe only way to get the value of a convenience variable (see Section 10.11 [ConvenienceVars], page 117) as a gdb.Value.
[Function]gdb.post_event (event)Put event, a callable object taking no arguments, into gdb’s internal event queue.This callable will be invoked at some later point, during gdb’s event processing.Events posted using post_event will be run in the order in which they were posted;however, there is no way to know when they will be processed relative to other eventsinside gdb.
gdb is not thread-safe. If your Python program uses multiple threads, you mustbe careful to only call gdb-specific functions in the main gdb thread. post_event
ensures this. For example:(gdb) python
>import threading
>
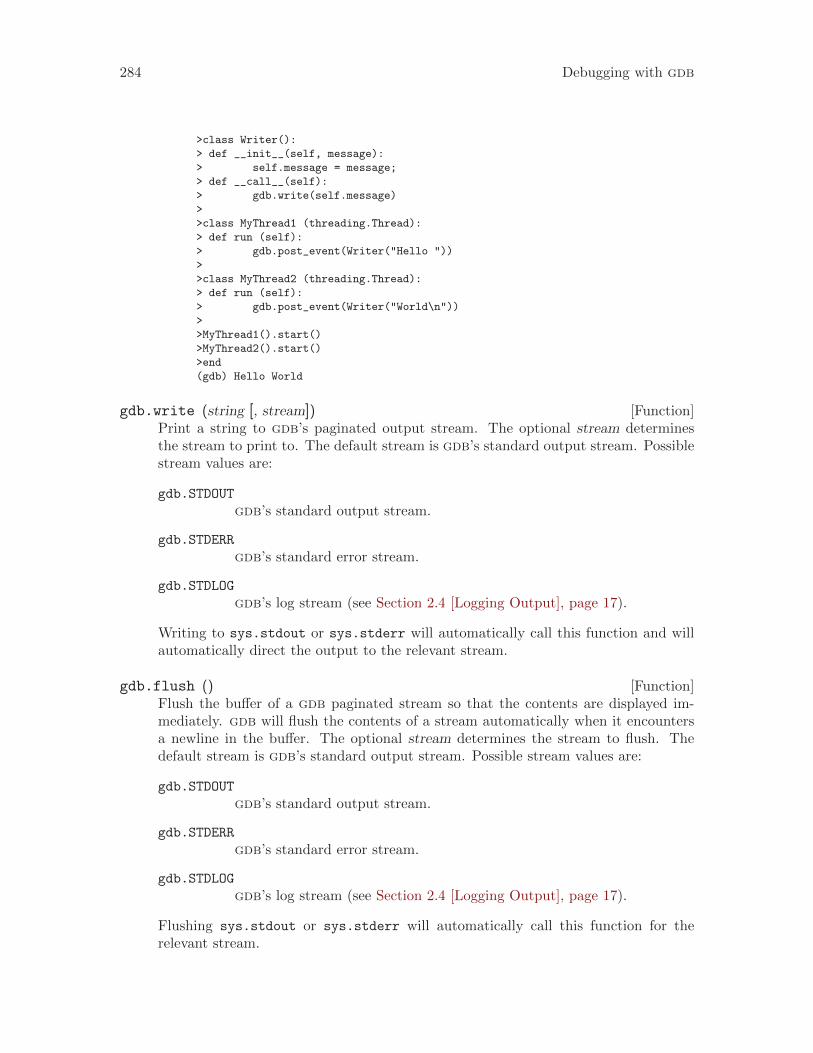
284 Debugging with gdb
>class Writer():
> def __init__(self, message):
> self.message = message;
> def __call__(self):
> gdb.write(self.message)
>
>class MyThread1 (threading.Thread):
> def run (self):
> gdb.post_event(Writer("Hello "))
>
>class MyThread2 (threading.Thread):
> def run (self):
> gdb.post_event(Writer("World\n"))
>
>MyThread1().start()
>MyThread2().start()
>end
(gdb) Hello World
[Function]gdb.write (string [, stream])Print a string to gdb’s paginated output stream. The optional stream determinesthe stream to print to. The default stream is gdb’s standard output stream. Possiblestream values are:
gdb.STDOUT
gdb’s standard output stream.
gdb.STDERR
gdb’s standard error stream.
gdb.STDLOG
gdb’s log stream (see Section 2.4 [Logging Output], page 17).
Writing to sys.stdout or sys.stderr will automatically call this function and willautomatically direct the output to the relevant stream.
[Function]gdb.flush ()Flush the buffer of a gdb paginated stream so that the contents are displayed im-mediately. gdb will flush the contents of a stream automatically when it encountersa newline in the buffer. The optional stream determines the stream to flush. Thedefault stream is gdb’s standard output stream. Possible stream values are:
gdb.STDOUT
gdb’s standard output stream.
gdb.STDERR
gdb’s standard error stream.
gdb.STDLOG
gdb’s log stream (see Section 2.4 [Logging Output], page 17).
Flushing sys.stdout or sys.stderr will automatically call this function for therelevant stream.
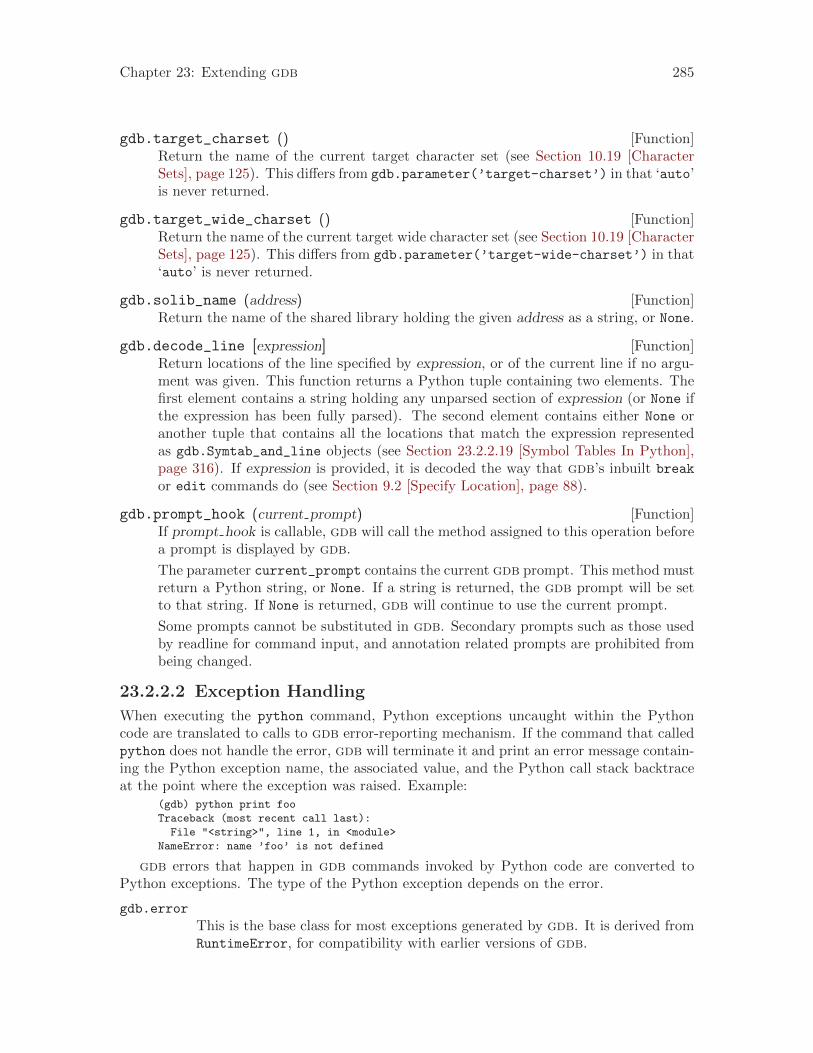
Chapter 23: Extending gdb 285
[Function]gdb.target_charset ()Return the name of the current target character set (see Section 10.19 [CharacterSets], page 125). This differs from gdb.parameter(’target-charset’) in that ‘auto’is never returned.
[Function]gdb.target_wide_charset ()Return the name of the current target wide character set (see Section 10.19 [CharacterSets], page 125). This differs from gdb.parameter(’target-wide-charset’) in that‘auto’ is never returned.
[Function]gdb.solib_name (address)Return the name of the shared library holding the given address as a string, or None.
[Function]gdb.decode_line [expression]Return locations of the line specified by expression, or of the current line if no argu-ment was given. This function returns a Python tuple containing two elements. Thefirst element contains a string holding any unparsed section of expression (or None ifthe expression has been fully parsed). The second element contains either None oranother tuple that contains all the locations that match the expression representedas gdb.Symtab_and_line objects (see Section 23.2.2.19 [Symbol Tables In Python],page 316). If expression is provided, it is decoded the way that gdb’s inbuilt breakor edit commands do (see Section 9.2 [Specify Location], page 88).
[Function]gdb.prompt_hook (current prompt)If prompt hook is callable, gdb will call the method assigned to this operation beforea prompt is displayed by gdb.
The parameter current_prompt contains the current gdb prompt. This method mustreturn a Python string, or None. If a string is returned, the gdb prompt will be setto that string. If None is returned, gdb will continue to use the current prompt.
Some prompts cannot be substituted in gdb. Secondary prompts such as those usedby readline for command input, and annotation related prompts are prohibited frombeing changed.
23.2.2.2 Exception Handling
When executing the python command, Python exceptions uncaught within the Pythoncode are translated to calls to gdb error-reporting mechanism. If the command that calledpython does not handle the error, gdb will terminate it and print an error message contain-ing the Python exception name, the associated value, and the Python call stack backtraceat the point where the exception was raised. Example:
(gdb) python print foo
Traceback (most recent call last):
File "<string>", line 1, in <module>
NameError: name ’foo’ is not defined
gdb errors that happen in gdb commands invoked by Python code are converted toPython exceptions. The type of the Python exception depends on the error.
gdb.error
This is the base class for most exceptions generated by gdb. It is derived fromRuntimeError, for compatibility with earlier versions of gdb.
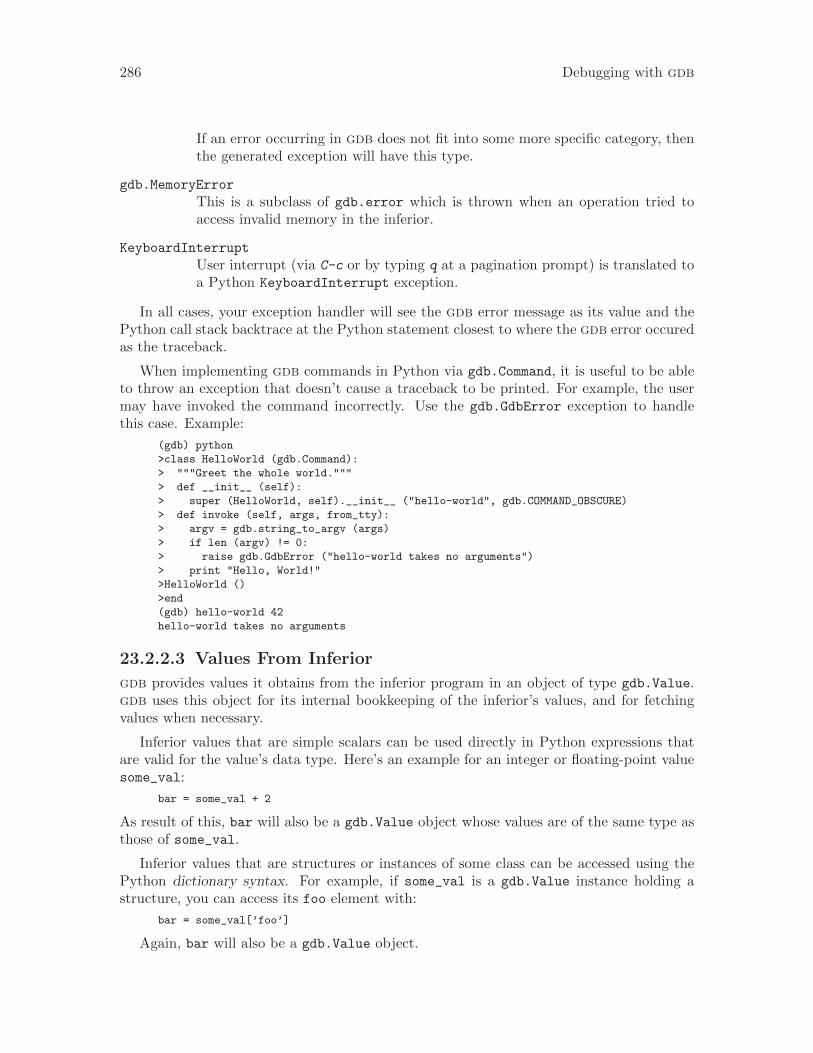
286 Debugging with gdb
If an error occurring in gdb does not fit into some more specific category, thenthe generated exception will have this type.
gdb.MemoryError
This is a subclass of gdb.error which is thrown when an operation tried toaccess invalid memory in the inferior.
KeyboardInterrupt
User interrupt (via C-c or by typing q at a pagination prompt) is translated toa Python KeyboardInterrupt exception.
In all cases, your exception handler will see the gdb error message as its value and thePython call stack backtrace at the Python statement closest to where the gdb error occuredas the traceback.
When implementing gdb commands in Python via gdb.Command, it is useful to be ableto throw an exception that doesn’t cause a traceback to be printed. For example, the usermay have invoked the command incorrectly. Use the gdb.GdbError exception to handlethis case. Example:
(gdb) python
>class HelloWorld (gdb.Command):
> """Greet the whole world."""
> def __init__ (self):
> super (HelloWorld, self).__init__ ("hello-world", gdb.COMMAND_OBSCURE)
> def invoke (self, args, from_tty):
> argv = gdb.string_to_argv (args)
> if len (argv) != 0:
> raise gdb.GdbError ("hello-world takes no arguments")
> print "Hello, World!"
>HelloWorld ()
>end
(gdb) hello-world 42
hello-world takes no arguments
23.2.2.3 Values From Inferior
gdb provides values it obtains from the inferior program in an object of type gdb.Value.gdb uses this object for its internal bookkeeping of the inferior’s values, and for fetchingvalues when necessary.
Inferior values that are simple scalars can be used directly in Python expressions thatare valid for the value’s data type. Here’s an example for an integer or floating-point valuesome_val:
bar = some_val + 2
As result of this, bar will also be a gdb.Value object whose values are of the same type asthose of some_val.
Inferior values that are structures or instances of some class can be accessed using thePython dictionary syntax. For example, if some_val is a gdb.Value instance holding astructure, you can access its foo element with:
bar = some_val[’foo’]
Again, bar will also be a gdb.Value object.
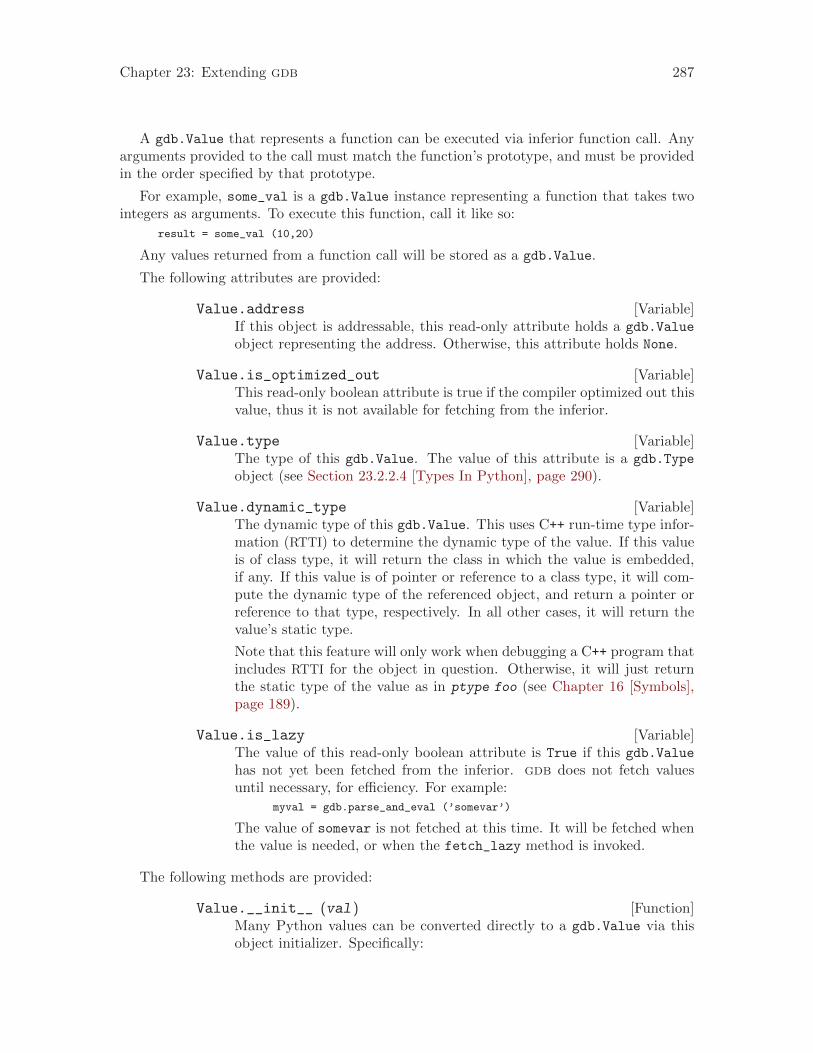
Chapter 23: Extending gdb 287
A gdb.Value that represents a function can be executed via inferior function call. Anyarguments provided to the call must match the function’s prototype, and must be providedin the order specified by that prototype.
For example, some_val is a gdb.Value instance representing a function that takes twointegers as arguments. To execute this function, call it like so:
result = some_val (10,20)
Any values returned from a function call will be stored as a gdb.Value.
The following attributes are provided:
[Variable]Value.addressIf this object is addressable, this read-only attribute holds a gdb.Value
object representing the address. Otherwise, this attribute holds None.
[Variable]Value.is_optimized_outThis read-only boolean attribute is true if the compiler optimized out thisvalue, thus it is not available for fetching from the inferior.
[Variable]Value.typeThe type of this gdb.Value. The value of this attribute is a gdb.Type
object (see Section 23.2.2.4 [Types In Python], page 290).
[Variable]Value.dynamic_typeThe dynamic type of this gdb.Value. This uses C++ run-time type infor-mation (RTTI) to determine the dynamic type of the value. If this valueis of class type, it will return the class in which the value is embedded,if any. If this value is of pointer or reference to a class type, it will com-pute the dynamic type of the referenced object, and return a pointer orreference to that type, respectively. In all other cases, it will return thevalue’s static type.
Note that this feature will only work when debugging a C++ program thatincludes RTTI for the object in question. Otherwise, it will just returnthe static type of the value as in ptype foo (see Chapter 16 [Symbols],page 189).
[Variable]Value.is_lazyThe value of this read-only boolean attribute is True if this gdb.Valuehas not yet been fetched from the inferior. gdb does not fetch valuesuntil necessary, for efficiency. For example:
myval = gdb.parse_and_eval (’somevar’)
The value of somevar is not fetched at this time. It will be fetched whenthe value is needed, or when the fetch_lazy method is invoked.
The following methods are provided:
[Function]Value.__init__ (val )Many Python values can be converted directly to a gdb.Value via thisobject initializer. Specifically:
288 Debugging with gdb
Python booleanA Python boolean is converted to the boolean type from thecurrent language.
Python integerA Python integer is converted to the C long type for thecurrent architecture.
Python longA Python long is converted to the C long long type for thecurrent architecture.
Python floatA Python float is converted to the C double type for thecurrent architecture.
Python stringA Python string is converted to a target string, using thecurrent target encoding.
gdb.Value
If val is a gdb.Value, then a copy of the value is made.
gdb.LazyString
If val is a gdb.LazyString (see Section 23.2.2.22 [LazyStrings In Python], page 320), then the lazy string’s value
method is called, and its result is used.
[Function]Value.cast (type)Return a new instance of gdb.Value that is the result of casting thisinstance to the type described by type, which must be a gdb.Type object.If the cast cannot be performed for some reason, this method throws anexception.
[Function]Value.dereference ()For pointer data types, this method returns a new gdb.Value objectwhose contents is the object pointed to by the pointer. For example, iffoo is a C pointer to an int, declared in your C program as
int *foo;
then you can use the corresponding gdb.Value to access what foo pointsto like this:
bar = foo.dereference ()
The result bar will be a gdb.Value object holding the value pointed toby foo.
[Function]Value.dynamic_cast (type)Like Value.cast, but works as if the C++ dynamic_cast operator wereused. Consult a C++ reference for details.
[Function]Value.reinterpret_cast (type)Like Value.cast, but works as if the C++ reinterpret_cast operatorwere used. Consult a C++ reference for details.
Chapter 23: Extending gdb 289
[Function]Value.string ([encoding[, errors[, length]]])If this gdb.Value represents a string, then this method converts the con-tents to a Python string. Otherwise, this method will throw an exception.
Strings are recognized in a language-specific way; whether a givengdb.Value represents a string is determined by the current language.
For C-like languages, a value is a string if it is a pointer to or an array ofcharacters or ints. The string is assumed to be terminated by a zero ofthe appropriate width. However if the optional length argument is given,the string will be converted to that given length, ignoring any embeddedzeros that the string may contain.
If the optional encoding argument is given, it must be a string namingthe encoding of the string in the gdb.Value, such as "ascii", "iso-8859-6" or "utf-8". It accepts the same encodings as the correspondingargument to Python’s string.decode method, and the Python codecmachinery will be used to convert the string. If encoding is not given,or if encoding is the empty string, then either the target-charset (seeSection 10.19 [Character Sets], page 125) will be used, or a language-specific encoding will be used, if the current language is able to supplyone.
The optional errors argument is the same as the corresponding argumentto Python’s string.decode method.
If the optional length argument is given, the string will be fetched andconverted to the given length.
[Function]Value.lazy_string ([encoding [, length]])If this gdb.Value represents a string, then this method converts thecontents to a gdb.LazyString (see Section 23.2.2.22 [Lazy Strings InPython], page 320). Otherwise, this method will throw an exception.
If the optional encoding argument is given, it must be a string nam-ing the encoding of the gdb.LazyString. Some examples are: ‘ascii’,‘iso-8859-6’ or ‘utf-8’. If the encoding argument is an encoding thatgdb does recognize, gdb will raise an error.
When a lazy string is printed, the gdb encoding machinery is used toconvert the string during printing. If the optional encoding argument isnot provided, or is an empty string, gdb will automatically select theencoding most suitable for the string type. For further information onencoding in gdb please see Section 10.19 [Character Sets], page 125.
If the optional length argument is given, the string will be fetched andencoded to the length of characters specified. If the length argumentis not provided, the string will be fetched and encoded until a null ofappropriate width is found.
[Function]Value.fetch_lazy ()If the gdb.Value object is currently a lazy value (gdb.Value.is_lazy isTrue), then the value is fetched from the inferior. Any errors that occurin the process will produce a Python exception.
290 Debugging with gdb
If the gdb.Value object is not a lazy value, this method has no effect.
This method does not return a value.
23.2.2.4 Types In Python
gdb represents types from the inferior using the class gdb.Type.
The following type-related functions are available in the gdb module:
[Function]gdb.lookup_type (name [, block])This function looks up a type by name. name is the name of the type to look up. Itmust be a string.
If block is given, then name is looked up in that scope. Otherwise, it is searched forglobally.
Ordinarily, this function will return an instance of gdb.Type. If the named typecannot be found, it will throw an exception.
If the type is a structure or class type, or an enum type, the fields of that type can beaccessed using the Python dictionary syntax. For example, if some_type is a gdb.Type
instance holding a structure type, you can access its foo field with:
bar = some_type[’foo’]
bar will be a gdb.Field object; see below under the description of the Type.fields
method for a description of the gdb.Field class.
An instance of Type has the following attributes:
[Variable]Type.codeThe type code for this type. The type code will be one of the TYPE_CODE_constants defined below.
[Variable]Type.sizeofThe size of this type, in target char units. Usually, a target’s char typewill be an 8-bit byte. However, on some unusual platforms, this type mayhave a different size.
[Variable]Type.tagThe tag name for this type. The tag name is the name after struct,union, or enum in C and C++; not all languages have this concept. If thistype has no tag name, then None is returned.
The following methods are provided:
[Function]Type.fields ()For structure and union types, this method returns the fields. Rangetypes have two fields, the minimum and maximum values. Enum typeshave one field per enum constant. Function and method types have onefield per parameter. The base types of C++ classes are also represented asfields. If the type has no fields, or does not fit into one of these categories,an empty sequence will be returned.
Each field is a gdb.Field object, with some pre-defined attributes:
Chapter 23: Extending gdb 291
bitpos This attribute is not available for static fields (as in C++or Java). For non-static fields, the value is the bit positionof the field. For enum fields, the value is the enumerationmember’s integer representation.
name The name of the field, or None for anonymous fields.
artificial
This is True if the field is artificial, usually meaning that itwas provided by the compiler and not the user. This attributeis always provided, and is False if the field is not artificial.
is_base_class
This is True if the field represents a base class of a C++ struc-ture. This attribute is always provided, and is False if thefield is not a base class of the type that is the argument offields, or if that type was not a C++ class.
bitsize If the field is packed, or is a bitfield, then this will have a non-zero value, which is the size of the field in bits. Otherwise,this will be zero; in this case the field’s size is given by itstype.
type The type of the field. This is usually an instance of Type,but it can be None in some situations.
[Function]Type.array (n1 [, n2 ])Return a new gdb.Type object which represents an array of this type. Ifone argument is given, it is the inclusive upper bound of the array; inthis case the lower bound is zero. If two arguments are given, the firstargument is the lower bound of the array, and the second argument is theupper bound of the array. An array’s length must not be negative, butthe bounds can be.
[Function]Type.const ()Return a new gdb.Type object which represents a const-qualified variantof this type.
[Function]Type.volatile ()Return a new gdb.Type object which represents a volatile-qualifiedvariant of this type.
[Function]Type.unqualified ()Return a new gdb.Type object which represents an unqualified variant ofthis type. That is, the result is neither const nor volatile.
[Function]Type.range ()Return a Python Tuple object that contains two elements: the low boundof the argument type and the high bound of that type. If the type does nothave a range, gdb will raise a gdb.error exception (see Section 23.2.2.2[Exception Handling], page 285).
292 Debugging with gdb
[Function]Type.reference ()Return a new gdb.Type object which represents a reference to this type.
[Function]Type.pointer ()Return a new gdb.Type object which represents a pointer to this type.
[Function]Type.strip_typedefs ()Return a new gdb.Type that represents the real type, after removing alllayers of typedefs.
[Function]Type.target ()Return a new gdb.Type object which represents the target type of thistype.
For a pointer type, the target type is the type of the pointed-to object.For an array type (meaning C-like arrays), the target type is the type ofthe elements of the array. For a function or method type, the target typeis the type of the return value. For a complex type, the target type is thetype of the elements. For a typedef, the target type is the aliased type.
If the type does not have a target, this method will throw an exception.
[Function]Type.template_argument (n [, block])If this gdb.Type is an instantiation of a template, this will return a newgdb.Type which represents the type of the nth template argument.
If this gdb.Type is not a template type, this will throw an exception.Ordinarily, only C++ code will have template types.
If block is given, then name is looked up in that scope. Otherwise, it issearched for globally.
Each type has a code, which indicates what category this type falls into. The availabletype categories are represented by constants defined in the gdb module:
gdb.TYPE_CODE_PTR
The type is a pointer.
gdb.TYPE_CODE_ARRAY
The type is an array.
gdb.TYPE_CODE_STRUCT
The type is a structure.
gdb.TYPE_CODE_UNION
The type is a union.
gdb.TYPE_CODE_ENUM
The type is an enum.
gdb.TYPE_CODE_FLAGS
A bit flags type, used for things such as status registers.
gdb.TYPE_CODE_FUNC
The type is a function.
Chapter 23: Extending gdb 293
gdb.TYPE_CODE_INT
The type is an integer type.
gdb.TYPE_CODE_FLT
A floating point type.
gdb.TYPE_CODE_VOID
The special type void.
gdb.TYPE_CODE_SET
A Pascal set type.
gdb.TYPE_CODE_RANGE
A range type, that is, an integer type with bounds.
gdb.TYPE_CODE_STRING
A string type. Note that this is only used for certain languages with language-defined string types; C strings are not represented this way.
gdb.TYPE_CODE_BITSTRING
A string of bits.
gdb.TYPE_CODE_ERROR
An unknown or erroneous type.
gdb.TYPE_CODE_METHOD
A method type, as found in C++ or Java.
gdb.TYPE_CODE_METHODPTR
A pointer-to-member-function.
gdb.TYPE_CODE_MEMBERPTR
A pointer-to-member.
gdb.TYPE_CODE_REF
A reference type.
gdb.TYPE_CODE_CHAR
A character type.
gdb.TYPE_CODE_BOOL
A boolean type.
gdb.TYPE_CODE_COMPLEX
A complex float type.
gdb.TYPE_CODE_TYPEDEF
A typedef to some other type.
gdb.TYPE_CODE_NAMESPACE
A C++ namespace.
gdb.TYPE_CODE_DECFLOAT
A decimal floating point type.
gdb.TYPE_CODE_INTERNAL_FUNCTION
A function internal to gdb. This is the type used to represent conveniencefunctions.
294 Debugging with gdb
Further support for types is provided in the gdb.types Python module (seeSection 23.2.4.2 [gdb.types], page 324).
23.2.2.5 Pretty Printing API
An example output is provided (see Section 10.9 [Pretty Printing], page 114).
A pretty-printer is just an object that holds a value and implements a specific interface,defined here.
[Function]pretty_printer.children (self)gdb will call this method on a pretty-printer to compute the children of the pretty-printer’s value.
This method must return an object conforming to the Python iterator protocol. Eachitem returned by the iterator must be a tuple holding two elements. The first elementis the “name” of the child; the second element is the child’s value. The value can beany Python object which is convertible to a gdb value.
This method is optional. If it does not exist, gdb will act as though the value has nochildren.
[Function]pretty_printer.display_hint (self)The CLI may call this method and use its result to change the formatting of a value.The result will also be supplied to an MI consumer as a ‘displayhint’ attribute ofthe variable being printed.
This method is optional. If it does exist, this method must return a string.
Some display hints are predefined by gdb:
‘array’ Indicate that the object being printed is “array-like”. The CLI uses this torespect parameters such as set print elements and set print array.
‘map’ Indicate that the object being printed is “map-like”, and that the childrenof this value can be assumed to alternate between keys and values.
‘string’ Indicate that the object being printed is “string-like”. If the printer’s to_string method returns a Python string of some kind, then gdb will callits internal language-specific string-printing function to format the string.For the CLI this means adding quotation marks, possibly escaping somecharacters, respecting set print elements, and the like.
[Function]pretty_printer.to_string (self)gdb will call this method to display the string representation of the value passed tothe object’s constructor.
When printing from the CLI, if the to_string method exists, then gdb will prependits result to the values returned by children. Exactly how this formatting is doneis dependent on the display hint, and may change as more hints are added. Also,depending on the print settings (see Section 10.8 [Print Settings], page 106), theCLI may print just the result of to_string in a stack trace, omitting the result ofchildren.
If this method returns a string, it is printed verbatim.
Chapter 23: Extending gdb 295
Otherwise, if this method returns an instance of gdb.Value, then gdb prints thisvalue. This may result in a call to another pretty-printer.
If instead the method returns a Python value which is convertible to a gdb.Value,then gdb performs the conversion and prints the resulting value. Again, this may re-sult in a call to another pretty-printer. Python scalars (integers, floats, and booleans)and strings are convertible to gdb.Value; other types are not.
Finally, if this method returns None then no further operations are peformed in thismethod and nothing is printed.
If the result is not one of these types, an exception is raised.
gdb provides a function which can be used to look up the default pretty-printer for agdb.Value:
[Function]gdb.default_visualizer (value)This function takes a gdb.Value object as an argument. If a pretty-printer for thisvalue exists, then it is returned. If no such printer exists, then this returns None.
23.2.2.6 Selecting Pretty-Printers
The Python list gdb.pretty_printers contains an array of functions or callable objectsthat have been registered via addition as a pretty-printer. Printers in this list are calledglobal printers, they’re available when debugging all inferiors. Each gdb.Progspace con-tains a pretty_printers attribute. Each gdb.Objfile also contains a pretty_printers
attribute.
Each function on these lists is passed a single gdb.Value argument and should returna pretty-printer object conforming to the interface definition above (see Section 23.2.2.5[Pretty Printing API], page 294). If a function cannot create a pretty-printer for the value,it should return None.
gdb first checks the pretty_printers attribute of each gdb.Objfile in the current pro-gram space and iteratively calls each enabled lookup routine in the list for that gdb.Objfileuntil it receives a pretty-printer object. If no pretty-printer is found in the objfile lists, gdbthen searches the pretty-printer list of the current program space, calling each enabled func-tion until an object is returned. After these lists have been exhausted, it tries the globalgdb.pretty_printers list, again calling each enabled function until an object is returned.
The order in which the objfiles are searched is not specified. For a given list, functionsare always invoked from the head of the list, and iterated over sequentially until the end ofthe list, or a printer object is returned.
For various reasons a pretty-printer may not work. For example, the underlying datastructure may have changed and the pretty-printer is out of date.
The consequences of a broken pretty-printer are severe enough that gdb provides supportfor enabling and disabling individual printers. For example, if print frame-arguments ison, a backtrace can become highly illegible if any argument is printed with a broken printer.
Pretty-printers are enabled and disabled by attaching an enabled attribute to the reg-istered function or callable object. If this attribute is present and its value is False, theprinter is disabled, otherwise the printer is enabled.
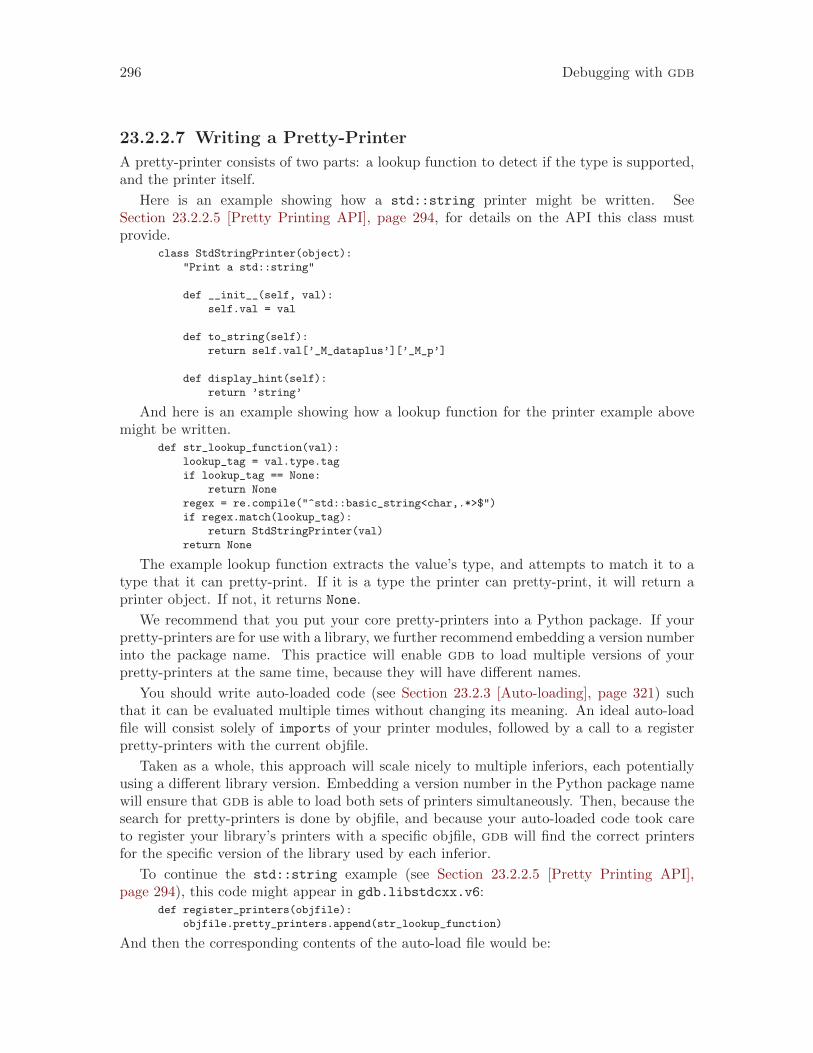
296 Debugging with gdb
23.2.2.7 Writing a Pretty-Printer
A pretty-printer consists of two parts: a lookup function to detect if the type is supported,and the printer itself.
Here is an example showing how a std::string printer might be written. SeeSection 23.2.2.5 [Pretty Printing API], page 294, for details on the API this class mustprovide.
class StdStringPrinter(object):
"Print a std::string"
def __init__(self, val):
self.val = val
def to_string(self):
return self.val[’_M_dataplus’][’_M_p’]
def display_hint(self):
return ’string’
And here is an example showing how a lookup function for the printer example abovemight be written.
def str_lookup_function(val):
lookup_tag = val.type.tag
if lookup_tag == None:
return None
regex = re.compile("^std::basic_string<char,.*>$")
if regex.match(lookup_tag):
return StdStringPrinter(val)
return None
The example lookup function extracts the value’s type, and attempts to match it to atype that it can pretty-print. If it is a type the printer can pretty-print, it will return aprinter object. If not, it returns None.
We recommend that you put your core pretty-printers into a Python package. If yourpretty-printers are for use with a library, we further recommend embedding a version numberinto the package name. This practice will enable gdb to load multiple versions of yourpretty-printers at the same time, because they will have different names.
You should write auto-loaded code (see Section 23.2.3 [Auto-loading], page 321) suchthat it can be evaluated multiple times without changing its meaning. An ideal auto-loadfile will consist solely of imports of your printer modules, followed by a call to a registerpretty-printers with the current objfile.
Taken as a whole, this approach will scale nicely to multiple inferiors, each potentiallyusing a different library version. Embedding a version number in the Python package namewill ensure that gdb is able to load both sets of printers simultaneously. Then, because thesearch for pretty-printers is done by objfile, and because your auto-loaded code took careto register your library’s printers with a specific objfile, gdb will find the correct printersfor the specific version of the library used by each inferior.
To continue the std::string example (see Section 23.2.2.5 [Pretty Printing API],page 294), this code might appear in gdb.libstdcxx.v6:
def register_printers(objfile):
objfile.pretty_printers.append(str_lookup_function)
And then the corresponding contents of the auto-load file would be:
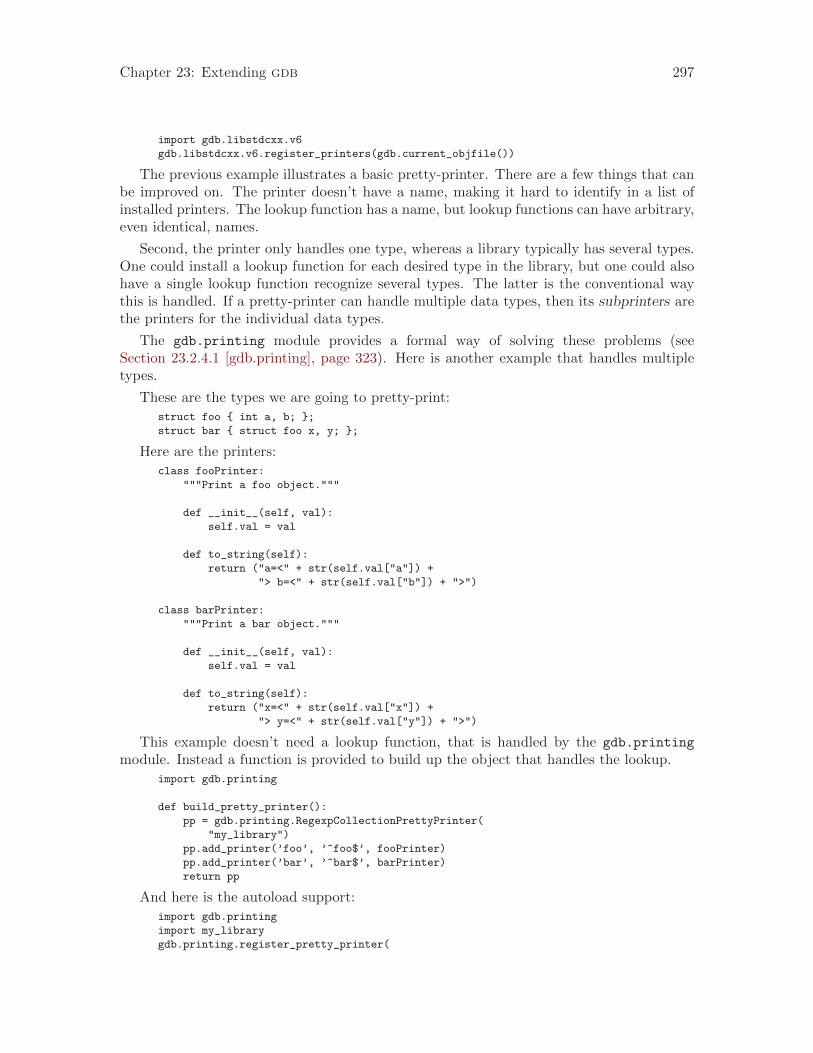
Chapter 23: Extending gdb 297
import gdb.libstdcxx.v6
gdb.libstdcxx.v6.register_printers(gdb.current_objfile())
The previous example illustrates a basic pretty-printer. There are a few things that canbe improved on. The printer doesn’t have a name, making it hard to identify in a list ofinstalled printers. The lookup function has a name, but lookup functions can have arbitrary,even identical, names.
Second, the printer only handles one type, whereas a library typically has several types.One could install a lookup function for each desired type in the library, but one could alsohave a single lookup function recognize several types. The latter is the conventional waythis is handled. If a pretty-printer can handle multiple data types, then its subprinters arethe printers for the individual data types.
The gdb.printing module provides a formal way of solving these problems (seeSection 23.2.4.1 [gdb.printing], page 323). Here is another example that handles multipletypes.
These are the types we are going to pretty-print:
struct foo { int a, b; };
struct bar { struct foo x, y; };
Here are the printers:
class fooPrinter:
"""Print a foo object."""
def __init__(self, val):
self.val = val
def to_string(self):
return ("a=<" + str(self.val["a"]) +
"> b=<" + str(self.val["b"]) + ">")
class barPrinter:
"""Print a bar object."""
def __init__(self, val):
self.val = val
def to_string(self):
return ("x=<" + str(self.val["x"]) +
"> y=<" + str(self.val["y"]) + ">")
This example doesn’t need a lookup function, that is handled by the gdb.printing
module. Instead a function is provided to build up the object that handles the lookup.
import gdb.printing
def build_pretty_printer():
pp = gdb.printing.RegexpCollectionPrettyPrinter(
"my_library")
pp.add_printer(’foo’, ’^foo$’, fooPrinter)
pp.add_printer(’bar’, ’^bar$’, barPrinter)
return pp
And here is the autoload support:
import gdb.printing
import my_library
gdb.printing.register_pretty_printer(
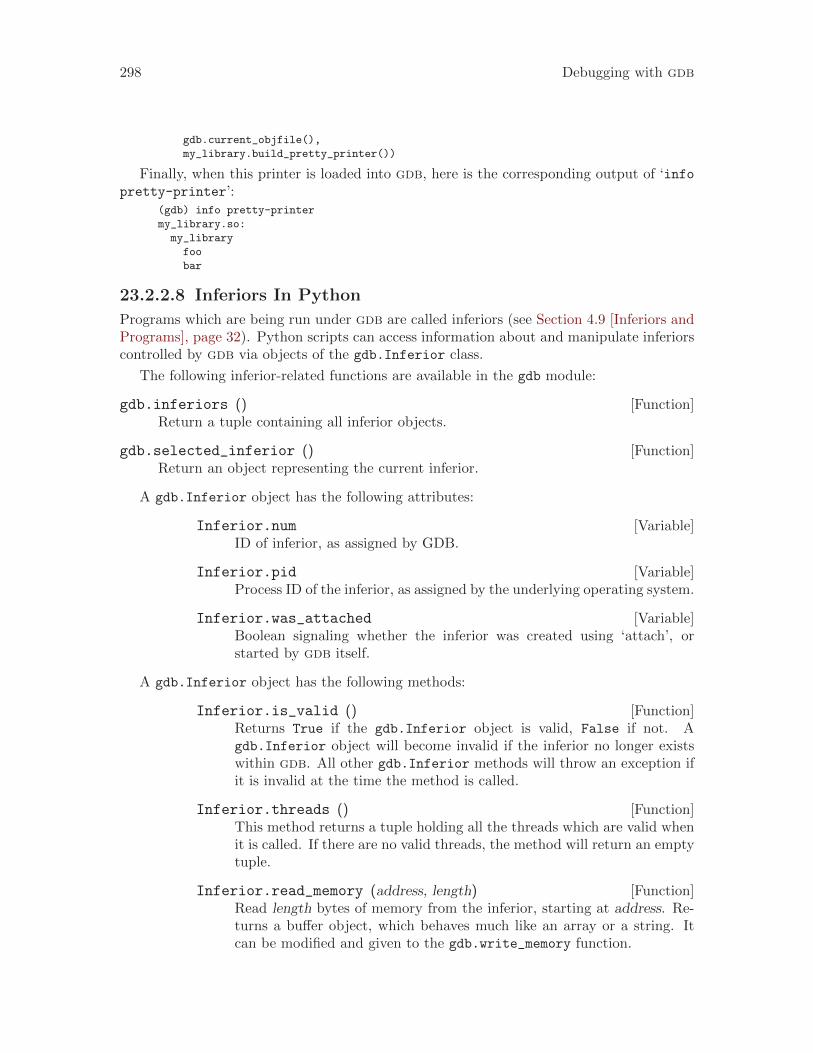
298 Debugging with gdb
gdb.current_objfile(),
my_library.build_pretty_printer())
Finally, when this printer is loaded into gdb, here is the corresponding output of ‘infopretty-printer’:
(gdb) info pretty-printer
my_library.so:
my_library
foo
bar
23.2.2.8 Inferiors In Python
Programs which are being run under gdb are called inferiors (see Section 4.9 [Inferiors andPrograms], page 32). Python scripts can access information about and manipulate inferiorscontrolled by gdb via objects of the gdb.Inferior class.
The following inferior-related functions are available in the gdb module:
[Function]gdb.inferiors ()Return a tuple containing all inferior objects.
[Function]gdb.selected_inferior ()Return an object representing the current inferior.
A gdb.Inferior object has the following attributes:
[Variable]Inferior.numID of inferior, as assigned by GDB.
[Variable]Inferior.pidProcess ID of the inferior, as assigned by the underlying operating system.
[Variable]Inferior.was_attachedBoolean signaling whether the inferior was created using ‘attach’, orstarted by gdb itself.
A gdb.Inferior object has the following methods:
[Function]Inferior.is_valid ()Returns True if the gdb.Inferior object is valid, False if not. Agdb.Inferior object will become invalid if the inferior no longer existswithin gdb. All other gdb.Inferior methods will throw an exception ifit is invalid at the time the method is called.
[Function]Inferior.threads ()This method returns a tuple holding all the threads which are valid whenit is called. If there are no valid threads, the method will return an emptytuple.
[Function]Inferior.read_memory (address, length)Read length bytes of memory from the inferior, starting at address. Re-turns a buffer object, which behaves much like an array or a string. Itcan be modified and given to the gdb.write_memory function.
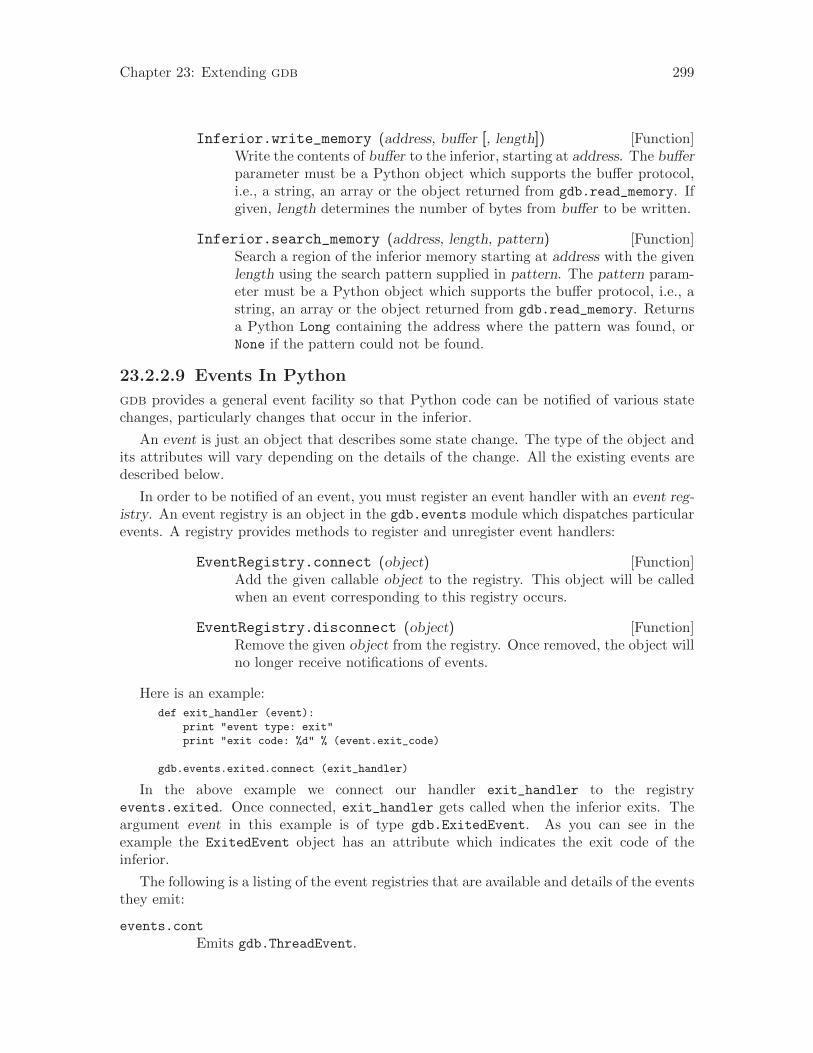
Chapter 23: Extending gdb 299
[Function]Inferior.write_memory (address, buffer [, length])Write the contents of buffer to the inferior, starting at address. The bufferparameter must be a Python object which supports the buffer protocol,i.e., a string, an array or the object returned from gdb.read_memory. Ifgiven, length determines the number of bytes from buffer to be written.
[Function]Inferior.search_memory (address, length, pattern)Search a region of the inferior memory starting at address with the givenlength using the search pattern supplied in pattern. The pattern param-eter must be a Python object which supports the buffer protocol, i.e., astring, an array or the object returned from gdb.read_memory. Returnsa Python Long containing the address where the pattern was found, orNone if the pattern could not be found.
23.2.2.9 Events In Python
gdb provides a general event facility so that Python code can be notified of various statechanges, particularly changes that occur in the inferior.
An event is just an object that describes some state change. The type of the object andits attributes will vary depending on the details of the change. All the existing events aredescribed below.
In order to be notified of an event, you must register an event handler with an event reg-istry. An event registry is an object in the gdb.events module which dispatches particularevents. A registry provides methods to register and unregister event handlers:
[Function]EventRegistry.connect (object)Add the given callable object to the registry. This object will be calledwhen an event corresponding to this registry occurs.
[Function]EventRegistry.disconnect (object)Remove the given object from the registry. Once removed, the object willno longer receive notifications of events.
Here is an example:
def exit_handler (event):
print "event type: exit"
print "exit code: %d" % (event.exit_code)
gdb.events.exited.connect (exit_handler)
In the above example we connect our handler exit_handler to the registryevents.exited. Once connected, exit_handler gets called when the inferior exits. Theargument event in this example is of type gdb.ExitedEvent. As you can see in theexample the ExitedEvent object has an attribute which indicates the exit code of theinferior.
The following is a listing of the event registries that are available and details of the eventsthey emit:
events.cont
Emits gdb.ThreadEvent.
300 Debugging with gdb
Some events can be thread specific when gdb is running in non-stop mode.When represented in Python, these events all extend gdb.ThreadEvent. Note,this event is not emitted directly; instead, events which are emitted by thisor other modules might extend this event. Examples of these events aregdb.BreakpointEvent and gdb.ContinueEvent.
[Variable]ThreadEvent.inferior_threadIn non-stop mode this attribute will be set to the specificthread which was involved in the emitted event. Otherwise,it will be set to None.
Emits gdb.ContinueEvent which extends gdb.ThreadEvent.
This event indicates that the inferior has been continued after a stop. Forinherited attribute refer to gdb.ThreadEvent above.
events.exited
Emits events.ExitedEvent which indicates that the inferior has exited.events.ExitedEvent has two attributes:
[Variable]ExitedEvent.exit_codeAn integer representing the exit code, if available, which theinferior has returned. (The exit code could be unavailable if,for example, gdb detaches from the inferior.) If the exit codeis unavailable, the attribute does not exist.
[Variable]ExitedEvent inferiorA reference to the inferior which triggered the exited event.
events.stop
Emits gdb.StopEvent which extends gdb.ThreadEvent.
Indicates that the inferior has stopped. All events emitted by this registryextend StopEvent. As a child of gdb.ThreadEvent, gdb.StopEvent will in-dicate the stopped thread when gdb is running in non-stop mode. Refer togdb.ThreadEvent above for more details.
Emits gdb.SignalEvent which extends gdb.StopEvent.
This event indicates that the inferior or one of its threads has received as signal.gdb.SignalEvent has the following attributes:
[Variable]SignalEvent.stop_signalA string representing the signal received by the inferior. Alist of possible signal values can be obtained by running thecommand info signals in the gdb command prompt.
Also emits gdb.BreakpointEvent which extends gdb.StopEvent.
gdb.BreakpointEvent event indicates that one or more breakpoints have beenhit, and has the following attributes:
[Variable]BreakpointEvent.breakpointsA sequence containing references to all the breakpoints(type gdb.Breakpoint) that were hit. See Section 23.2.2.20
Chapter 23: Extending gdb 301
[Breakpoints In Python], page 317, for details of thegdb.Breakpoint object.
[Variable]BreakpointEvent.breakpointA reference to the first breakpoint that was hit. This func-tion is maintained for backward compatibility and is now dep-recated in favor of the gdb.BreakpointEvent.breakpoints
attribute.
events.new_objfile
Emits gdb.NewObjFileEvent which indicates that a new object file has beenloaded by gdb. gdb.NewObjFileEvent has one attribute:
[Variable]NewObjFileEvent.new_objfileA reference to the object file (gdb.Objfile) which has beenloaded. See Section 23.2.2.15 [Objfiles In Python], page 309,for details of the gdb.Objfile object.
23.2.2.10 Threads In Python
Python scripts can access information about, and manipulate inferior threads controlled bygdb, via objects of the gdb.InferiorThread class.
The following thread-related functions are available in the gdb module:
[Function]gdb.selected_thread ()This function returns the thread object for the selected thread. If there is no selectedthread, this will return None.
A gdb.InferiorThread object has the following attributes:
[Variable]InferiorThread.nameThe name of the thread. If the user specified a name using thread name,then this returns that name. Otherwise, if an OS-supplied name is avail-able, then it is returned. Otherwise, this returns None.
This attribute can be assigned to. The new value must be a string ob-ject, which sets the new name, or None, which removes any user-specifiedthread name.
[Variable]InferiorThread.numID of the thread, as assigned by GDB.
[Variable]InferiorThread.ptidID of the thread, as assigned by the operating system. This attributeis a tuple containing three integers. The first is the Process ID (PID);the second is the Lightweight Process ID (LWPID), and the third is theThread ID (TID). Either the LWPID or TID may be 0, which indicatesthat the operating system does not use that identifier.
A gdb.InferiorThread object has the following methods:
302 Debugging with gdb
[Function]InferiorThread.is_valid ()Returns True if the gdb.InferiorThread object is valid, False ifnot. A gdb.InferiorThread object will become invalid if the threadexits, or the inferior that the thread belongs is deleted. All othergdb.InferiorThread methods will throw an exception if it is invalid atthe time the method is called.
[Function]InferiorThread.switch ()This changes gdb’s currently selected thread to the one represented bythis object.
[Function]InferiorThread.is_stopped ()Return a Boolean indicating whether the thread is stopped.
[Function]InferiorThread.is_running ()Return a Boolean indicating whether the thread is running.
[Function]InferiorThread.is_exited ()Return a Boolean indicating whether the thread is exited.
23.2.2.11 Commands In Python
You can implement new gdb CLI commands in Python. A CLI command is implementedusing an instance of the gdb.Command class, most commonly using a subclass.
[Function]Command.__init__ (name, command_class [, completer_class [,prefix ]])
The object initializer for Command registers the new command with gdb. This initial-izer is normally invoked from the subclass’ own __init__ method.
name is the name of the command. If name consists of multiple words, then the initialwords are looked for as prefix commands. In this case, if one of the prefix commandsdoes not exist, an exception is raised.
There is no support for multi-line commands.
command class should be one of the ‘COMMAND_’ constants defined below. This argu-ment tells gdb how to categorize the new command in the help system.
completer class is an optional argument. If given, it should be one of the ‘COMPLETE_’constants defined below. This argument tells gdb how to perform completion for thiscommand. If not given, gdb will attempt to complete using the object’s complete
method (see below); if no such method is found, an error will occur when completionis attempted.
prefix is an optional argument. If True, then the new command is a prefix command;sub-commands of this command may be registered.
The help text for the new command is taken from the Python documentation stringfor the command’s class, if there is one. If no documentation string is provided, thedefault value “This command is not documented.” is used.
[Function]Command.dont_repeat ()By default, a gdb command is repeated when the user enters a blank line at thecommand prompt. A command can suppress this behavior by invoking the dont_
Chapter 23: Extending gdb 303
repeat method. This is similar to the user command dont-repeat, see Section 23.1.1[Define], page 275.
[Function]Command.invoke (argument, from tty)This method is called by gdb when this command is invoked.
argument is a string. It is the argument to the command, after leading and trailingwhitespace has been stripped.
from tty is a boolean argument. When true, this means that the command wasentered by the user at the terminal; when false it means that the command camefrom elsewhere.
If this method throws an exception, it is turned into a gdb error call. Otherwise,the return value is ignored.
To break argument up into an argv-like string use gdb.string_to_argv. This func-tion behaves identically to gdb’s internal argument lexer buildargv. It is recom-mended to use this for consistency. Arguments are separated by spaces and may bequoted. Example:
print gdb.string_to_argv ("1 2\ \\\"3 ’4 \"5’ \"6 ’7\"")
[’1’, ’2 "3’, ’4 "5’, "6 ’7"]
[Function]Command.complete (text, word)This method is called by gdb when the user attempts completion on this command.All forms of completion are handled by this method, that is, the TAB and M-? keybindings (see Section 3.2 [Completion], page 19), and the complete command (seeSection 3.3 [Help], page 21).
The arguments text and word are both strings. text holds the complete commandline up to the cursor’s location. word holds the last word of the command line; thisis computed using a word-breaking heuristic.
The complete method can return several values:
• If the return value is a sequence, the contents of the sequence are used as thecompletions. It is up to complete to ensure that the contents actually do com-plete the word. A zero-length sequence is allowed, it means that there wereno completions available. Only string elements of the sequence are used; otherelements in the sequence are ignored.
• If the return value is one of the ‘COMPLETE_’ constants defined below, then thecorresponding gdb-internal completion function is invoked, and its result is used.
• All other results are treated as though there were no available completions.
When a new command is registered, it must be declared as a member of some generalclass of commands. This is used to classify top-level commands in the on-line help system;note that prefix commands are not listed under their own category but rather that of theirtop-level command. The available classifications are represented by constants defined in thegdb module:
gdb.COMMAND_NONE
The command does not belong to any particular class. A command in thiscategory will not be displayed in any of the help categories.
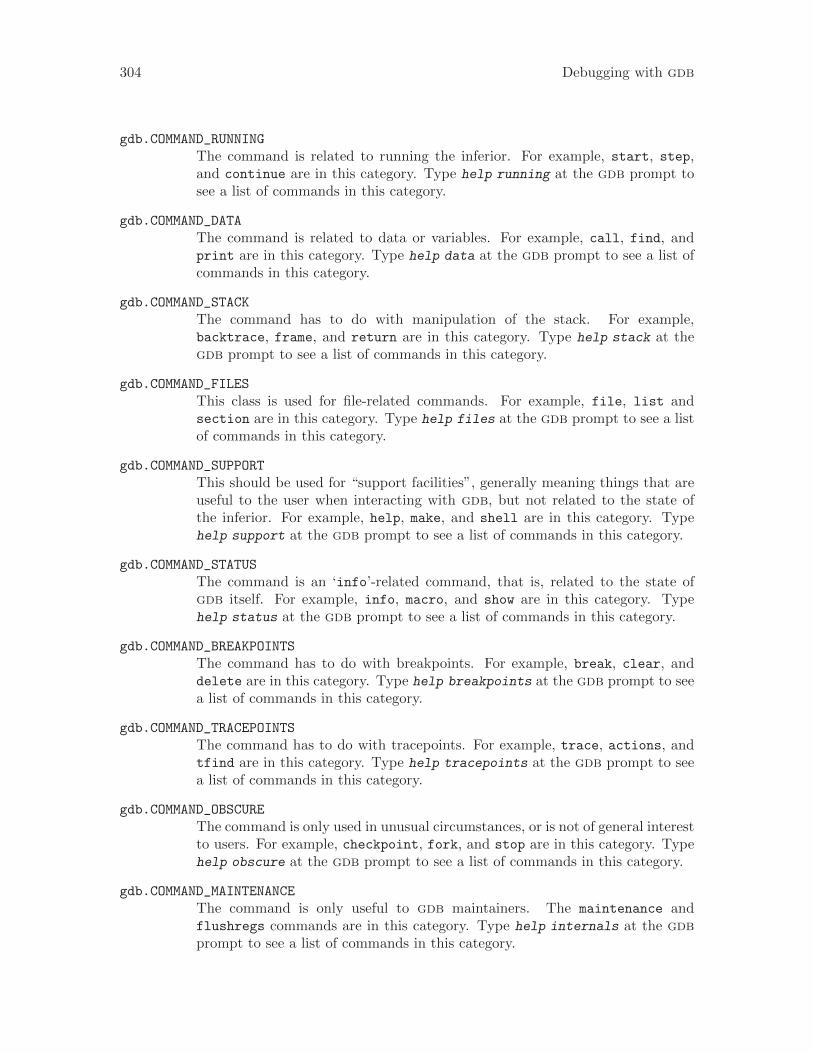
304 Debugging with gdb
gdb.COMMAND_RUNNING
The command is related to running the inferior. For example, start, step,and continue are in this category. Type help running at the gdb prompt tosee a list of commands in this category.
gdb.COMMAND_DATA
The command is related to data or variables. For example, call, find, andprint are in this category. Type help data at the gdb prompt to see a list ofcommands in this category.
gdb.COMMAND_STACK
The command has to do with manipulation of the stack. For example,backtrace, frame, and return are in this category. Type help stack at thegdb prompt to see a list of commands in this category.
gdb.COMMAND_FILES
This class is used for file-related commands. For example, file, list andsection are in this category. Type help files at the gdb prompt to see a listof commands in this category.
gdb.COMMAND_SUPPORT
This should be used for “support facilities”, generally meaning things that areuseful to the user when interacting with gdb, but not related to the state ofthe inferior. For example, help, make, and shell are in this category. Typehelp support at the gdb prompt to see a list of commands in this category.
gdb.COMMAND_STATUS
The command is an ‘info’-related command, that is, related to the state ofgdb itself. For example, info, macro, and show are in this category. Typehelp status at the gdb prompt to see a list of commands in this category.
gdb.COMMAND_BREAKPOINTS
The command has to do with breakpoints. For example, break, clear, anddelete are in this category. Type help breakpoints at the gdb prompt to seea list of commands in this category.
gdb.COMMAND_TRACEPOINTS
The command has to do with tracepoints. For example, trace, actions, andtfind are in this category. Type help tracepoints at the gdb prompt to seea list of commands in this category.
gdb.COMMAND_OBSCURE
The command is only used in unusual circumstances, or is not of general interestto users. For example, checkpoint, fork, and stop are in this category. Typehelp obscure at the gdb prompt to see a list of commands in this category.
gdb.COMMAND_MAINTENANCE
The command is only useful to gdb maintainers. The maintenance andflushregs commands are in this category. Type help internals at the gdbprompt to see a list of commands in this category.
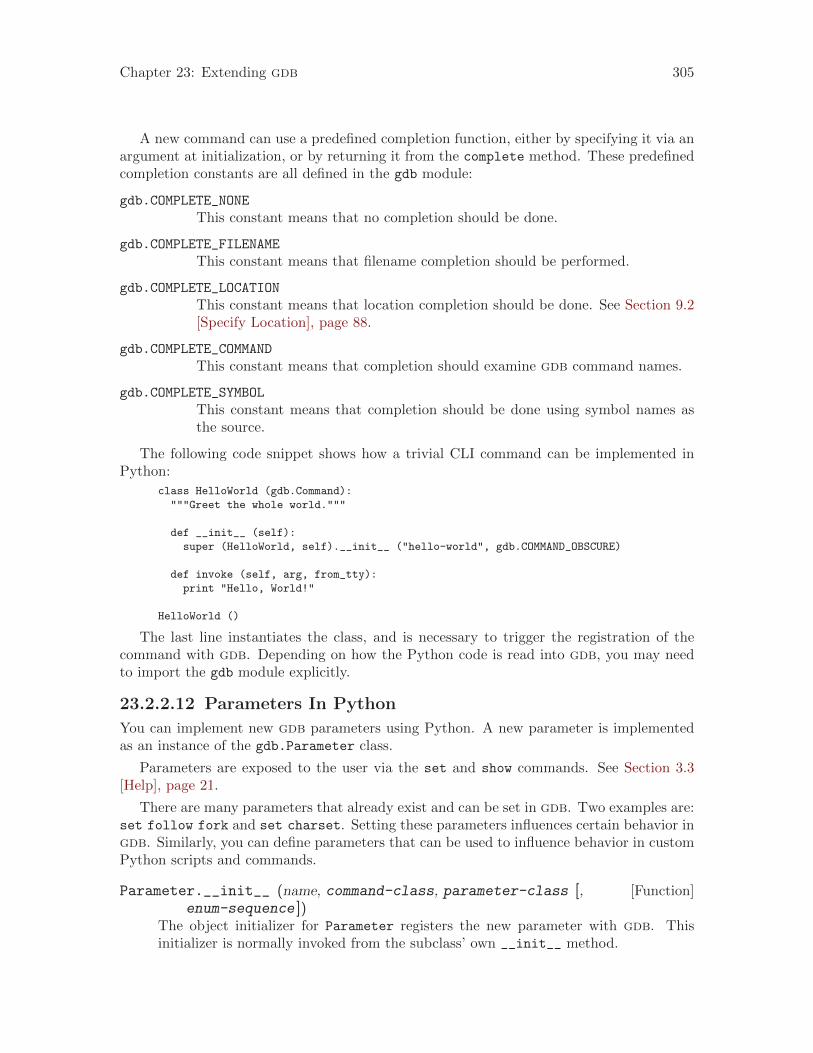
Chapter 23: Extending gdb 305
A new command can use a predefined completion function, either by specifying it via anargument at initialization, or by returning it from the complete method. These predefinedcompletion constants are all defined in the gdb module:
gdb.COMPLETE_NONE
This constant means that no completion should be done.
gdb.COMPLETE_FILENAME
This constant means that filename completion should be performed.
gdb.COMPLETE_LOCATION
This constant means that location completion should be done. See Section 9.2[Specify Location], page 88.
gdb.COMPLETE_COMMAND
This constant means that completion should examine gdb command names.
gdb.COMPLETE_SYMBOL
This constant means that completion should be done using symbol names asthe source.
The following code snippet shows how a trivial CLI command can be implemented inPython:
class HelloWorld (gdb.Command):
"""Greet the whole world."""
def __init__ (self):
super (HelloWorld, self).__init__ ("hello-world", gdb.COMMAND_OBSCURE)
def invoke (self, arg, from_tty):
print "Hello, World!"
HelloWorld ()
The last line instantiates the class, and is necessary to trigger the registration of thecommand with gdb. Depending on how the Python code is read into gdb, you may needto import the gdb module explicitly.
23.2.2.12 Parameters In Python
You can implement new gdb parameters using Python. A new parameter is implementedas an instance of the gdb.Parameter class.
Parameters are exposed to the user via the set and show commands. See Section 3.3[Help], page 21.
There are many parameters that already exist and can be set in gdb. Two examples are:set follow fork and set charset. Setting these parameters influences certain behavior ingdb. Similarly, you can define parameters that can be used to influence behavior in customPython scripts and commands.
[Function]Parameter.__init__ (name, command-class, parameter-class [,enum-sequence ])
The object initializer for Parameter registers the new parameter with gdb. Thisinitializer is normally invoked from the subclass’ own __init__ method.
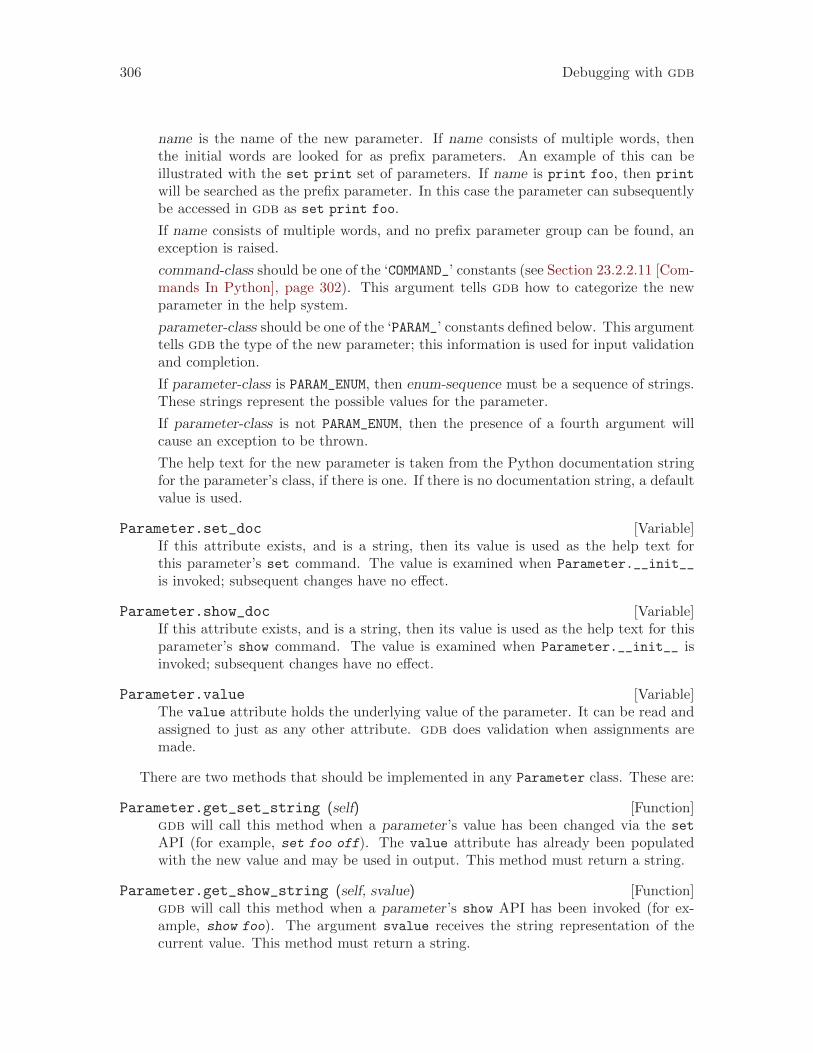
306 Debugging with gdb
name is the name of the new parameter. If name consists of multiple words, thenthe initial words are looked for as prefix parameters. An example of this can beillustrated with the set print set of parameters. If name is print foo, then print
will be searched as the prefix parameter. In this case the parameter can subsequentlybe accessed in gdb as set print foo.
If name consists of multiple words, and no prefix parameter group can be found, anexception is raised.
command-class should be one of the ‘COMMAND_’ constants (see Section 23.2.2.11 [Com-mands In Python], page 302). This argument tells gdb how to categorize the newparameter in the help system.
parameter-class should be one of the ‘PARAM_’ constants defined below. This argumenttells gdb the type of the new parameter; this information is used for input validationand completion.
If parameter-class is PARAM_ENUM, then enum-sequence must be a sequence of strings.These strings represent the possible values for the parameter.
If parameter-class is not PARAM_ENUM, then the presence of a fourth argument willcause an exception to be thrown.
The help text for the new parameter is taken from the Python documentation stringfor the parameter’s class, if there is one. If there is no documentation string, a defaultvalue is used.
[Variable]Parameter.set_docIf this attribute exists, and is a string, then its value is used as the help text forthis parameter’s set command. The value is examined when Parameter.__init__
is invoked; subsequent changes have no effect.
[Variable]Parameter.show_docIf this attribute exists, and is a string, then its value is used as the help text for thisparameter’s show command. The value is examined when Parameter.__init__ isinvoked; subsequent changes have no effect.
[Variable]Parameter.valueThe value attribute holds the underlying value of the parameter. It can be read andassigned to just as any other attribute. gdb does validation when assignments aremade.
There are two methods that should be implemented in any Parameter class. These are:
[Function]Parameter.get_set_string (self)gdb will call this method when a parameter’s value has been changed via the set
API (for example, set foo off). The value attribute has already been populatedwith the new value and may be used in output. This method must return a string.
[Function]Parameter.get_show_string (self, svalue)gdb will call this method when a parameter’s show API has been invoked (for ex-ample, show foo). The argument svalue receives the string representation of thecurrent value. This method must return a string.
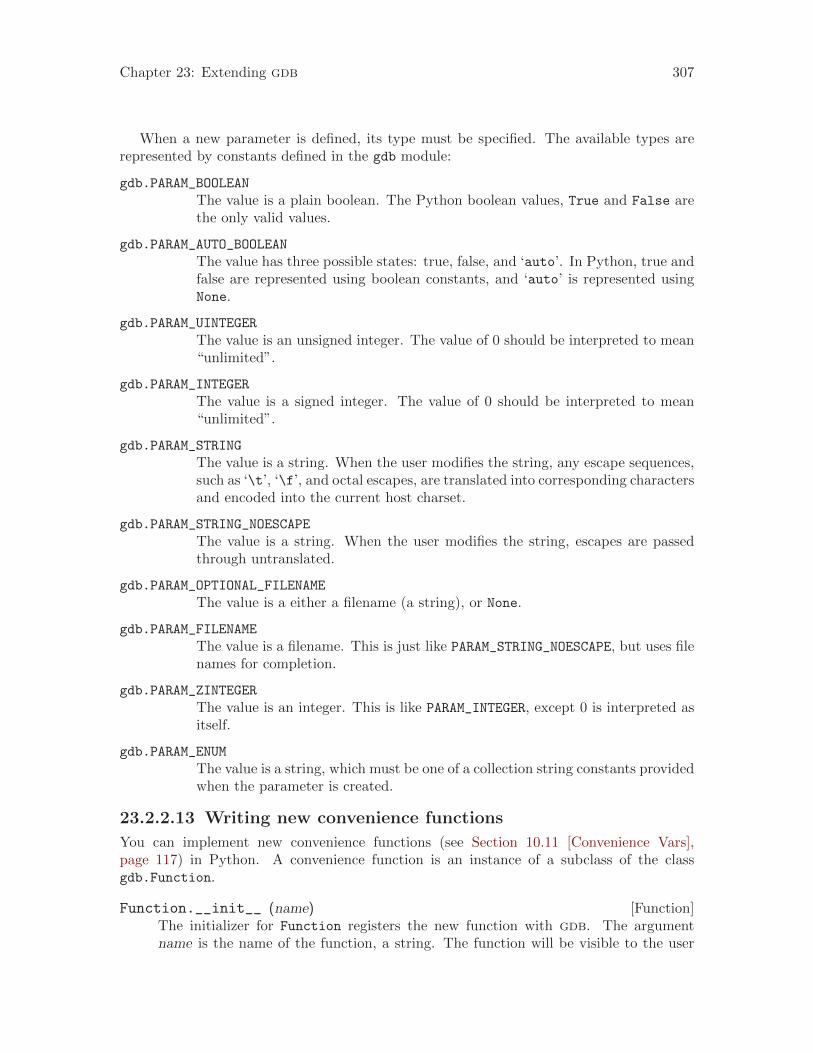
Chapter 23: Extending gdb 307
When a new parameter is defined, its type must be specified. The available types arerepresented by constants defined in the gdb module:
gdb.PARAM_BOOLEAN
The value is a plain boolean. The Python boolean values, True and False arethe only valid values.
gdb.PARAM_AUTO_BOOLEAN
The value has three possible states: true, false, and ‘auto’. In Python, true andfalse are represented using boolean constants, and ‘auto’ is represented usingNone.
gdb.PARAM_UINTEGER
The value is an unsigned integer. The value of 0 should be interpreted to mean“unlimited”.
gdb.PARAM_INTEGER
The value is a signed integer. The value of 0 should be interpreted to mean“unlimited”.
gdb.PARAM_STRING
The value is a string. When the user modifies the string, any escape sequences,such as ‘\t’, ‘\f’, and octal escapes, are translated into corresponding charactersand encoded into the current host charset.
gdb.PARAM_STRING_NOESCAPE
The value is a string. When the user modifies the string, escapes are passedthrough untranslated.
gdb.PARAM_OPTIONAL_FILENAME
The value is a either a filename (a string), or None.
gdb.PARAM_FILENAME
The value is a filename. This is just like PARAM_STRING_NOESCAPE, but uses filenames for completion.
gdb.PARAM_ZINTEGER
The value is an integer. This is like PARAM_INTEGER, except 0 is interpreted asitself.
gdb.PARAM_ENUM
The value is a string, which must be one of a collection string constants providedwhen the parameter is created.
23.2.2.13 Writing new convenience functions
You can implement new convenience functions (see Section 10.11 [Convenience Vars],page 117) in Python. A convenience function is an instance of a subclass of the classgdb.Function.
[Function]Function.__init__ (name)The initializer for Function registers the new function with gdb. The argumentname is the name of the function, a string. The function will be visible to the user
308 Debugging with gdb
as a convenience variable of type internal function, whose name is the same as thegiven name.
The documentation for the new function is taken from the documentation string forthe new class.
[Function]Function.invoke (*args )When a convenience function is evaluated, its arguments are converted to instances ofgdb.Value, and then the function’s invoke method is called. Note that gdb does notpredetermine the arity of convenience functions. Instead, all available arguments arepassed to invoke, following the standard Python calling convention. In particular, aconvenience function can have default values for parameters without ill effect.
The return value of this method is used as its value in the enclosing expression. If anordinary Python value is returned, it is converted to a gdb.Value following the usualrules.
The following code snippet shows how a trivial convenience function can be implementedin Python:
class Greet (gdb.Function):
"""Return string to greet someone.
Takes a name as argument."""
def __init__ (self):
super (Greet, self).__init__ ("greet")
def invoke (self, name):
return "Hello, %s!" % name.string ()
Greet ()
The last line instantiates the class, and is necessary to trigger the registration of thefunction with gdb. Depending on how the Python code is read into gdb, you may need toimport the gdb module explicitly.
23.2.2.14 Program Spaces In Python
A program space, or progspace, represents a symbolic view of an address space. It consistsof all of the objfiles of the program. See Section 23.2.2.15 [Objfiles In Python], page 309.See Section 4.9 [Inferiors and Programs], page 32, for more details about program spaces.
The following progspace-related functions are available in the gdb module:
[Function]gdb.current_progspace ()This function returns the program space of the currently selected inferior. SeeSection 4.9 [Inferiors and Programs], page 32.
[Function]gdb.progspaces ()Return a sequence of all the progspaces currently known to gdb.
Each progspace is represented by an instance of the gdb.Progspace class.
[Variable]Progspace.filenameThe file name of the progspace as a string.
Chapter 23: Extending gdb 309
[Variable]Progspace.pretty_printersThe pretty_printers attribute is a list of functions. It is used to look up pretty-printers. A Value is passed to each function in order; if the function returns None,then the search continues. Otherwise, the return value should be an object which isused to format the value. See Section 23.2.2.5 [Pretty Printing API], page 294, formore information.
23.2.2.15 Objfiles In Python
gdb loads symbols for an inferior from various symbol-containing files (see Section 18.1[Files], page 201). These include the primary executable file, any shared libraries used bythe inferior, and any separate debug info files (see Section 18.2 [Separate Debug Files],page 209). gdb calls these symbol-containing files objfiles.
The following objfile-related functions are available in the gdb module:
[Function]gdb.current_objfile ()When auto-loading a Python script (see Section 23.2.3 [Auto-loading], page 321),gdb sets the “current objfile” to the corresponding objfile. This function returns thecurrent objfile. If there is no current objfile, this function returns None.
[Function]gdb.objfiles ()Return a sequence of all the objfiles current known to gdb. See Section 23.2.2.15[Objfiles In Python], page 309.
Each objfile is represented by an instance of the gdb.Objfile class.
[Variable]Objfile.filenameThe file name of the objfile as a string.
[Variable]Objfile.pretty_printersThe pretty_printers attribute is a list of functions. It is used to look up pretty-printers. A Value is passed to each function in order; if the function returns None,then the search continues. Otherwise, the return value should be an object which isused to format the value. See Section 23.2.2.5 [Pretty Printing API], page 294, formore information.
A gdb.Objfile object has the following methods:
[Function]Objfile.is_valid ()Returns True if the gdb.Objfile object is valid, False if not. A gdb.Objfile objectcan become invalid if the object file it refers to is not loaded in gdb any longer. Allother gdb.Objfile methods will throw an exception if it is invalid at the time themethod is called.
23.2.2.16 Accessing inferior stack frames from Python.
When the debugged program stops, gdb is able to analyze its call stack (see Section 8.1[Stack frames], page 81). The gdb.Frame class represents a frame in the stack. A gdb.Frame
object is only valid while its corresponding frame exists in the inferior’s stack. If you tryto use an invalid frame object, gdb will throw a gdb.error exception (see Section 23.2.2.2[Exception Handling], page 285).
Two gdb.Frame objects can be compared for equality with the == operator, like:
310 Debugging with gdb
(gdb) python print gdb.newest_frame() == gdb.selected_frame ()
True
The following frame-related functions are available in the gdb module:
[Function]gdb.selected_frame ()Return the selected frame object. (see Section 8.3 [Selecting a Frame], page 84).
[Function]gdb.newest_frame ()Return the newest frame object for the selected thread.
[Function]gdb.frame_stop_reason_string (reason)Return a string explaining the reason why gdb stopped unwinding frames, as ex-pressed by the given reason code (an integer, see the unwind_stop_reason methodfurther down in this section).
A gdb.Frame object has the following methods:
[Function]Frame.is_valid ()Returns true if the gdb.Frame object is valid, false if not. A frame objectcan become invalid if the frame it refers to doesn’t exist anymore in theinferior. All gdb.Frame methods will throw an exception if it is invalidat the time the method is called.
[Function]Frame.name ()Returns the function name of the frame, or None if it can’t be obtained.
[Function]Frame.type ()Returns the type of the frame. The value can be one of:
gdb.NORMAL_FRAME
An ordinary stack frame.
gdb.DUMMY_FRAME
A fake stack frame that was created by gdb when performingan inferior function call.
gdb.INLINE_FRAME
A frame representing an inlined function. The function wasinlined into a gdb.NORMAL_FRAME that is older than this one.
gdb.TAILCALL_FRAME
A frame representing a tail call. See Section 11.2 [Tail CallFrames], page 132.
gdb.SIGTRAMP_FRAME
A signal trampoline frame. This is the frame created by theOS when it calls into a signal handler.
gdb.ARCH_FRAME
A fake stack frame representing a cross-architecture call.
gdb.SENTINEL_FRAME
This is like gdb.NORMAL_FRAME, but it is only used for thenewest frame.
Chapter 23: Extending gdb 311
[Function]Frame.unwind_stop_reason ()Return an integer representing the reason why it’s not possible to findmore frames toward the outermost frame. Use gdb.frame_stop_reason_string to convert the value returned by this function to a string. Thevalue can be one of:
gdb.FRAME_UNWIND_NO_REASON
No particular reason (older frames should be available).
gdb.FRAME_UNWIND_NULL_ID
The previous frame’s analyzer returns an invalid result.
gdb.FRAME_UNWIND_OUTERMOST
This frame is the outermost.
gdb.FRAME_UNWIND_UNAVAILABLE
Cannot unwind further, because that would require knowingthe values of registers or memory that have not been col-lected.
gdb.FRAME_UNWIND_INNER_ID
This frame ID looks like it ought to belong to a NEXT frame,but we got it for a PREV frame. Normally, this is a sign ofunwinder failure. It could also indicate stack corruption.
gdb.FRAME_UNWIND_SAME_ID
This frame has the same ID as the previous one. That meansthat unwinding further would almost certainly give us an-other frame with exactly the same ID, so break the chain.Normally, this is a sign of unwinder failure. It could alsoindicate stack corruption.
gdb.FRAME_UNWIND_NO_SAVED_PC
The frame unwinder did not find any saved PC, but weneeded one to unwind further.
gdb.FRAME_UNWIND_FIRST_ERROR
Any stop reason greater or equal to this value indicates somekind of error. This special value facilitates writing code thattests for errors in unwinding in a way that will work correctlyeven if the list of the other values is modified in future gdbversions. Using it, you could write:
reason = gdb.selected_frame().unwind_stop_reason ()
reason_str = gdb.frame_stop_reason_string (reason)
if reason >= gdb.FRAME_UNWIND_FIRST_ERROR:
print "An error occured: %s" % reason_str
[Function]Frame.pc ()Returns the frame’s resume address.
[Function]Frame.block ()Return the frame’s code block. See Section 23.2.2.17 [Blocks In Python],page 312.
312 Debugging with gdb
[Function]Frame.function ()Return the symbol for the function corresponding to this frame. SeeSection 23.2.2.18 [Symbols In Python], page 313.
[Function]Frame.older ()Return the frame that called this frame.
[Function]Frame.newer ()Return the frame called by this frame.
[Function]Frame.find_sal ()Return the frame’s symtab and line object. See Section 23.2.2.19 [SymbolTables In Python], page 316.
[Function]Frame.read_var (variable [, block])Return the value of variable in this frame. If the optional argumentblock is provided, search for the variable from that block; otherwise startat the frame’s current block (which is determined by the frame’s currentprogram counter). variable must be a string or a gdb.Symbol object.block must be a gdb.Block object.
[Function]Frame.select ()Set this frame to be the selected frame. See Chapter 8 [Examining theStack], page 81.
23.2.2.17 Accessing frame blocks from Python.
Within each frame, gdb maintains information on each block stored in that frame. Theseblocks are organized hierarchically, and are represented individually in Python as agdb.Block. Please see Section 23.2.2.16 [Frames In Python], page 309, for a more in-depthdiscussion on frames. Furthermore, see Chapter 8 [Examining the Stack], page 81, formore detailed technical information on gdb’s book-keeping of the stack.
The following block-related functions are available in the gdb module:
[Function]gdb.block_for_pc (pc)Return the gdb.Block containing the given pc value. If the block cannot be foundfor the pc value specified, the function will return None.
A gdb.Block object has the following methods:
[Function]Block.is_valid ()Returns True if the gdb.Block object is valid, False if not. A blockobject can become invalid if the block it refers to doesn’t exist anymorein the inferior. All other gdb.Block methods will throw an exception ifit is invalid at the time the method is called. This method is also madeavailable to the Python iterator object that gdb.Block provides in aniteration context and via the Python iter built-in function.
A gdb.Block object has the following attributes:
[Variable]Block.startThe start address of the block. This attribute is not writable.
Chapter 23: Extending gdb 313
[Variable]Block.endThe end address of the block. This attribute is not writable.
[Variable]Block.functionThe name of the block represented as a gdb.Symbol. If the block is notnamed, then this attribute holds None. This attribute is not writable.
[Variable]Block.superblockThe block containing this block. If this parent block does not exist, thisattribute holds None. This attribute is not writable.
[Variable]Block.global_blockThe global block associated with this block. This attribute is not writable.
[Variable]Block.static_blockThe static block associated with this block. This attribute is not writable.
[Variable]Block.is_globalTrue if the gdb.Block object is a global block, False if not. This at-tribute is not writable.
[Variable]Block.is_staticTrue if the gdb.Block object is a static block, False if not. This attributeis not writable.
23.2.2.18 Python representation of Symbols.
gdb represents every variable, function and type as an entry in a symbol table. SeeChapter 16 [Examining the Symbol Table], page 189. Similarly, Python represents thesesymbols in gdb with the gdb.Symbol object.
The following symbol-related functions are available in the gdb module:
[Function]gdb.lookup_symbol (name [, block [, domain]])This function searches for a symbol by name. The search scope can be restricted tothe parameters defined in the optional domain and block arguments.
name is the name of the symbol. It must be a string. The optional block argumentrestricts the search to symbols visible in that block. The block argument must be agdb.Block object. If omitted, the block for the current frame is used. The optionaldomain argument restricts the search to the domain type. The domain argumentmust be a domain constant defined in the gdb module and described later in thischapter.
The result is a tuple of two elements. The first element is a gdb.Symbol object orNone if the symbol is not found. If the symbol is found, the second element is True ifthe symbol is a field of a method’s object (e.g., this in C++), otherwise it is False.If the symbol is not found, the second element is False.
[Function]gdb.lookup_global_symbol (name [, domain])This function searches for a global symbol by name. The search scope can be restrictedto by the domain argument.
314 Debugging with gdb
name is the name of the symbol. It must be a string. The optional domain argumentrestricts the search to the domain type. The domain argument must be a domainconstant defined in the gdb module and described later in this chapter.
The result is a gdb.Symbol object or None if the symbol is not found.
A gdb.Symbol object has the following attributes:
[Variable]Symbol.typeThe type of the symbol or None if no type is recorded. This attribute isrepresented as a gdb.Type object. See Section 23.2.2.4 [Types In Python],page 290. This attribute is not writable.
[Variable]Symbol.symtabThe symbol table in which the symbol appears. This attribute is repre-sented as a gdb.Symtab object. See Section 23.2.2.19 [Symbol Tables InPython], page 316. This attribute is not writable.
[Variable]Symbol.nameThe name of the symbol as a string. This attribute is not writable.
[Variable]Symbol.linkage_nameThe name of the symbol, as used by the linker (i.e., may be mangled).This attribute is not writable.
[Variable]Symbol.print_nameThe name of the symbol in a form suitable for output. This is either nameor linkage_name, depending on whether the user asked gdb to displaydemangled or mangled names.
[Variable]Symbol.addr_classThe address class of the symbol. This classifies how to find the value of asymbol. Each address class is a constant defined in the gdb module anddescribed later in this chapter.
[Variable]Symbol.is_argumentTrue if the symbol is an argument of a function.
[Variable]Symbol.is_constantTrue if the symbol is a constant.
[Variable]Symbol.is_functionTrue if the symbol is a function or a method.
[Variable]Symbol.is_variableTrue if the symbol is a variable.
A gdb.Symbol object has the following methods:
[Function]Symbol.is_valid ()Returns True if the gdb.Symbol object is valid, False if not. Agdb.Symbol object can become invalid if the symbol it refers to does notexist in gdb any longer. All other gdb.Symbol methods will throw anexception if it is invalid at the time the method is called.
Chapter 23: Extending gdb 315
The available domain categories in gdb.Symbol are represented as constants in the gdbmodule:
gdb.SYMBOL_UNDEF_DOMAIN
This is used when a domain has not been discovered or none of the followingdomains apply. This usually indicates an error either in the symbol informationor in gdb’s handling of symbols.
gdb.SYMBOL_VAR_DOMAIN
This domain contains variables, function names, typedef names and enum typevalues.
gdb.SYMBOL_STRUCT_DOMAIN
This domain holds struct, union and enum type names.
gdb.SYMBOL_LABEL_DOMAIN
This domain contains names of labels (for gotos).
gdb.SYMBOL_VARIABLES_DOMAIN
This domain holds a subset of the SYMBOLS_VAR_DOMAIN; it contains everythingminus functions and types.
gdb.SYMBOL_FUNCTION_DOMAIN
This domain contains all functions.
gdb.SYMBOL_TYPES_DOMAIN
This domain contains all types.
The available address class categories in gdb.Symbol are represented as constants in thegdb module:
gdb.SYMBOL_LOC_UNDEF
If this is returned by address class, it indicates an error either in the symbolinformation or in gdb’s handling of symbols.
gdb.SYMBOL_LOC_CONST
Value is constant int.
gdb.SYMBOL_LOC_STATIC
Value is at a fixed address.
gdb.SYMBOL_LOC_REGISTER
Value is in a register.
gdb.SYMBOL_LOC_ARG
Value is an argument. This value is at the offset stored within the symbol insidethe frame’s argument list.
gdb.SYMBOL_LOC_REF_ARG
Value address is stored in the frame’s argument list. Just like LOC_ARG exceptthat the value’s address is stored at the offset, not the value itself.
gdb.SYMBOL_LOC_REGPARM_ADDR
Value is a specified register. Just like LOC_REGISTER except the register holdsthe address of the argument instead of the argument itself.
316 Debugging with gdb
gdb.SYMBOL_LOC_LOCAL
Value is a local variable.
gdb.SYMBOL_LOC_TYPEDEF
Value not used. Symbols in the domain SYMBOL_STRUCT_DOMAIN all have thisclass.
gdb.SYMBOL_LOC_BLOCK
Value is a block.
gdb.SYMBOL_LOC_CONST_BYTES
Value is a byte-sequence.
gdb.SYMBOL_LOC_UNRESOLVED
Value is at a fixed address, but the address of the variable has to be determinedfrom the minimal symbol table whenever the variable is referenced.
gdb.SYMBOL_LOC_OPTIMIZED_OUT
The value does not actually exist in the program.
gdb.SYMBOL_LOC_COMPUTED
The value’s address is a computed location.
23.2.2.19 Symbol table representation in Python.
Access to symbol table data maintained by gdb on the inferior is exposed to Python via twoobjects: gdb.Symtab_and_line and gdb.Symtab. Symbol table and line data for a frameis returned from the find_sal method in gdb.Frame object. See Section 23.2.2.16 [FramesIn Python], page 309.
For more information on gdb’s symbol table management, see Chapter 16 [Examiningthe Symbol Table], page 189, for more information.
A gdb.Symtab_and_line object has the following attributes:
[Variable]Symtab_and_line.symtabThe symbol table object (gdb.Symtab) for this frame. This attribute isnot writable.
[Variable]Symtab_and_line.pcIndicates the current program counter address. This attribute is notwritable.
[Variable]Symtab_and_line.lineIndicates the current line number for this object. This attribute is notwritable.
A gdb.Symtab_and_line object has the following methods:
[Function]Symtab_and_line.is_valid ()Returns True if the gdb.Symtab_and_line object is valid, False if not.A gdb.Symtab_and_line object can become invalid if the Symbol tableand line object it refers to does not exist in gdb any longer. All othergdb.Symtab_and_line methods will throw an exception if it is invalid atthe time the method is called.
Chapter 23: Extending gdb 317
A gdb.Symtab object has the following attributes:
[Variable]Symtab.filenameThe symbol table’s source filename. This attribute is not writable.
[Variable]Symtab.objfileThe symbol table’s backing object file. See Section 23.2.2.15 [Objfiles InPython], page 309. This attribute is not writable.
A gdb.Symtab object has the following methods:
[Function]Symtab.is_valid ()Returns True if the gdb.Symtab object is valid, False if not. Agdb.Symtab object can become invalid if the symbol table it refers todoes not exist in gdb any longer. All other gdb.Symtab methods willthrow an exception if it is invalid at the time the method is called.
[Function]Symtab.fullname ()Return the symbol table’s source absolute file name.
23.2.2.20 Manipulating breakpoints using Python
Python code can manipulate breakpoints via the gdb.Breakpoint class.
[Function]Breakpoint.__init__ (spec [, type [, wp class [,internal]]])Create a new breakpoint. spec is a string naming the location of the breakpoint, oran expression that defines a watchpoint. The contents can be any location recognizedby the break command, or in the case of a watchpoint, by the watch command. Theoptional type denotes the breakpoint to create from the types defined later in thischapter. This argument can be either: gdb.BP_BREAKPOINT or gdb.BP_WATCHPOINT.type defaults to gdb.BP_BREAKPOINT. The optional internal argument allows thebreakpoint to become invisible to the user. The breakpoint will neither be reportedwhen created, nor will it be listed in the output from info breakpoints (but willbe listed with the maint info breakpoints command). The optional wp class argu-ment defines the class of watchpoint to create, if type is gdb.BP_WATCHPOINT. If awatchpoint class is not provided, it is assumed to be a gdb.WP_WRITE class.
[Function]Breakpoint.stop (self)The gdb.Breakpoint class can be sub-classed and, in particular, you may chooseto implement the stop method. If this method is defined as a sub-class ofgdb.Breakpoint, it will be called when the inferior reaches any location of abreakpoint which instantiates that sub-class. If the method returns True, the inferiorwill be stopped at the location of the breakpoint, otherwise the inferior will continue.
If there are multiple breakpoints at the same location with a stop method, each onewill be called regardless of the return status of the previous. This ensures that allstop methods have a chance to execute at that location. In this scenario if one of themethods returns True but the others return False, the inferior will still be stopped.
You should not alter the execution state of the inferior (i.e., step, next, etc.), alter thecurrent frame context (i.e., change the current active frame), or alter, add or delete
318 Debugging with gdb
any breakpoint. As a general rule, you should not alter any data within gdb or theinferior at this time.
Example stop implementation:
class MyBreakpoint (gdb.Breakpoint):
def stop (self):
inf_val = gdb.parse_and_eval("foo")
if inf_val == 3:
return True
return False
The available watchpoint types represented by constants are defined in the gdb module:
gdb.WP_READ
Read only watchpoint.
gdb.WP_WRITE
Write only watchpoint.
gdb.WP_ACCESS
Read/Write watchpoint.
[Function]Breakpoint.is_valid ()Return True if this Breakpoint object is valid, False otherwise. A Breakpoint
object can become invalid if the user deletes the breakpoint. In this case, the objectstill exists, but the underlying breakpoint does not. In the cases of watchpoint scope,the watchpoint remains valid even if execution of the inferior leaves the scope of thatwatchpoint.
[Function]Breakpoint.deletePermanently deletes the gdb breakpoint. This also invalidates the PythonBreakpoint object. Any further access to this object’s attributes or methods willraise an error.
[Variable]Breakpoint.enabledThis attribute is True if the breakpoint is enabled, and False otherwise. This at-tribute is writable.
[Variable]Breakpoint.silentThis attribute is True if the breakpoint is silent, and False otherwise. This attributeis writable.
Note that a breakpoint can also be silent if it has commands and the first commandis silent. This is not reported by the silent attribute.
[Variable]Breakpoint.threadIf the breakpoint is thread-specific, this attribute holds the thread id. If the break-point is not thread-specific, this attribute is None. This attribute is writable.
[Variable]Breakpoint.taskIf the breakpoint is Ada task-specific, this attribute holds the Ada task id. If thebreakpoint is not task-specific (or the underlying language is not Ada), this attributeis None. This attribute is writable.
Chapter 23: Extending gdb 319
[Variable]Breakpoint.ignore_countThis attribute holds the ignore count for the breakpoint, an integer. This attributeis writable.
[Variable]Breakpoint.numberThis attribute holds the breakpoint’s number — the identifier used by the user tomanipulate the breakpoint. This attribute is not writable.
[Variable]Breakpoint.typeThis attribute holds the breakpoint’s type — the identifier used to determine theactual breakpoint type or use-case. This attribute is not writable.
[Variable]Breakpoint.visibleThis attribute tells whether the breakpoint is visible to the user when set, or whenthe ‘info breakpoints’ command is run. This attribute is not writable.
The available types are represented by constants defined in the gdb module:
gdb.BP_BREAKPOINT
Normal code breakpoint.
gdb.BP_WATCHPOINT
Watchpoint breakpoint.
gdb.BP_HARDWARE_WATCHPOINT
Hardware assisted watchpoint.
gdb.BP_READ_WATCHPOINT
Hardware assisted read watchpoint.
gdb.BP_ACCESS_WATCHPOINT
Hardware assisted access watchpoint.
[Variable]Breakpoint.hit_countThis attribute holds the hit count for the breakpoint, an integer. This attribute iswritable, but currently it can only be set to zero.
[Variable]Breakpoint.locationThis attribute holds the location of the breakpoint, as specified by the user. It is astring. If the breakpoint does not have a location (that is, it is a watchpoint) theattribute’s value is None. This attribute is not writable.
[Variable]Breakpoint.expressionThis attribute holds a breakpoint expression, as specified by the user. It is a string.If the breakpoint does not have an expression (the breakpoint is not a watchpoint)the attribute’s value is None. This attribute is not writable.
[Variable]Breakpoint.conditionThis attribute holds the condition of the breakpoint, as specified by the user. It isa string. If there is no condition, this attribute’s value is None. This attribute iswritable.
320 Debugging with gdb
[Variable]Breakpoint.commandsThis attribute holds the commands attached to the breakpoint. If there are com-mands, this attribute’s value is a string holding all the commands, separated bynewlines. If there are no commands, this attribute is None. This attribute is notwritable.
23.2.2.21 Finish Breakpoints
A finish breakpoint is a temporary breakpoint set at the return address of a frame, basedon the finish command. gdb.FinishBreakpoint extends gdb.Breakpoint. The underly-ing breakpoint will be disabled and deleted when the execution will run out of the break-point scope (i.e. Breakpoint.stop or FinishBreakpoint.out_of_scope triggered). Finishbreakpoints are thread specific and must be create with the right thread selected.
[Function]FinishBreakpoint.__init__ ([frame] [, internal])Create a finish breakpoint at the return address of the gdb.Frame object frame.If frame is not provided, this defaults to the newest frame. The optional internalargument allows the breakpoint to become invisible to the user. See Section 23.2.2.20[Breakpoints In Python], page 317, for further details about this argument.
[Function]FinishBreakpoint.out_of_scope (self)In some circumstances (e.g. longjmp, C++ exceptions, gdb return command, . . . ), afunction may not properly terminate, and thus never hit the finish breakpoint. Whengdb notices such a situation, the out_of_scope callback will be triggered.
You may want to sub-class gdb.FinishBreakpoint and override this method:class MyFinishBreakpoint (gdb.FinishBreakpoint)
def stop (self):
print "normal finish"
return True
def out_of_scope ():
print "abnormal finish"
[Variable]FinishBreakpoint.return_valueWhen gdb is stopped at a finish breakpoint and the frame used to build thegdb.FinishBreakpoint object had debug symbols, this attribute will contain agdb.Value object corresponding to the return value of the function. The value willbe None if the function return type is void or if the return value was not computable.This attribute is not writable.
23.2.2.22 Python representation of lazy strings.
A lazy string is a string whose contents is not retrieved or encoded until it is needed.
A gdb.LazyString is represented in gdb as an address that points to a region of mem-ory, an encoding that will be used to encode that region of memory, and a length to delimitthe region of memory that represents the string. The difference between a gdb.LazyString
and a string wrapped within a gdb.Value is that a gdb.LazyString will be treated differ-ently by gdb when printing. A gdb.LazyString is retrieved and encoded during printing,while a gdb.Value wrapping a string is immediately retrieved and encoded on creation.
A gdb.LazyString object has the following functions:
Chapter 23: Extending gdb 321
[Function]LazyString.value ()Convert the gdb.LazyString to a gdb.Value. This value will point to the stringin memory, but will lose all the delayed retrieval, encoding and handling that gdbapplies to a gdb.LazyString.
[Variable]LazyString.addressThis attribute holds the address of the string. This attribute is not writable.
[Variable]LazyString.lengthThis attribute holds the length of the string in characters. If the length is -1, thenthe string will be fetched and encoded up to the first null of appropriate width. Thisattribute is not writable.
[Variable]LazyString.encodingThis attribute holds the encoding that will be applied to the string when the stringis printed by gdb. If the encoding is not set, or contains an empty string, then gdbwill select the most appropriate encoding when the string is printed. This attributeis not writable.
[Variable]LazyString.typeThis attribute holds the type that is represented by the lazy string’s type. For a lazystring this will always be a pointer type. To resolve this to the lazy string’s charactertype, use the type’s targetmethod. See Section 23.2.2.4 [Types In Python], page 290.This attribute is not writable.
23.2.3 Auto-loading
When a new object file is read (for example, due to the file command, or because theinferior has loaded a shared library), gdb will look for Python support scripts in severalways: ‘objfile-gdb.py’ and .debug_gdb_scripts section.
The auto-loading feature is useful for supplying application-specific debugging commandsand scripts.
Auto-loading can be enabled or disabled, and the list of auto-loaded scripts can beprinted.
set auto-load-scripts [yes|no]
Enable or disable the auto-loading of Python scripts.
show auto-load-scripts
Show whether auto-loading of Python scripts is enabled or disabled.
info auto-load-scripts [regexp]
Print the list of all scripts that gdb auto-loaded.
Also printed is the list of scripts that were mentioned in the .debug_gdb_
scripts section and were not found (see Section 23.2.3.2 [.debug gdb scriptssection], page 322). This is useful because their names are not printed whengdb tries to load them and fails. There may be many of them, and printing anerror message for each one is problematic.
If regexp is supplied only scripts with matching names are printed.
Example:
322 Debugging with gdb
(gdb) info auto-load-scripts
Loaded Script
Yes py-section-script.py
full name: /tmp/py-section-script.py
Missing my-foo-pretty-printers.py
When reading an auto-loaded file, gdb sets the current objfile. This is available via thegdb.current_objfile function (see Section 23.2.2.15 [Objfiles In Python], page 309). Thiscan be useful for registering objfile-specific pretty-printers.
23.2.3.1 The ‘objfile-gdb.py’ file
When a new object file is read, gdb looks for a file named ‘objfile-gdb.py’, where objfileis the object file’s real name, formed by ensuring that the file name is absolute, followingall symlinks, and resolving . and .. components. If this file exists and is readable, gdb willevaluate it as a Python script.
If this file does not exist, and if the parameter debug-file-directory is set (seeSection 18.2 [Separate Debug Files], page 209), then gdb will look for real-name in allof the directories mentioned in the value of debug-file-directory.
Finally, if this file does not exist, then gdb will look for a file named ‘data-directory/python/auto-load/real-name ’, where data-directory is gdb’s data directory(available via show data-directory, see Section 18.5 [Data Files], page 214), andreal-name is the object file’s real name, as described above.
gdb does not track which files it has already auto-loaded this way. gdb will load theassociated script every time the corresponding objfile is opened. So your ‘-gdb.py’ fileshould be careful to avoid errors if it is evaluated more than once.
23.2.3.2 The .debug_gdb_scripts section
For systems using file formats like ELF and COFF, when gdb loads a new object file it willlook for a special section named ‘.debug_gdb_scripts’. If this section exists, its contentsis a list of names of scripts to load.
gdb will look for each specified script file first in the current directory and then alongthe source search path (see Section 9.5 [Specifying Source Directories], page 90), exceptthat ‘$cdir’ is not searched, since the compilation directory is not relevant to scripts.
Entries can be placed in section .debug_gdb_scripts with, for example, this GCCmacro:
/* Note: The "MS" section flags are to remove duplicates. */
#define DEFINE_GDB_SCRIPT(script_name) \
asm("\
.pushsection \".debug_gdb_scripts\", \"MS\",@progbits,1\n\
.byte 1\n\
.asciz \"" script_name "\"\n\
.popsection \n\
");
Then one can reference the macro in a header or source file like this:
DEFINE_GDB_SCRIPT ("my-app-scripts.py")
The script name may include directories if desired.
Chapter 23: Extending gdb 323
If the macro is put in a header, any application or library using this header will get areference to the specified script.
23.2.3.3 Which flavor to choose?
Given the multiple ways of auto-loading Python scripts, it might not always be clear whichone to choose. This section provides some guidance.
Benefits of the ‘-gdb.py’ way:
• Can be used with file formats that don’t support multiple sections.
• Ease of finding scripts for public libraries.
Scripts specified in the .debug_gdb_scripts section are searched for in the sourcesearch path. For publicly installed libraries, e.g., ‘libstdc++’, there typically isn’t asource directory in which to find the script.
• Doesn’t require source code additions.
Benefits of the .debug_gdb_scripts way:
• Works with static linking.
Scripts for libraries done the ‘-gdb.py’ way require an objfile to trigger their loading.When an application is statically linked the only objfile available is the executable, andit is cumbersome to attach all the scripts from all the input libraries to the executable’s‘-gdb.py’ script.
• Works with classes that are entirely inlined.
Some classes can be entirely inlined, and thus there may not be an associated sharedlibrary to attach a ‘-gdb.py’ script to.
• Scripts needn’t be copied out of the source tree.
In some circumstances, apps can be built out of large collections of internal libraries,and the build infrastructure necessary to install the ‘-gdb.py’ scripts in a place wheregdb can find them is cumbersome. It may be easier to specify the scripts in the.debug_gdb_scripts section as relative paths, and add a path to the top of the sourcetree to the source search path.
23.2.4 Python modules
gdb comes with several modules to assist writing Python code.
23.2.4.1 gdb.printing
This module provides a collection of utilities for working with pretty-printers.
PrettyPrinter (name, subprinters=None)
This class specifies the API that makes ‘info pretty-printer’, ‘enablepretty-printer’ and ‘disable pretty-printer’ work. Pretty-printersshould generally inherit from this class.
SubPrettyPrinter (name)
For printers that handle multiple types, this class specifies the correspondingAPI for the subprinters.
324 Debugging with gdb
RegexpCollectionPrettyPrinter (name)
Utility class for handling multiple printers, all recognized via regular expres-sions. See Section 23.2.2.7 [Writing a Pretty-Printer], page 296, for an example.
register_pretty_printer (obj, printer, replace=False)
Register printer with the pretty-printer list of obj. If replace is True then anyexisting copy of the printer is replaced. Otherwise a RuntimeError exceptionis raised if a printer with the same name already exists.
23.2.4.2 gdb.types
This module provides a collection of utilities for working with gdb.Types objects.
get_basic_type (type)
Return type with const and volatile qualifiers stripped, and with typedefs andC++ references converted to the underlying type.
C++ example:typedef const int const_int;
const_int foo (3);
const_int& foo_ref (foo);
int main () { return 0; }
Then in gdb:(gdb) start
(gdb) python import gdb.types
(gdb) python foo_ref = gdb.parse_and_eval("foo_ref")
(gdb) python print gdb.types.get_basic_type(foo_ref.type)
int
has_field (type, field)
Return True if type, assumed to be a type with fields (e.g., a structure orunion), has field field.
make_enum_dict (enum_type)
Return a Python dictionary type produced from enum type.
deep_items (type)
Returns a Python iterator similar to the standard gdb.Type.iteritems
method, except that the iterator returned by deep_items will recursivelytraverse anonymous struct or union fields. For example:
struct A
{
int a;
union {
int b0;
int b1;
};
};
Then in gdb:(gdb) python import gdb.types
(gdb) python struct_a = gdb.lookup_type("struct A")
(gdb) python print struct_a.keys ()
{[’a’, ’’]}
(gdb) python print [k for k,v in gdb.types.deep_items(struct_a)]
{[’a’, ’b0’, ’b1’]}
Chapter 23: Extending gdb 325
23.2.4.3 gdb.prompt
This module provides a method for prompt value-substitution.
substitute_prompt (string)
Return string with escape sequences substituted by values. Some escape se-quences take arguments. You can specify arguments inside “{}” immediatelyfollowing the escape sequence.
The escape sequences you can pass to this function are:
\\ Substitute a backslash.
\e Substitute an ESC character.
\f Substitute the selected frame; an argument names a frame param-eter.
\n Substitute a newline.
\p Substitute a parameter’s value; the argument names the parameter.
\r Substitute a carriage return.
\t Substitute the selected thread; an argument names a thread pa-rameter.
\v Substitute the version of GDB.
\w Substitute the current working directory.
\[ Begin a sequence of non-printing characters. These sequences aretypically used with the ESC character, and are not counted in thestring length. Example: “\[\e[0;34m\](gdb)\[\e[0m\]” will returna blue-colored “(gdb)” prompt where the length is five.
\] End a sequence of non-printing characters.
For example:substitute_prompt (‘‘frame: \f,
print arguments: \p{print frame-arguments}’’)
will return the string:
"frame: main, print arguments: scalars"
23.3 Creating new spellings of existing commands
It is often useful to define alternate spellings of existing commands. For example, if anew gdb command defined in Python has a long name to type, it is handy to have anabbreviated version of it that involves less typing.
gdb itself uses aliases. For example ‘s’ is an alias of the ‘step’ command even thoughit is otherwise an ambiguous abbreviation of other commands like ‘set’ and ‘show’.
Aliases are also used to provide shortened or more common versions of multi-word com-mands. For example, gdb provides the ‘tty’ alias of the ‘set inferior-tty’ command.
You can define a new alias with the ‘alias’ command.
326 Debugging with gdb
alias [-a] [--] ALIAS = COMMAND
ALIAS specifies the name of the new alias. Each word of ALIAS must consist of letters,numbers, dashes and underscores.
COMMAND specifies the name of an existing command that is being aliased.
The ‘-a’ option specifies that the new alias is an abbreviation of the command. Abbre-viations are not shown in command lists displayed by the ‘help’ command.
The ‘--’ option specifies the end of options, and is useful when ALIAS begins with adash.
Here is a simple example showing how to make an abbreviation of a command so thatthere is less to type. Suppose you were tired of typing ‘disas’, the current shortest un-ambiguous abbreviation of the ‘disassemble’ command and you wanted an even shorterversion named ‘di’. The following will accomplish this.
(gdb) alias -a di = disas
Note that aliases are different from user-defined commands. With a user-defined com-mand, you also need to write documentation for it with the ‘document’ command. An aliasautomatically picks up the documentation of the existing command.
Here is an example where we make ‘elms’ an abbreviation of ‘elements’ in the ‘setprint elements’ command. This is to show that you can make an abbreviation of any partof a command.
(gdb) alias -a set print elms = set print elements
(gdb) alias -a show print elms = show print elements
(gdb) set p elms 20
(gdb) show p elms
Limit on string chars or array elements to print is 200.
Note that if you are defining an alias of a ‘set’ command, and you want to have an aliasfor the corresponding ‘show’ command, then you need to define the latter separately.
Unambiguously abbreviated commands are allowed in COMMAND and ALIAS, just asthey are normally.
(gdb) alias -a set pr elms = set p ele
Finally, here is an example showing the creation of a one word alias for a more complexcommand. This creates alias ‘spe’ of the command ‘set print elements’.
(gdb) alias spe = set print elements
(gdb) spe 20
Chapter 24: Command Interpreters 327
24 Command Interpreters
gdb supports multiple command interpreters, and some command infrastructure to allowusers or user interface writers to switch between interpreters or run commands in otherinterpreters.
gdb currently supports two command interpreters, the console interpreter (sometimescalled the command-line interpreter or cli) and the machine interface interpreter (orgdb/mi). This manual describes both of these interfaces in great detail.
By default, gdb will start with the console interpreter. However, the user may chooseto start gdb with another interpreter by specifying the ‘-i’ or ‘--interpreter’ startupoptions. Defined interpreters include:
console The traditional console or command-line interpreter. This is the most oftenused interpreter with gdb. With no interpreter specified at runtime, gdb willuse this interpreter.
mi The newest gdb/mi interface (currently mi2). Used primarily by programswishing to use gdb as a backend for a debugger GUI or an IDE. For moreinformation, see Chapter 27 [The gdb/mi Interface], page 337.
mi2 The current gdb/mi interface.
mi1 The gdb/mi interface included in gdb 5.1, 5.2, and 5.3.
The interpreter being used by gdb may not be dynamically switched at runtime. Al-though possible, this could lead to a very precarious situation. Consider an IDE usinggdb/mi. If a user enters the command "interpreter-set console" in a console view, gdbwould switch to using the console interpreter, rendering the IDE inoperable!
Although you may only choose a single interpreter at startup, you may execute com-mands in any interpreter from the current interpreter using the appropriate command. Ifyou are running the console interpreter, simply use the interpreter-exec command:
interpreter-exec mi "-data-list-register-names"
gdb/mi has a similar command, although it is only available in versions of gdb whichsupport gdb/mi version 2 (or greater).

Chapter 25: gdb Text User Interface 329
25 gdb Text User Interface
The gdb Text User Interface (TUI) is a terminal interface which uses the curses libraryto show the source file, the assembly output, the program registers and gdb commands inseparate text windows. The TUI mode is supported only on platforms where a suitableversion of the curses library is available.
The TUI mode is enabled by default when you invoke gdb as either ‘gdbtui’ or ‘gdb-tui’. You can also switch in and out of TUI mode while gdb runs by using variousTUI commands and key bindings, such as C-x C-a. See Section 25.2 [TUI Key Bindings],page 330.
25.1 TUI Overview
In TUI mode, gdb can display several text windows:
command This window is the gdb command window with the gdb prompt and the gdboutput. The gdb input is still managed using readline.
source The source window shows the source file of the program. The current line andactive breakpoints are displayed in this window.
assembly The assembly window shows the disassembly output of the program.
register This window shows the processor registers. Registers are highlighted when theirvalues change.
The source and assembly windows show the current program position by highlighting thecurrent line and marking it with a ‘>’ marker. Breakpoints are indicated with two markers.The first marker indicates the breakpoint type:
B Breakpoint which was hit at least once.
b Breakpoint which was never hit.
H Hardware breakpoint which was hit at least once.
h Hardware breakpoint which was never hit.
The second marker indicates whether the breakpoint is enabled or not:
+ Breakpoint is enabled.
- Breakpoint is disabled.
The source, assembly and register windows are updated when the current thread changes,when the frame changes, or when the program counter changes.
These windows are not all visible at the same time. The command window is alwaysvisible. The others can be arranged in several layouts:
• source only,
• assembly only,
• source and assembly,
• source and registers, or
• assembly and registers.
330 Debugging with gdb
A status line above the command window shows the following information:
target Indicates the current gdb target. (see Chapter 19 [Specifying a DebuggingTarget], page 215).
process Gives the current process or thread number. When no process is being de-bugged, this field is set to No process.
function Gives the current function name for the selected frame. The name is demangledif demangling is turned on (see Section 10.8 [Print Settings], page 106). Whenthere is no symbol corresponding to the current program counter, the string ??
is displayed.
line Indicates the current line number for the selected frame. When the current linenumber is not known, the string ?? is displayed.
pc Indicates the current program counter address.
25.2 TUI Key Bindings
The TUI installs several key bindings in the readline keymaps (see Chapter 31 [CommandLine Editing], page 423). The following key bindings are installed for both TUI mode andthe gdb standard mode.
C-x C-a
C-x a
C-x A Enter or leave the TUI mode. When leaving the TUI mode, the curses windowmanagement stops and gdb operates using its standard mode, writing on theterminal directly. When reentering the TUI mode, control is given back to thecurses windows. The screen is then refreshed.
C-x 1 Use a TUI layout with only one window. The layout will either be ‘source’ or‘assembly’. When the TUI mode is not active, it will switch to the TUI mode.
Think of this key binding as the Emacs C-x 1 binding.
C-x 2 Use a TUI layout with at least two windows. When the current layout alreadyhas two windows, the next layout with two windows is used. When a new layoutis chosen, one window will always be common to the previous layout and thenew one.
Think of it as the Emacs C-x 2 binding.
C-x o Change the active window. The TUI associates several key bindings (likescrolling and arrow keys) with the active window. This command gives thefocus to the next TUI window.
Think of it as the Emacs C-x o binding.
C-x s Switch in and out of the TUI SingleKey mode that binds single keys to gdbcommands (see Section 25.3 [TUI Single Key Mode], page 331).
The following key bindings only work in the TUI mode:
PGUP Scroll the active window one page up.
PGDN Scroll the active window one page down.
Chapter 25: gdb Text User Interface 331
UP Scroll the active window one line up.
DOWN Scroll the active window one line down.
LEFT Scroll the active window one column left.
RIGHT Scroll the active window one column right.
C-L Refresh the screen.
Because the arrow keys scroll the active window in the TUI mode, they are not availablefor their normal use by readline unless the command window has the focus. When anotherwindow is active, you must use other readline key bindings such as C-p, C-n, C-b and C-f
to control the command window.
25.3 TUI Single Key Mode
The TUI also provides a SingleKey mode, which binds several frequently used gdb com-mands to single keys. Type C-x s to switch into this mode, where the following key bindingsare used:
c continue
d down
f finish
n next
q exit the SingleKey mode.
r run
s step
u up
v info locals
w where
Other keys temporarily switch to the gdb command prompt. The key that was pressedis inserted in the editing buffer so that it is possible to type most gdb commands withoutinteraction with the TUI SingleKey mode. Once the command is entered the TUI SingleKeymode is restored. The only way to permanently leave this mode is by typing q or C-x s.
25.4 TUI-specific Commands
The TUI has specific commands to control the text windows. These commands are alwaysavailable, even when gdb is not in the TUI mode. When gdb is in the standard mode,most of these commands will automatically switch to the TUI mode.
Note that if gdb’s stdout is not connected to a terminal, or gdb has been started withthe machine interface interpreter (see Chapter 27 [The gdb/mi Interface], page 337), mostof these commands will fail with an error, because it would not be possible or desirable toenable curses window management.
info win List and give the size of all displayed windows.
332 Debugging with gdb
layout next
Display the next layout.
layout prev
Display the previous layout.
layout src
Display the source window only.
layout asm
Display the assembly window only.
layout split
Display the source and assembly window.
layout regs
Display the register window together with the source or assembly window.
focus next
Make the next window active for scrolling.
focus prev
Make the previous window active for scrolling.
focus src Make the source window active for scrolling.
focus asm Make the assembly window active for scrolling.
focus regs
Make the register window active for scrolling.
focus cmd Make the command window active for scrolling.
refresh Refresh the screen. This is similar to typing C-L.
tui reg float
Show the floating point registers in the register window.
tui reg general
Show the general registers in the register window.
tui reg next
Show the next register group. The list of register groups as well as their orderis target specific. The predefined register groups are the following: general,float, system, vector, all, save, restore.
tui reg system
Show the system registers in the register window.
update Update the source window and the current execution point.
winheight name +count
winheight name -count
Change the height of the window name by count lines. Positive counts increasethe height, while negative counts decrease it.
tabset nchars
Set the width of tab stops to be nchars characters.
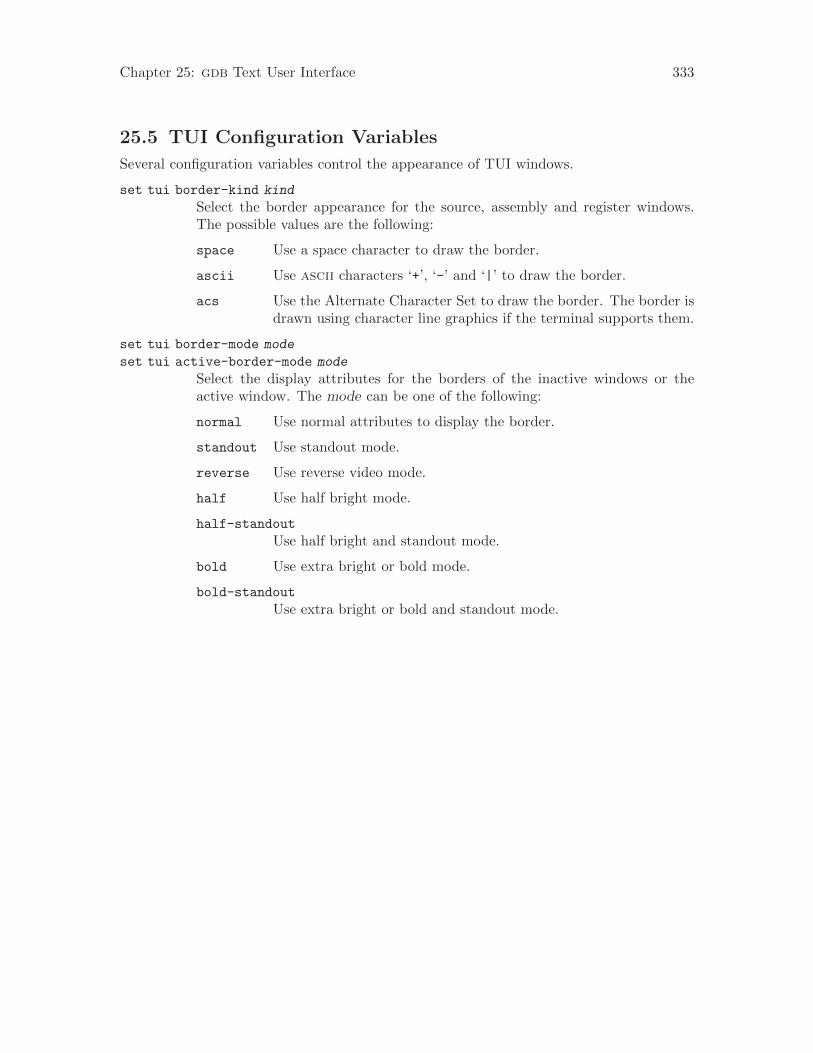
Chapter 25: gdb Text User Interface 333
25.5 TUI Configuration Variables
Several configuration variables control the appearance of TUI windows.
set tui border-kind kind
Select the border appearance for the source, assembly and register windows.The possible values are the following:
space Use a space character to draw the border.
ascii Use ascii characters ‘+’, ‘-’ and ‘|’ to draw the border.
acs Use the Alternate Character Set to draw the border. The border isdrawn using character line graphics if the terminal supports them.
set tui border-mode mode
set tui active-border-mode mode
Select the display attributes for the borders of the inactive windows or theactive window. The mode can be one of the following:
normal Use normal attributes to display the border.
standout Use standout mode.
reverse Use reverse video mode.
half Use half bright mode.
half-standout
Use half bright and standout mode.
bold Use extra bright or bold mode.
bold-standout
Use extra bright or bold and standout mode.

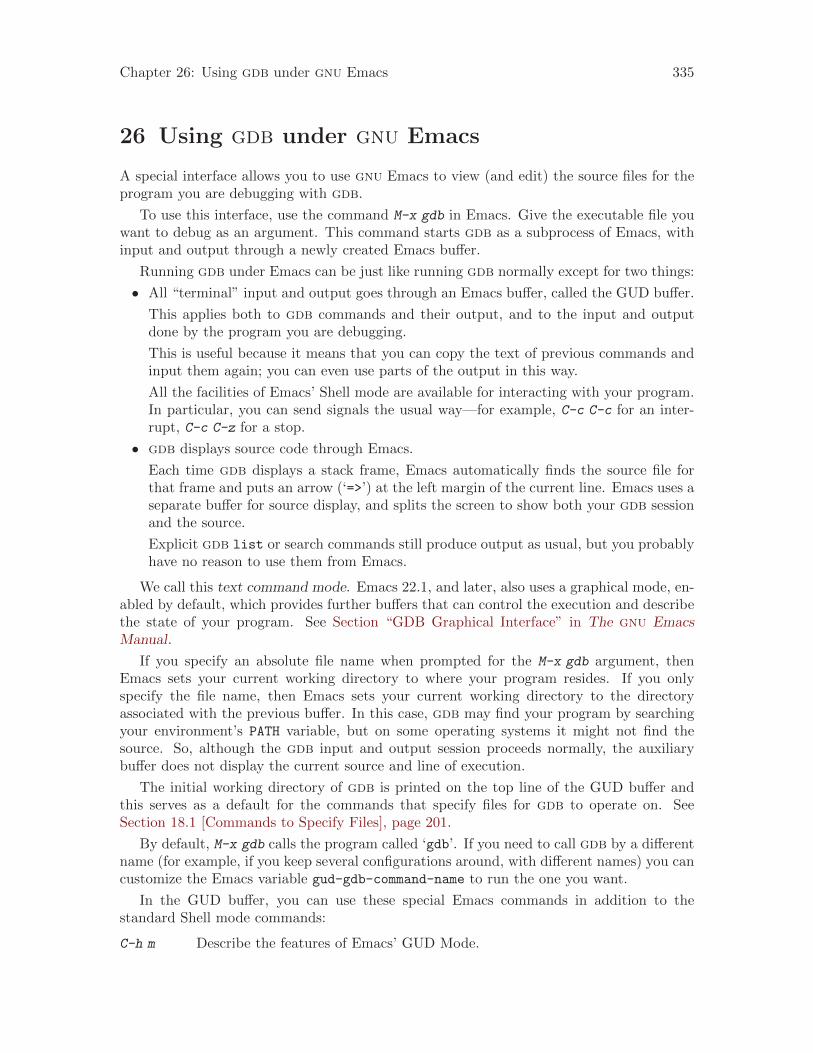
Chapter 26: Using gdb under gnu Emacs 335
26 Using gdb under gnu Emacs
A special interface allows you to use gnu Emacs to view (and edit) the source files for theprogram you are debugging with gdb.
To use this interface, use the command M-x gdb in Emacs. Give the executable file youwant to debug as an argument. This command starts gdb as a subprocess of Emacs, withinput and output through a newly created Emacs buffer.
Running gdb under Emacs can be just like running gdb normally except for two things:
• All “terminal” input and output goes through an Emacs buffer, called the GUD buffer.
This applies both to gdb commands and their output, and to the input and outputdone by the program you are debugging.
This is useful because it means that you can copy the text of previous commands andinput them again; you can even use parts of the output in this way.
All the facilities of Emacs’ Shell mode are available for interacting with your program.In particular, you can send signals the usual way—for example, C-c C-c for an inter-rupt, C-c C-z for a stop.
• gdb displays source code through Emacs.
Each time gdb displays a stack frame, Emacs automatically finds the source file forthat frame and puts an arrow (‘=>’) at the left margin of the current line. Emacs uses aseparate buffer for source display, and splits the screen to show both your gdb sessionand the source.
Explicit gdb list or search commands still produce output as usual, but you probablyhave no reason to use them from Emacs.
We call this text command mode. Emacs 22.1, and later, also uses a graphical mode, en-abled by default, which provides further buffers that can control the execution and describethe state of your program. See Section “GDB Graphical Interface” in The gnu EmacsManual.
If you specify an absolute file name when prompted for the M-x gdb argument, thenEmacs sets your current working directory to where your program resides. If you onlyspecify the file name, then Emacs sets your current working directory to the directoryassociated with the previous buffer. In this case, gdb may find your program by searchingyour environment’s PATH variable, but on some operating systems it might not find thesource. So, although the gdb input and output session proceeds normally, the auxiliarybuffer does not display the current source and line of execution.
The initial working directory of gdb is printed on the top line of the GUD buffer andthis serves as a default for the commands that specify files for gdb to operate on. SeeSection 18.1 [Commands to Specify Files], page 201.
By default, M-x gdb calls the program called ‘gdb’. If you need to call gdb by a differentname (for example, if you keep several configurations around, with different names) you cancustomize the Emacs variable gud-gdb-command-name to run the one you want.
In the GUD buffer, you can use these special Emacs commands in addition to thestandard Shell mode commands:
C-h m Describe the features of Emacs’ GUD Mode.
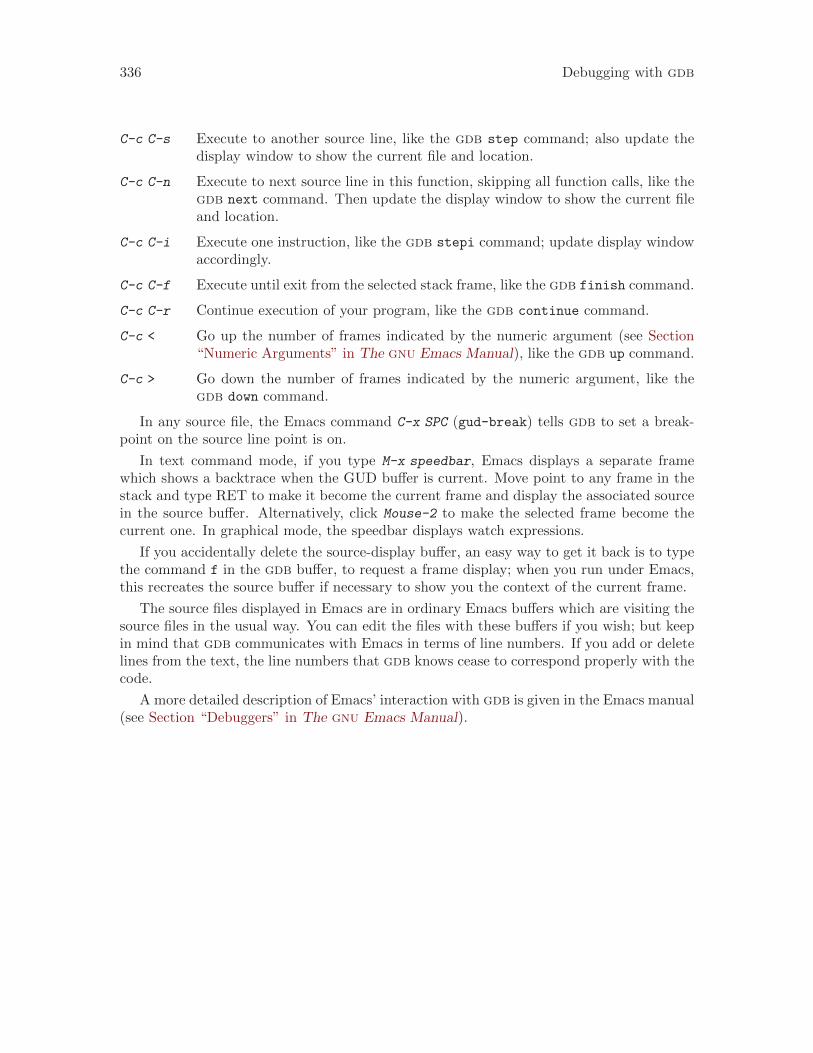
336 Debugging with gdb
C-c C-s Execute to another source line, like the gdb step command; also update thedisplay window to show the current file and location.
C-c C-n Execute to next source line in this function, skipping all function calls, like thegdb next command. Then update the display window to show the current fileand location.
C-c C-i Execute one instruction, like the gdb stepi command; update display windowaccordingly.
C-c C-f Execute until exit from the selected stack frame, like the gdb finish command.
C-c C-r Continue execution of your program, like the gdb continue command.
C-c < Go up the number of frames indicated by the numeric argument (see Section“Numeric Arguments” in The gnu Emacs Manual), like the gdb up command.
C-c > Go down the number of frames indicated by the numeric argument, like thegdb down command.
In any source file, the Emacs command C-x SPC (gud-break) tells gdb to set a break-point on the source line point is on.
In text command mode, if you type M-x speedbar, Emacs displays a separate framewhich shows a backtrace when the GUD buffer is current. Move point to any frame in thestack and type RET to make it become the current frame and display the associated sourcein the source buffer. Alternatively, click Mouse-2 to make the selected frame become thecurrent one. In graphical mode, the speedbar displays watch expressions.
If you accidentally delete the source-display buffer, an easy way to get it back is to typethe command f in the gdb buffer, to request a frame display; when you run under Emacs,this recreates the source buffer if necessary to show you the context of the current frame.
The source files displayed in Emacs are in ordinary Emacs buffers which are visiting thesource files in the usual way. You can edit the files with these buffers if you wish; but keepin mind that gdb communicates with Emacs in terms of line numbers. If you add or deletelines from the text, the line numbers that gdb knows cease to correspond properly with thecode.
A more detailed description of Emacs’ interaction with gdb is given in the Emacs manual(see Section “Debuggers” in The gnu Emacs Manual).
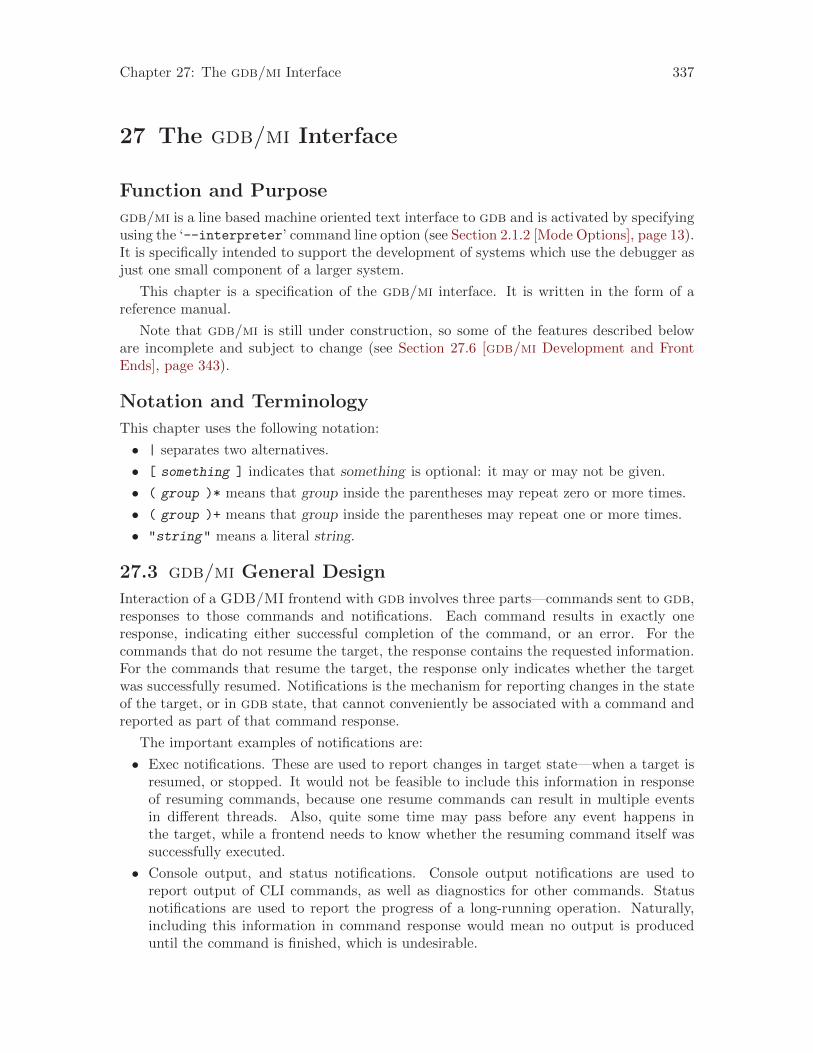
Chapter 27: The gdb/mi Interface 337
27 The gdb/mi Interface
Function and Purpose
gdb/mi is a line based machine oriented text interface to gdb and is activated by specifyingusing the ‘--interpreter’ command line option (see Section 2.1.2 [Mode Options], page 13).It is specifically intended to support the development of systems which use the debugger asjust one small component of a larger system.
This chapter is a specification of the gdb/mi interface. It is written in the form of areference manual.
Note that gdb/mi is still under construction, so some of the features described beloware incomplete and subject to change (see Section 27.6 [gdb/mi Development and FrontEnds], page 343).
Notation and Terminology
This chapter uses the following notation:
• | separates two alternatives.
• [ something ] indicates that something is optional: it may or may not be given.
• ( group )* means that group inside the parentheses may repeat zero or more times.
• ( group )+ means that group inside the parentheses may repeat one or more times.
• "string" means a literal string.
27.3 gdb/mi General Design
Interaction of a GDB/MI frontend with gdb involves three parts—commands sent to gdb,responses to those commands and notifications. Each command results in exactly oneresponse, indicating either successful completion of the command, or an error. For thecommands that do not resume the target, the response contains the requested information.For the commands that resume the target, the response only indicates whether the targetwas successfully resumed. Notifications is the mechanism for reporting changes in the stateof the target, or in gdb state, that cannot conveniently be associated with a command andreported as part of that command response.
The important examples of notifications are:
• Exec notifications. These are used to report changes in target state—when a target isresumed, or stopped. It would not be feasible to include this information in responseof resuming commands, because one resume commands can result in multiple eventsin different threads. Also, quite some time may pass before any event happens inthe target, while a frontend needs to know whether the resuming command itself wassuccessfully executed.
• Console output, and status notifications. Console output notifications are used toreport output of CLI commands, as well as diagnostics for other commands. Statusnotifications are used to report the progress of a long-running operation. Naturally,including this information in command response would mean no output is produceduntil the command is finished, which is undesirable.
338 Debugging with gdb
• General notifications. Commands may have various side effects on the gdb or targetstate beyond their official purpose. For example, a command may change the selectedthread. Although such changes can be included in command response, using notificationallows for more orthogonal frontend design.
There’s no guarantee that whenever an MI command reports an error, gdb or the targetare in any specific state, and especially, the state is not reverted to the state before theMI command was processed. Therefore, whenever an MI command results in an error, werecommend that the frontend refreshes all the information shown in the user interface.
27.3.1 Context management
In most cases when gdb accesses the target, this access is done in context of a specific threadand frame (see Section 8.1 [Frames], page 81). Often, even when accessing global data, thetarget requires that a thread be specified. The CLI interface maintains the selected threadand frame, and supplies them to target on each command. This is convenient, because acommand line user would not want to specify that information explicitly on each command,and because user interacts with gdb via a single terminal, so no confusion is possible as towhat thread and frame are the current ones.
In the case of MI, the concept of selected thread and frame is less useful. First, afrontend can easily remember this information itself. Second, a graphical frontend can havemore than one window, each one used for debugging a different thread, and the frontendmight want to access additional threads for internal purposes. This increases the risk thatby relying on implicitly selected thread, the frontend may be operating on a wrong one.Therefore, each MI command should explicitly specify which thread and frame to operateon. To make it possible, each MI command accepts the ‘--thread’ and ‘--frame’ options,the value to each is gdb identifier for thread and frame to operate on.
Usually, each top-level window in a frontend allows the user to select a thread and aframe, and remembers the user selection for further operations. However, in some casesgdb may suggest that the current thread be changed. For example, when stopping on abreakpoint it is reasonable to switch to the thread where breakpoint is hit. For anotherexample, if the user issues the CLI ‘thread’ command via the frontend, it is desirable tochange the frontend’s selected thread to the one specified by user. gdb communicates thesuggestion to change current thread using the ‘=thread-selected’ notification. No suchnotification is available for the selected frame at the moment.
Note that historically, MI shares the selected thread with CLI, so frontends used the-thread-select to execute commands in the right context. However, getting this to workright is cumbersome. The simplest way is for frontend to emit -thread-select commandbefore every command. This doubles the number of commands that need to be sent. Thealternative approach is to suppress -thread-select if the selected thread in gdb is sup-posed to be identical to the thread the frontend wants to operate on. However, getting thisoptimization right can be tricky. In particular, if the frontend sends several commands togdb, and one of the commands changes the selected thread, then the behaviour of sub-sequent commands will change. So, a frontend should either wait for response from suchproblematic commands, or explicitly add -thread-select for all subsequent commands.No frontend is known to do this exactly right, so it is suggested to just always pass the‘--thread’ and ‘--frame’ options.
Chapter 27: The gdb/mi Interface 339
27.3.2 Asynchronous command execution and non-stop mode
On some targets, gdb is capable of processing MI commands even while the target isrunning. This is called asynchronous command execution (see Section 5.5.3 [BackgroundExecution], page 71). The frontend may specify a preferrence for asynchronous execu-tion using the -gdb-set target-async 1 command, which should be emitted before eitherrunning the executable or attaching to the target. After the frontend has started the exe-cutable or attached to the target, it can find if asynchronous execution is enabled using the-list-target-features command.
Even if gdb can accept a command while target is running, many commands that accessthe target do not work when the target is running. Therefore, asynchronous commandexecution is most useful when combined with non-stop mode (see Section 5.5.2 [Non-StopMode], page 69). Then, it is possible to examine the state of one thread, while other threadsare running.
When a given thread is running, MI commands that try to access the target in thecontext of that thread may not work, or may work only on some targets. In particular,commands that try to operate on thread’s stack will not work, on any target. Commandsthat read memory, or modify breakpoints, may work or not work, depending on the target.Note that even commands that operate on global state, such as print, set, and breakpointcommands, still access the target in the context of a specific thread, so frontend should tryto find a stopped thread and perform the operation on that thread (using the ‘--thread’option).
Which commands will work in the context of a running thread is highly target dependent.However, the two commands -exec-interrupt, to stop a thread, and -thread-info, tofind the state of a thread, will always work.
27.3.3 Thread groups
gdb may be used to debug several processes at the same time. On some platfroms, gdbmay support debugging of several hardware systems, each one having several cores withseveral different processes running on each core. This section describes the MI mechanismto support such debugging scenarios.
The key observation is that regardless of the structure of the target, MI can have a globallist of threads, because most commands that accept the ‘--thread’ option do not need toknow what process that thread belongs to. Therefore, it is not necessary to introduce neitheradditional ‘--process’ option, nor an notion of the current process in the MI interface. Theonly strictly new feature that is required is the ability to find how the threads are groupedinto processes.
To allow the user to discover such grouping, and to support arbitrary hierarchy of ma-chines/cores/processes, MI introduces the concept of a thread group. Thread group is acollection of threads and other thread groups. A thread group always has a string identifier,a type, and may have additional attributes specific to the type. A new command, -list-thread-groups, returns the list of top-level thread groups, which correspond to processesthat gdb is debugging at the moment. By passing an identifier of a thread group to the-list-thread-groups command, it is possible to obtain the members of specific threadgroup.
340 Debugging with gdb
To allow the user to easily discover processes, and other objects, he wishes to de-bug, a concept of available thread group is introduced. Available thread group is anthread group that gdb is not debugging, but that can be attached to, using the -target-
attach command. The list of available top-level thread groups can be obtained using‘-list-thread-groups --available’. In general, the content of a thread group may beonly retrieved only after attaching to that thread group.
Thread groups are related to inferiors (see Section 4.9 [Inferiors and Programs], page 32).Each inferior corresponds to a thread group of a special type ‘process’, and some additionaloperations are permitted on such thread groups.
27.4 gdb/mi Command Syntax
27.4.1 gdb/mi Input Syntax
command 7→cli-command | mi-command
cli-command 7→[ token ] cli-command nl , where cli-command is any existing gdb CLI com-mand.
mi-command 7→[ token ] "-" operation ( " " option )* [ " --" ] ( " " parameter )* nl
token 7→ "any sequence of digits"
option 7→"-" parameter [ " " parameter ]
parameter 7→non-blank-sequence | c-string
operation 7→any of the operations described in this chapter
non-blank-sequence 7→anything, provided it doesn’t contain special characters such as "-", nl, """ andof course " "
c-string 7→""" seven-bit-iso-c-string-content """
nl 7→ CR | CR-LF
Notes:
• The CLI commands are still handled by the mi interpreter; their output is describedbelow.
• The token , when present, is passed back when the command finishes.
• Some mi commands accept optional arguments as part of the parameter list. Eachoption is identified by a leading ‘-’ (dash) and may be followed by an optional argumentparameter. Options occur first in the parameter list and can be delimited from normalparameters using ‘--’ (this is useful when some parameters begin with a dash).
Chapter 27: The gdb/mi Interface 341
Pragmatics:
• We want easy access to the existing CLI syntax (for debugging).
• We want it to be easy to spot a mi operation.
27.4.2 gdb/mi Output Syntax
The output from gdb/mi consists of zero or more out-of-band records followed, optionally,by a single result record. This result record is for the most recent command. The sequenceof output records is terminated by ‘(gdb)’.
If an input command was prefixed with a token then the corresponding output for thatcommand will also be prefixed by that same token.
output 7→( out-of-band-record )* [ result-record ] "(gdb)" nl
result-record 7→[ token ] "^" result-class ( "," result )* nl
out-of-band-record 7→async-record | stream-record
async-record 7→exec-async-output | status-async-output | notify-async-output
exec-async-output 7→[ token ] "*" async-output
status-async-output 7→[ token ] "+" async-output
notify-async-output 7→[ token ] "=" async-output
async-output 7→async-class ( "," result )* nl
result-class 7→"done" | "running" | "connected" | "error" | "exit"
async-class 7→"stopped" | others (where others will be added depending on the needs—thisis still in development).
result 7→variable "=" value
variable 7→string
value 7→ const | tuple | list
const 7→ c-string
tuple 7→ "{}" | "{" result ( "," result )* "}"
list 7→ "[]" | "[" value ( "," value )* "]" | "[" result ( "," result )* "]"
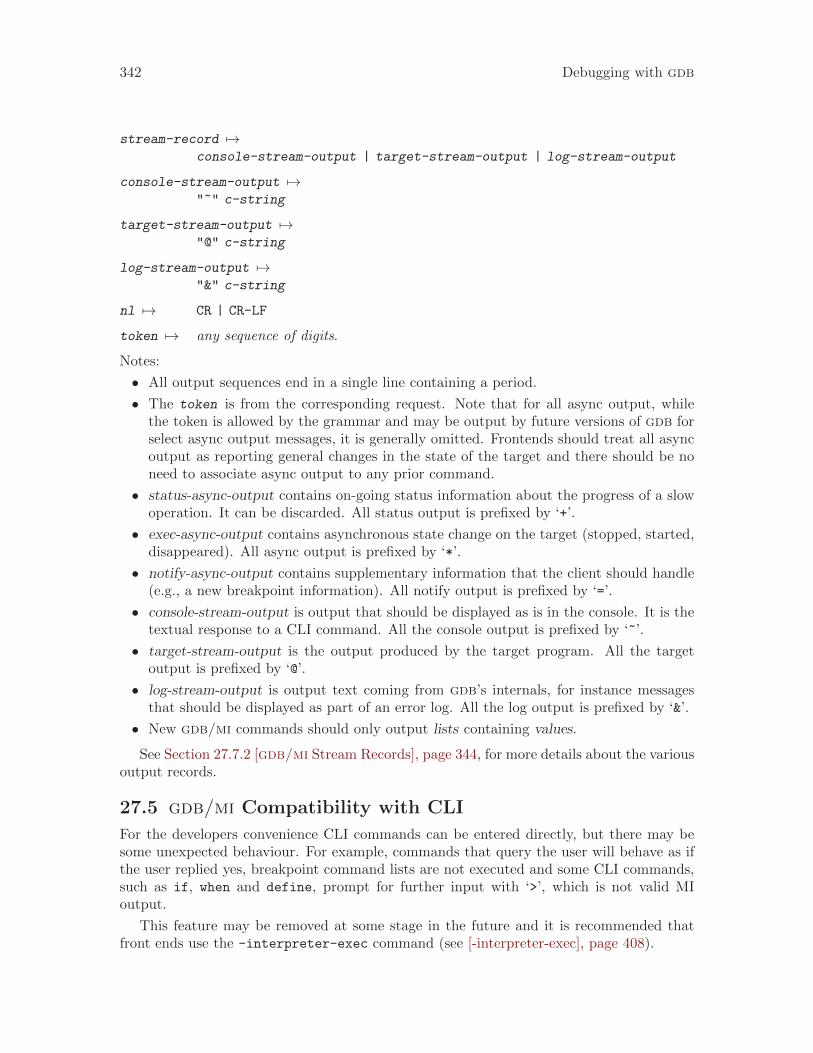
342 Debugging with gdb
stream-record 7→console-stream-output | target-stream-output | log-stream-output
console-stream-output 7→"~" c-string
target-stream-output 7→"@" c-string
log-stream-output 7→"&" c-string
nl 7→ CR | CR-LF
token 7→ any sequence of digits.
Notes:
• All output sequences end in a single line containing a period.
• The token is from the corresponding request. Note that for all async output, whilethe token is allowed by the grammar and may be output by future versions of gdb forselect async output messages, it is generally omitted. Frontends should treat all asyncoutput as reporting general changes in the state of the target and there should be noneed to associate async output to any prior command.
• status-async-output contains on-going status information about the progress of a slowoperation. It can be discarded. All status output is prefixed by ‘+’.
• exec-async-output contains asynchronous state change on the target (stopped, started,disappeared). All async output is prefixed by ‘*’.
• notify-async-output contains supplementary information that the client should handle(e.g., a new breakpoint information). All notify output is prefixed by ‘=’.
• console-stream-output is output that should be displayed as is in the console. It is thetextual response to a CLI command. All the console output is prefixed by ‘~’.
• target-stream-output is the output produced by the target program. All the targetoutput is prefixed by ‘@’.
• log-stream-output is output text coming from gdb’s internals, for instance messagesthat should be displayed as part of an error log. All the log output is prefixed by ‘&’.
• New gdb/mi commands should only output lists containing values.
See Section 27.7.2 [gdb/mi Stream Records], page 344, for more details about the variousoutput records.
27.5 gdb/mi Compatibility with CLI
For the developers convenience CLI commands can be entered directly, but there may besome unexpected behaviour. For example, commands that query the user will behave as ifthe user replied yes, breakpoint command lists are not executed and some CLI commands,such as if, when and define, prompt for further input with ‘>’, which is not valid MIoutput.
This feature may be removed at some stage in the future and it is recommended thatfront ends use the -interpreter-exec command (see [-interpreter-exec], page 408).
Chapter 27: The gdb/mi Interface 343
27.6 gdb/mi Development and Front Ends
The application which takes the MI output and presents the state of the program beingdebugged to the user is called a front end.
Although gdb/mi is still incomplete, it is currently being used by a variety of front endsto gdb. This makes it difficult to introduce new functionality without breaking existingusage. This section tries to minimize the problems by describing how the protocol mightchange.
Some changes in MI need not break a carefully designed front end, and for these the MIversion will remain unchanged. The following is a list of changes that may occur within onelevel, so front ends should parse MI output in a way that can handle them:
• New MI commands may be added.
• New fields may be added to the output of any MI command.
• The range of values for fields with specified values, e.g., in_scope (see [-var-update],page 382) may be extended.
If the changes are likely to break front ends, the MI version level will be increased by one.This will allow the front end to parse the output according to the MI version. Apart frommi0, new versions of gdb will not support old versions of MI and it will be the responsibilityof the front end to work with the new one.
The best way to avoid unexpected changes in MI that might break your frontend is to make your project known to gdb developers and follow development [email protected] and [email protected].
27.7 gdb/mi Output Records
27.7.1 gdb/mi Result Records
In addition to a number of out-of-band notifications, the response to a gdb/mi commandincludes one of the following result indications:
"^done" [ "," results ]
The synchronous operation was successful, results are the return values.
"^running"
This result record is equivalent to ‘^done’. Historically, it was output insteadof ‘^done’ if the command has resumed the target. This behaviour is main-tained for backward compatibility, but all frontends should treat ‘^done’ and‘^running’ identically and rely on the ‘*running’ output record to determinewhich threads are resumed.
"^connected"
gdb has connected to a remote target.
"^error" "," c-string
The operation failed. The c-string contains the corresponding error message.
"^exit" gdb has terminated.
344 Debugging with gdb
27.7.2 gdb/mi Stream Records
gdb internally maintains a number of output streams: the console, the target, and the log.The output intended for each of these streams is funneled through the gdb/mi interfaceusing stream records.
Each stream record begins with a unique prefix character which identifies its stream (seeSection 27.4.2 [gdb/mi Output Syntax], page 341). In addition to the prefix, each streamrecord contains a string-output . This is either raw text (with an implicit new line) or aquoted C string (which does not contain an implicit newline).
"~" string-output
The console output stream contains text that should be displayed in the CLIconsole window. It contains the textual responses to CLI commands.
"@" string-output
The target output stream contains any textual output from the running target.This is only present when GDB’s event loop is truly asynchronous, which iscurrently only the case for remote targets.
"&" string-output
The log stream contains debugging messages being produced by gdb’s internals.
27.7.3 gdb/mi Async Records
Async records are used to notify the gdb/mi client of additional changes that have occurred.Those changes can either be a consequence of gdb/mi commands (e.g., a breakpoint mod-ified) or a result of target activity (e.g., target stopped).
The following is the list of possible async records:
*running,thread-id="thread"
The target is now running. The thread field tells which specific thread is nowrunning, and can be ‘all’ if all threads are running. The frontend should assumethat no interaction with a running thread is possible after this notification isproduced. The frontend should not assume that this notification is output onlyonce for any command. gdb may emit this notification several times, either fordifferent threads, because it cannot resume all threads together, or even for asingle thread, if the thread must be stepped though some code before letting itrun freely.
*stopped,reason="reason",thread-id="id",stopped-threads="stopped",core="core"
The target has stopped. The reason field can have one of the following values:
breakpoint-hit
A breakpoint was reached.
watchpoint-trigger
A watchpoint was triggered.
read-watchpoint-trigger
A read watchpoint was triggered.
access-watchpoint-trigger
An access watchpoint was triggered.
Chapter 27: The gdb/mi Interface 345
function-finished
An -exec-finish or similar CLI command was accomplished.
location-reached
An -exec-until or similar CLI command was accomplished.
watchpoint-scope
A watchpoint has gone out of scope.
end-stepping-range
An -exec-next, -exec-next-instruction, -exec-step, -exec-step-instruction or similar CLI command was accomplished.
exited-signalled
The inferior exited because of a signal.
exited The inferior exited.
exited-normally
The inferior exited normally.
signal-received
A signal was received by the inferior.
solib-event
The inferior has stopped due to a library being loaded or un-loaded. This can only happen when stop-on-solib-events (seeSection 18.1 [Files], page 201) is set.
fork The inferior has forked. This is reported when catch fork (seeSection 5.1.3 [Set Catchpoints], page 52) has been used.
vfork The inferior has vforked. This is reported in when catch vfork
(see Section 5.1.3 [Set Catchpoints], page 52) has been used.
syscall-entry
The inferior entered a system call. This is reported when catch
syscall (see Section 5.1.3 [Set Catchpoints], page 52) has beenused.
syscall-entry
The inferior returned from a system call. This is reported whencatch syscall (see Section 5.1.3 [Set Catchpoints], page 52) hasbeen used.
exec The inferior called exec. This is reported when catch exec (seeSection 5.1.3 [Set Catchpoints], page 52) has been used.
The id field identifies the thread that directly caused the stop – for exampleby hitting a breakpoint. Depending on whether all-stop mode is in effect (seeSection 5.5.1 [All-Stop Mode], page 68), gdb may either stop all threads, oronly the thread that directly triggered the stop. If all threads are stopped, thestopped field will have the value of "all". Otherwise, the value of the stoppedfield will be a list of thread identifiers. Presently, this list will always include asingle thread, but frontend should be prepared to see several threads in the list.
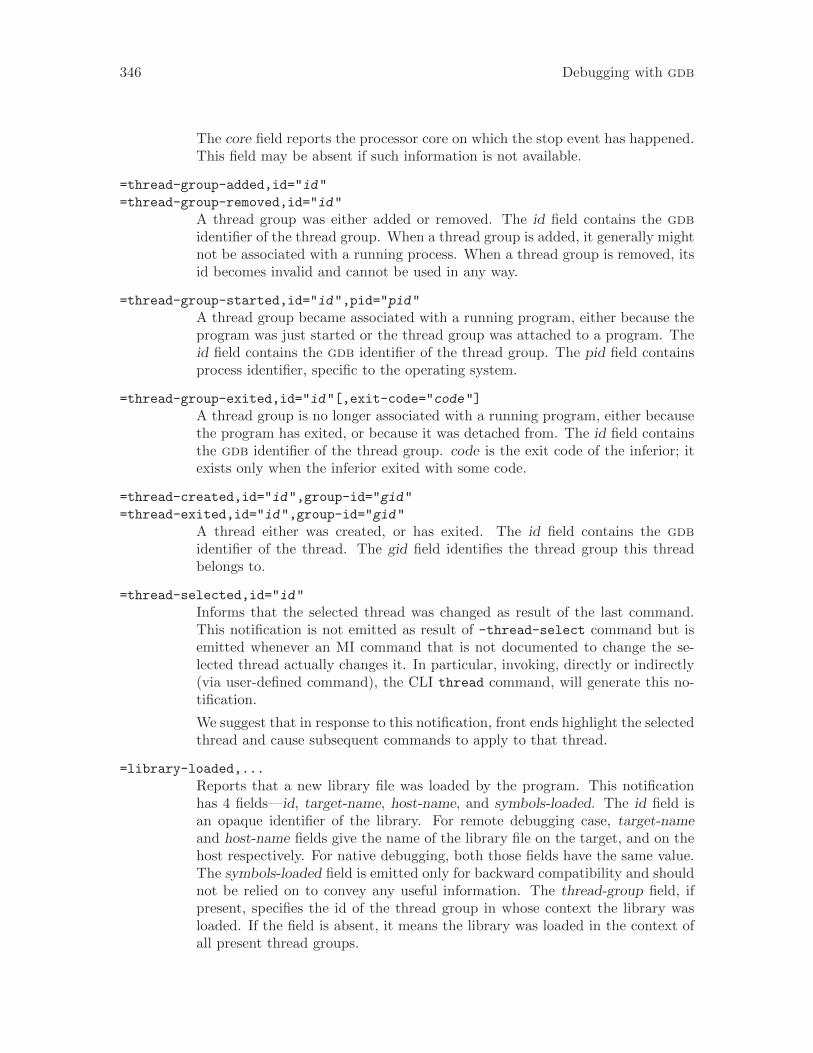
346 Debugging with gdb
The core field reports the processor core on which the stop event has happened.This field may be absent if such information is not available.
=thread-group-added,id="id"
=thread-group-removed,id="id"
A thread group was either added or removed. The id field contains the gdbidentifier of the thread group. When a thread group is added, it generally mightnot be associated with a running process. When a thread group is removed, itsid becomes invalid and cannot be used in any way.
=thread-group-started,id="id",pid="pid"
A thread group became associated with a running program, either because theprogram was just started or the thread group was attached to a program. Theid field contains the gdb identifier of the thread group. The pid field containsprocess identifier, specific to the operating system.
=thread-group-exited,id="id"[,exit-code="code"]
A thread group is no longer associated with a running program, either becausethe program has exited, or because it was detached from. The id field containsthe gdb identifier of the thread group. code is the exit code of the inferior; itexists only when the inferior exited with some code.
=thread-created,id="id",group-id="gid"
=thread-exited,id="id",group-id="gid"
A thread either was created, or has exited. The id field contains the gdbidentifier of the thread. The gid field identifies the thread group this threadbelongs to.
=thread-selected,id="id"
Informs that the selected thread was changed as result of the last command.This notification is not emitted as result of -thread-select command but isemitted whenever an MI command that is not documented to change the se-lected thread actually changes it. In particular, invoking, directly or indirectly(via user-defined command), the CLI thread command, will generate this no-tification.
We suggest that in response to this notification, front ends highlight the selectedthread and cause subsequent commands to apply to that thread.
=library-loaded,...
Reports that a new library file was loaded by the program. This notificationhas 4 fields—id, target-name, host-name, and symbols-loaded. The id field isan opaque identifier of the library. For remote debugging case, target-nameand host-name fields give the name of the library file on the target, and on thehost respectively. For native debugging, both those fields have the same value.The symbols-loaded field is emitted only for backward compatibility and shouldnot be relied on to convey any useful information. The thread-group field, ifpresent, specifies the id of the thread group in whose context the library wasloaded. If the field is absent, it means the library was loaded in the context ofall present thread groups.
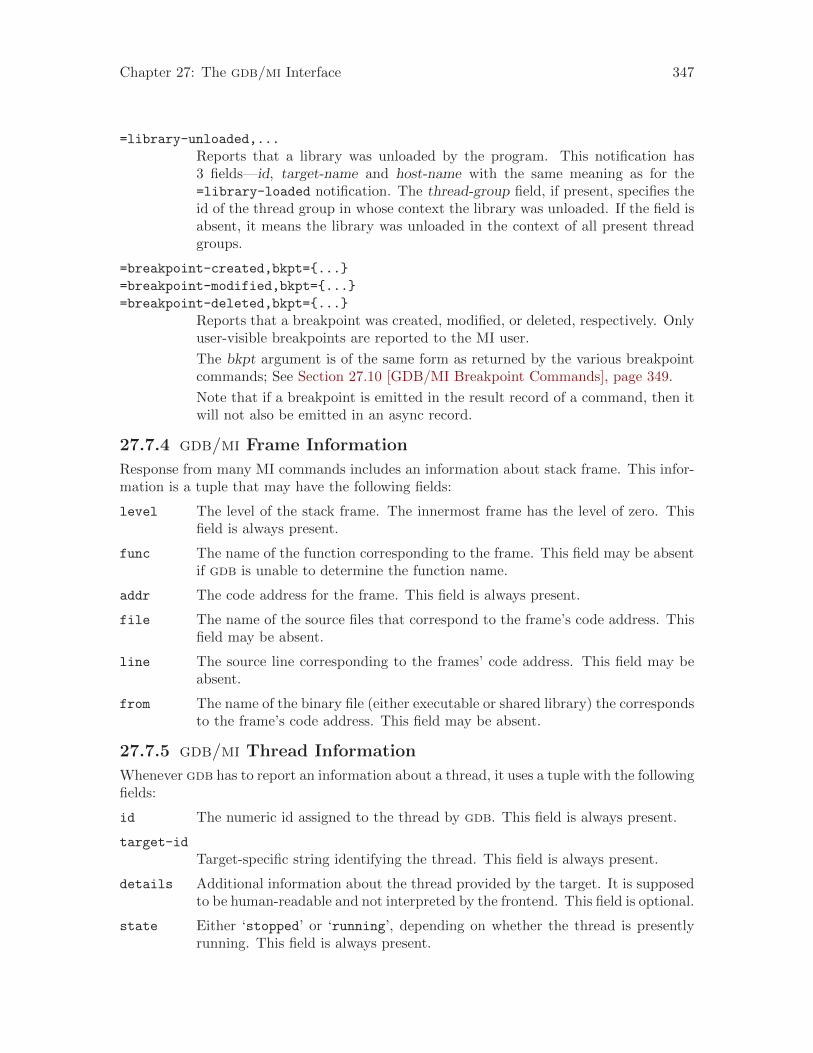
Chapter 27: The gdb/mi Interface 347
=library-unloaded,...
Reports that a library was unloaded by the program. This notification has3 fields—id, target-name and host-name with the same meaning as for the=library-loaded notification. The thread-group field, if present, specifies theid of the thread group in whose context the library was unloaded. If the field isabsent, it means the library was unloaded in the context of all present threadgroups.
=breakpoint-created,bkpt={...}
=breakpoint-modified,bkpt={...}
=breakpoint-deleted,bkpt={...}
Reports that a breakpoint was created, modified, or deleted, respectively. Onlyuser-visible breakpoints are reported to the MI user.
The bkpt argument is of the same form as returned by the various breakpointcommands; See Section 27.10 [GDB/MI Breakpoint Commands], page 349.
Note that if a breakpoint is emitted in the result record of a command, then itwill not also be emitted in an async record.
27.7.4 gdb/mi Frame Information
Response from many MI commands includes an information about stack frame. This infor-mation is a tuple that may have the following fields:
level The level of the stack frame. The innermost frame has the level of zero. Thisfield is always present.
func The name of the function corresponding to the frame. This field may be absentif gdb is unable to determine the function name.
addr The code address for the frame. This field is always present.
file The name of the source files that correspond to the frame’s code address. Thisfield may be absent.
line The source line corresponding to the frames’ code address. This field may beabsent.
from The name of the binary file (either executable or shared library) the correspondsto the frame’s code address. This field may be absent.
27.7.5 gdb/mi Thread Information
Whenever gdb has to report an information about a thread, it uses a tuple with the followingfields:
id The numeric id assigned to the thread by gdb. This field is always present.
target-id
Target-specific string identifying the thread. This field is always present.
details Additional information about the thread provided by the target. It is supposedto be human-readable and not interpreted by the frontend. This field is optional.
state Either ‘stopped’ or ‘running’, depending on whether the thread is presentlyrunning. This field is always present.
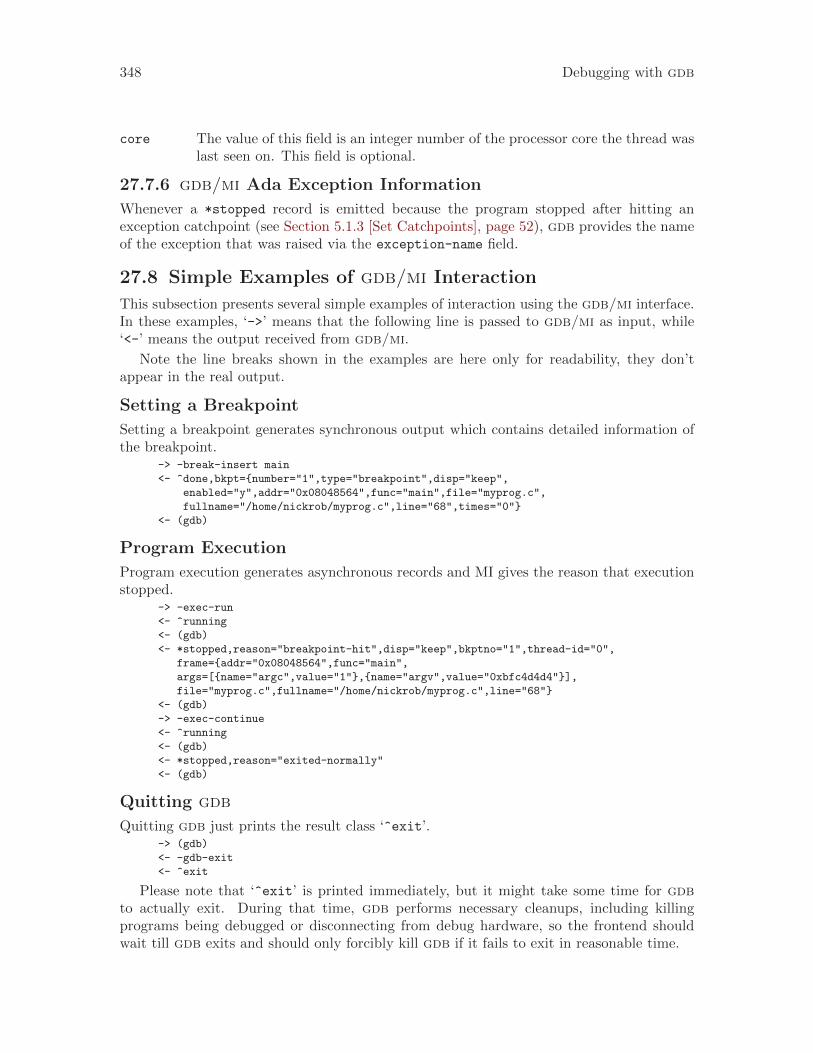
348 Debugging with gdb
core The value of this field is an integer number of the processor core the thread waslast seen on. This field is optional.
27.7.6 gdb/mi Ada Exception Information
Whenever a *stopped record is emitted because the program stopped after hitting anexception catchpoint (see Section 5.1.3 [Set Catchpoints], page 52), gdb provides the nameof the exception that was raised via the exception-name field.
27.8 Simple Examples of gdb/mi Interaction
This subsection presents several simple examples of interaction using the gdb/mi interface.In these examples, ‘->’ means that the following line is passed to gdb/mi as input, while‘<-’ means the output received from gdb/mi.
Note the line breaks shown in the examples are here only for readability, they don’tappear in the real output.
Setting a Breakpoint
Setting a breakpoint generates synchronous output which contains detailed information ofthe breakpoint.
-> -break-insert main
<- ^done,bkpt={number="1",type="breakpoint",disp="keep",
enabled="y",addr="0x08048564",func="main",file="myprog.c",
fullname="/home/nickrob/myprog.c",line="68",times="0"}
<- (gdb)
Program Execution
Program execution generates asynchronous records and MI gives the reason that executionstopped.
-> -exec-run
<- ^running
<- (gdb)
<- *stopped,reason="breakpoint-hit",disp="keep",bkptno="1",thread-id="0",
frame={addr="0x08048564",func="main",
args=[{name="argc",value="1"},{name="argv",value="0xbfc4d4d4"}],
file="myprog.c",fullname="/home/nickrob/myprog.c",line="68"}
<- (gdb)
-> -exec-continue
<- ^running
<- (gdb)
<- *stopped,reason="exited-normally"
<- (gdb)
Quitting gdb
Quitting gdb just prints the result class ‘^exit’.-> (gdb)
<- -gdb-exit
<- ^exit
Please note that ‘^exit’ is printed immediately, but it might take some time for gdbto actually exit. During that time, gdb performs necessary cleanups, including killingprograms being debugged or disconnecting from debug hardware, so the frontend shouldwait till gdb exits and should only forcibly kill gdb if it fails to exit in reasonable time.
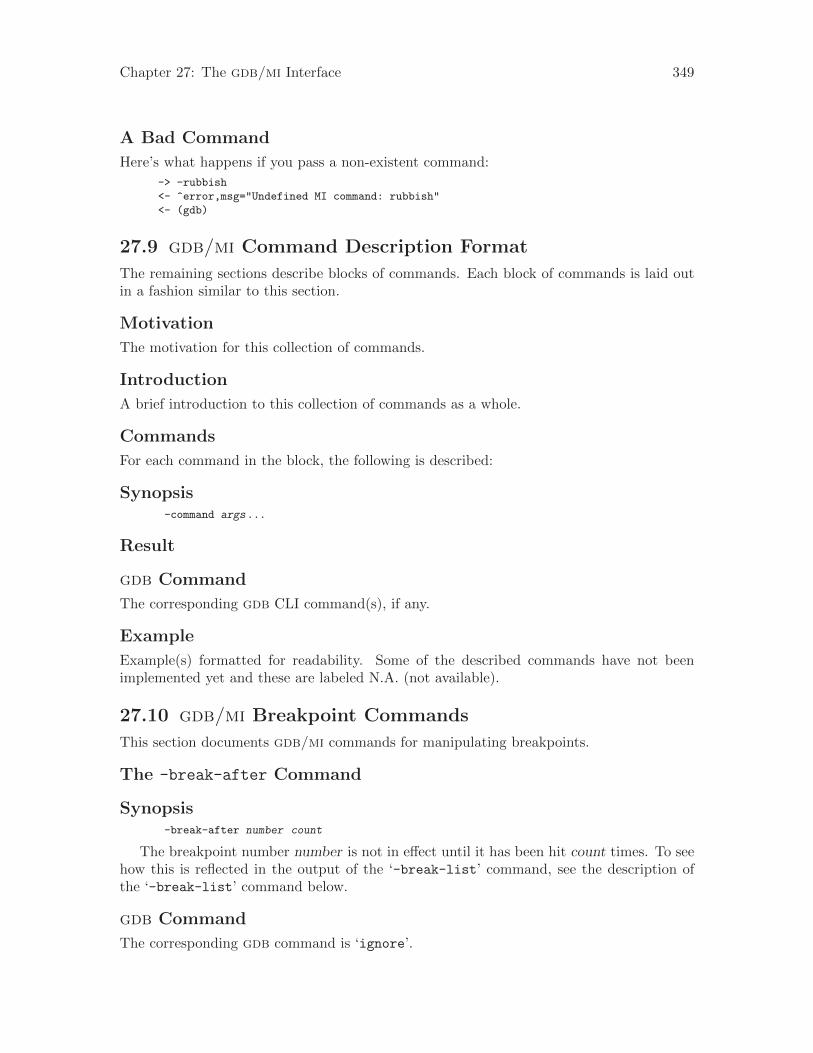
Chapter 27: The gdb/mi Interface 349
A Bad Command
Here’s what happens if you pass a non-existent command:
-> -rubbish
<- ^error,msg="Undefined MI command: rubbish"
<- (gdb)
27.9 gdb/mi Command Description Format
The remaining sections describe blocks of commands. Each block of commands is laid outin a fashion similar to this section.
Motivation
The motivation for this collection of commands.
Introduction
A brief introduction to this collection of commands as a whole.
Commands
For each command in the block, the following is described:
Synopsis-command args...
Result
gdb Command
The corresponding gdb CLI command(s), if any.
Example
Example(s) formatted for readability. Some of the described commands have not beenimplemented yet and these are labeled N.A. (not available).
27.10 gdb/mi Breakpoint Commands
This section documents gdb/mi commands for manipulating breakpoints.
The -break-after Command
Synopsis-break-after number count
The breakpoint number number is not in effect until it has been hit count times. To seehow this is reflected in the output of the ‘-break-list’ command, see the description ofthe ‘-break-list’ command below.
gdb Command
The corresponding gdb command is ‘ignore’.
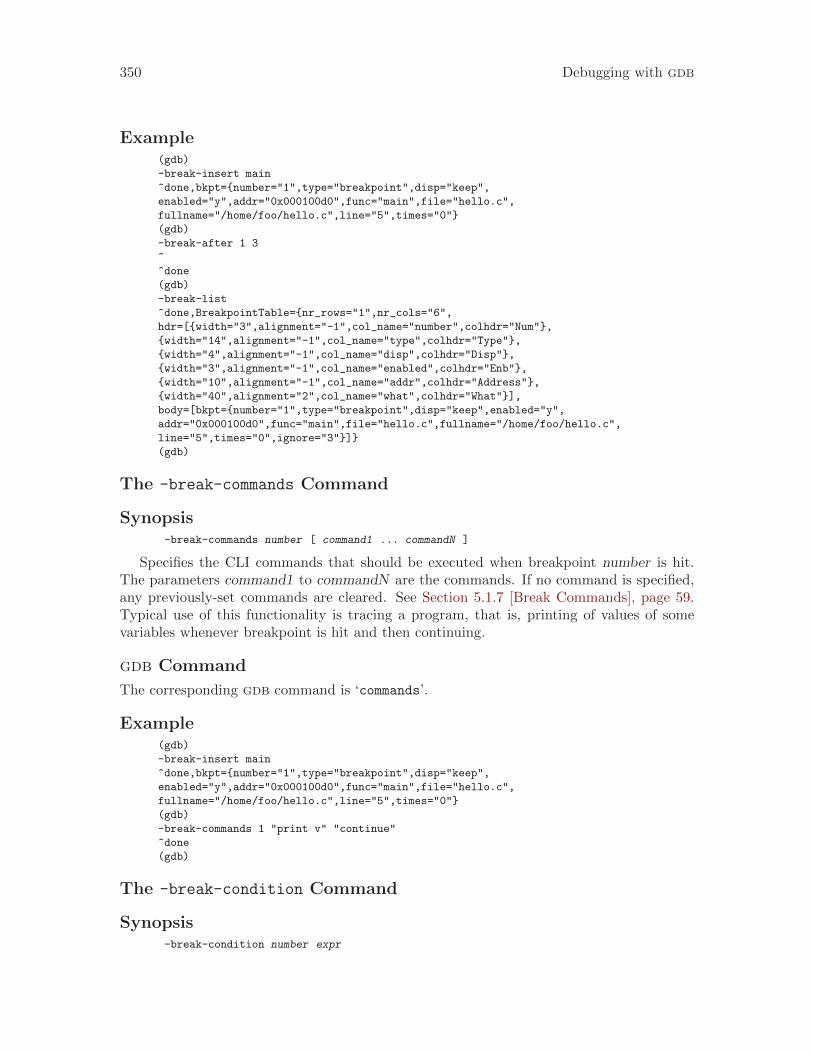
350 Debugging with gdb
Example(gdb)
-break-insert main
^done,bkpt={number="1",type="breakpoint",disp="keep",
enabled="y",addr="0x000100d0",func="main",file="hello.c",
fullname="/home/foo/hello.c",line="5",times="0"}
(gdb)
-break-after 1 3
~
^done
(gdb)
-break-list
^done,BreakpointTable={nr_rows="1",nr_cols="6",
hdr=[{width="3",alignment="-1",col_name="number",colhdr="Num"},
{width="14",alignment="-1",col_name="type",colhdr="Type"},
{width="4",alignment="-1",col_name="disp",colhdr="Disp"},
{width="3",alignment="-1",col_name="enabled",colhdr="Enb"},
{width="10",alignment="-1",col_name="addr",colhdr="Address"},
{width="40",alignment="2",col_name="what",colhdr="What"}],
body=[bkpt={number="1",type="breakpoint",disp="keep",enabled="y",
addr="0x000100d0",func="main",file="hello.c",fullname="/home/foo/hello.c",
line="5",times="0",ignore="3"}]}
(gdb)
The -break-commands Command
Synopsis-break-commands number [ command1 ... commandN ]
Specifies the CLI commands that should be executed when breakpoint number is hit.The parameters command1 to commandN are the commands. If no command is specified,any previously-set commands are cleared. See Section 5.1.7 [Break Commands], page 59.Typical use of this functionality is tracing a program, that is, printing of values of somevariables whenever breakpoint is hit and then continuing.
gdb Command
The corresponding gdb command is ‘commands’.
Example(gdb)
-break-insert main
^done,bkpt={number="1",type="breakpoint",disp="keep",
enabled="y",addr="0x000100d0",func="main",file="hello.c",
fullname="/home/foo/hello.c",line="5",times="0"}
(gdb)
-break-commands 1 "print v" "continue"
^done
(gdb)
The -break-condition Command
Synopsis-break-condition number expr
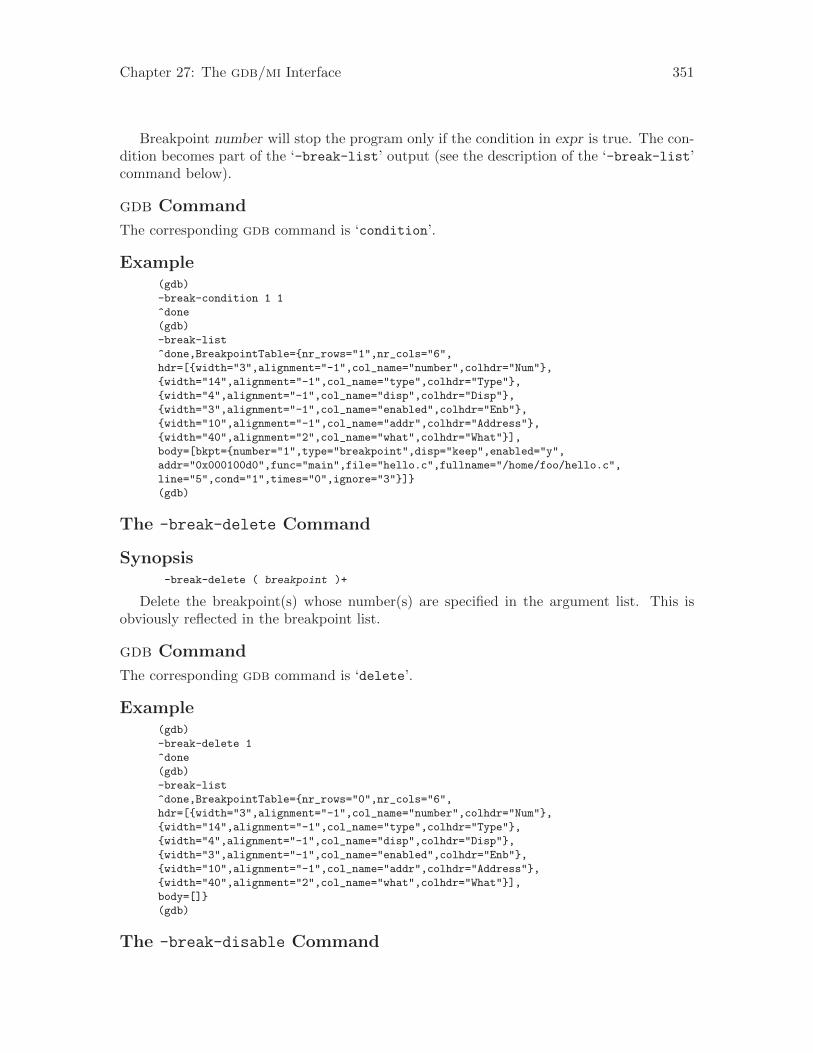
Chapter 27: The gdb/mi Interface 351
Breakpoint number will stop the program only if the condition in expr is true. The con-dition becomes part of the ‘-break-list’ output (see the description of the ‘-break-list’command below).
gdb Command
The corresponding gdb command is ‘condition’.
Example(gdb)
-break-condition 1 1
^done
(gdb)
-break-list
^done,BreakpointTable={nr_rows="1",nr_cols="6",
hdr=[{width="3",alignment="-1",col_name="number",colhdr="Num"},
{width="14",alignment="-1",col_name="type",colhdr="Type"},
{width="4",alignment="-1",col_name="disp",colhdr="Disp"},
{width="3",alignment="-1",col_name="enabled",colhdr="Enb"},
{width="10",alignment="-1",col_name="addr",colhdr="Address"},
{width="40",alignment="2",col_name="what",colhdr="What"}],
body=[bkpt={number="1",type="breakpoint",disp="keep",enabled="y",
addr="0x000100d0",func="main",file="hello.c",fullname="/home/foo/hello.c",
line="5",cond="1",times="0",ignore="3"}]}
(gdb)
The -break-delete Command
Synopsis-break-delete ( breakpoint )+
Delete the breakpoint(s) whose number(s) are specified in the argument list. This isobviously reflected in the breakpoint list.
gdb Command
The corresponding gdb command is ‘delete’.
Example(gdb)
-break-delete 1
^done
(gdb)
-break-list
^done,BreakpointTable={nr_rows="0",nr_cols="6",
hdr=[{width="3",alignment="-1",col_name="number",colhdr="Num"},
{width="14",alignment="-1",col_name="type",colhdr="Type"},
{width="4",alignment="-1",col_name="disp",colhdr="Disp"},
{width="3",alignment="-1",col_name="enabled",colhdr="Enb"},
{width="10",alignment="-1",col_name="addr",colhdr="Address"},
{width="40",alignment="2",col_name="what",colhdr="What"}],
body=[]}
(gdb)
The -break-disable Command
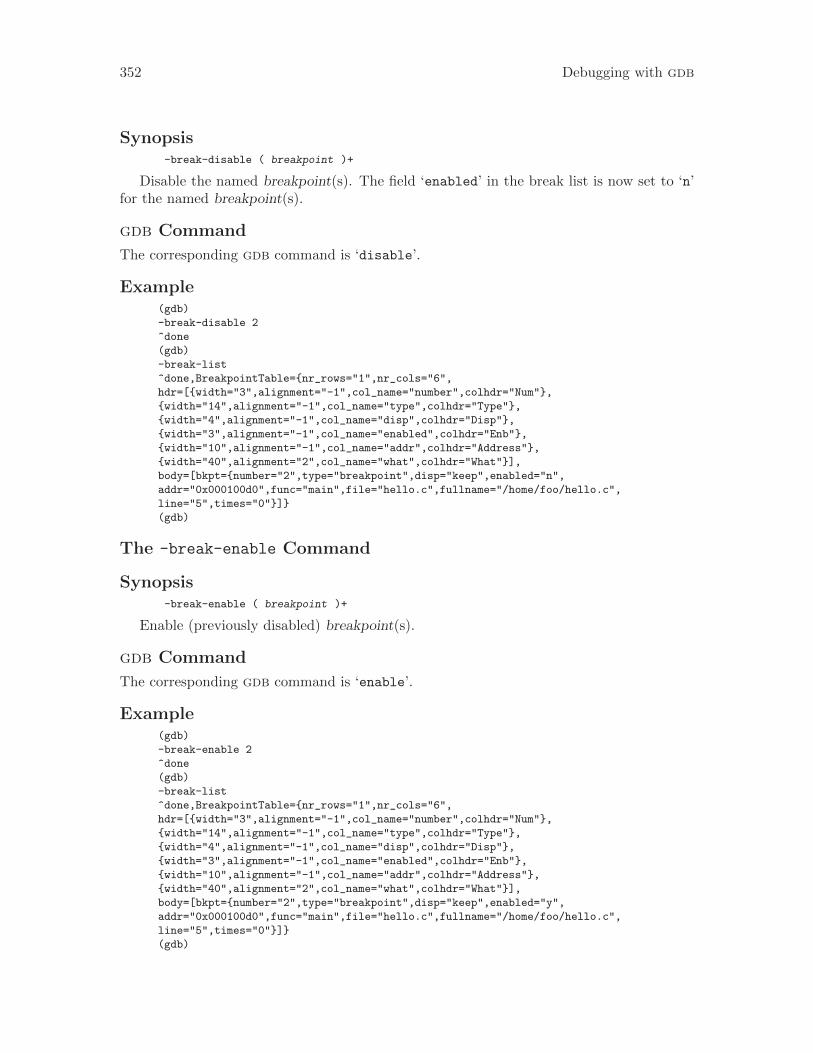
352 Debugging with gdb
Synopsis-break-disable ( breakpoint )+
Disable the named breakpoint(s). The field ‘enabled’ in the break list is now set to ‘n’for the named breakpoint(s).
gdb Command
The corresponding gdb command is ‘disable’.
Example(gdb)
-break-disable 2
^done
(gdb)
-break-list
^done,BreakpointTable={nr_rows="1",nr_cols="6",
hdr=[{width="3",alignment="-1",col_name="number",colhdr="Num"},
{width="14",alignment="-1",col_name="type",colhdr="Type"},
{width="4",alignment="-1",col_name="disp",colhdr="Disp"},
{width="3",alignment="-1",col_name="enabled",colhdr="Enb"},
{width="10",alignment="-1",col_name="addr",colhdr="Address"},
{width="40",alignment="2",col_name="what",colhdr="What"}],
body=[bkpt={number="2",type="breakpoint",disp="keep",enabled="n",
addr="0x000100d0",func="main",file="hello.c",fullname="/home/foo/hello.c",
line="5",times="0"}]}
(gdb)
The -break-enable Command
Synopsis-break-enable ( breakpoint )+
Enable (previously disabled) breakpoint(s).
gdb Command
The corresponding gdb command is ‘enable’.
Example(gdb)
-break-enable 2
^done
(gdb)
-break-list
^done,BreakpointTable={nr_rows="1",nr_cols="6",
hdr=[{width="3",alignment="-1",col_name="number",colhdr="Num"},
{width="14",alignment="-1",col_name="type",colhdr="Type"},
{width="4",alignment="-1",col_name="disp",colhdr="Disp"},
{width="3",alignment="-1",col_name="enabled",colhdr="Enb"},
{width="10",alignment="-1",col_name="addr",colhdr="Address"},
{width="40",alignment="2",col_name="what",colhdr="What"}],
body=[bkpt={number="2",type="breakpoint",disp="keep",enabled="y",
addr="0x000100d0",func="main",file="hello.c",fullname="/home/foo/hello.c",
line="5",times="0"}]}
(gdb)
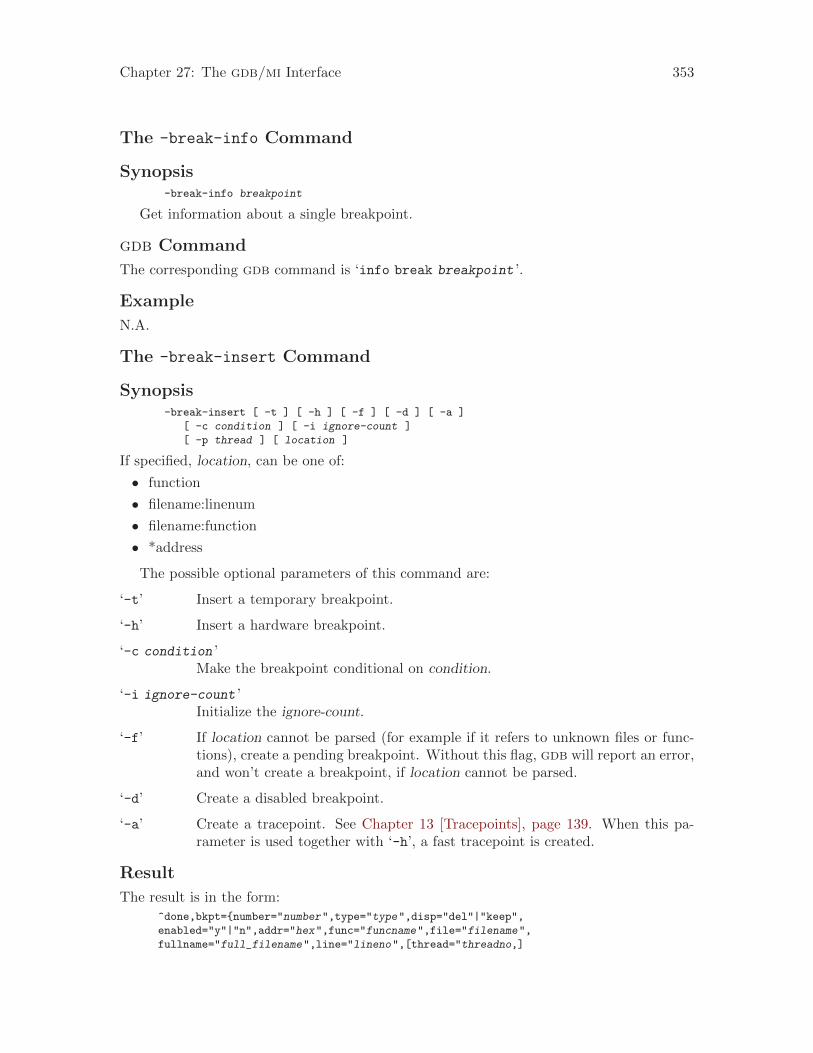
Chapter 27: The gdb/mi Interface 353
The -break-info Command
Synopsis-break-info breakpoint
Get information about a single breakpoint.
gdb Command
The corresponding gdb command is ‘info break breakpoint ’.
Example
N.A.
The -break-insert Command
Synopsis-break-insert [ -t ] [ -h ] [ -f ] [ -d ] [ -a ]
[ -c condition ] [ -i ignore-count ]
[ -p thread ] [ location ]
If specified, location, can be one of:
• function
• filename:linenum
• filename:function
• *address
The possible optional parameters of this command are:
‘-t’ Insert a temporary breakpoint.
‘-h’ Insert a hardware breakpoint.
‘-c condition ’Make the breakpoint conditional on condition.
‘-i ignore-count ’Initialize the ignore-count.
‘-f’ If location cannot be parsed (for example if it refers to unknown files or func-tions), create a pending breakpoint. Without this flag, gdb will report an error,and won’t create a breakpoint, if location cannot be parsed.
‘-d’ Create a disabled breakpoint.
‘-a’ Create a tracepoint. See Chapter 13 [Tracepoints], page 139. When this pa-rameter is used together with ‘-h’, a fast tracepoint is created.
Result
The result is in the form:
^done,bkpt={number="number",type="type",disp="del"|"keep",
enabled="y"|"n",addr="hex",func="funcname",file="filename",
fullname="full_filename",line="lineno",[thread="threadno,]
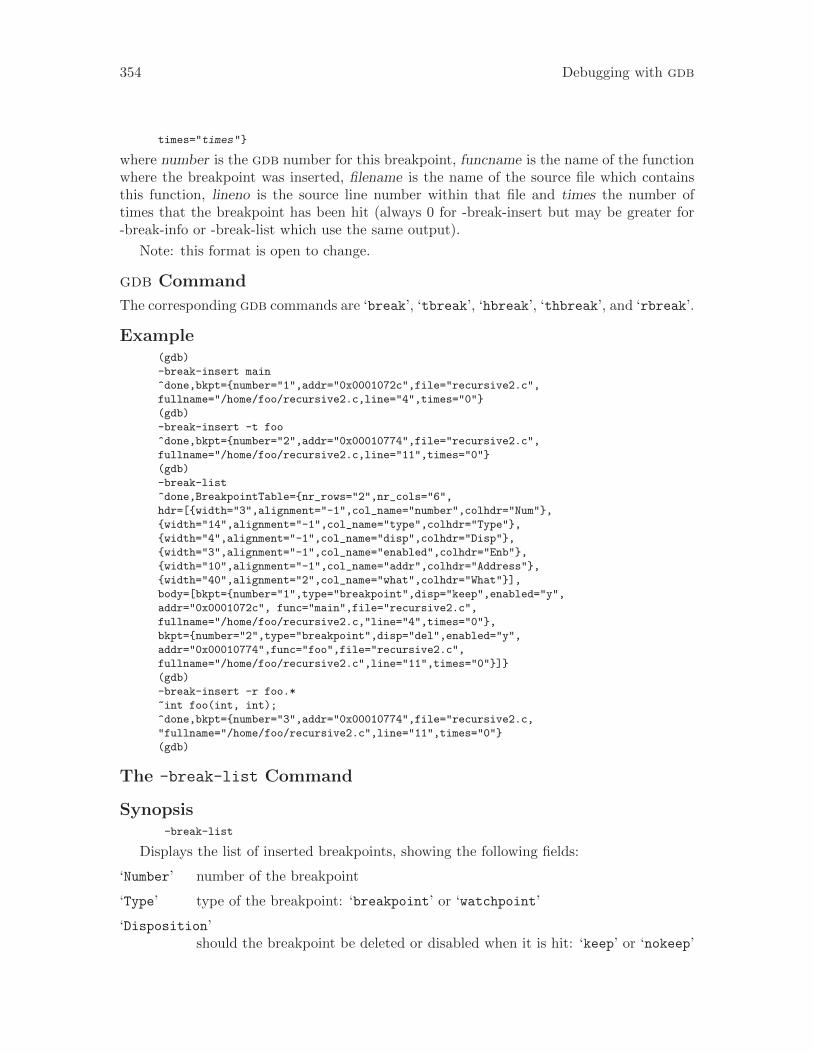
354 Debugging with gdb
times="times"}
where number is the gdb number for this breakpoint, funcname is the name of the functionwhere the breakpoint was inserted, filename is the name of the source file which containsthis function, lineno is the source line number within that file and times the number oftimes that the breakpoint has been hit (always 0 for -break-insert but may be greater for-break-info or -break-list which use the same output).
Note: this format is open to change.
gdb Command
The corresponding gdb commands are ‘break’, ‘tbreak’, ‘hbreak’, ‘thbreak’, and ‘rbreak’.
Example(gdb)
-break-insert main
^done,bkpt={number="1",addr="0x0001072c",file="recursive2.c",
fullname="/home/foo/recursive2.c,line="4",times="0"}
(gdb)
-break-insert -t foo
^done,bkpt={number="2",addr="0x00010774",file="recursive2.c",
fullname="/home/foo/recursive2.c,line="11",times="0"}
(gdb)
-break-list
^done,BreakpointTable={nr_rows="2",nr_cols="6",
hdr=[{width="3",alignment="-1",col_name="number",colhdr="Num"},
{width="14",alignment="-1",col_name="type",colhdr="Type"},
{width="4",alignment="-1",col_name="disp",colhdr="Disp"},
{width="3",alignment="-1",col_name="enabled",colhdr="Enb"},
{width="10",alignment="-1",col_name="addr",colhdr="Address"},
{width="40",alignment="2",col_name="what",colhdr="What"}],
body=[bkpt={number="1",type="breakpoint",disp="keep",enabled="y",
addr="0x0001072c", func="main",file="recursive2.c",
fullname="/home/foo/recursive2.c,"line="4",times="0"},
bkpt={number="2",type="breakpoint",disp="del",enabled="y",
addr="0x00010774",func="foo",file="recursive2.c",
fullname="/home/foo/recursive2.c",line="11",times="0"}]}
(gdb)
-break-insert -r foo.*
~int foo(int, int);
^done,bkpt={number="3",addr="0x00010774",file="recursive2.c,
"fullname="/home/foo/recursive2.c",line="11",times="0"}
(gdb)
The -break-list Command
Synopsis-break-list
Displays the list of inserted breakpoints, showing the following fields:
‘Number’ number of the breakpoint
‘Type’ type of the breakpoint: ‘breakpoint’ or ‘watchpoint’
‘Disposition’should the breakpoint be deleted or disabled when it is hit: ‘keep’ or ‘nokeep’
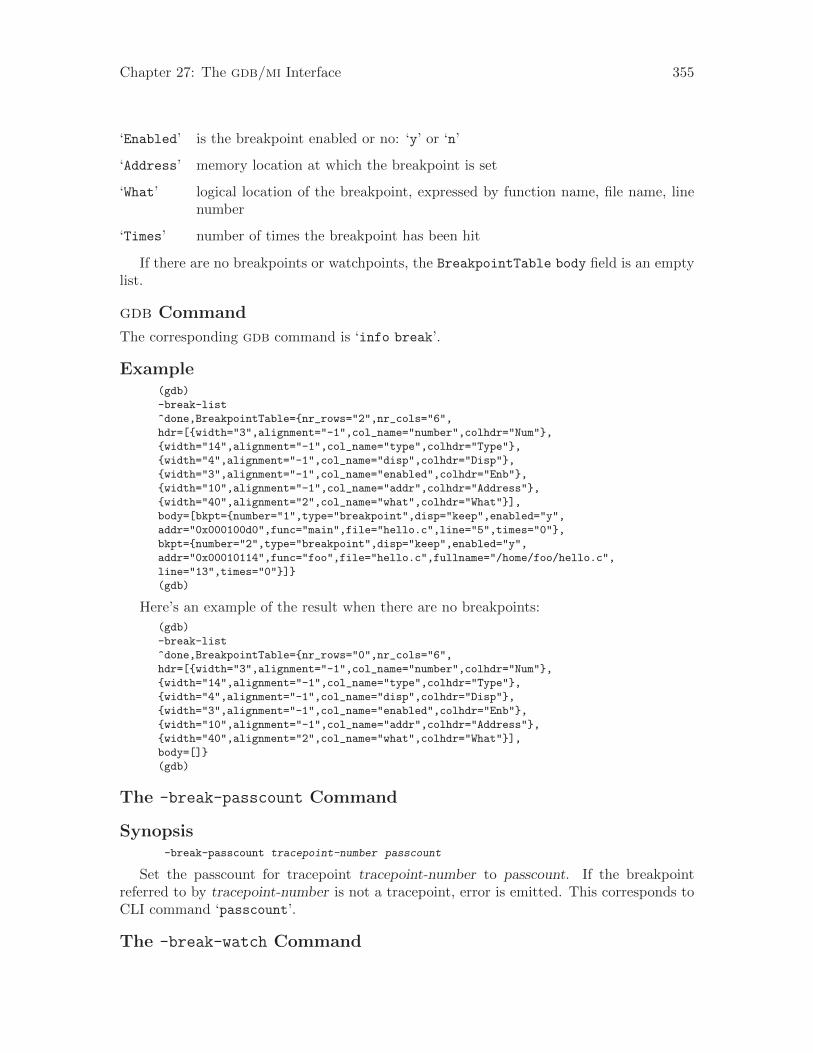
Chapter 27: The gdb/mi Interface 355
‘Enabled’ is the breakpoint enabled or no: ‘y’ or ‘n’
‘Address’ memory location at which the breakpoint is set
‘What’ logical location of the breakpoint, expressed by function name, file name, linenumber
‘Times’ number of times the breakpoint has been hit
If there are no breakpoints or watchpoints, the BreakpointTable body field is an emptylist.
gdb Command
The corresponding gdb command is ‘info break’.
Example(gdb)
-break-list
^done,BreakpointTable={nr_rows="2",nr_cols="6",
hdr=[{width="3",alignment="-1",col_name="number",colhdr="Num"},
{width="14",alignment="-1",col_name="type",colhdr="Type"},
{width="4",alignment="-1",col_name="disp",colhdr="Disp"},
{width="3",alignment="-1",col_name="enabled",colhdr="Enb"},
{width="10",alignment="-1",col_name="addr",colhdr="Address"},
{width="40",alignment="2",col_name="what",colhdr="What"}],
body=[bkpt={number="1",type="breakpoint",disp="keep",enabled="y",
addr="0x000100d0",func="main",file="hello.c",line="5",times="0"},
bkpt={number="2",type="breakpoint",disp="keep",enabled="y",
addr="0x00010114",func="foo",file="hello.c",fullname="/home/foo/hello.c",
line="13",times="0"}]}
(gdb)
Here’s an example of the result when there are no breakpoints:
(gdb)
-break-list
^done,BreakpointTable={nr_rows="0",nr_cols="6",
hdr=[{width="3",alignment="-1",col_name="number",colhdr="Num"},
{width="14",alignment="-1",col_name="type",colhdr="Type"},
{width="4",alignment="-1",col_name="disp",colhdr="Disp"},
{width="3",alignment="-1",col_name="enabled",colhdr="Enb"},
{width="10",alignment="-1",col_name="addr",colhdr="Address"},
{width="40",alignment="2",col_name="what",colhdr="What"}],
body=[]}
(gdb)
The -break-passcount Command
Synopsis-break-passcount tracepoint-number passcount
Set the passcount for tracepoint tracepoint-number to passcount. If the breakpointreferred to by tracepoint-number is not a tracepoint, error is emitted. This corresponds toCLI command ‘passcount’.
The -break-watch Command
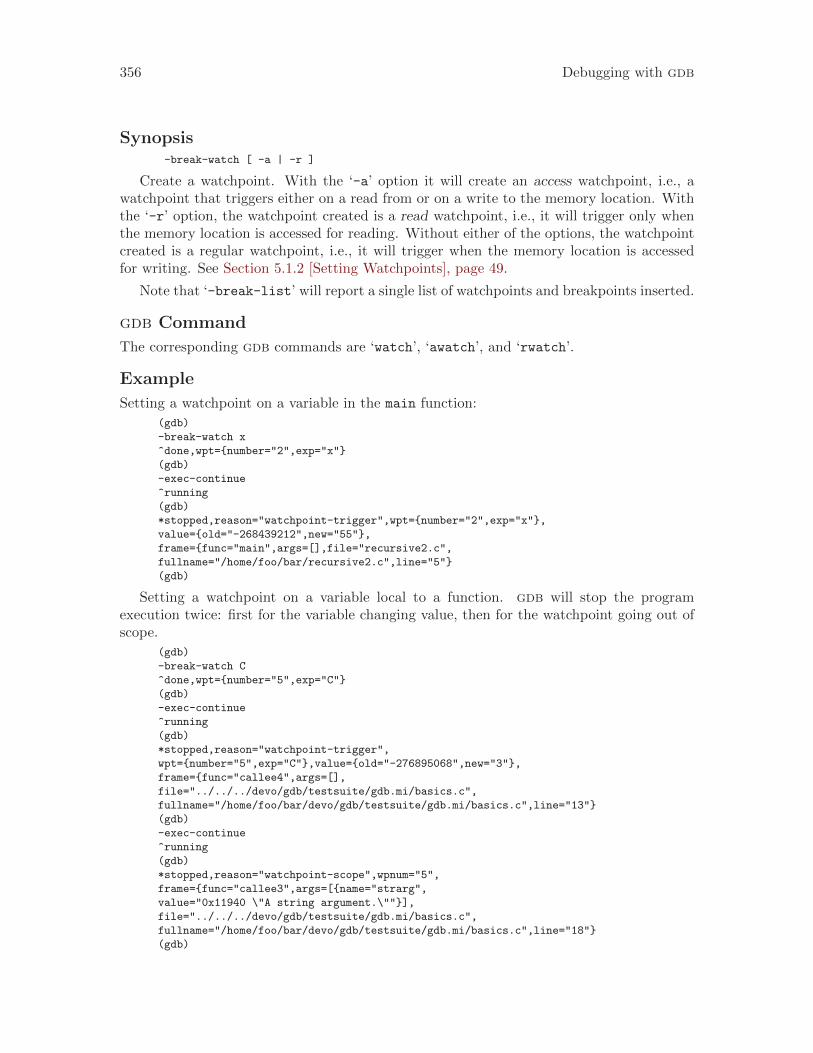
356 Debugging with gdb
Synopsis-break-watch [ -a | -r ]
Create a watchpoint. With the ‘-a’ option it will create an access watchpoint, i.e., awatchpoint that triggers either on a read from or on a write to the memory location. Withthe ‘-r’ option, the watchpoint created is a read watchpoint, i.e., it will trigger only whenthe memory location is accessed for reading. Without either of the options, the watchpointcreated is a regular watchpoint, i.e., it will trigger when the memory location is accessedfor writing. See Section 5.1.2 [Setting Watchpoints], page 49.
Note that ‘-break-list’ will report a single list of watchpoints and breakpoints inserted.
gdb Command
The corresponding gdb commands are ‘watch’, ‘awatch’, and ‘rwatch’.
Example
Setting a watchpoint on a variable in the main function:
(gdb)
-break-watch x
^done,wpt={number="2",exp="x"}
(gdb)
-exec-continue
^running
(gdb)
*stopped,reason="watchpoint-trigger",wpt={number="2",exp="x"},
value={old="-268439212",new="55"},
frame={func="main",args=[],file="recursive2.c",
fullname="/home/foo/bar/recursive2.c",line="5"}
(gdb)
Setting a watchpoint on a variable local to a function. gdb will stop the programexecution twice: first for the variable changing value, then for the watchpoint going out ofscope.
(gdb)
-break-watch C
^done,wpt={number="5",exp="C"}
(gdb)
-exec-continue
^running
(gdb)
*stopped,reason="watchpoint-trigger",
wpt={number="5",exp="C"},value={old="-276895068",new="3"},
frame={func="callee4",args=[],
file="../../../devo/gdb/testsuite/gdb.mi/basics.c",
fullname="/home/foo/bar/devo/gdb/testsuite/gdb.mi/basics.c",line="13"}
(gdb)
-exec-continue
^running
(gdb)
*stopped,reason="watchpoint-scope",wpnum="5",
frame={func="callee3",args=[{name="strarg",
value="0x11940 \"A string argument.\""}],
file="../../../devo/gdb/testsuite/gdb.mi/basics.c",
fullname="/home/foo/bar/devo/gdb/testsuite/gdb.mi/basics.c",line="18"}
(gdb)
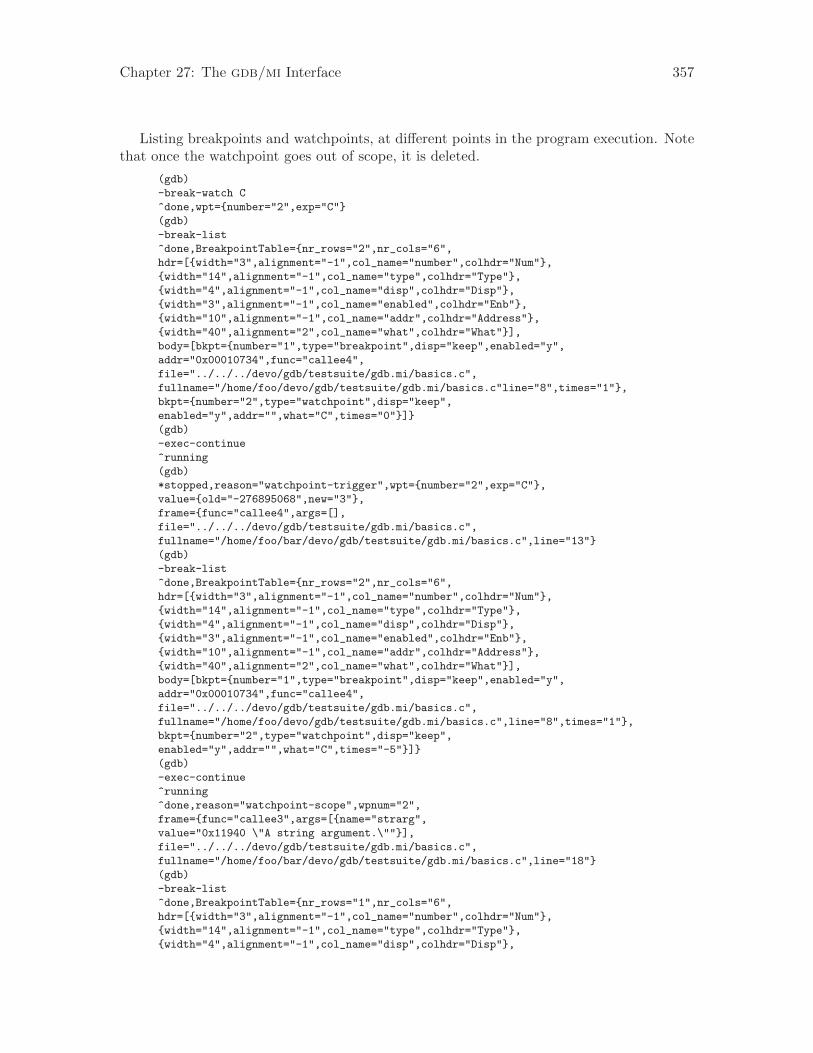
Chapter 27: The gdb/mi Interface 357
Listing breakpoints and watchpoints, at different points in the program execution. Notethat once the watchpoint goes out of scope, it is deleted.
(gdb)
-break-watch C
^done,wpt={number="2",exp="C"}
(gdb)
-break-list
^done,BreakpointTable={nr_rows="2",nr_cols="6",
hdr=[{width="3",alignment="-1",col_name="number",colhdr="Num"},
{width="14",alignment="-1",col_name="type",colhdr="Type"},
{width="4",alignment="-1",col_name="disp",colhdr="Disp"},
{width="3",alignment="-1",col_name="enabled",colhdr="Enb"},
{width="10",alignment="-1",col_name="addr",colhdr="Address"},
{width="40",alignment="2",col_name="what",colhdr="What"}],
body=[bkpt={number="1",type="breakpoint",disp="keep",enabled="y",
addr="0x00010734",func="callee4",
file="../../../devo/gdb/testsuite/gdb.mi/basics.c",
fullname="/home/foo/devo/gdb/testsuite/gdb.mi/basics.c"line="8",times="1"},
bkpt={number="2",type="watchpoint",disp="keep",
enabled="y",addr="",what="C",times="0"}]}
(gdb)
-exec-continue
^running
(gdb)
*stopped,reason="watchpoint-trigger",wpt={number="2",exp="C"},
value={old="-276895068",new="3"},
frame={func="callee4",args=[],
file="../../../devo/gdb/testsuite/gdb.mi/basics.c",
fullname="/home/foo/bar/devo/gdb/testsuite/gdb.mi/basics.c",line="13"}
(gdb)
-break-list
^done,BreakpointTable={nr_rows="2",nr_cols="6",
hdr=[{width="3",alignment="-1",col_name="number",colhdr="Num"},
{width="14",alignment="-1",col_name="type",colhdr="Type"},
{width="4",alignment="-1",col_name="disp",colhdr="Disp"},
{width="3",alignment="-1",col_name="enabled",colhdr="Enb"},
{width="10",alignment="-1",col_name="addr",colhdr="Address"},
{width="40",alignment="2",col_name="what",colhdr="What"}],
body=[bkpt={number="1",type="breakpoint",disp="keep",enabled="y",
addr="0x00010734",func="callee4",
file="../../../devo/gdb/testsuite/gdb.mi/basics.c",
fullname="/home/foo/devo/gdb/testsuite/gdb.mi/basics.c",line="8",times="1"},
bkpt={number="2",type="watchpoint",disp="keep",
enabled="y",addr="",what="C",times="-5"}]}
(gdb)
-exec-continue
^running
^done,reason="watchpoint-scope",wpnum="2",
frame={func="callee3",args=[{name="strarg",
value="0x11940 \"A string argument.\""}],
file="../../../devo/gdb/testsuite/gdb.mi/basics.c",
fullname="/home/foo/bar/devo/gdb/testsuite/gdb.mi/basics.c",line="18"}
(gdb)
-break-list
^done,BreakpointTable={nr_rows="1",nr_cols="6",
hdr=[{width="3",alignment="-1",col_name="number",colhdr="Num"},
{width="14",alignment="-1",col_name="type",colhdr="Type"},
{width="4",alignment="-1",col_name="disp",colhdr="Disp"},
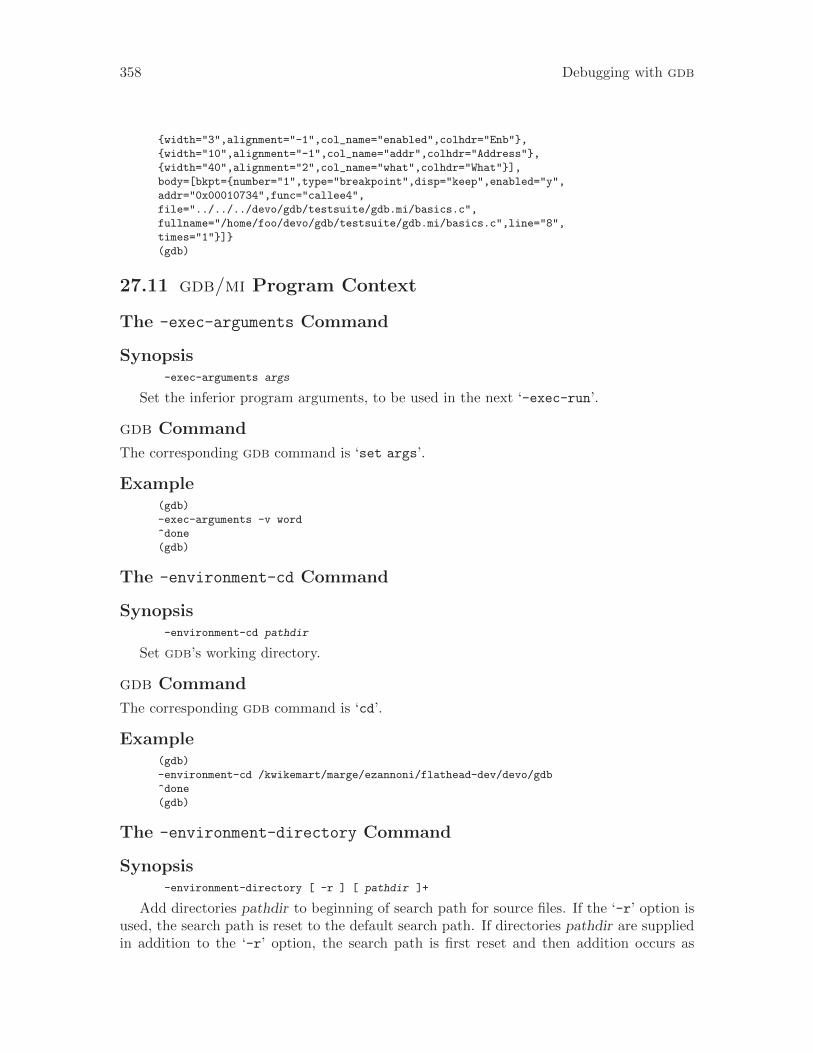
358 Debugging with gdb
{width="3",alignment="-1",col_name="enabled",colhdr="Enb"},
{width="10",alignment="-1",col_name="addr",colhdr="Address"},
{width="40",alignment="2",col_name="what",colhdr="What"}],
body=[bkpt={number="1",type="breakpoint",disp="keep",enabled="y",
addr="0x00010734",func="callee4",
file="../../../devo/gdb/testsuite/gdb.mi/basics.c",
fullname="/home/foo/devo/gdb/testsuite/gdb.mi/basics.c",line="8",
times="1"}]}
(gdb)
27.11 gdb/mi Program Context
The -exec-arguments Command
Synopsis-exec-arguments args
Set the inferior program arguments, to be used in the next ‘-exec-run’.
gdb Command
The corresponding gdb command is ‘set args’.
Example(gdb)
-exec-arguments -v word
^done
(gdb)
The -environment-cd Command
Synopsis-environment-cd pathdir
Set gdb’s working directory.
gdb Command
The corresponding gdb command is ‘cd’.
Example(gdb)
-environment-cd /kwikemart/marge/ezannoni/flathead-dev/devo/gdb
^done
(gdb)
The -environment-directory Command
Synopsis-environment-directory [ -r ] [ pathdir ]+
Add directories pathdir to beginning of search path for source files. If the ‘-r’ option isused, the search path is reset to the default search path. If directories pathdir are suppliedin addition to the ‘-r’ option, the search path is first reset and then addition occurs as
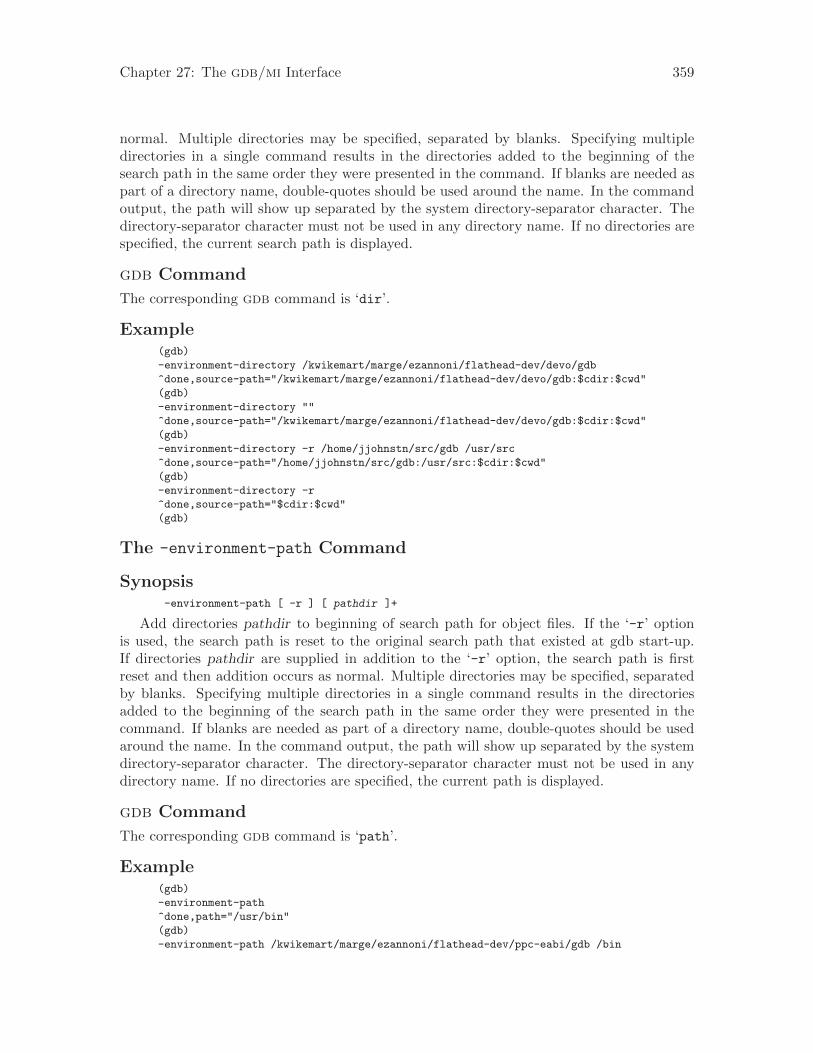
Chapter 27: The gdb/mi Interface 359
normal. Multiple directories may be specified, separated by blanks. Specifying multipledirectories in a single command results in the directories added to the beginning of thesearch path in the same order they were presented in the command. If blanks are needed aspart of a directory name, double-quotes should be used around the name. In the commandoutput, the path will show up separated by the system directory-separator character. Thedirectory-separator character must not be used in any directory name. If no directories arespecified, the current search path is displayed.
gdb Command
The corresponding gdb command is ‘dir’.
Example(gdb)
-environment-directory /kwikemart/marge/ezannoni/flathead-dev/devo/gdb
^done,source-path="/kwikemart/marge/ezannoni/flathead-dev/devo/gdb:$cdir:$cwd"
(gdb)
-environment-directory ""
^done,source-path="/kwikemart/marge/ezannoni/flathead-dev/devo/gdb:$cdir:$cwd"
(gdb)
-environment-directory -r /home/jjohnstn/src/gdb /usr/src
^done,source-path="/home/jjohnstn/src/gdb:/usr/src:$cdir:$cwd"
(gdb)
-environment-directory -r
^done,source-path="$cdir:$cwd"
(gdb)
The -environment-path Command
Synopsis-environment-path [ -r ] [ pathdir ]+
Add directories pathdir to beginning of search path for object files. If the ‘-r’ optionis used, the search path is reset to the original search path that existed at gdb start-up.If directories pathdir are supplied in addition to the ‘-r’ option, the search path is firstreset and then addition occurs as normal. Multiple directories may be specified, separatedby blanks. Specifying multiple directories in a single command results in the directoriesadded to the beginning of the search path in the same order they were presented in thecommand. If blanks are needed as part of a directory name, double-quotes should be usedaround the name. In the command output, the path will show up separated by the systemdirectory-separator character. The directory-separator character must not be used in anydirectory name. If no directories are specified, the current path is displayed.
gdb Command
The corresponding gdb command is ‘path’.
Example(gdb)
-environment-path
^done,path="/usr/bin"
(gdb)
-environment-path /kwikemart/marge/ezannoni/flathead-dev/ppc-eabi/gdb /bin
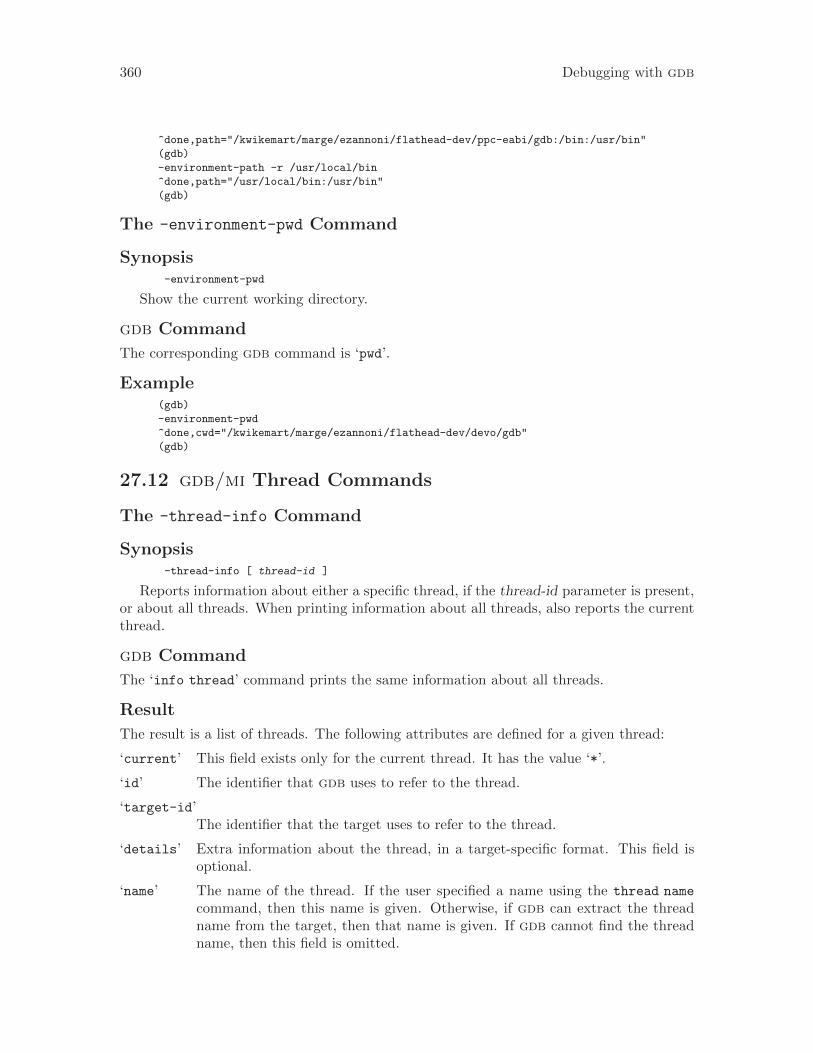
360 Debugging with gdb
^done,path="/kwikemart/marge/ezannoni/flathead-dev/ppc-eabi/gdb:/bin:/usr/bin"
(gdb)
-environment-path -r /usr/local/bin
^done,path="/usr/local/bin:/usr/bin"
(gdb)
The -environment-pwd Command
Synopsis-environment-pwd
Show the current working directory.
gdb Command
The corresponding gdb command is ‘pwd’.
Example(gdb)
-environment-pwd
^done,cwd="/kwikemart/marge/ezannoni/flathead-dev/devo/gdb"
(gdb)
27.12 gdb/mi Thread Commands
The -thread-info Command
Synopsis-thread-info [ thread-id ]
Reports information about either a specific thread, if the thread-id parameter is present,or about all threads. When printing information about all threads, also reports the currentthread.
gdb Command
The ‘info thread’ command prints the same information about all threads.
Result
The result is a list of threads. The following attributes are defined for a given thread:
‘current’ This field exists only for the current thread. It has the value ‘*’.
‘id’ The identifier that gdb uses to refer to the thread.
‘target-id’The identifier that the target uses to refer to the thread.
‘details’ Extra information about the thread, in a target-specific format. This field isoptional.
‘name’ The name of the thread. If the user specified a name using the thread name
command, then this name is given. Otherwise, if gdb can extract the threadname from the target, then that name is given. If gdb cannot find the threadname, then this field is omitted.
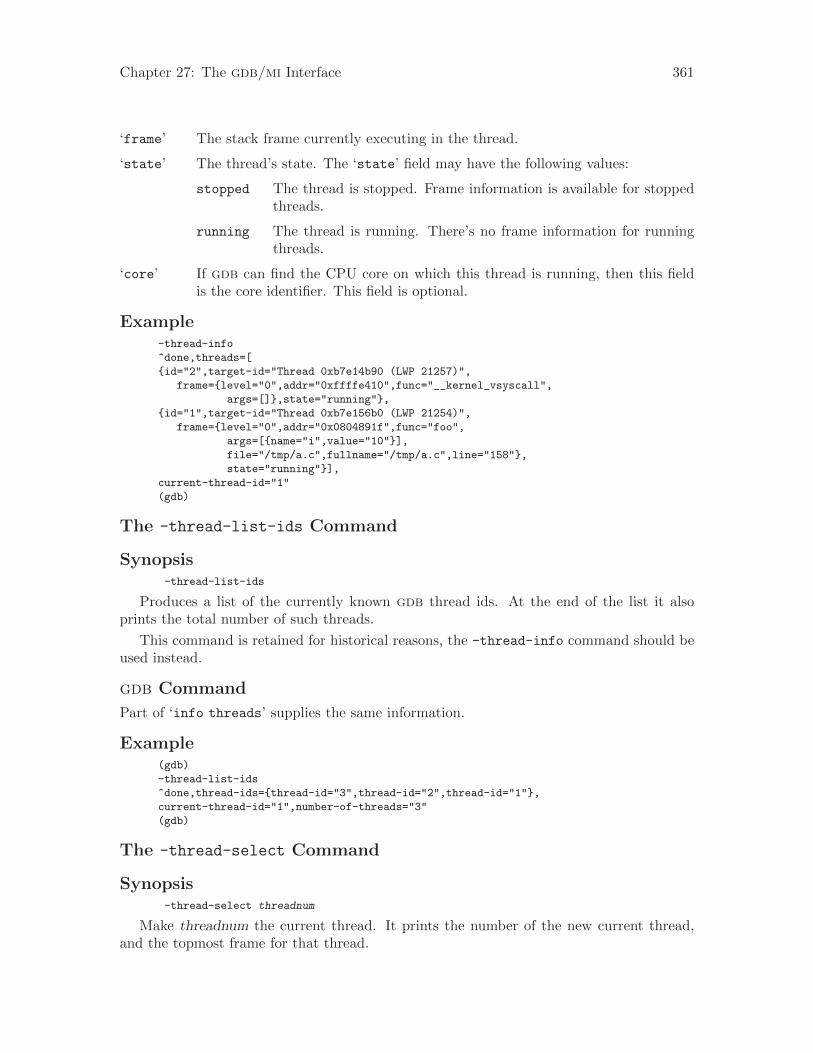
Chapter 27: The gdb/mi Interface 361
‘frame’ The stack frame currently executing in the thread.
‘state’ The thread’s state. The ‘state’ field may have the following values:
stopped The thread is stopped. Frame information is available for stoppedthreads.
running The thread is running. There’s no frame information for runningthreads.
‘core’ If gdb can find the CPU core on which this thread is running, then this fieldis the core identifier. This field is optional.
Example-thread-info
^done,threads=[
{id="2",target-id="Thread 0xb7e14b90 (LWP 21257)",
frame={level="0",addr="0xffffe410",func="__kernel_vsyscall",
args=[]},state="running"},
{id="1",target-id="Thread 0xb7e156b0 (LWP 21254)",
frame={level="0",addr="0x0804891f",func="foo",
args=[{name="i",value="10"}],
file="/tmp/a.c",fullname="/tmp/a.c",line="158"},
state="running"}],
current-thread-id="1"
(gdb)
The -thread-list-ids Command
Synopsis-thread-list-ids
Produces a list of the currently known gdb thread ids. At the end of the list it alsoprints the total number of such threads.
This command is retained for historical reasons, the -thread-info command should beused instead.
gdb Command
Part of ‘info threads’ supplies the same information.
Example(gdb)
-thread-list-ids
^done,thread-ids={thread-id="3",thread-id="2",thread-id="1"},
current-thread-id="1",number-of-threads="3"
(gdb)
The -thread-select Command
Synopsis-thread-select threadnum
Make threadnum the current thread. It prints the number of the new current thread,and the topmost frame for that thread.
362 Debugging with gdb
This command is deprecated in favor of explicitly using the ‘--thread’ option to eachcommand.
gdb Command
The corresponding gdb command is ‘thread’.
Example(gdb)
-exec-next
^running
(gdb)
*stopped,reason="end-stepping-range",thread-id="2",line="187",
file="../../../devo/gdb/testsuite/gdb.threads/linux-dp.c"
(gdb)
-thread-list-ids
^done,
thread-ids={thread-id="3",thread-id="2",thread-id="1"},
number-of-threads="3"
(gdb)
-thread-select 3
^done,new-thread-id="3",
frame={level="0",func="vprintf",
args=[{name="format",value="0x8048e9c \"%*s%c %d %c\\n\""},
{name="arg",value="0x2"}],file="vprintf.c",line="31"}
(gdb)
27.13 gdb/mi Ada Tasking Commands
The -ada-task-info Command
Synopsis-ada-task-info [ task-id ]
Reports information about either a specific Ada task, if the task-id parameter is present,or about all Ada tasks.
gdb Command
The ‘info tasks’ command prints the same information about all Ada tasks (seeSection 15.4.8.5 [Ada Tasks], page 183).
Result
The result is a table of Ada tasks. The following columns are defined for each Ada task:
‘current’ This field exists only for the current thread. It has the value ‘*’.
‘id’ The identifier that gdb uses to refer to the Ada task.
‘task-id’ The identifier that the target uses to refer to the Ada task.
‘thread-id’The identifier of the thread corresponding to the Ada task.
This field should always exist, as Ada tasks are always implemented on top ofa thread. But if gdb cannot find this corresponding thread for any reason, thefield is omitted.
Chapter 27: The gdb/mi Interface 363
‘parent-id’This field exists only when the task was created by another task. In this case,it provides the ID of the parent task.
‘priority’The base priority of the task.
‘state’ The current state of the task. For a detailed description of the possible states,see Section 15.4.8.5 [Ada Tasks], page 183.
‘name’ The name of the task.
Example-ada-task-info
^done,tasks={nr_rows="3",nr_cols="8",
hdr=[{width="1",alignment="-1",col_name="current",colhdr=""},
{width="3",alignment="1",col_name="id",colhdr="ID"},
{width="9",alignment="1",col_name="task-id",colhdr="TID"},
{width="4",alignment="1",col_name="thread-id",colhdr=""},
{width="4",alignment="1",col_name="parent-id",colhdr="P-ID"},
{width="3",alignment="1",col_name="priority",colhdr="Pri"},
{width="22",alignment="-1",col_name="state",colhdr="State"},
{width="1",alignment="2",col_name="name",colhdr="Name"}],
body=[{current="*",id="1",task-id=" 644010",thread-id="1",priority="48",
state="Child Termination Wait",name="main_task"}]}
(gdb)
27.14 gdb/mi Program Execution
These are the asynchronous commands which generate the out-of-band record ‘*stopped’.Currently gdb only really executes asynchronously with remote targets and this interactionis mimicked in other cases.
The -exec-continue Command
Synopsis-exec-continue [--reverse] [--all|--thread-group N]
Resumes the execution of the inferior program, which will continue to execute until itreaches a debugger stop event. If the ‘--reverse’ option is specified, execution resumes inreverse until it reaches a stop event. Stop events may include
• breakpoints or watchpoints
• signals or exceptions
• the end of the process (or its beginning under ‘--reverse’)
• the end or beginning of a replay log if one is being used.
In all-stop mode (see Section 5.5.1 [All-Stop Mode], page 68), may resume only onethread, or all threads, depending on the value of the ‘scheduler-locking’ variable. If‘--all’ is specified, all threads (in all inferiors) will be resumed. The ‘--all’ option isignored in all-stop mode. If the ‘--thread-group’ options is specified, then all threads inthat thread group are resumed.
364 Debugging with gdb
gdb Command
The corresponding gdb corresponding is ‘continue’.
Example-exec-continue
^running
(gdb)
@Hello world
*stopped,reason="breakpoint-hit",disp="keep",bkptno="2",frame={
func="foo",args=[],file="hello.c",fullname="/home/foo/bar/hello.c",
line="13"}
(gdb)
The -exec-finish Command
Synopsis-exec-finish [--reverse]
Resumes the execution of the inferior program until the current function is exited. Dis-plays the results returned by the function. If the ‘--reverse’ option is specified, resumesthe reverse execution of the inferior program until the point where current function wascalled.
gdb Command
The corresponding gdb command is ‘finish’.
Example
Function returning void.-exec-finish
^running
(gdb)
@hello from foo
*stopped,reason="function-finished",frame={func="main",args=[],
file="hello.c",fullname="/home/foo/bar/hello.c",line="7"}
(gdb)
Function returning other than void. The name of the internal gdb variable storing theresult is printed, together with the value itself.
-exec-finish
^running
(gdb)
*stopped,reason="function-finished",frame={addr="0x000107b0",func="foo",
args=[{name="a",value="1"],{name="b",value="9"}},
file="recursive2.c",fullname="/home/foo/bar/recursive2.c",line="14"},
gdb-result-var="$1",return-value="0"
(gdb)
The -exec-interrupt Command
Synopsis-exec-interrupt [--all|--thread-group N]
Interrupts the background execution of the target. Note how the token associated withthe stop message is the one for the execution command that has been interrupted. The
Chapter 27: The gdb/mi Interface 365
token for the interrupt itself only appears in the ‘^done’ output. If the user is trying tointerrupt a non-running program, an error message will be printed.
Note that when asynchronous execution is enabled, this command is asynchronous justlike other execution commands. That is, first the ‘^done’ response will be printed, and thetarget stop will be reported after that using the ‘*stopped’ notification.
In non-stop mode, only the context thread is interrupted by default. All threads (inall inferiors) will be interrupted if the ‘--all’ option is specified. If the ‘--thread-group’option is specified, all threads in that group will be interrupted.
gdb Command
The corresponding gdb command is ‘interrupt’.
Example(gdb)
111-exec-continue
111^running
(gdb)
222-exec-interrupt
222^done
(gdb)
111*stopped,signal-name="SIGINT",signal-meaning="Interrupt",
frame={addr="0x00010140",func="foo",args=[],file="try.c",
fullname="/home/foo/bar/try.c",line="13"}
(gdb)
(gdb)
-exec-interrupt
^error,msg="mi_cmd_exec_interrupt: Inferior not executing."
(gdb)
The -exec-jump Command
Synopsis-exec-jump location
Resumes execution of the inferior program at the location specified by parameter. SeeSection 9.2 [Specify Location], page 88, for a description of the different forms of location.
gdb Command
The corresponding gdb command is ‘jump’.
Example-exec-jump foo.c:10
*running,thread-id="all"
^running
The -exec-next Command
Synopsis-exec-next [--reverse]
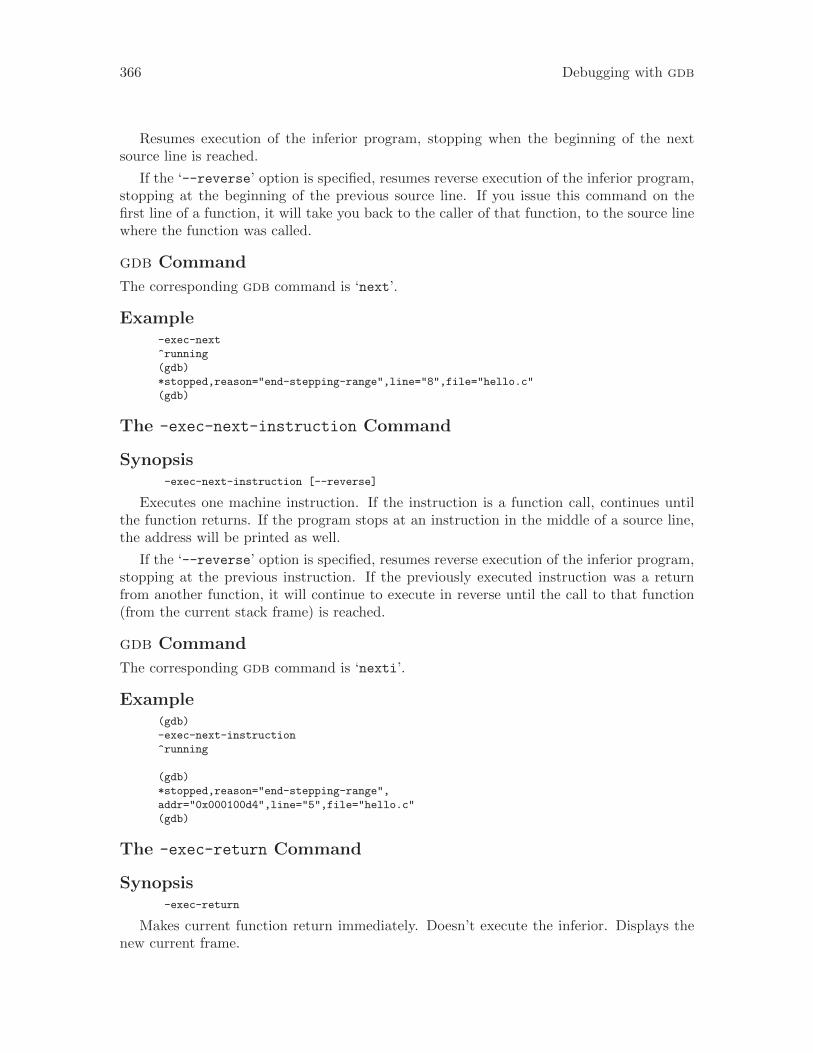
366 Debugging with gdb
Resumes execution of the inferior program, stopping when the beginning of the nextsource line is reached.
If the ‘--reverse’ option is specified, resumes reverse execution of the inferior program,stopping at the beginning of the previous source line. If you issue this command on thefirst line of a function, it will take you back to the caller of that function, to the source linewhere the function was called.
gdb Command
The corresponding gdb command is ‘next’.
Example-exec-next
^running
(gdb)
*stopped,reason="end-stepping-range",line="8",file="hello.c"
(gdb)
The -exec-next-instruction Command
Synopsis-exec-next-instruction [--reverse]
Executes one machine instruction. If the instruction is a function call, continues untilthe function returns. If the program stops at an instruction in the middle of a source line,the address will be printed as well.
If the ‘--reverse’ option is specified, resumes reverse execution of the inferior program,stopping at the previous instruction. If the previously executed instruction was a returnfrom another function, it will continue to execute in reverse until the call to that function(from the current stack frame) is reached.
gdb Command
The corresponding gdb command is ‘nexti’.
Example(gdb)
-exec-next-instruction
^running
(gdb)
*stopped,reason="end-stepping-range",
addr="0x000100d4",line="5",file="hello.c"
(gdb)
The -exec-return Command
Synopsis-exec-return
Makes current function return immediately. Doesn’t execute the inferior. Displays thenew current frame.
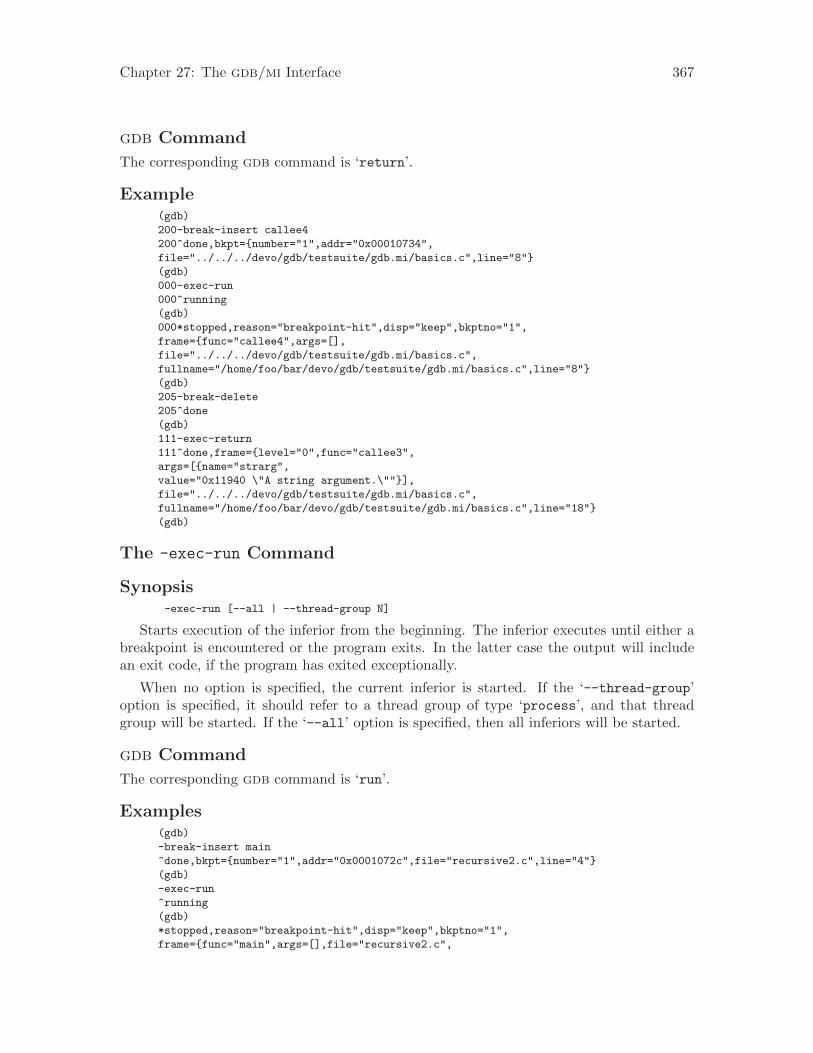
Chapter 27: The gdb/mi Interface 367
gdb Command
The corresponding gdb command is ‘return’.
Example(gdb)
200-break-insert callee4
200^done,bkpt={number="1",addr="0x00010734",
file="../../../devo/gdb/testsuite/gdb.mi/basics.c",line="8"}
(gdb)
000-exec-run
000^running
(gdb)
000*stopped,reason="breakpoint-hit",disp="keep",bkptno="1",
frame={func="callee4",args=[],
file="../../../devo/gdb/testsuite/gdb.mi/basics.c",
fullname="/home/foo/bar/devo/gdb/testsuite/gdb.mi/basics.c",line="8"}
(gdb)
205-break-delete
205^done
(gdb)
111-exec-return
111^done,frame={level="0",func="callee3",
args=[{name="strarg",
value="0x11940 \"A string argument.\""}],
file="../../../devo/gdb/testsuite/gdb.mi/basics.c",
fullname="/home/foo/bar/devo/gdb/testsuite/gdb.mi/basics.c",line="18"}
(gdb)
The -exec-run Command
Synopsis-exec-run [--all | --thread-group N]
Starts execution of the inferior from the beginning. The inferior executes until either abreakpoint is encountered or the program exits. In the latter case the output will includean exit code, if the program has exited exceptionally.
When no option is specified, the current inferior is started. If the ‘--thread-group’option is specified, it should refer to a thread group of type ‘process’, and that threadgroup will be started. If the ‘--all’ option is specified, then all inferiors will be started.
gdb Command
The corresponding gdb command is ‘run’.
Examples(gdb)
-break-insert main
^done,bkpt={number="1",addr="0x0001072c",file="recursive2.c",line="4"}
(gdb)
-exec-run
^running
(gdb)
*stopped,reason="breakpoint-hit",disp="keep",bkptno="1",
frame={func="main",args=[],file="recursive2.c",
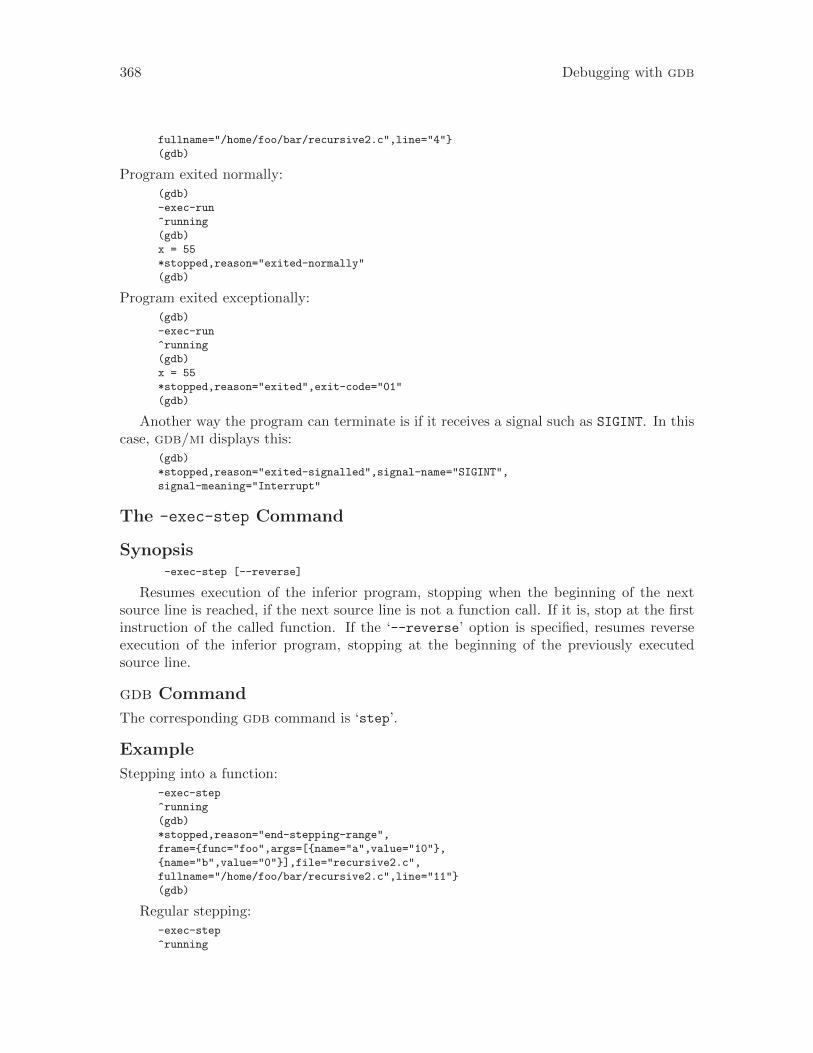
368 Debugging with gdb
fullname="/home/foo/bar/recursive2.c",line="4"}
(gdb)
Program exited normally:
(gdb)
-exec-run
^running
(gdb)
x = 55
*stopped,reason="exited-normally"
(gdb)
Program exited exceptionally:
(gdb)
-exec-run
^running
(gdb)
x = 55
*stopped,reason="exited",exit-code="01"
(gdb)
Another way the program can terminate is if it receives a signal such as SIGINT. In thiscase, gdb/mi displays this:
(gdb)
*stopped,reason="exited-signalled",signal-name="SIGINT",
signal-meaning="Interrupt"
The -exec-step Command
Synopsis-exec-step [--reverse]
Resumes execution of the inferior program, stopping when the beginning of the nextsource line is reached, if the next source line is not a function call. If it is, stop at the firstinstruction of the called function. If the ‘--reverse’ option is specified, resumes reverseexecution of the inferior program, stopping at the beginning of the previously executedsource line.
gdb Command
The corresponding gdb command is ‘step’.
Example
Stepping into a function:
-exec-step
^running
(gdb)
*stopped,reason="end-stepping-range",
frame={func="foo",args=[{name="a",value="10"},
{name="b",value="0"}],file="recursive2.c",
fullname="/home/foo/bar/recursive2.c",line="11"}
(gdb)
Regular stepping:
-exec-step
^running
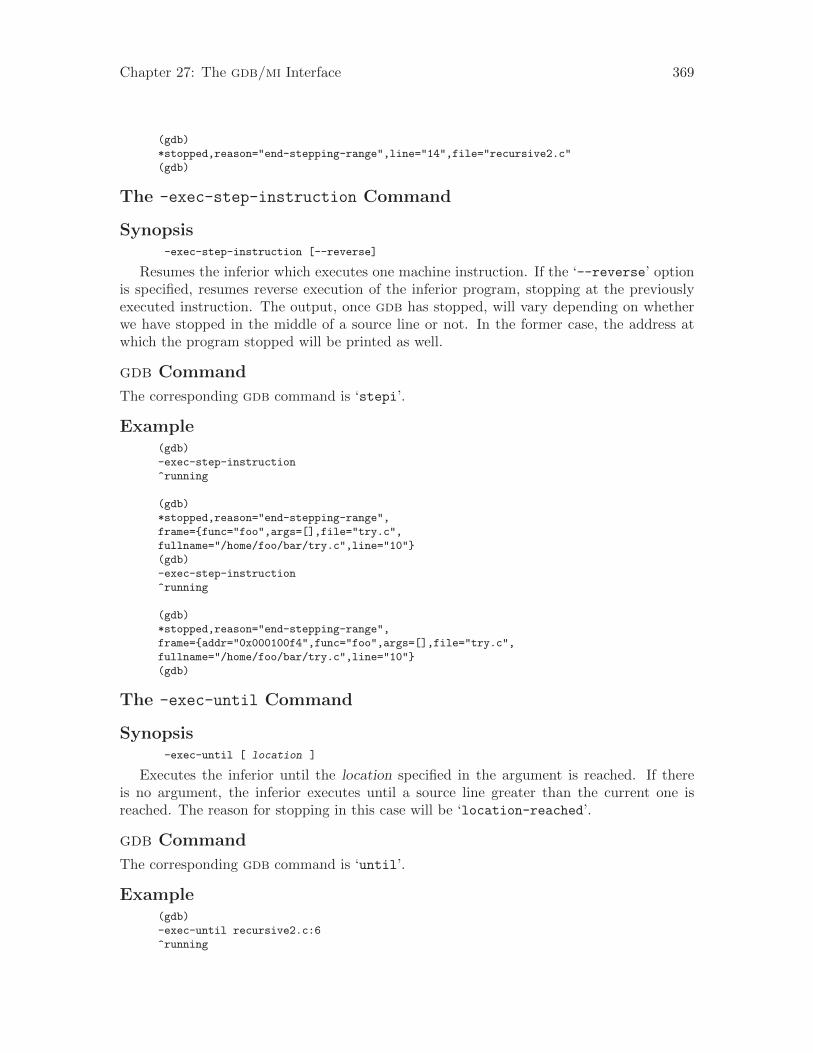
Chapter 27: The gdb/mi Interface 369
(gdb)
*stopped,reason="end-stepping-range",line="14",file="recursive2.c"
(gdb)
The -exec-step-instruction Command
Synopsis-exec-step-instruction [--reverse]
Resumes the inferior which executes one machine instruction. If the ‘--reverse’ optionis specified, resumes reverse execution of the inferior program, stopping at the previouslyexecuted instruction. The output, once gdb has stopped, will vary depending on whetherwe have stopped in the middle of a source line or not. In the former case, the address atwhich the program stopped will be printed as well.
gdb Command
The corresponding gdb command is ‘stepi’.
Example(gdb)
-exec-step-instruction
^running
(gdb)
*stopped,reason="end-stepping-range",
frame={func="foo",args=[],file="try.c",
fullname="/home/foo/bar/try.c",line="10"}
(gdb)
-exec-step-instruction
^running
(gdb)
*stopped,reason="end-stepping-range",
frame={addr="0x000100f4",func="foo",args=[],file="try.c",
fullname="/home/foo/bar/try.c",line="10"}
(gdb)
The -exec-until Command
Synopsis-exec-until [ location ]
Executes the inferior until the location specified in the argument is reached. If thereis no argument, the inferior executes until a source line greater than the current one isreached. The reason for stopping in this case will be ‘location-reached’.
gdb Command
The corresponding gdb command is ‘until’.
Example(gdb)
-exec-until recursive2.c:6
^running
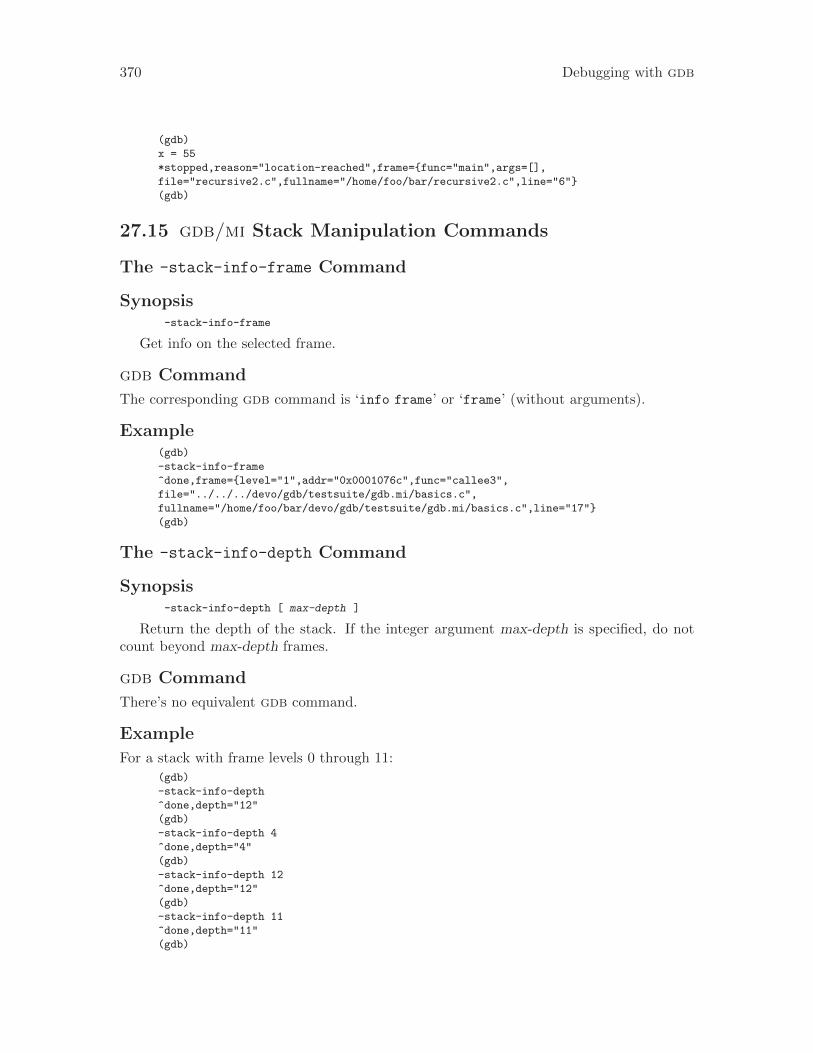
370 Debugging with gdb
(gdb)
x = 55
*stopped,reason="location-reached",frame={func="main",args=[],
file="recursive2.c",fullname="/home/foo/bar/recursive2.c",line="6"}
(gdb)
27.15 gdb/mi Stack Manipulation Commands
The -stack-info-frame Command
Synopsis-stack-info-frame
Get info on the selected frame.
gdb Command
The corresponding gdb command is ‘info frame’ or ‘frame’ (without arguments).
Example(gdb)
-stack-info-frame
^done,frame={level="1",addr="0x0001076c",func="callee3",
file="../../../devo/gdb/testsuite/gdb.mi/basics.c",
fullname="/home/foo/bar/devo/gdb/testsuite/gdb.mi/basics.c",line="17"}
(gdb)
The -stack-info-depth Command
Synopsis-stack-info-depth [ max-depth ]
Return the depth of the stack. If the integer argument max-depth is specified, do notcount beyond max-depth frames.
gdb Command
There’s no equivalent gdb command.
Example
For a stack with frame levels 0 through 11:
(gdb)
-stack-info-depth
^done,depth="12"
(gdb)
-stack-info-depth 4
^done,depth="4"
(gdb)
-stack-info-depth 12
^done,depth="12"
(gdb)
-stack-info-depth 11
^done,depth="11"
(gdb)
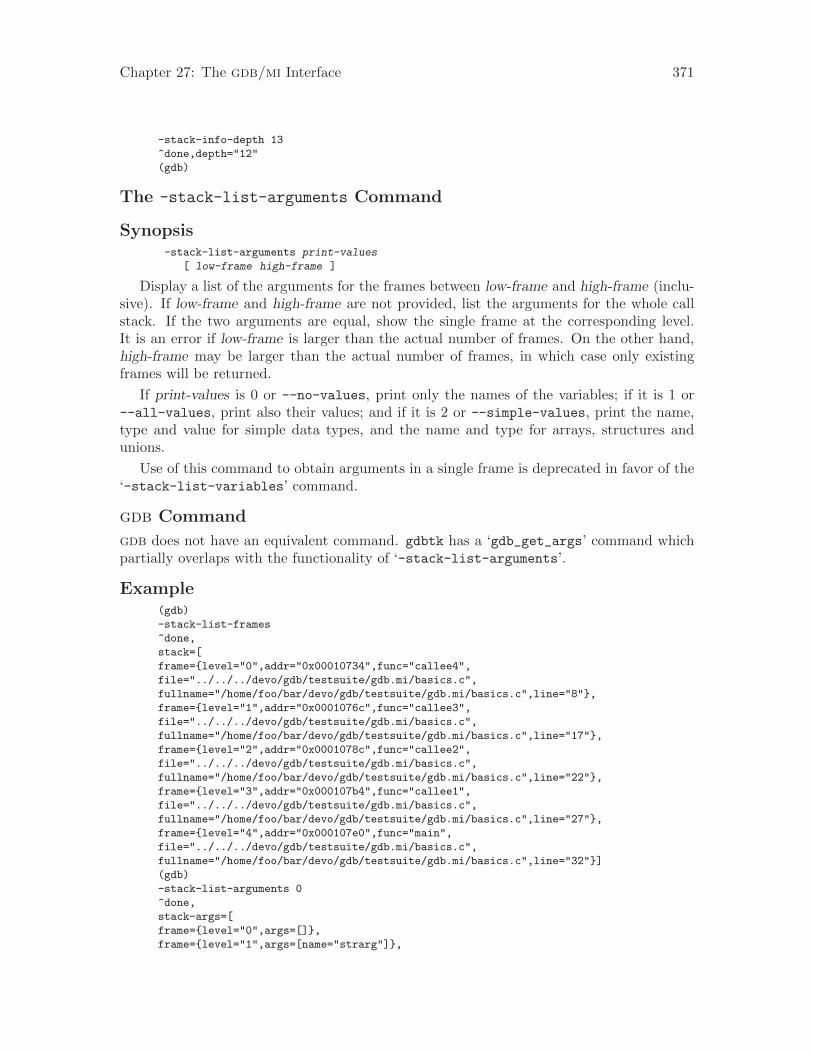
Chapter 27: The gdb/mi Interface 371
-stack-info-depth 13
^done,depth="12"
(gdb)
The -stack-list-arguments Command
Synopsis-stack-list-arguments print-values
[ low-frame high-frame ]
Display a list of the arguments for the frames between low-frame and high-frame (inclu-sive). If low-frame and high-frame are not provided, list the arguments for the whole callstack. If the two arguments are equal, show the single frame at the corresponding level.It is an error if low-frame is larger than the actual number of frames. On the other hand,high-frame may be larger than the actual number of frames, in which case only existingframes will be returned.
If print-values is 0 or --no-values, print only the names of the variables; if it is 1 or--all-values, print also their values; and if it is 2 or --simple-values, print the name,type and value for simple data types, and the name and type for arrays, structures andunions.
Use of this command to obtain arguments in a single frame is deprecated in favor of the‘-stack-list-variables’ command.
gdb Command
gdb does not have an equivalent command. gdbtk has a ‘gdb_get_args’ command whichpartially overlaps with the functionality of ‘-stack-list-arguments’.
Example(gdb)
-stack-list-frames
^done,
stack=[
frame={level="0",addr="0x00010734",func="callee4",
file="../../../devo/gdb/testsuite/gdb.mi/basics.c",
fullname="/home/foo/bar/devo/gdb/testsuite/gdb.mi/basics.c",line="8"},
frame={level="1",addr="0x0001076c",func="callee3",
file="../../../devo/gdb/testsuite/gdb.mi/basics.c",
fullname="/home/foo/bar/devo/gdb/testsuite/gdb.mi/basics.c",line="17"},
frame={level="2",addr="0x0001078c",func="callee2",
file="../../../devo/gdb/testsuite/gdb.mi/basics.c",
fullname="/home/foo/bar/devo/gdb/testsuite/gdb.mi/basics.c",line="22"},
frame={level="3",addr="0x000107b4",func="callee1",
file="../../../devo/gdb/testsuite/gdb.mi/basics.c",
fullname="/home/foo/bar/devo/gdb/testsuite/gdb.mi/basics.c",line="27"},
frame={level="4",addr="0x000107e0",func="main",
file="../../../devo/gdb/testsuite/gdb.mi/basics.c",
fullname="/home/foo/bar/devo/gdb/testsuite/gdb.mi/basics.c",line="32"}]
(gdb)
-stack-list-arguments 0
^done,
stack-args=[
frame={level="0",args=[]},
frame={level="1",args=[name="strarg"]},
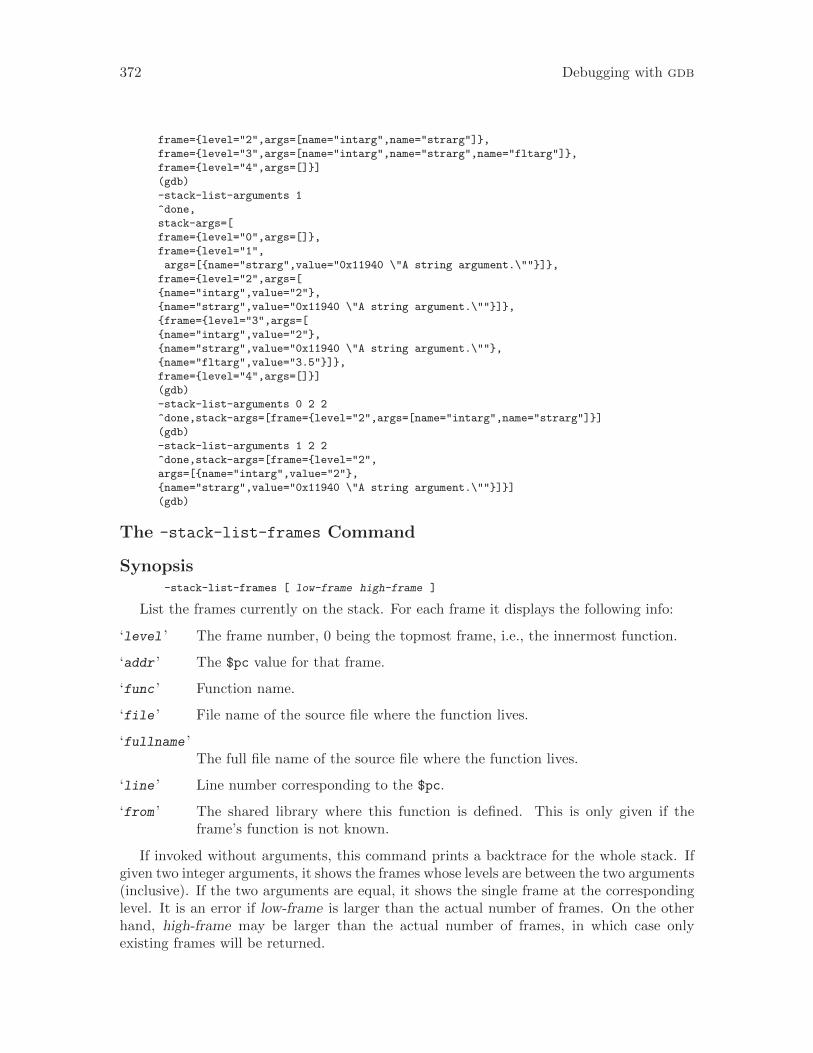
372 Debugging with gdb
frame={level="2",args=[name="intarg",name="strarg"]},
frame={level="3",args=[name="intarg",name="strarg",name="fltarg"]},
frame={level="4",args=[]}]
(gdb)
-stack-list-arguments 1
^done,
stack-args=[
frame={level="0",args=[]},
frame={level="1",
args=[{name="strarg",value="0x11940 \"A string argument.\""}]},
frame={level="2",args=[
{name="intarg",value="2"},
{name="strarg",value="0x11940 \"A string argument.\""}]},
{frame={level="3",args=[
{name="intarg",value="2"},
{name="strarg",value="0x11940 \"A string argument.\""},
{name="fltarg",value="3.5"}]},
frame={level="4",args=[]}]
(gdb)
-stack-list-arguments 0 2 2
^done,stack-args=[frame={level="2",args=[name="intarg",name="strarg"]}]
(gdb)
-stack-list-arguments 1 2 2
^done,stack-args=[frame={level="2",
args=[{name="intarg",value="2"},
{name="strarg",value="0x11940 \"A string argument.\""}]}]
(gdb)
The -stack-list-frames Command
Synopsis-stack-list-frames [ low-frame high-frame ]
List the frames currently on the stack. For each frame it displays the following info:
‘level ’ The frame number, 0 being the topmost frame, i.e., the innermost function.
‘addr ’ The $pc value for that frame.
‘func ’ Function name.
‘file ’ File name of the source file where the function lives.
‘fullname ’The full file name of the source file where the function lives.
‘line ’ Line number corresponding to the $pc.
‘from ’ The shared library where this function is defined. This is only given if theframe’s function is not known.
If invoked without arguments, this command prints a backtrace for the whole stack. Ifgiven two integer arguments, it shows the frames whose levels are between the two arguments(inclusive). If the two arguments are equal, it shows the single frame at the correspondinglevel. It is an error if low-frame is larger than the actual number of frames. On the otherhand, high-frame may be larger than the actual number of frames, in which case onlyexisting frames will be returned.
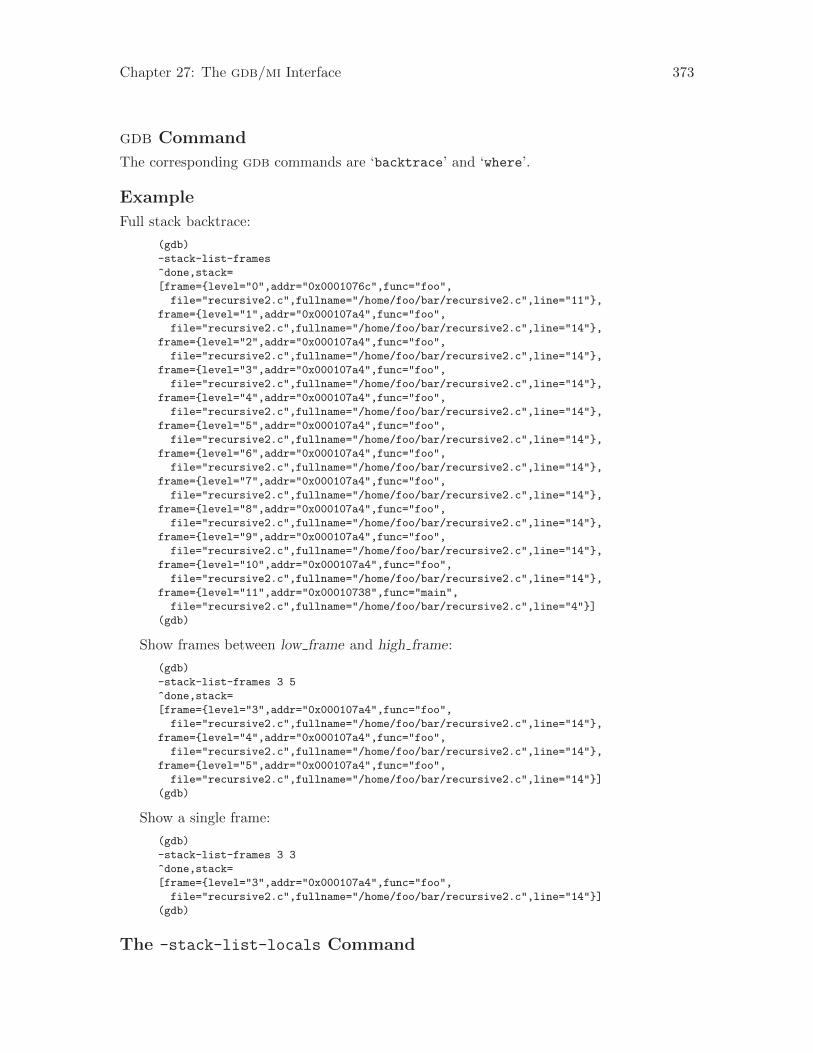
Chapter 27: The gdb/mi Interface 373
gdb Command
The corresponding gdb commands are ‘backtrace’ and ‘where’.
Example
Full stack backtrace:
(gdb)
-stack-list-frames
^done,stack=
[frame={level="0",addr="0x0001076c",func="foo",
file="recursive2.c",fullname="/home/foo/bar/recursive2.c",line="11"},
frame={level="1",addr="0x000107a4",func="foo",
file="recursive2.c",fullname="/home/foo/bar/recursive2.c",line="14"},
frame={level="2",addr="0x000107a4",func="foo",
file="recursive2.c",fullname="/home/foo/bar/recursive2.c",line="14"},
frame={level="3",addr="0x000107a4",func="foo",
file="recursive2.c",fullname="/home/foo/bar/recursive2.c",line="14"},
frame={level="4",addr="0x000107a4",func="foo",
file="recursive2.c",fullname="/home/foo/bar/recursive2.c",line="14"},
frame={level="5",addr="0x000107a4",func="foo",
file="recursive2.c",fullname="/home/foo/bar/recursive2.c",line="14"},
frame={level="6",addr="0x000107a4",func="foo",
file="recursive2.c",fullname="/home/foo/bar/recursive2.c",line="14"},
frame={level="7",addr="0x000107a4",func="foo",
file="recursive2.c",fullname="/home/foo/bar/recursive2.c",line="14"},
frame={level="8",addr="0x000107a4",func="foo",
file="recursive2.c",fullname="/home/foo/bar/recursive2.c",line="14"},
frame={level="9",addr="0x000107a4",func="foo",
file="recursive2.c",fullname="/home/foo/bar/recursive2.c",line="14"},
frame={level="10",addr="0x000107a4",func="foo",
file="recursive2.c",fullname="/home/foo/bar/recursive2.c",line="14"},
frame={level="11",addr="0x00010738",func="main",
file="recursive2.c",fullname="/home/foo/bar/recursive2.c",line="4"}]
(gdb)
Show frames between low frame and high frame:
(gdb)
-stack-list-frames 3 5
^done,stack=
[frame={level="3",addr="0x000107a4",func="foo",
file="recursive2.c",fullname="/home/foo/bar/recursive2.c",line="14"},
frame={level="4",addr="0x000107a4",func="foo",
file="recursive2.c",fullname="/home/foo/bar/recursive2.c",line="14"},
frame={level="5",addr="0x000107a4",func="foo",
file="recursive2.c",fullname="/home/foo/bar/recursive2.c",line="14"}]
(gdb)
Show a single frame:
(gdb)
-stack-list-frames 3 3
^done,stack=
[frame={level="3",addr="0x000107a4",func="foo",
file="recursive2.c",fullname="/home/foo/bar/recursive2.c",line="14"}]
(gdb)
The -stack-list-locals Command
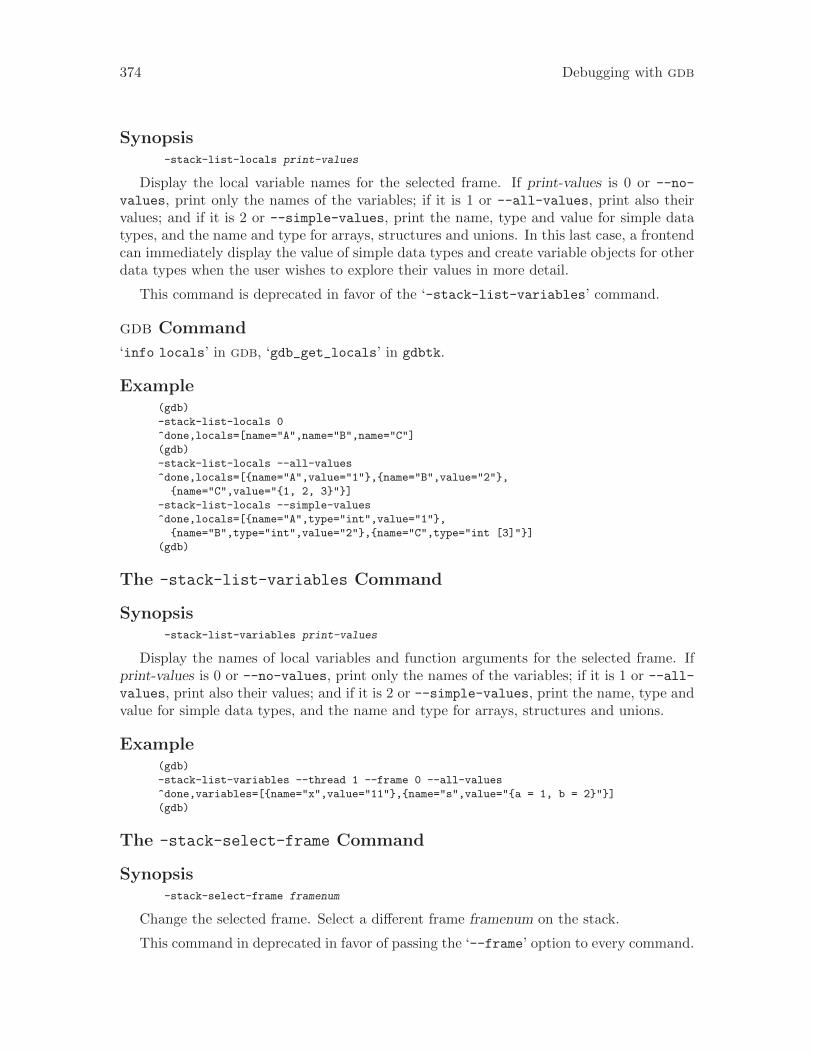
374 Debugging with gdb
Synopsis-stack-list-locals print-values
Display the local variable names for the selected frame. If print-values is 0 or --no-
values, print only the names of the variables; if it is 1 or --all-values, print also theirvalues; and if it is 2 or --simple-values, print the name, type and value for simple datatypes, and the name and type for arrays, structures and unions. In this last case, a frontendcan immediately display the value of simple data types and create variable objects for otherdata types when the user wishes to explore their values in more detail.
This command is deprecated in favor of the ‘-stack-list-variables’ command.
gdb Command
‘info locals’ in gdb, ‘gdb_get_locals’ in gdbtk.
Example(gdb)
-stack-list-locals 0
^done,locals=[name="A",name="B",name="C"]
(gdb)
-stack-list-locals --all-values
^done,locals=[{name="A",value="1"},{name="B",value="2"},
{name="C",value="{1, 2, 3}"}]
-stack-list-locals --simple-values
^done,locals=[{name="A",type="int",value="1"},
{name="B",type="int",value="2"},{name="C",type="int [3]"}]
(gdb)
The -stack-list-variables Command
Synopsis-stack-list-variables print-values
Display the names of local variables and function arguments for the selected frame. Ifprint-values is 0 or --no-values, print only the names of the variables; if it is 1 or --all-values, print also their values; and if it is 2 or --simple-values, print the name, type andvalue for simple data types, and the name and type for arrays, structures and unions.
Example(gdb)
-stack-list-variables --thread 1 --frame 0 --all-values
^done,variables=[{name="x",value="11"},{name="s",value="{a = 1, b = 2}"}]
(gdb)
The -stack-select-frame Command
Synopsis-stack-select-frame framenum
Change the selected frame. Select a different frame framenum on the stack.
This command in deprecated in favor of passing the ‘--frame’ option to every command.
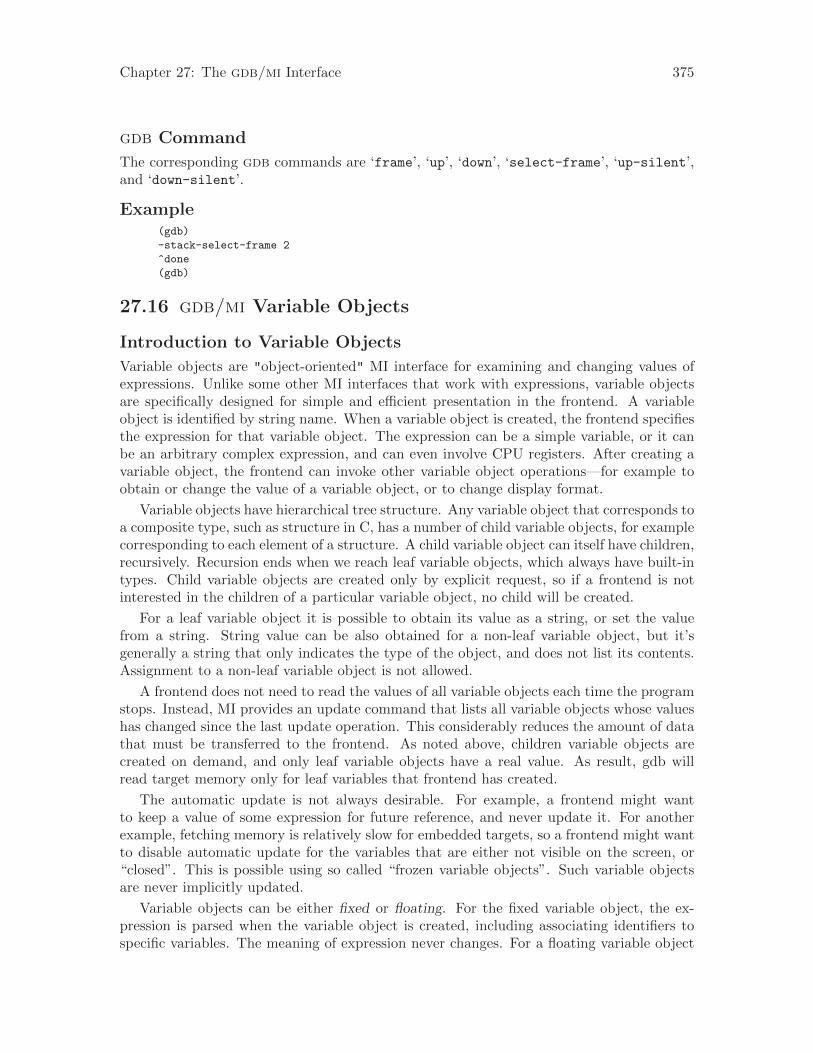
Chapter 27: The gdb/mi Interface 375
gdb Command
The corresponding gdb commands are ‘frame’, ‘up’, ‘down’, ‘select-frame’, ‘up-silent’,and ‘down-silent’.
Example(gdb)
-stack-select-frame 2
^done
(gdb)
27.16 gdb/mi Variable Objects
Introduction to Variable Objects
Variable objects are "object-oriented" MI interface for examining and changing values ofexpressions. Unlike some other MI interfaces that work with expressions, variable objectsare specifically designed for simple and efficient presentation in the frontend. A variableobject is identified by string name. When a variable object is created, the frontend specifiesthe expression for that variable object. The expression can be a simple variable, or it canbe an arbitrary complex expression, and can even involve CPU registers. After creating avariable object, the frontend can invoke other variable object operations—for example toobtain or change the value of a variable object, or to change display format.
Variable objects have hierarchical tree structure. Any variable object that corresponds toa composite type, such as structure in C, has a number of child variable objects, for examplecorresponding to each element of a structure. A child variable object can itself have children,recursively. Recursion ends when we reach leaf variable objects, which always have built-intypes. Child variable objects are created only by explicit request, so if a frontend is notinterested in the children of a particular variable object, no child will be created.
For a leaf variable object it is possible to obtain its value as a string, or set the valuefrom a string. String value can be also obtained for a non-leaf variable object, but it’sgenerally a string that only indicates the type of the object, and does not list its contents.Assignment to a non-leaf variable object is not allowed.
A frontend does not need to read the values of all variable objects each time the programstops. Instead, MI provides an update command that lists all variable objects whose valueshas changed since the last update operation. This considerably reduces the amount of datathat must be transferred to the frontend. As noted above, children variable objects arecreated on demand, and only leaf variable objects have a real value. As result, gdb willread target memory only for leaf variables that frontend has created.
The automatic update is not always desirable. For example, a frontend might wantto keep a value of some expression for future reference, and never update it. For anotherexample, fetching memory is relatively slow for embedded targets, so a frontend might wantto disable automatic update for the variables that are either not visible on the screen, or“closed”. This is possible using so called “frozen variable objects”. Such variable objectsare never implicitly updated.
Variable objects can be either fixed or floating. For the fixed variable object, the ex-pression is parsed when the variable object is created, including associating identifiers tospecific variables. The meaning of expression never changes. For a floating variable object
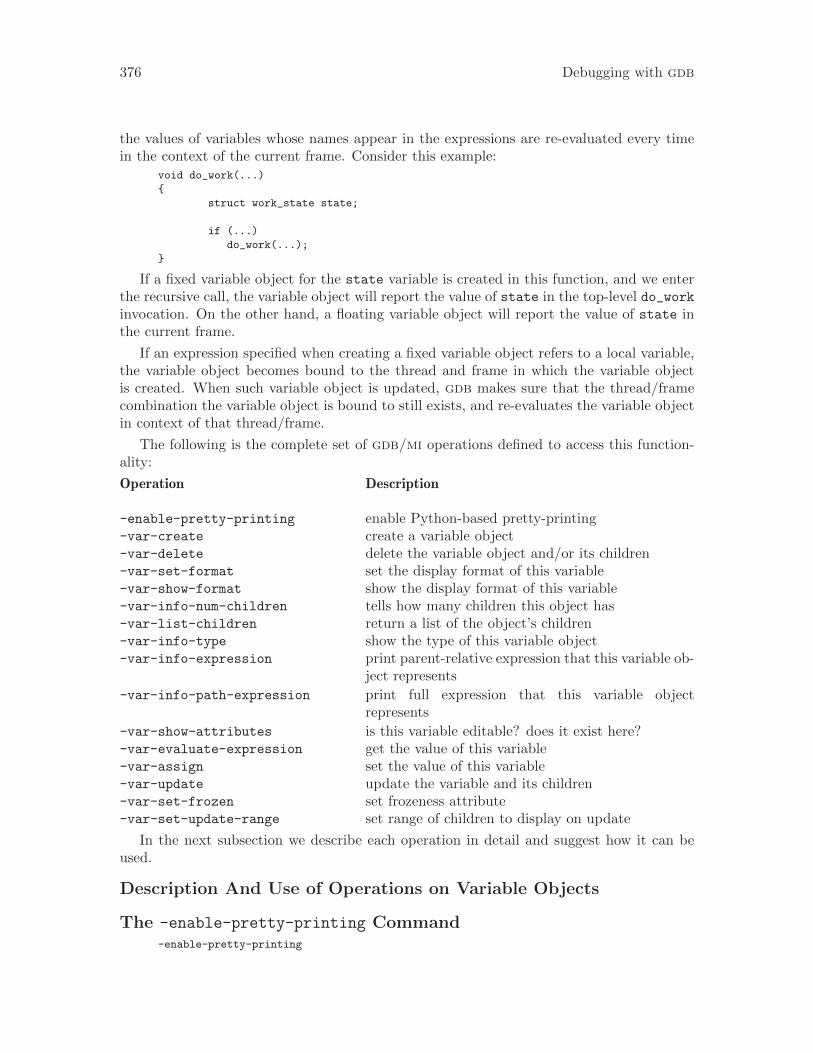
376 Debugging with gdb
the values of variables whose names appear in the expressions are re-evaluated every timein the context of the current frame. Consider this example:
void do_work(...)
{
struct work_state state;
if (...)
do_work(...);
}
If a fixed variable object for the state variable is created in this function, and we enterthe recursive call, the variable object will report the value of state in the top-level do_workinvocation. On the other hand, a floating variable object will report the value of state inthe current frame.
If an expression specified when creating a fixed variable object refers to a local variable,the variable object becomes bound to the thread and frame in which the variable objectis created. When such variable object is updated, gdb makes sure that the thread/framecombination the variable object is bound to still exists, and re-evaluates the variable objectin context of that thread/frame.
The following is the complete set of gdb/mi operations defined to access this function-ality:
Operation Description
-enable-pretty-printing enable Python-based pretty-printing-var-create create a variable object-var-delete delete the variable object and/or its children-var-set-format set the display format of this variable-var-show-format show the display format of this variable-var-info-num-children tells how many children this object has-var-list-children return a list of the object’s children-var-info-type show the type of this variable object-var-info-expression print parent-relative expression that this variable ob-
ject represents
-var-info-path-expression print full expression that this variable objectrepresents
-var-show-attributes is this variable editable? does it exist here?-var-evaluate-expression get the value of this variable-var-assign set the value of this variable-var-update update the variable and its children-var-set-frozen set frozeness attribute-var-set-update-range set range of children to display on update
In the next subsection we describe each operation in detail and suggest how it can beused.
Description And Use of Operations on Variable Objects
The -enable-pretty-printing Command-enable-pretty-printing
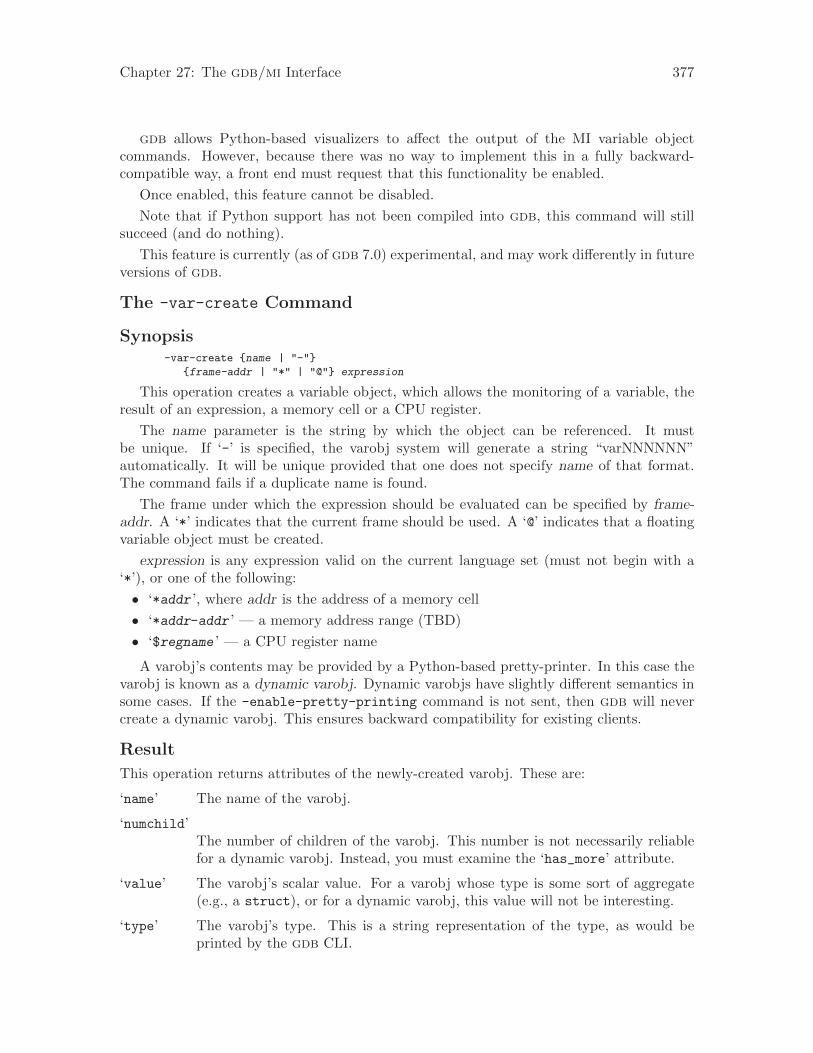
Chapter 27: The gdb/mi Interface 377
gdb allows Python-based visualizers to affect the output of the MI variable objectcommands. However, because there was no way to implement this in a fully backward-compatible way, a front end must request that this functionality be enabled.
Once enabled, this feature cannot be disabled.
Note that if Python support has not been compiled into gdb, this command will stillsucceed (and do nothing).
This feature is currently (as of gdb 7.0) experimental, and may work differently in futureversions of gdb.
The -var-create Command
Synopsis-var-create {name | "-"}
{frame-addr | "*" | "@"} expression
This operation creates a variable object, which allows the monitoring of a variable, theresult of an expression, a memory cell or a CPU register.
The name parameter is the string by which the object can be referenced. It mustbe unique. If ‘-’ is specified, the varobj system will generate a string “varNNNNNN”automatically. It will be unique provided that one does not specify name of that format.The command fails if a duplicate name is found.
The frame under which the expression should be evaluated can be specified by frame-addr. A ‘*’ indicates that the current frame should be used. A ‘@’ indicates that a floatingvariable object must be created.
expression is any expression valid on the current language set (must not begin with a‘*’), or one of the following:
• ‘*addr ’, where addr is the address of a memory cell
• ‘*addr-addr ’ — a memory address range (TBD)
• ‘$regname ’ — a CPU register name
A varobj’s contents may be provided by a Python-based pretty-printer. In this case thevarobj is known as a dynamic varobj. Dynamic varobjs have slightly different semantics insome cases. If the -enable-pretty-printing command is not sent, then gdb will nevercreate a dynamic varobj. This ensures backward compatibility for existing clients.
Result
This operation returns attributes of the newly-created varobj. These are:
‘name’ The name of the varobj.
‘numchild’The number of children of the varobj. This number is not necessarily reliablefor a dynamic varobj. Instead, you must examine the ‘has_more’ attribute.
‘value’ The varobj’s scalar value. For a varobj whose type is some sort of aggregate(e.g., a struct), or for a dynamic varobj, this value will not be interesting.
‘type’ The varobj’s type. This is a string representation of the type, as would beprinted by the gdb CLI.
378 Debugging with gdb
‘thread-id’If a variable object is bound to a specific thread, then this is the thread’sidentifier.
‘has_more’For a dynamic varobj, this indicates whether there appear to be any childrenavailable. For a non-dynamic varobj, this will be 0.
‘dynamic’ This attribute will be present and have the value ‘1’ if the varobj is a dynamicvarobj. If the varobj is not a dynamic varobj, then this attribute will not bepresent.
‘displayhint’A dynamic varobj can supply a display hint to the front end. The value comesdirectly from the Python pretty-printer object’s display_hint method. SeeSection 23.2.2.5 [Pretty Printing API], page 294.
Typical output will look like this:name="name",numchild="N",type="type",thread-id="M",
has_more="has_more"
The -var-delete Command
Synopsis-var-delete [ -c ] name
Deletes a previously created variable object and all of its children. With the ‘-c’ option,just deletes the children.
Returns an error if the object name is not found.
The -var-set-format Command
Synopsis-var-set-format name format-spec
Sets the output format for the value of the object name to be format-spec.
The syntax for the format-spec is as follows:format-spec 7→{binary | decimal | hexadecimal | octal | natural}
The natural format is the default format choosen automatically based on the variabletype (like decimal for an int, hex for pointers, etc.).
For a variable with children, the format is set only on the variable itself, and the childrenare not affected.
The -var-show-format Command
Synopsis-var-show-format name
Returns the format used to display the value of the object name.format 7→format-spec
Chapter 27: The gdb/mi Interface 379
The -var-info-num-children Command
Synopsis-var-info-num-children name
Returns the number of children of a variable object name:numchild=n
Note that this number is not completely reliable for a dynamic varobj. It will return thecurrent number of children, but more children may be available.
The -var-list-children Command
Synopsis-var-list-children [print-values] name [from to]
Return a list of the children of the specified variable object and create variable objectsfor them, if they do not already exist. With a single argument or if print-values has avalue of 0 or --no-values, print only the names of the variables; if print-values is 1 or--all-values, also print their values; and if it is 2 or --simple-values print the nameand value for simple data types and just the name for arrays, structures and unions.
from and to, if specified, indicate the range of children to report. If from or to is lessthan zero, the range is reset and all children will be reported. Otherwise, children startingat from (zero-based) and up to and excluding to will be reported.
If a child range is requested, it will only affect the current call to -var-list-children,but not future calls to -var-update. For this, you must instead use -var-set-update-
range. The intent of this approach is to enable a front end to implement any updateapproach it likes; for example, scrolling a view may cause the front end to request morechildren with -var-list-children, and then the front end could call -var-set-update-range with a different range to ensure that future updates are restricted to just the visibleitems.
For each child the following results are returned:
name Name of the variable object created for this child.
exp The expression to be shown to the user by the front end to designate this child.For example this may be the name of a structure member.
For a dynamic varobj, this value cannot be used to form an expression. Thereis no way to do this at all with a dynamic varobj.
For C/C++ structures there are several pseudo children returned to designateaccess qualifiers. For these pseudo children exp is ‘public’, ‘private’, or‘protected’. In this case the type and value are not present.
A dynamic varobj will not report the access qualifying pseudo-children, regard-less of the language. This information is not available at all with a dynamicvarobj.
numchild Number of children this child has. For a dynamic varobj, this will be 0.
type The type of the child.
value If values were requested, this is the value.
380 Debugging with gdb
thread-id If this variable object is associated with a thread, this is the thread id. Other-wise this result is not present.
frozen If the variable object is frozen, this variable will be present with a value of 1.
The result may have its own attributes:
‘displayhint’A dynamic varobj can supply a display hint to the front end. The value comesdirectly from the Python pretty-printer object’s display_hint method. SeeSection 23.2.2.5 [Pretty Printing API], page 294.
‘has_more’This is an integer attribute which is nonzero if there are children remainingafter the end of the selected range.
Example(gdb)
-var-list-children n
^done,numchild=n,children=[child={name=name,exp=exp,
numchild=n,type=type},(repeats N times)](gdb)
-var-list-children --all-values n
^done,numchild=n,children=[child={name=name,exp=exp,
numchild=n,value=value,type=type},(repeats N times)]
The -var-info-type Command
Synopsis-var-info-type name
Returns the type of the specified variable name. The type is returned as a string in thesame format as it is output by the gdb CLI:
type=typename
The -var-info-expression Command
Synopsis-var-info-expression name
Returns a string that is suitable for presenting this variable object in user interface. Thestring is generally not valid expression in the current language, and cannot be evaluated.
For example, if a is an array, and variable object A was created for a, then we’ll get thisoutput:
(gdb) -var-info-expression A.1
^done,lang="C",exp="1"
Here, the values of lang can be {"C" | "C++" | "Java"}.
Note that the output of the -var-list-children command also includes those expres-sions, so the -var-info-expression command is of limited use.
The -var-info-path-expression Command
Chapter 27: The gdb/mi Interface 381
Synopsis-var-info-path-expression name
Returns an expression that can be evaluated in the current context and will yield thesame value that a variable object has. Compare this with the -var-info-expression
command, which result can be used only for UI presentation. Typical use of the -var-
info-path-expression command is creating a watchpoint from a variable object.
This command is currently not valid for children of a dynamic varobj, and will give anerror when invoked on one.
For example, suppose C is a C++ class, derived from class Base, and that the Base classhas a member called m_size. Assume a variable c is has the type of C and a variable objectC was created for variable c. Then, we’ll get this output:
(gdb) -var-info-path-expression C.Base.public.m_size
^done,path_expr=((Base)c).m_size)
The -var-show-attributes Command
Synopsis-var-show-attributes name
List attributes of the specified variable object name:
status=attr [ ( ,attr )* ]
where attr is { { editable | noneditable } | TBD }.
The -var-evaluate-expression Command
Synopsis-var-evaluate-expression [-f format-spec] name
Evaluates the expression that is represented by the specified variable object and returnsits value as a string. The format of the string can be specified with the ‘-f’ option. Thepossible values of this option are the same as for -var-set-format (see [-var-set-format],page 378). If the ‘-f’ option is not specified, the current display format will be used. Thecurrent display format can be changed using the -var-set-format command.
value=value
Note that one must invoke -var-list-children for a variable before the value of a childvariable can be evaluated.
The -var-assign Command
Synopsis-var-assign name expression
Assigns the value of expression to the variable object specified by name. The objectmust be ‘editable’. If the variable’s value is altered by the assign, the variable will showup in any subsequent -var-update list.
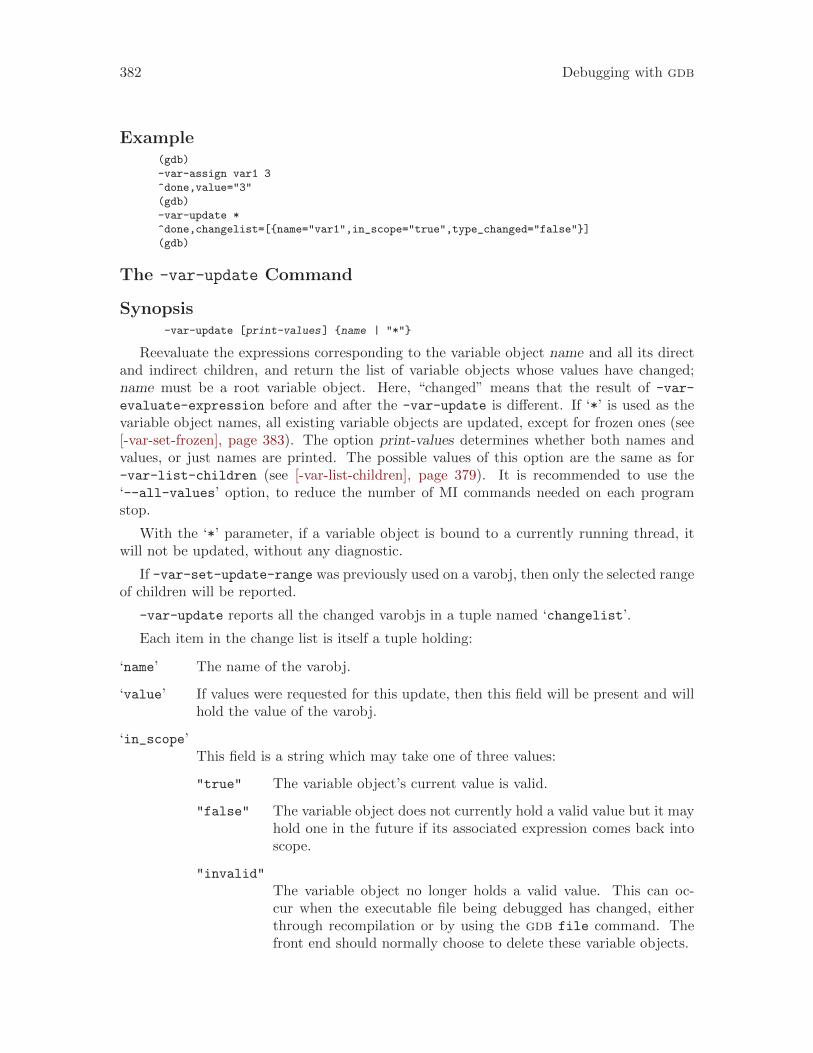
382 Debugging with gdb
Example(gdb)
-var-assign var1 3
^done,value="3"
(gdb)
-var-update *
^done,changelist=[{name="var1",in_scope="true",type_changed="false"}]
(gdb)
The -var-update Command
Synopsis-var-update [print-values] {name | "*"}
Reevaluate the expressions corresponding to the variable object name and all its directand indirect children, and return the list of variable objects whose values have changed;name must be a root variable object. Here, “changed” means that the result of -var-evaluate-expression before and after the -var-update is different. If ‘*’ is used as thevariable object names, all existing variable objects are updated, except for frozen ones (see[-var-set-frozen], page 383). The option print-values determines whether both names andvalues, or just names are printed. The possible values of this option are the same as for-var-list-children (see [-var-list-children], page 379). It is recommended to use the‘--all-values’ option, to reduce the number of MI commands needed on each programstop.
With the ‘*’ parameter, if a variable object is bound to a currently running thread, itwill not be updated, without any diagnostic.
If -var-set-update-range was previously used on a varobj, then only the selected rangeof children will be reported.
-var-update reports all the changed varobjs in a tuple named ‘changelist’.
Each item in the change list is itself a tuple holding:
‘name’ The name of the varobj.
‘value’ If values were requested for this update, then this field will be present and willhold the value of the varobj.
‘in_scope’This field is a string which may take one of three values:
"true" The variable object’s current value is valid.
"false" The variable object does not currently hold a valid value but it mayhold one in the future if its associated expression comes back intoscope.
"invalid"
The variable object no longer holds a valid value. This can oc-cur when the executable file being debugged has changed, eitherthrough recompilation or by using the gdb file command. Thefront end should normally choose to delete these variable objects.
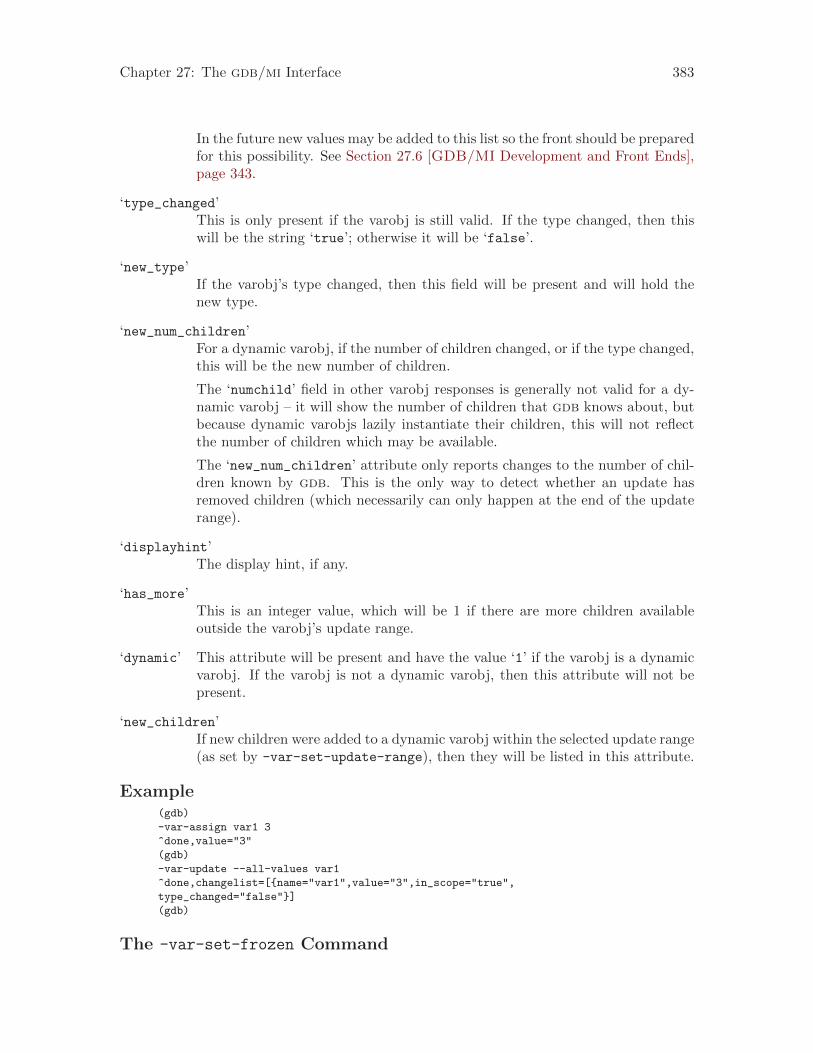
Chapter 27: The gdb/mi Interface 383
In the future new values may be added to this list so the front should be preparedfor this possibility. See Section 27.6 [GDB/MI Development and Front Ends],page 343.
‘type_changed’This is only present if the varobj is still valid. If the type changed, then thiswill be the string ‘true’; otherwise it will be ‘false’.
‘new_type’If the varobj’s type changed, then this field will be present and will hold thenew type.
‘new_num_children’For a dynamic varobj, if the number of children changed, or if the type changed,this will be the new number of children.
The ‘numchild’ field in other varobj responses is generally not valid for a dy-namic varobj – it will show the number of children that gdb knows about, butbecause dynamic varobjs lazily instantiate their children, this will not reflectthe number of children which may be available.
The ‘new_num_children’ attribute only reports changes to the number of chil-dren known by gdb. This is the only way to detect whether an update hasremoved children (which necessarily can only happen at the end of the updaterange).
‘displayhint’The display hint, if any.
‘has_more’This is an integer value, which will be 1 if there are more children availableoutside the varobj’s update range.
‘dynamic’ This attribute will be present and have the value ‘1’ if the varobj is a dynamicvarobj. If the varobj is not a dynamic varobj, then this attribute will not bepresent.
‘new_children’If new children were added to a dynamic varobj within the selected update range(as set by -var-set-update-range), then they will be listed in this attribute.
Example(gdb)
-var-assign var1 3
^done,value="3"
(gdb)
-var-update --all-values var1
^done,changelist=[{name="var1",value="3",in_scope="true",
type_changed="false"}]
(gdb)
The -var-set-frozen Command
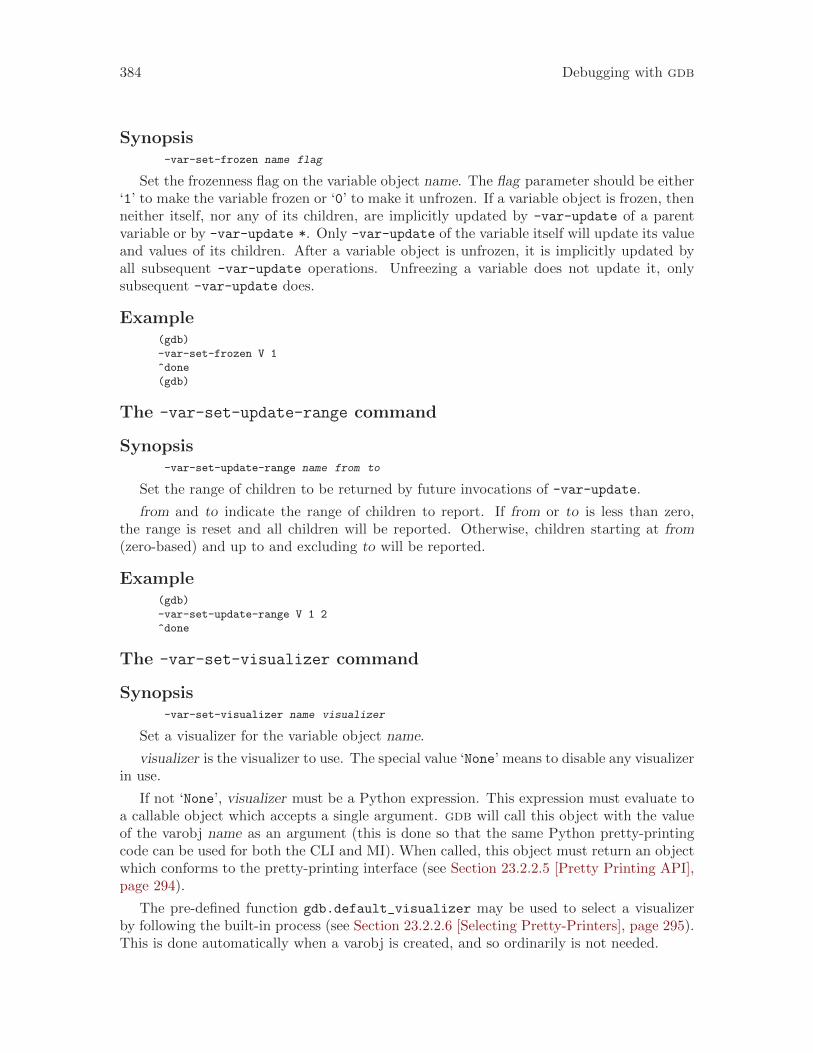
384 Debugging with gdb
Synopsis-var-set-frozen name flag
Set the frozenness flag on the variable object name. The flag parameter should be either‘1’ to make the variable frozen or ‘0’ to make it unfrozen. If a variable object is frozen, thenneither itself, nor any of its children, are implicitly updated by -var-update of a parentvariable or by -var-update *. Only -var-update of the variable itself will update its valueand values of its children. After a variable object is unfrozen, it is implicitly updated byall subsequent -var-update operations. Unfreezing a variable does not update it, onlysubsequent -var-update does.
Example(gdb)
-var-set-frozen V 1
^done
(gdb)
The -var-set-update-range command
Synopsis-var-set-update-range name from to
Set the range of children to be returned by future invocations of -var-update.
from and to indicate the range of children to report. If from or to is less than zero,the range is reset and all children will be reported. Otherwise, children starting at from(zero-based) and up to and excluding to will be reported.
Example(gdb)
-var-set-update-range V 1 2
^done
The -var-set-visualizer command
Synopsis-var-set-visualizer name visualizer
Set a visualizer for the variable object name.
visualizer is the visualizer to use. The special value ‘None’ means to disable any visualizerin use.
If not ‘None’, visualizer must be a Python expression. This expression must evaluate toa callable object which accepts a single argument. gdb will call this object with the valueof the varobj name as an argument (this is done so that the same Python pretty-printingcode can be used for both the CLI and MI). When called, this object must return an objectwhich conforms to the pretty-printing interface (see Section 23.2.2.5 [Pretty Printing API],page 294).
The pre-defined function gdb.default_visualizer may be used to select a visualizerby following the built-in process (see Section 23.2.2.6 [Selecting Pretty-Printers], page 295).This is done automatically when a varobj is created, and so ordinarily is not needed.
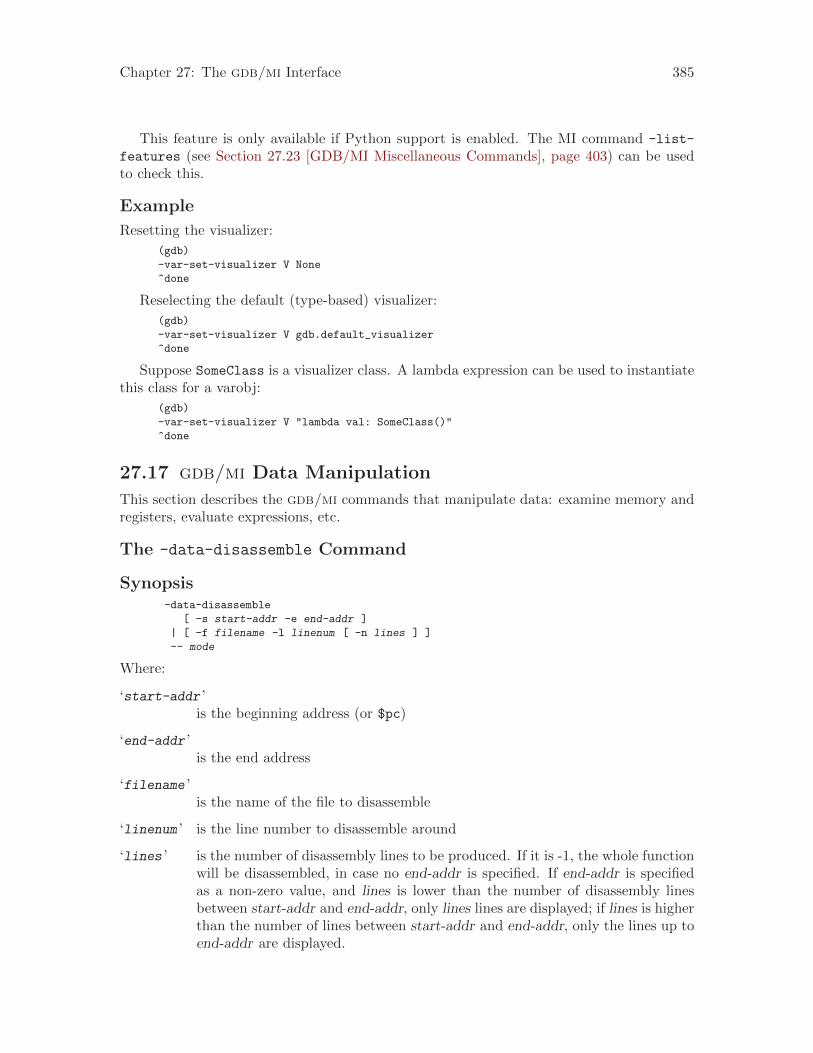
Chapter 27: The gdb/mi Interface 385
This feature is only available if Python support is enabled. The MI command -list-
features (see Section 27.23 [GDB/MI Miscellaneous Commands], page 403) can be usedto check this.
Example
Resetting the visualizer:
(gdb)
-var-set-visualizer V None
^done
Reselecting the default (type-based) visualizer:
(gdb)
-var-set-visualizer V gdb.default_visualizer
^done
Suppose SomeClass is a visualizer class. A lambda expression can be used to instantiatethis class for a varobj:
(gdb)
-var-set-visualizer V "lambda val: SomeClass()"
^done
27.17 gdb/mi Data Manipulation
This section describes the gdb/mi commands that manipulate data: examine memory andregisters, evaluate expressions, etc.
The -data-disassemble Command
Synopsis-data-disassemble
[ -s start-addr -e end-addr ]
| [ -f filename -l linenum [ -n lines ] ]
-- mode
Where:
‘start-addr ’is the beginning address (or $pc)
‘end-addr ’is the end address
‘filename ’is the name of the file to disassemble
‘linenum ’ is the line number to disassemble around
‘lines ’ is the number of disassembly lines to be produced. If it is -1, the whole functionwill be disassembled, in case no end-addr is specified. If end-addr is specifiedas a non-zero value, and lines is lower than the number of disassembly linesbetween start-addr and end-addr, only lines lines are displayed; if lines is higherthan the number of lines between start-addr and end-addr, only the lines up toend-addr are displayed.
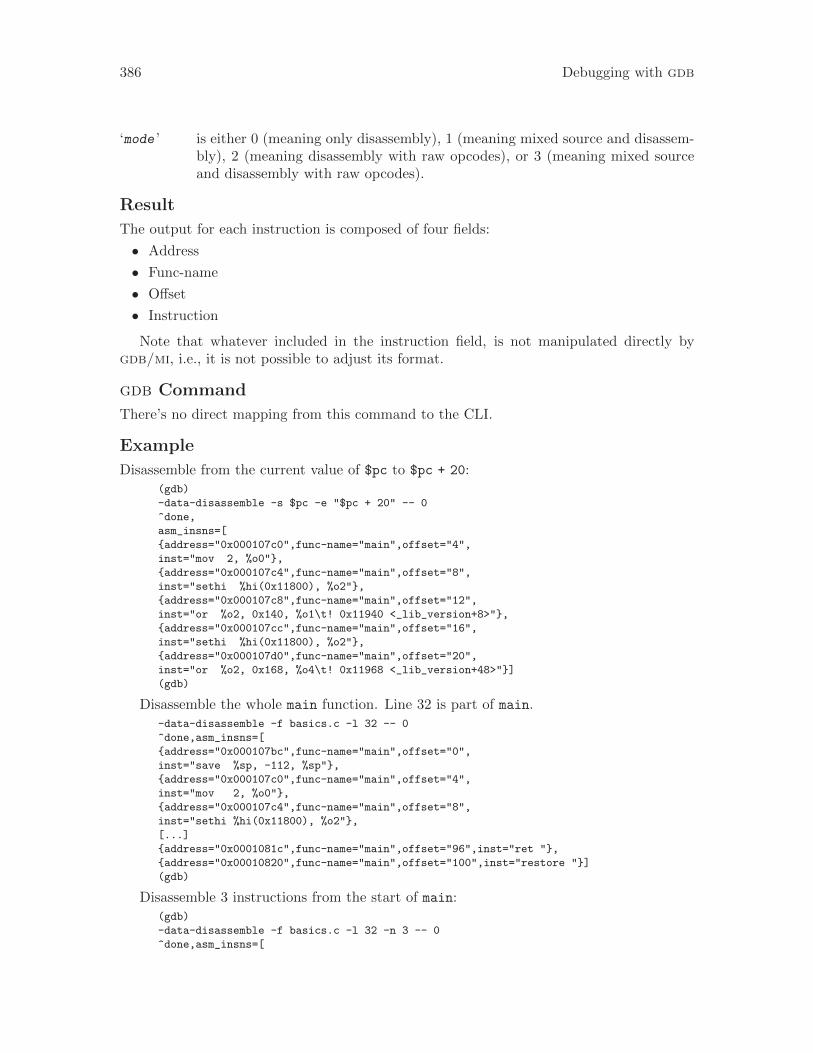
386 Debugging with gdb
‘mode ’ is either 0 (meaning only disassembly), 1 (meaning mixed source and disassem-bly), 2 (meaning disassembly with raw opcodes), or 3 (meaning mixed sourceand disassembly with raw opcodes).
Result
The output for each instruction is composed of four fields:
• Address
• Func-name
• Offset
• Instruction
Note that whatever included in the instruction field, is not manipulated directly bygdb/mi, i.e., it is not possible to adjust its format.
gdb Command
There’s no direct mapping from this command to the CLI.
Example
Disassemble from the current value of $pc to $pc + 20:(gdb)
-data-disassemble -s $pc -e "$pc + 20" -- 0
^done,
asm_insns=[
{address="0x000107c0",func-name="main",offset="4",
inst="mov 2, %o0"},
{address="0x000107c4",func-name="main",offset="8",
inst="sethi %hi(0x11800), %o2"},
{address="0x000107c8",func-name="main",offset="12",
inst="or %o2, 0x140, %o1\t! 0x11940 <_lib_version+8>"},
{address="0x000107cc",func-name="main",offset="16",
inst="sethi %hi(0x11800), %o2"},
{address="0x000107d0",func-name="main",offset="20",
inst="or %o2, 0x168, %o4\t! 0x11968 <_lib_version+48>"}]
(gdb)
Disassemble the whole main function. Line 32 is part of main.-data-disassemble -f basics.c -l 32 -- 0
^done,asm_insns=[
{address="0x000107bc",func-name="main",offset="0",
inst="save %sp, -112, %sp"},
{address="0x000107c0",func-name="main",offset="4",
inst="mov 2, %o0"},
{address="0x000107c4",func-name="main",offset="8",
inst="sethi %hi(0x11800), %o2"},
[...]
{address="0x0001081c",func-name="main",offset="96",inst="ret "},
{address="0x00010820",func-name="main",offset="100",inst="restore "}]
(gdb)
Disassemble 3 instructions from the start of main:(gdb)
-data-disassemble -f basics.c -l 32 -n 3 -- 0
^done,asm_insns=[
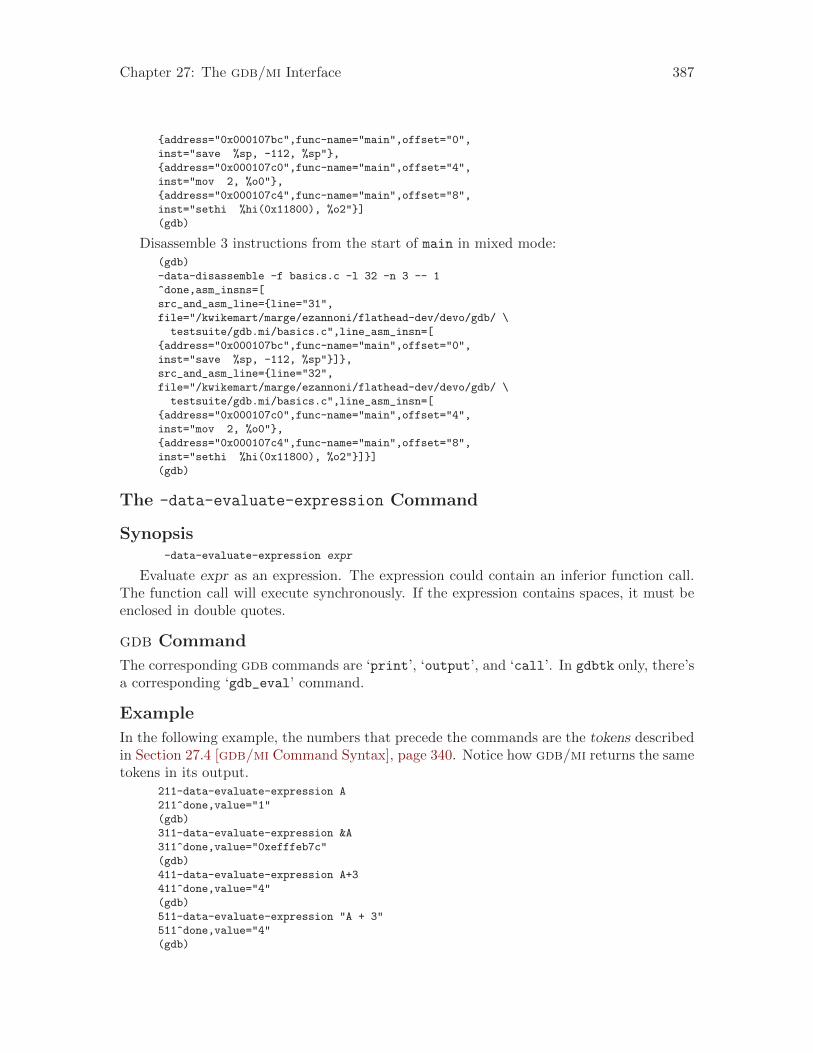
Chapter 27: The gdb/mi Interface 387
{address="0x000107bc",func-name="main",offset="0",
inst="save %sp, -112, %sp"},
{address="0x000107c0",func-name="main",offset="4",
inst="mov 2, %o0"},
{address="0x000107c4",func-name="main",offset="8",
inst="sethi %hi(0x11800), %o2"}]
(gdb)
Disassemble 3 instructions from the start of main in mixed mode:(gdb)
-data-disassemble -f basics.c -l 32 -n 3 -- 1
^done,asm_insns=[
src_and_asm_line={line="31",
file="/kwikemart/marge/ezannoni/flathead-dev/devo/gdb/ \
testsuite/gdb.mi/basics.c",line_asm_insn=[
{address="0x000107bc",func-name="main",offset="0",
inst="save %sp, -112, %sp"}]},
src_and_asm_line={line="32",
file="/kwikemart/marge/ezannoni/flathead-dev/devo/gdb/ \
testsuite/gdb.mi/basics.c",line_asm_insn=[
{address="0x000107c0",func-name="main",offset="4",
inst="mov 2, %o0"},
{address="0x000107c4",func-name="main",offset="8",
inst="sethi %hi(0x11800), %o2"}]}]
(gdb)
The -data-evaluate-expression Command
Synopsis-data-evaluate-expression expr
Evaluate expr as an expression. The expression could contain an inferior function call.The function call will execute synchronously. If the expression contains spaces, it must beenclosed in double quotes.
gdb Command
The corresponding gdb commands are ‘print’, ‘output’, and ‘call’. In gdbtk only, there’sa corresponding ‘gdb_eval’ command.
Example
In the following example, the numbers that precede the commands are the tokens describedin Section 27.4 [gdb/mi Command Syntax], page 340. Notice how gdb/mi returns the sametokens in its output.
211-data-evaluate-expression A
211^done,value="1"
(gdb)
311-data-evaluate-expression &A
311^done,value="0xefffeb7c"
(gdb)
411-data-evaluate-expression A+3
411^done,value="4"
(gdb)
511-data-evaluate-expression "A + 3"
511^done,value="4"
(gdb)
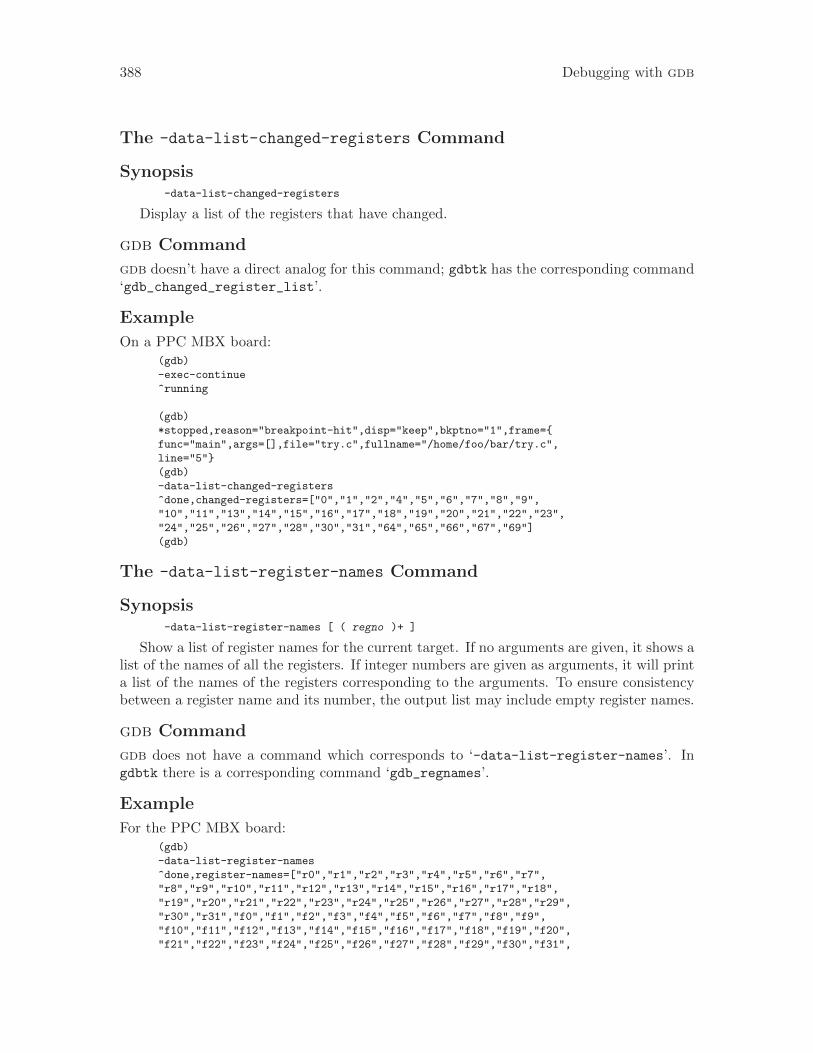
388 Debugging with gdb
The -data-list-changed-registers Command
Synopsis-data-list-changed-registers
Display a list of the registers that have changed.
gdb Command
gdb doesn’t have a direct analog for this command; gdbtk has the corresponding command‘gdb_changed_register_list’.
Example
On a PPC MBX board:(gdb)
-exec-continue
^running
(gdb)
*stopped,reason="breakpoint-hit",disp="keep",bkptno="1",frame={
func="main",args=[],file="try.c",fullname="/home/foo/bar/try.c",
line="5"}
(gdb)
-data-list-changed-registers
^done,changed-registers=["0","1","2","4","5","6","7","8","9",
"10","11","13","14","15","16","17","18","19","20","21","22","23",
"24","25","26","27","28","30","31","64","65","66","67","69"]
(gdb)
The -data-list-register-names Command
Synopsis-data-list-register-names [ ( regno )+ ]
Show a list of register names for the current target. If no arguments are given, it shows alist of the names of all the registers. If integer numbers are given as arguments, it will printa list of the names of the registers corresponding to the arguments. To ensure consistencybetween a register name and its number, the output list may include empty register names.
gdb Command
gdb does not have a command which corresponds to ‘-data-list-register-names’. Ingdbtk there is a corresponding command ‘gdb_regnames’.
Example
For the PPC MBX board:(gdb)
-data-list-register-names
^done,register-names=["r0","r1","r2","r3","r4","r5","r6","r7",
"r8","r9","r10","r11","r12","r13","r14","r15","r16","r17","r18",
"r19","r20","r21","r22","r23","r24","r25","r26","r27","r28","r29",
"r30","r31","f0","f1","f2","f3","f4","f5","f6","f7","f8","f9",
"f10","f11","f12","f13","f14","f15","f16","f17","f18","f19","f20",
"f21","f22","f23","f24","f25","f26","f27","f28","f29","f30","f31",
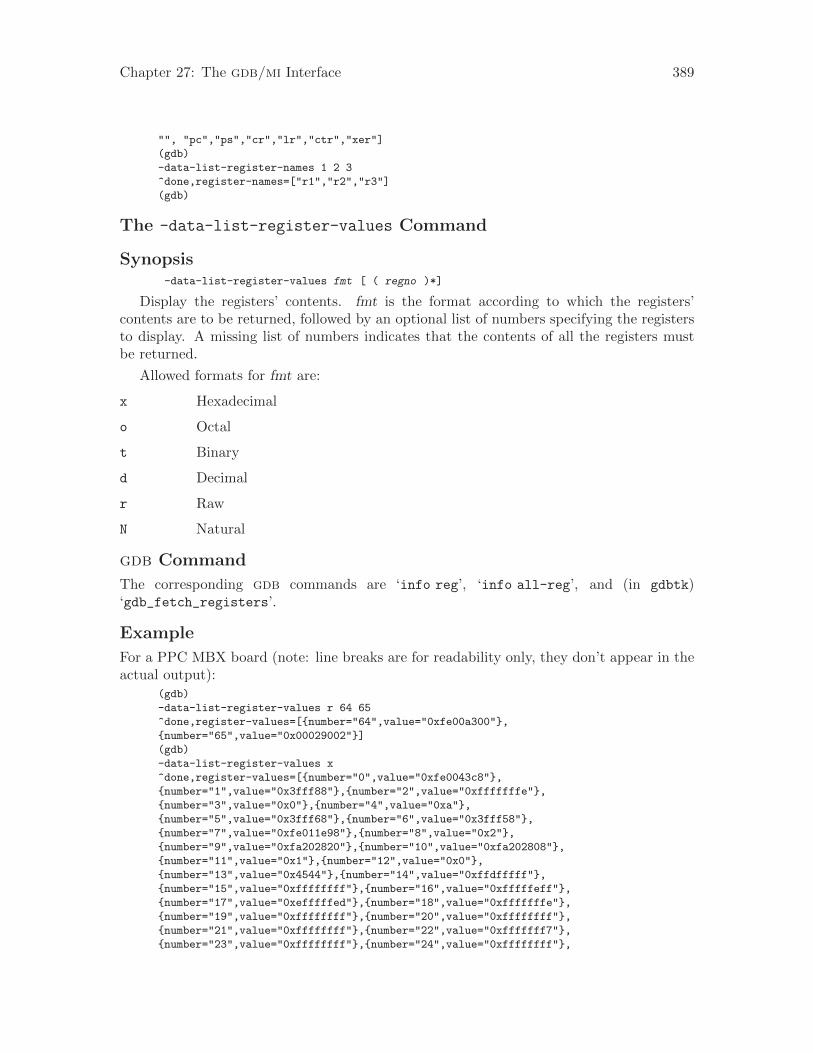
Chapter 27: The gdb/mi Interface 389
"", "pc","ps","cr","lr","ctr","xer"]
(gdb)
-data-list-register-names 1 2 3
^done,register-names=["r1","r2","r3"]
(gdb)
The -data-list-register-values Command
Synopsis-data-list-register-values fmt [ ( regno )*]
Display the registers’ contents. fmt is the format according to which the registers’contents are to be returned, followed by an optional list of numbers specifying the registersto display. A missing list of numbers indicates that the contents of all the registers mustbe returned.
Allowed formats for fmt are:
x Hexadecimal
o Octal
t Binary
d Decimal
r Raw
N Natural
gdb Command
The corresponding gdb commands are ‘info reg’, ‘info all-reg’, and (in gdbtk)‘gdb_fetch_registers’.
Example
For a PPC MBX board (note: line breaks are for readability only, they don’t appear in theactual output):
(gdb)
-data-list-register-values r 64 65
^done,register-values=[{number="64",value="0xfe00a300"},
{number="65",value="0x00029002"}]
(gdb)
-data-list-register-values x
^done,register-values=[{number="0",value="0xfe0043c8"},
{number="1",value="0x3fff88"},{number="2",value="0xfffffffe"},
{number="3",value="0x0"},{number="4",value="0xa"},
{number="5",value="0x3fff68"},{number="6",value="0x3fff58"},
{number="7",value="0xfe011e98"},{number="8",value="0x2"},
{number="9",value="0xfa202820"},{number="10",value="0xfa202808"},
{number="11",value="0x1"},{number="12",value="0x0"},
{number="13",value="0x4544"},{number="14",value="0xffdfffff"},
{number="15",value="0xffffffff"},{number="16",value="0xfffffeff"},
{number="17",value="0xefffffed"},{number="18",value="0xfffffffe"},
{number="19",value="0xffffffff"},{number="20",value="0xffffffff"},
{number="21",value="0xffffffff"},{number="22",value="0xfffffff7"},
{number="23",value="0xffffffff"},{number="24",value="0xffffffff"},
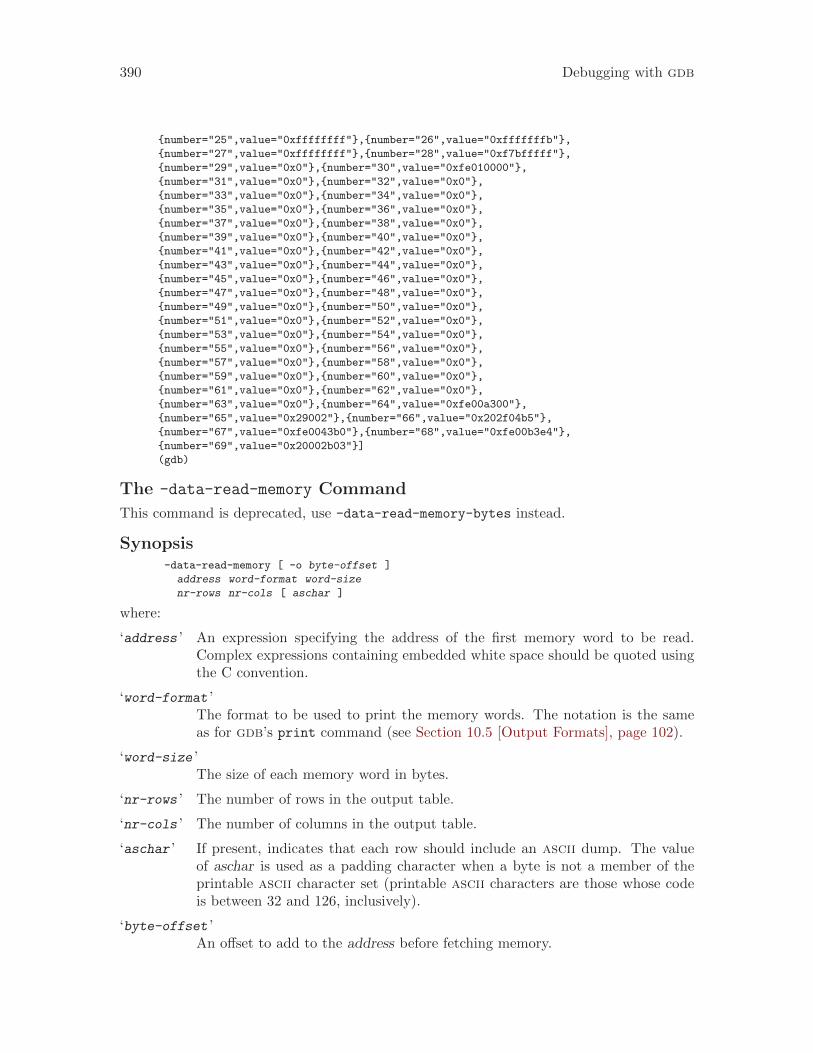
390 Debugging with gdb
{number="25",value="0xffffffff"},{number="26",value="0xfffffffb"},
{number="27",value="0xffffffff"},{number="28",value="0xf7bfffff"},
{number="29",value="0x0"},{number="30",value="0xfe010000"},
{number="31",value="0x0"},{number="32",value="0x0"},
{number="33",value="0x0"},{number="34",value="0x0"},
{number="35",value="0x0"},{number="36",value="0x0"},
{number="37",value="0x0"},{number="38",value="0x0"},
{number="39",value="0x0"},{number="40",value="0x0"},
{number="41",value="0x0"},{number="42",value="0x0"},
{number="43",value="0x0"},{number="44",value="0x0"},
{number="45",value="0x0"},{number="46",value="0x0"},
{number="47",value="0x0"},{number="48",value="0x0"},
{number="49",value="0x0"},{number="50",value="0x0"},
{number="51",value="0x0"},{number="52",value="0x0"},
{number="53",value="0x0"},{number="54",value="0x0"},
{number="55",value="0x0"},{number="56",value="0x0"},
{number="57",value="0x0"},{number="58",value="0x0"},
{number="59",value="0x0"},{number="60",value="0x0"},
{number="61",value="0x0"},{number="62",value="0x0"},
{number="63",value="0x0"},{number="64",value="0xfe00a300"},
{number="65",value="0x29002"},{number="66",value="0x202f04b5"},
{number="67",value="0xfe0043b0"},{number="68",value="0xfe00b3e4"},
{number="69",value="0x20002b03"}]
(gdb)
The -data-read-memory Command
This command is deprecated, use -data-read-memory-bytes instead.
Synopsis-data-read-memory [ -o byte-offset ]
address word-format word-size
nr-rows nr-cols [ aschar ]
where:
‘address ’ An expression specifying the address of the first memory word to be read.Complex expressions containing embedded white space should be quoted usingthe C convention.
‘word-format ’The format to be used to print the memory words. The notation is the sameas for gdb’s print command (see Section 10.5 [Output Formats], page 102).
‘word-size ’The size of each memory word in bytes.
‘nr-rows ’ The number of rows in the output table.
‘nr-cols ’ The number of columns in the output table.
‘aschar ’ If present, indicates that each row should include an ascii dump. The valueof aschar is used as a padding character when a byte is not a member of theprintable ascii character set (printable ascii characters are those whose codeis between 32 and 126, inclusively).
‘byte-offset ’An offset to add to the address before fetching memory.
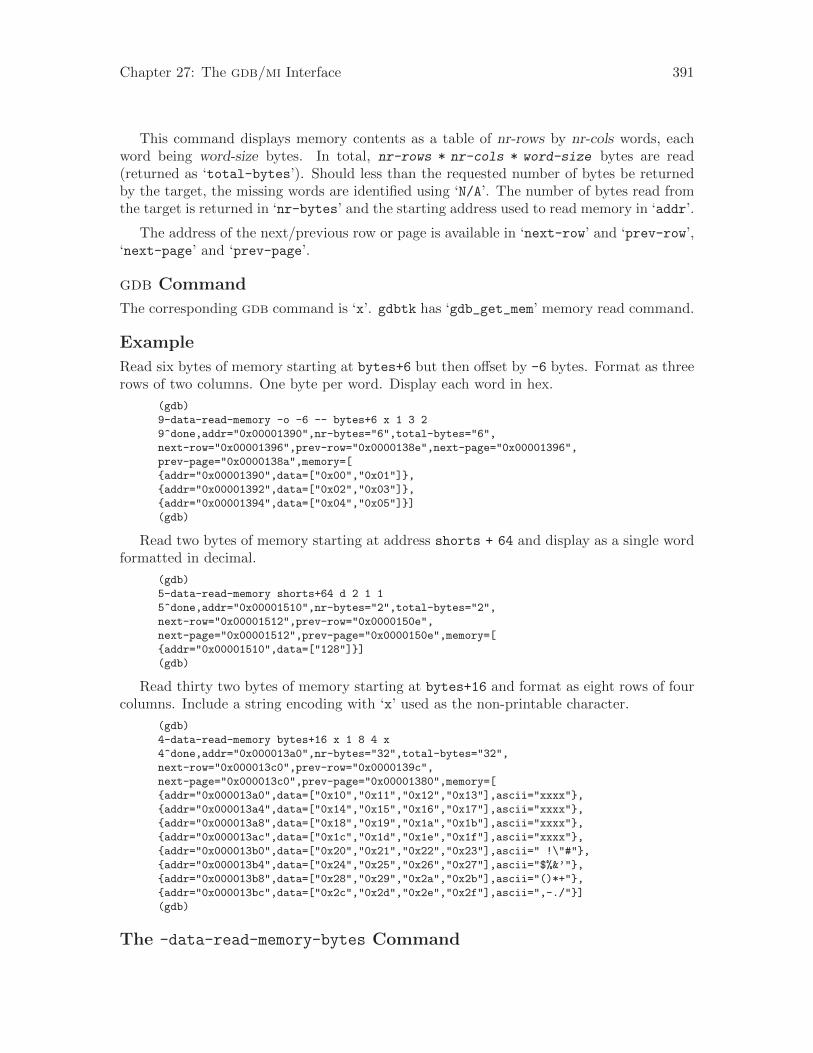
Chapter 27: The gdb/mi Interface 391
This command displays memory contents as a table of nr-rows by nr-cols words, eachword being word-size bytes. In total, nr-rows * nr-cols * word-size bytes are read(returned as ‘total-bytes’). Should less than the requested number of bytes be returnedby the target, the missing words are identified using ‘N/A’. The number of bytes read fromthe target is returned in ‘nr-bytes’ and the starting address used to read memory in ‘addr’.
The address of the next/previous row or page is available in ‘next-row’ and ‘prev-row’,‘next-page’ and ‘prev-page’.
gdb Command
The corresponding gdb command is ‘x’. gdbtk has ‘gdb_get_mem’ memory read command.
Example
Read six bytes of memory starting at bytes+6 but then offset by -6 bytes. Format as threerows of two columns. One byte per word. Display each word in hex.
(gdb)
9-data-read-memory -o -6 -- bytes+6 x 1 3 2
9^done,addr="0x00001390",nr-bytes="6",total-bytes="6",
next-row="0x00001396",prev-row="0x0000138e",next-page="0x00001396",
prev-page="0x0000138a",memory=[
{addr="0x00001390",data=["0x00","0x01"]},
{addr="0x00001392",data=["0x02","0x03"]},
{addr="0x00001394",data=["0x04","0x05"]}]
(gdb)
Read two bytes of memory starting at address shorts + 64 and display as a single wordformatted in decimal.
(gdb)
5-data-read-memory shorts+64 d 2 1 1
5^done,addr="0x00001510",nr-bytes="2",total-bytes="2",
next-row="0x00001512",prev-row="0x0000150e",
next-page="0x00001512",prev-page="0x0000150e",memory=[
{addr="0x00001510",data=["128"]}]
(gdb)
Read thirty two bytes of memory starting at bytes+16 and format as eight rows of fourcolumns. Include a string encoding with ‘x’ used as the non-printable character.
(gdb)
4-data-read-memory bytes+16 x 1 8 4 x
4^done,addr="0x000013a0",nr-bytes="32",total-bytes="32",
next-row="0x000013c0",prev-row="0x0000139c",
next-page="0x000013c0",prev-page="0x00001380",memory=[
{addr="0x000013a0",data=["0x10","0x11","0x12","0x13"],ascii="xxxx"},
{addr="0x000013a4",data=["0x14","0x15","0x16","0x17"],ascii="xxxx"},
{addr="0x000013a8",data=["0x18","0x19","0x1a","0x1b"],ascii="xxxx"},
{addr="0x000013ac",data=["0x1c","0x1d","0x1e","0x1f"],ascii="xxxx"},
{addr="0x000013b0",data=["0x20","0x21","0x22","0x23"],ascii=" !\"#"},
{addr="0x000013b4",data=["0x24","0x25","0x26","0x27"],ascii="$%&’"},
{addr="0x000013b8",data=["0x28","0x29","0x2a","0x2b"],ascii="()*+"},
{addr="0x000013bc",data=["0x2c","0x2d","0x2e","0x2f"],ascii=",-./"}]
(gdb)
The -data-read-memory-bytes Command
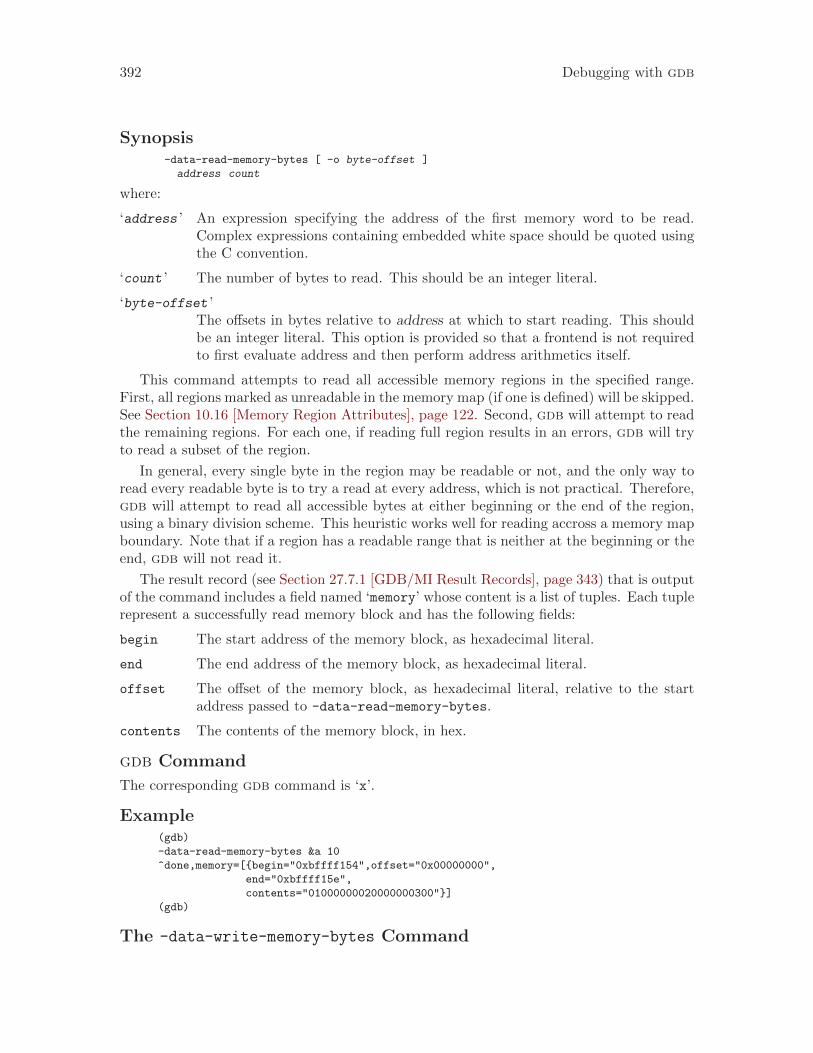
392 Debugging with gdb
Synopsis-data-read-memory-bytes [ -o byte-offset ]
address count
where:
‘address ’ An expression specifying the address of the first memory word to be read.Complex expressions containing embedded white space should be quoted usingthe C convention.
‘count ’ The number of bytes to read. This should be an integer literal.
‘byte-offset ’The offsets in bytes relative to address at which to start reading. This shouldbe an integer literal. This option is provided so that a frontend is not requiredto first evaluate address and then perform address arithmetics itself.
This command attempts to read all accessible memory regions in the specified range.First, all regions marked as unreadable in the memory map (if one is defined) will be skipped.See Section 10.16 [Memory Region Attributes], page 122. Second, gdb will attempt to readthe remaining regions. For each one, if reading full region results in an errors, gdb will tryto read a subset of the region.
In general, every single byte in the region may be readable or not, and the only way toread every readable byte is to try a read at every address, which is not practical. Therefore,gdb will attempt to read all accessible bytes at either beginning or the end of the region,using a binary division scheme. This heuristic works well for reading accross a memory mapboundary. Note that if a region has a readable range that is neither at the beginning or theend, gdb will not read it.
The result record (see Section 27.7.1 [GDB/MI Result Records], page 343) that is outputof the command includes a field named ‘memory’ whose content is a list of tuples. Each tuplerepresent a successfully read memory block and has the following fields:
begin The start address of the memory block, as hexadecimal literal.
end The end address of the memory block, as hexadecimal literal.
offset The offset of the memory block, as hexadecimal literal, relative to the startaddress passed to -data-read-memory-bytes.
contents The contents of the memory block, in hex.
gdb Command
The corresponding gdb command is ‘x’.
Example(gdb)
-data-read-memory-bytes &a 10
^done,memory=[{begin="0xbffff154",offset="0x00000000",
end="0xbffff15e",
contents="01000000020000000300"}]
(gdb)
The -data-write-memory-bytes Command
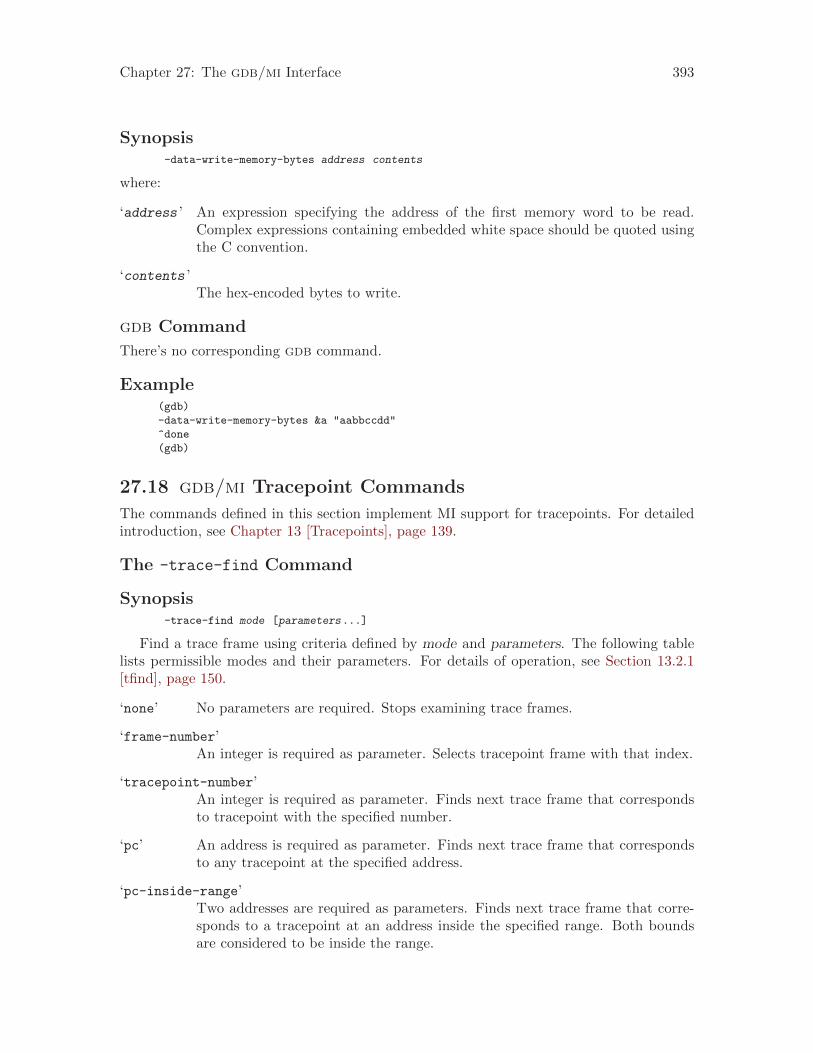
Chapter 27: The gdb/mi Interface 393
Synopsis-data-write-memory-bytes address contents
where:
‘address ’ An expression specifying the address of the first memory word to be read.Complex expressions containing embedded white space should be quoted usingthe C convention.
‘contents ’The hex-encoded bytes to write.
gdb Command
There’s no corresponding gdb command.
Example(gdb)
-data-write-memory-bytes &a "aabbccdd"
^done
(gdb)
27.18 gdb/mi Tracepoint Commands
The commands defined in this section implement MI support for tracepoints. For detailedintroduction, see Chapter 13 [Tracepoints], page 139.
The -trace-find Command
Synopsis-trace-find mode [parameters...]
Find a trace frame using criteria defined by mode and parameters. The following tablelists permissible modes and their parameters. For details of operation, see Section 13.2.1[tfind], page 150.
‘none’ No parameters are required. Stops examining trace frames.
‘frame-number’An integer is required as parameter. Selects tracepoint frame with that index.
‘tracepoint-number’An integer is required as parameter. Finds next trace frame that correspondsto tracepoint with the specified number.
‘pc’ An address is required as parameter. Finds next trace frame that correspondsto any tracepoint at the specified address.
‘pc-inside-range’Two addresses are required as parameters. Finds next trace frame that corre-sponds to a tracepoint at an address inside the specified range. Both boundsare considered to be inside the range.
394 Debugging with gdb
‘pc-outside-range’Two addresses are required as parameters. Finds next trace frame that corre-sponds to a tracepoint at an address outside the specified range. Both boundsare considered to be inside the range.
‘line’ Line specification is required as parameter. See Section 9.2 [Specify Location],page 88. Finds next trace frame that corresponds to a tracepoint at the specifiedlocation.
If ‘none’ was passed as mode, the response does not have fields. Otherwise, the responsemay have the following fields:
‘found’ This field has either ‘0’ or ‘1’ as the value, depending on whether a matchingtracepoint was found.
‘traceframe’The index of the found traceframe. This field is present iff the ‘found’ field hasvalue of ‘1’.
‘tracepoint’The index of the found tracepoint. This field is present iff the ‘found’ field hasvalue of ‘1’.
‘frame’ The information about the frame corresponding to the found trace frame. Thisfield is present only if a trace frame was found. See Section 27.7.4 [GDB/MIFrame Information], page 347, for description of this field.
gdb Command
The corresponding gdb command is ‘tfind’.
-trace-define-variable
Synopsis-trace-define-variable name [ value ]
Create trace variable name if it does not exist. If value is specified, sets the initial valueof the specified trace variable to that value. Note that the name should start with the ‘$’character.
gdb Command
The corresponding gdb command is ‘tvariable’.
-trace-list-variables
Synopsis-trace-list-variables
Return a table of all defined trace variables. Each element of the table has the followingfields:
‘name’ The name of the trace variable. This field is always present.
‘initial’ The initial value. This is a 64-bit signed integer. This field is always present.
Chapter 27: The gdb/mi Interface 395
‘current’ The value the trace variable has at the moment. This is a 64-bit signed integer.This field is absent iff current value is not defined, for example if the trace wasnever run, or is presently running.
gdb Command
The corresponding gdb command is ‘tvariables’.
Example(gdb)
-trace-list-variables
^done,trace-variables={nr_rows="1",nr_cols="3",
hdr=[{width="15",alignment="-1",col_name="name",colhdr="Name"},
{width="11",alignment="-1",col_name="initial",colhdr="Initial"},
{width="11",alignment="-1",col_name="current",colhdr="Current"}],
body=[variable={name="$trace_timestamp",initial="0"}
variable={name="$foo",initial="10",current="15"}]}
(gdb)
-trace-save
Synopsis-trace-save [-r ] filename
Saves the collected trace data to filename. Without the ‘-r’ option, the data is down-loaded from the target and saved in a local file. With the ‘-r’ option the target is asked toperform the save.
gdb Command
The corresponding gdb command is ‘tsave’.
-trace-start
Synopsis-trace-start
Starts a tracing experiments. The result of this command does not have any fields.
gdb Command
The corresponding gdb command is ‘tstart’.
-trace-status
Synopsis-trace-status
Obtains the status of a tracing experiment. The result may include the following fields:
‘supported’May have a value of either ‘0’, when no tracing operations are supported, ‘1’,when all tracing operations are supported, or ‘file’ when examining tracefile. In the latter case, examining of trace frame is possible but new tracingexperiement cannot be started. This field is always present.
396 Debugging with gdb
‘running’ May have a value of either ‘0’ or ‘1’ depending on whether tracing experiementis in progress on target. This field is present if ‘supported’ field is not ‘0’.
‘stop-reason’Report the reason why the tracing was stopped last time. This field may beabsent iff tracing was never stopped on target yet. The value of ‘request’ meansthe tracing was stopped as result of the -trace-stop command. The value of‘overflow’ means the tracing buffer is full. The value of ‘disconnection’means tracing was automatically stopped when gdb has disconnected. Thevalue of ‘passcount’ means tracing was stopped when a tracepoint was passed amaximal number of times for that tracepoint. This field is present if ‘supported’field is not ‘0’.
‘stopping-tracepoint’The number of tracepoint whose passcount as exceeded. This field is presentiff the ‘stop-reason’ field has the value of ‘passcount’.
‘frames’‘frames-created’
The ‘frames’ field is a count of the total number of trace frames in the tracebuffer, while ‘frames-created’ is the total created during the run, includingones that were discarded, such as when a circular trace buffer filled up. Bothfields are optional.
‘buffer-size’‘buffer-free’
These fields tell the current size of the tracing buffer and the remaining space.These fields are optional.
‘circular’The value of the circular trace buffer flag. 1 means that the trace buffer iscircular and old trace frames will be discarded if necessary to make room, 0means that the trace buffer is linear and may fill up.
‘disconnected’The value of the disconnected tracing flag. 1 means that tracing will continueafter gdb disconnects, 0 means that the trace run will stop.
gdb Command
The corresponding gdb command is ‘tstatus’.
-trace-stop
Synopsis-trace-stop
Stops a tracing experiment. The result of this command has the same fields as -trace-status, except that the ‘supported’ and ‘running’ fields are not output.
gdb Command
The corresponding gdb command is ‘tstop’.
Chapter 27: The gdb/mi Interface 397
27.19 gdb/mi Symbol Query Commands
The -symbol-list-lines Command
Synopsis-symbol-list-lines filename
Print the list of lines that contain code and their associated program addresses for thegiven source filename. The entries are sorted in ascending PC order.
gdb Command
There is no corresponding gdb command.
Example(gdb)
-symbol-list-lines basics.c
^done,lines=[{pc="0x08048554",line="7"},{pc="0x0804855a",line="8"}]
(gdb)
27.20 gdb/mi File Commands
This section describes the GDB/MI commands to specify executable file names and to readin and obtain symbol table information.
The -file-exec-and-symbols Command
Synopsis-file-exec-and-symbols file
Specify the executable file to be debugged. This file is the one from which the symboltable is also read. If no file is specified, the command clears the executable and symbolinformation. If breakpoints are set when using this command with no arguments, gdb willproduce error messages. Otherwise, no output is produced, except a completion notification.
gdb Command
The corresponding gdb command is ‘file’.
Example(gdb)
-file-exec-and-symbols /kwikemart/marge/ezannoni/TRUNK/mbx/hello.mbx
^done
(gdb)
The -file-exec-file Command
Synopsis-file-exec-file file
Specify the executable file to be debugged. Unlike ‘-file-exec-and-symbols’, thesymbol table is not read from this file. If used without argument, gdb clears the informationabout the executable file. No output is produced, except a completion notification.
398 Debugging with gdb
gdb Command
The corresponding gdb command is ‘exec-file’.
Example(gdb)
-file-exec-file /kwikemart/marge/ezannoni/TRUNK/mbx/hello.mbx
^done
(gdb)
The -file-list-exec-source-file Command
Synopsis-file-list-exec-source-file
List the line number, the current source file, and the absolute path to the current sourcefile for the current executable. The macro information field has a value of ‘1’ or ‘0’ dependingon whether or not the file includes preprocessor macro information.
gdb Command
The gdb equivalent is ‘info source’
Example(gdb)
123-file-list-exec-source-file
123^done,line="1",file="foo.c",fullname="/home/bar/foo.c,macro-info="1"
(gdb)
The -file-list-exec-source-files Command
Synopsis-file-list-exec-source-files
List the source files for the current executable.
It will always output the filename, but only when gdb can find the absolute file nameof a source file, will it output the fullname.
gdb Command
The gdb equivalent is ‘info sources’. gdbtk has an analogous command ‘gdb_listfiles’.
Example(gdb)
-file-list-exec-source-files
^done,files=[
{file=foo.c,fullname=/home/foo.c},
{file=/home/bar.c,fullname=/home/bar.c},
{file=gdb_could_not_find_fullpath.c}]
(gdb)
The -file-symbol-file Command
Chapter 27: The gdb/mi Interface 399
Synopsis-file-symbol-file file
Read symbol table info from the specified file argument. When used without arguments,clears gdb’s symbol table info. No output is produced, except for a completion notification.
gdb Command
The corresponding gdb command is ‘symbol-file’.
Example(gdb)
-file-symbol-file /kwikemart/marge/ezannoni/TRUNK/mbx/hello.mbx
^done
(gdb)
27.21 gdb/mi Target Manipulation Commands
The -target-attach Command
Synopsis-target-attach pid | gid | file
Attach to a process pid or a file file outside of gdb, or a thread group gid. If attaching toa thread group, the id previously returned by ‘-list-thread-groups --available’ mustbe used.
gdb Command
The corresponding gdb command is ‘attach’.
Example(gdb)
-target-attach 34
=thread-created,id="1"
*stopped,thread-id="1",frame={addr="0xb7f7e410",func="bar",args=[]}
^done
(gdb)
The -target-detach Command
Synopsis-target-detach [ pid | gid ]
Detach from the remote target which normally resumes its execution. If either pid or gidis specified, detaches from either the specified process, or specified thread group. There’sno output.
gdb Command
The corresponding gdb command is ‘detach’.
400 Debugging with gdb
Example(gdb)
-target-detach
^done
(gdb)
The -target-disconnect Command
Synopsis-target-disconnect
Disconnect from the remote target. There’s no output and the target is generally notresumed.
gdb Command
The corresponding gdb command is ‘disconnect’.
Example(gdb)
-target-disconnect
^done
(gdb)
The -target-download Command
Synopsis-target-download
Loads the executable onto the remote target. It prints out an update message every halfsecond, which includes the fields:
‘section’ The name of the section.
‘section-sent’The size of what has been sent so far for that section.
‘section-size’The size of the section.
‘total-sent’The total size of what was sent so far (the current and the previous sections).
‘total-size’The size of the overall executable to download.
Each message is sent as status record (see Section 27.4.2 [gdb/miOutput Syntax], page 341).
In addition, it prints the name and size of the sections, as they are downloaded. Thesemessages include the following fields:
‘section’ The name of the section.
‘section-size’The size of the section.
Chapter 27: The gdb/mi Interface 401
‘total-size’The size of the overall executable to download.
At the end, a summary is printed.
gdb Command
The corresponding gdb command is ‘load’.
Example
Note: each status message appears on a single line. Here the messages have been brokendown so that they can fit onto a page.
(gdb)
-target-download
+download,{section=".text",section-size="6668",total-size="9880"}
+download,{section=".text",section-sent="512",section-size="6668",
total-sent="512",total-size="9880"}
+download,{section=".text",section-sent="1024",section-size="6668",
total-sent="1024",total-size="9880"}
+download,{section=".text",section-sent="1536",section-size="6668",
total-sent="1536",total-size="9880"}
+download,{section=".text",section-sent="2048",section-size="6668",
total-sent="2048",total-size="9880"}
+download,{section=".text",section-sent="2560",section-size="6668",
total-sent="2560",total-size="9880"}
+download,{section=".text",section-sent="3072",section-size="6668",
total-sent="3072",total-size="9880"}
+download,{section=".text",section-sent="3584",section-size="6668",
total-sent="3584",total-size="9880"}
+download,{section=".text",section-sent="4096",section-size="6668",
total-sent="4096",total-size="9880"}
+download,{section=".text",section-sent="4608",section-size="6668",
total-sent="4608",total-size="9880"}
+download,{section=".text",section-sent="5120",section-size="6668",
total-sent="5120",total-size="9880"}
+download,{section=".text",section-sent="5632",section-size="6668",
total-sent="5632",total-size="9880"}
+download,{section=".text",section-sent="6144",section-size="6668",
total-sent="6144",total-size="9880"}
+download,{section=".text",section-sent="6656",section-size="6668",
total-sent="6656",total-size="9880"}
+download,{section=".init",section-size="28",total-size="9880"}
+download,{section=".fini",section-size="28",total-size="9880"}
+download,{section=".data",section-size="3156",total-size="9880"}
+download,{section=".data",section-sent="512",section-size="3156",
total-sent="7236",total-size="9880"}
+download,{section=".data",section-sent="1024",section-size="3156",
total-sent="7748",total-size="9880"}
+download,{section=".data",section-sent="1536",section-size="3156",
total-sent="8260",total-size="9880"}
+download,{section=".data",section-sent="2048",section-size="3156",
total-sent="8772",total-size="9880"}
+download,{section=".data",section-sent="2560",section-size="3156",
total-sent="9284",total-size="9880"}
+download,{section=".data",section-sent="3072",section-size="3156",
total-sent="9796",total-size="9880"}
^done,address="0x10004",load-size="9880",transfer-rate="6586",
402 Debugging with gdb
write-rate="429"
(gdb)
gdb Command
No equivalent.
Example
N.A.
The -target-select Command
Synopsis-target-select type parameters ...
Connect gdb to the remote target. This command takes two args:
‘type ’ The type of target, for instance ‘remote’, etc.
‘parameters ’Device names, host names and the like. See Section 19.2 [Commands for Man-aging Targets], page 215, for more details.
The output is a connection notification, followed by the address at which the targetprogram is, in the following form:
^connected,addr="address",func="function name",
args=[arg list]
gdb Command
The corresponding gdb command is ‘target’.
Example(gdb)
-target-select remote /dev/ttya
^connected,addr="0xfe00a300",func="??",args=[]
(gdb)
27.22 gdb/mi File Transfer Commands
The -target-file-put Command
Synopsis-target-file-put hostfile targetfile
Copy file hostfile from the host system (the machine running gdb) to targetfile on thetarget system.
gdb Command
The corresponding gdb command is ‘remote put’.
Chapter 27: The gdb/mi Interface 403
Example(gdb)
-target-file-put localfile remotefile
^done
(gdb)
The -target-file-get Command
Synopsis-target-file-get targetfile hostfile
Copy file targetfile from the target system to hostfile on the host system.
gdb Command
The corresponding gdb command is ‘remote get’.
Example(gdb)
-target-file-get remotefile localfile
^done
(gdb)
The -target-file-delete Command
Synopsis-target-file-delete targetfile
Delete targetfile from the target system.
gdb Command
The corresponding gdb command is ‘remote delete’.
Example(gdb)
-target-file-delete remotefile
^done
(gdb)
27.23 Miscellaneous gdb/mi Commands
The -gdb-exit Command
Synopsis-gdb-exit
Exit gdb immediately.
gdb Command
Approximately corresponds to ‘quit’.

404 Debugging with gdb
Example(gdb)
-gdb-exit
^exit
The -gdb-set Command
Synopsis-gdb-set
Set an internal gdb variable.
gdb Command
The corresponding gdb command is ‘set’.
Example(gdb)
-gdb-set $foo=3
^done
(gdb)
The -gdb-show Command
Synopsis-gdb-show
Show the current value of a gdb variable.
gdb Command
The corresponding gdb command is ‘show’.
Example(gdb)
-gdb-show annotate
^done,value="0"
(gdb)
The -gdb-version Command
Synopsis-gdb-version
Show version information for gdb. Used mostly in testing.
gdb Command
The gdb equivalent is ‘show version’. gdb by default shows this information when youstart an interactive session.
Example(gdb)
-gdb-version
Chapter 27: The gdb/mi Interface 405
~GNU gdb 5.2.1
~Copyright 2000 Free Software Foundation, Inc.
~GDB is free software, covered by the GNU General Public License, and
~you are welcome to change it and/or distribute copies of it under
~ certain conditions.
~Type "show copying" to see the conditions.
~There is absolutely no warranty for GDB. Type "show warranty" for
~ details.
~This GDB was configured as
"--host=sparc-sun-solaris2.5.1 --target=ppc-eabi".
^done
(gdb)
The -list-features Command
Returns a list of particular features of the MI protocol that this version of gdb implements.A feature can be a command, or a new field in an output of some command, or even animportant bugfix. While a frontend can sometimes detect presence of a feature at runtime,it is easier to perform detection at debugger startup.
The command returns a list of strings, with each string naming an available feature.Each returned string is just a name, it does not have any internal structure. The list ofpossible feature names is given below.
Example output:
(gdb) -list-features
^done,result=["feature1","feature2"]
The current list of features is:
‘frozen-varobjs’Indicates support for the -var-set-frozen command, as well as possible pre-sense of the frozen field in the output of -varobj-create.
‘pending-breakpoints’Indicates support for the ‘-f’ option to the -break-insert command.
‘python’ Indicates Python scripting support, Python-based pretty-printing commands,and possible presence of the ‘display_hint’ field in the output of -var-list-children
‘thread-info’Indicates support for the -thread-info command.
‘data-read-memory-bytes’Indicates support for the -data-read-memory-bytes and the -data-write-
memory-bytes commands.
‘breakpoint-notifications’Indicates that changes to breakpoints and breakpoints created via the CLI willbe announced via async records.
‘ada-task-info’Indicates support for the -ada-task-info command.
406 Debugging with gdb
The -list-target-features Command
Returns a list of particular features that are supported by the target. Those features affectthe permitted MI commands, but unlike the features reported by the -list-features
command, the features depend on which target GDB is using at the moment. Whenevera target can change, due to commands such as -target-select, -target-attach or -
exec-run, the list of target features may change, and the frontend should obtain it again.Example output:
(gdb) -list-features
^done,result=["async"]
The current list of features is:
‘async’ Indicates that the target is capable of asynchronous command execution, whichmeans that gdb will accept further commands while the target is running.
‘reverse’ Indicates that the target is capable of reverse execution. See Chapter 6 [ReverseExecution], page 75, for more information.
The -list-thread-groups Command
Synopsis-list-thread-groups [ --available ] [ --recurse 1 ] [ group ... ]
Lists thread groups (see Section 27.3.3 [Thread groups], page 339). When a single threadgroup is passed as the argument, lists the children of that group. When several threadgroup are passed, lists information about those thread groups. Without any parameters,lists information about all top-level thread groups.
Normally, thread groups that are being debugged are reported. With the ‘--available’option, gdb reports thread groups available on the target.
The output of this command may have either a ‘threads’ result or a ‘groups’ result.The ‘thread’ result has a list of tuples as value, with each tuple describing a thread (seeSection 27.7.5 [GDB/MI Thread Information], page 347). The ‘groups’ result has a listof tuples as value, each tuple describing a thread group. If top-level groups are requested(that is, no parameter is passed), or when several groups are passed, the output always hasa ‘groups’ result. The format of the ‘group’ result is described below.
To reduce the number of roundtrips it’s possible to list thread groups together withtheir children, by passing the ‘--recurse’ option and the recursion depth. Presently, onlyrecursion depth of 1 is permitted. If this option is present, then every reported thread groupwill also include its children, either as ‘group’ or ‘threads’ field.
In general, any combination of option and parameters is permitted, with the followingcaveats:
• When a single thread group is passed, the output will typically be the ‘threads’ result.Because threads may not contain anything, the ‘recurse’ option will be ignored.
• When the ‘--available’ option is passed, limited information may be available. Inparticular, the list of threads of a process might be inaccessible. Further, specifyingspecific thread groups might not give any performance advantage over listing all threadgroups. The frontend should assume that ‘-list-thread-groups --available’ isalways an expensive operation and cache the results.
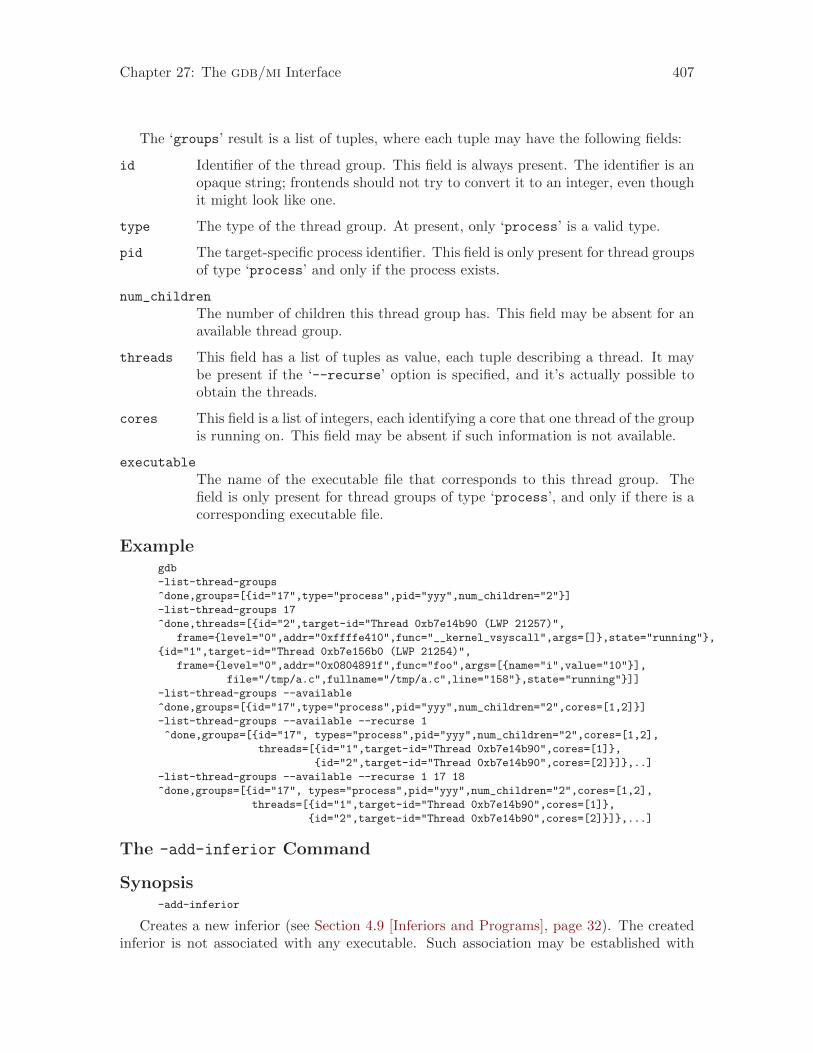
Chapter 27: The gdb/mi Interface 407
The ‘groups’ result is a list of tuples, where each tuple may have the following fields:
id Identifier of the thread group. This field is always present. The identifier is anopaque string; frontends should not try to convert it to an integer, even thoughit might look like one.
type The type of the thread group. At present, only ‘process’ is a valid type.
pid The target-specific process identifier. This field is only present for thread groupsof type ‘process’ and only if the process exists.
num_children
The number of children this thread group has. This field may be absent for anavailable thread group.
threads This field has a list of tuples as value, each tuple describing a thread. It maybe present if the ‘--recurse’ option is specified, and it’s actually possible toobtain the threads.
cores This field is a list of integers, each identifying a core that one thread of the groupis running on. This field may be absent if such information is not available.
executable
The name of the executable file that corresponds to this thread group. Thefield is only present for thread groups of type ‘process’, and only if there is acorresponding executable file.
Examplegdb
-list-thread-groups
^done,groups=[{id="17",type="process",pid="yyy",num_children="2"}]
-list-thread-groups 17
^done,threads=[{id="2",target-id="Thread 0xb7e14b90 (LWP 21257)",
frame={level="0",addr="0xffffe410",func="__kernel_vsyscall",args=[]},state="running"},
{id="1",target-id="Thread 0xb7e156b0 (LWP 21254)",
frame={level="0",addr="0x0804891f",func="foo",args=[{name="i",value="10"}],
file="/tmp/a.c",fullname="/tmp/a.c",line="158"},state="running"}]]
-list-thread-groups --available
^done,groups=[{id="17",type="process",pid="yyy",num_children="2",cores=[1,2]}]
-list-thread-groups --available --recurse 1
^done,groups=[{id="17", types="process",pid="yyy",num_children="2",cores=[1,2],
threads=[{id="1",target-id="Thread 0xb7e14b90",cores=[1]},
{id="2",target-id="Thread 0xb7e14b90",cores=[2]}]},..]
-list-thread-groups --available --recurse 1 17 18
^done,groups=[{id="17", types="process",pid="yyy",num_children="2",cores=[1,2],
threads=[{id="1",target-id="Thread 0xb7e14b90",cores=[1]},
{id="2",target-id="Thread 0xb7e14b90",cores=[2]}]},...]
The -add-inferior Command
Synopsis-add-inferior
Creates a new inferior (see Section 4.9 [Inferiors and Programs], page 32). The createdinferior is not associated with any executable. Such association may be established with
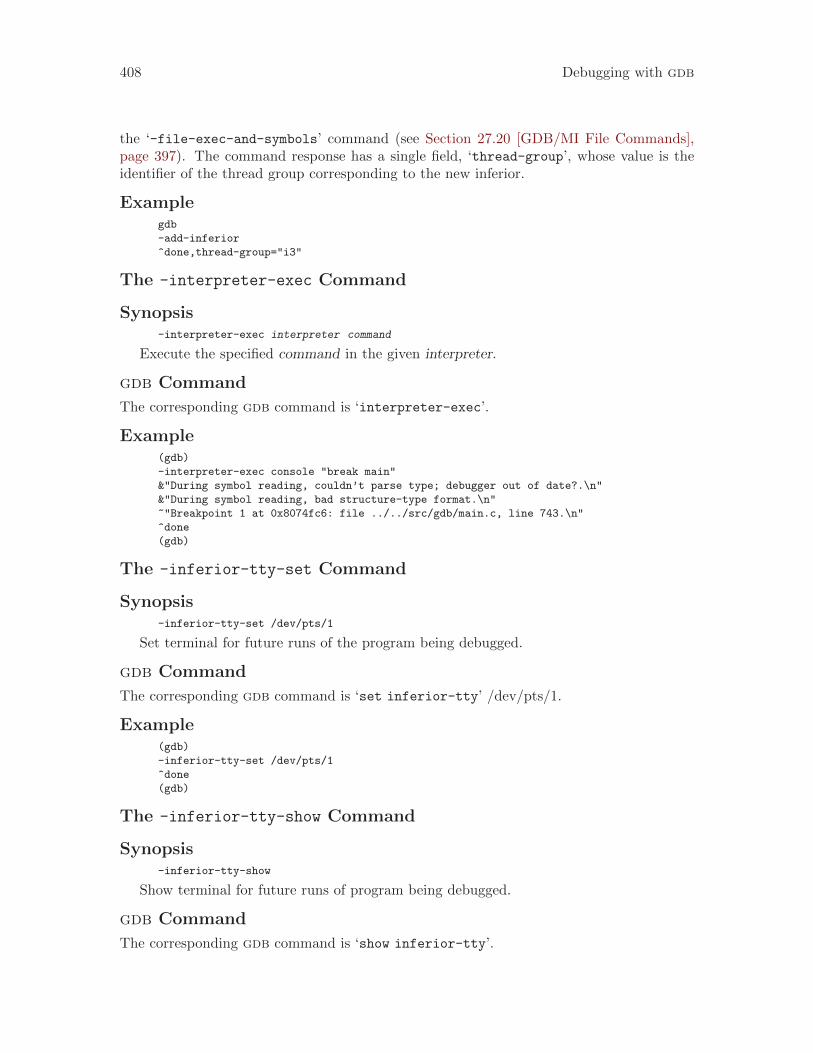
408 Debugging with gdb
the ‘-file-exec-and-symbols’ command (see Section 27.20 [GDB/MI File Commands],page 397). The command response has a single field, ‘thread-group’, whose value is theidentifier of the thread group corresponding to the new inferior.
Examplegdb
-add-inferior
^done,thread-group="i3"
The -interpreter-exec Command
Synopsis-interpreter-exec interpreter command
Execute the specified command in the given interpreter.
gdb Command
The corresponding gdb command is ‘interpreter-exec’.
Example(gdb)
-interpreter-exec console "break main"
&"During symbol reading, couldn’t parse type; debugger out of date?.\n"
&"During symbol reading, bad structure-type format.\n"
~"Breakpoint 1 at 0x8074fc6: file ../../src/gdb/main.c, line 743.\n"
^done
(gdb)
The -inferior-tty-set Command
Synopsis-inferior-tty-set /dev/pts/1
Set terminal for future runs of the program being debugged.
gdb Command
The corresponding gdb command is ‘set inferior-tty’ /dev/pts/1.
Example(gdb)
-inferior-tty-set /dev/pts/1
^done
(gdb)
The -inferior-tty-show Command
Synopsis-inferior-tty-show
Show terminal for future runs of program being debugged.
gdb Command
The corresponding gdb command is ‘show inferior-tty’.
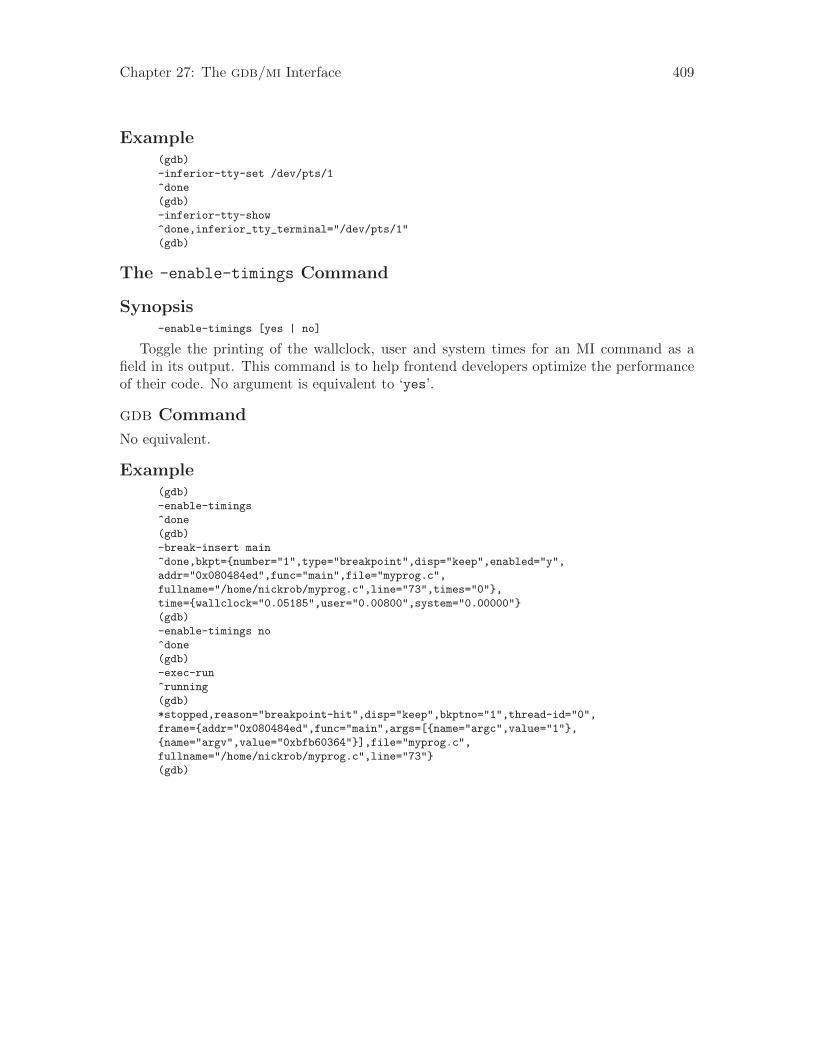
Chapter 27: The gdb/mi Interface 409
Example(gdb)
-inferior-tty-set /dev/pts/1
^done
(gdb)
-inferior-tty-show
^done,inferior_tty_terminal="/dev/pts/1"
(gdb)
The -enable-timings Command
Synopsis-enable-timings [yes | no]
Toggle the printing of the wallclock, user and system times for an MI command as afield in its output. This command is to help frontend developers optimize the performanceof their code. No argument is equivalent to ‘yes’.
gdb Command
No equivalent.
Example(gdb)
-enable-timings
^done
(gdb)
-break-insert main
^done,bkpt={number="1",type="breakpoint",disp="keep",enabled="y",
addr="0x080484ed",func="main",file="myprog.c",
fullname="/home/nickrob/myprog.c",line="73",times="0"},
time={wallclock="0.05185",user="0.00800",system="0.00000"}
(gdb)
-enable-timings no
^done
(gdb)
-exec-run
^running
(gdb)
*stopped,reason="breakpoint-hit",disp="keep",bkptno="1",thread-id="0",
frame={addr="0x080484ed",func="main",args=[{name="argc",value="1"},
{name="argv",value="0xbfb60364"}],file="myprog.c",
fullname="/home/nickrob/myprog.c",line="73"}
(gdb)

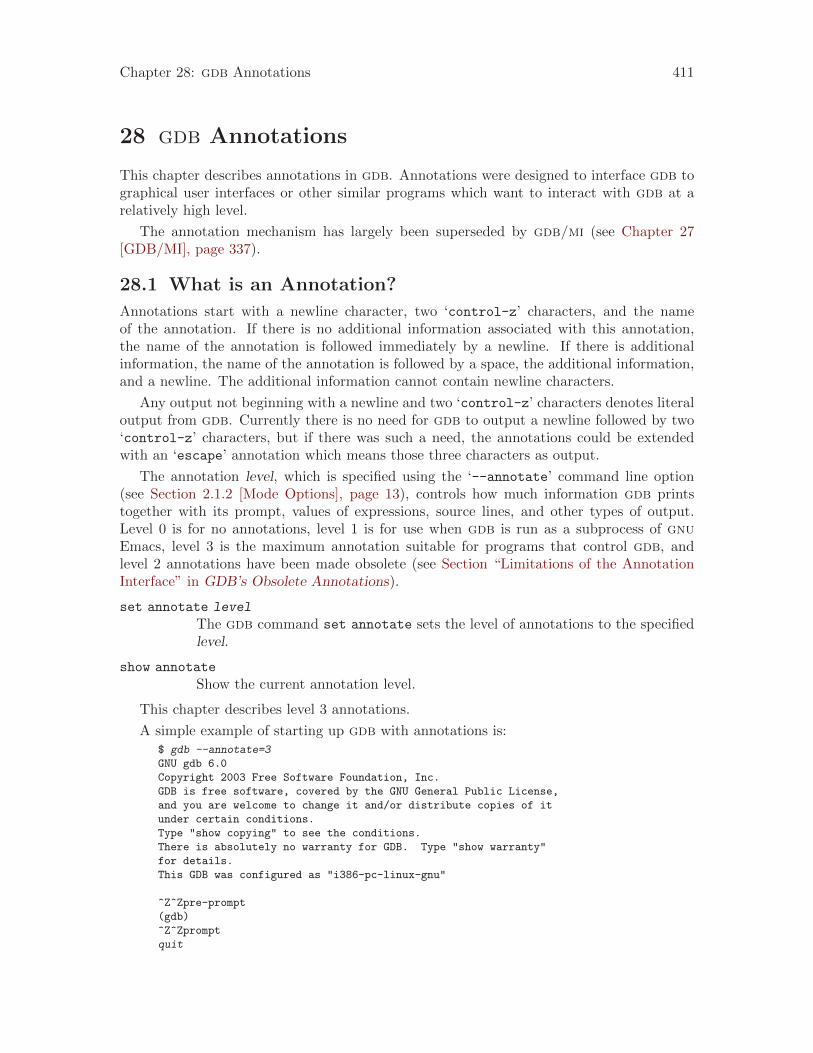
Chapter 28: gdb Annotations 411
28 gdb Annotations
This chapter describes annotations in gdb. Annotations were designed to interface gdb tographical user interfaces or other similar programs which want to interact with gdb at arelatively high level.
The annotation mechanism has largely been superseded by gdb/mi (see Chapter 27[GDB/MI], page 337).
28.1 What is an Annotation?
Annotations start with a newline character, two ‘control-z’ characters, and the nameof the annotation. If there is no additional information associated with this annotation,the name of the annotation is followed immediately by a newline. If there is additionalinformation, the name of the annotation is followed by a space, the additional information,and a newline. The additional information cannot contain newline characters.
Any output not beginning with a newline and two ‘control-z’ characters denotes literaloutput from gdb. Currently there is no need for gdb to output a newline followed by two‘control-z’ characters, but if there was such a need, the annotations could be extendedwith an ‘escape’ annotation which means those three characters as output.
The annotation level, which is specified using the ‘--annotate’ command line option(see Section 2.1.2 [Mode Options], page 13), controls how much information gdb printstogether with its prompt, values of expressions, source lines, and other types of output.Level 0 is for no annotations, level 1 is for use when gdb is run as a subprocess of gnuEmacs, level 3 is the maximum annotation suitable for programs that control gdb, andlevel 2 annotations have been made obsolete (see Section “Limitations of the AnnotationInterface” in GDB’s Obsolete Annotations).
set annotate level
The gdb command set annotate sets the level of annotations to the specifiedlevel.
show annotate
Show the current annotation level.
This chapter describes level 3 annotations.
A simple example of starting up gdb with annotations is:$ gdb --annotate=3
GNU gdb 6.0
Copyright 2003 Free Software Foundation, Inc.
GDB is free software, covered by the GNU General Public License,
and you are welcome to change it and/or distribute copies of it
under certain conditions.
Type "show copying" to see the conditions.
There is absolutely no warranty for GDB. Type "show warranty"
for details.
This GDB was configured as "i386-pc-linux-gnu"
^Z^Zpre-prompt
(gdb)
^Z^Zprompt
quit
412 Debugging with gdb
^Z^Zpost-prompt
$
Here ‘quit’ is input to gdb; the rest is output from gdb. The three lines beginning‘^Z^Z’ (where ‘^Z’ denotes a ‘control-z’ character) are annotations; the rest is outputfrom gdb.
28.2 The Server Prefix
If you prefix a command with ‘server ’ then it will not affect the command history, norwill it affect gdb’s notion of which command to repeat if RET is pressed on a line by itself.This means that commands can be run behind a user’s back by a front-end in a transparentmanner.
The server prefix does not affect the recording of values into the value history; to printa value without recording it into the value history, use the output command instead of theprint command.
Using this prefix also disables confirmation requests (see [confirmation requests],page 270).
28.3 Annotation for gdb Input
When gdb prompts for input, it annotates this fact so it is possible to know when to sendoutput, when the output from a given command is over, etc.
Different kinds of input each have a different input type. Each input type has threeannotations: a pre- annotation, which denotes the beginning of any prompt which is beingoutput, a plain annotation, which denotes the end of the prompt, and then a post- anno-tation which denotes the end of any echo which may (or may not) be associated with theinput. For example, the prompt input type features the following annotations:
^Z^Zpre-prompt
^Z^Zprompt
^Z^Zpost-prompt
The input types are
prompt When gdb is prompting for a command (the main gdb prompt).
commands When gdb prompts for a set of commands, like in the commands command.The annotations are repeated for each command which is input.
overload-choice
When gdb wants the user to select between various overloaded functions.
query When gdb wants the user to confirm a potentially dangerous operation.
prompt-for-continue
When gdb is asking the user to press return to continue. Note: Don’t expectthis to work well; instead use set height 0 to disable prompting. This isbecause the counting of lines is buggy in the presence of annotations.
Chapter 28: gdb Annotations 413
28.4 Errors^Z^Zquit
This annotation occurs right before gdb responds to an interrupt.^Z^Zerror
This annotation occurs right before gdb responds to an error.
Quit and error annotations indicate that any annotations which gdb was in the middleof may end abruptly. For example, if a value-history-begin annotation is followed by aerror, one cannot expect to receive the matching value-history-end. One cannot expectnot to receive it either, however; an error annotation does not necessarily mean that gdbis immediately returning all the way to the top level.
A quit or error annotation may be preceded by^Z^Zerror-begin
Any output between that and the quit or error annotation is the error message.
Warning messages are not yet annotated.
28.5 Invalidation Notices
The following annotations say that certain pieces of state may have changed.
^Z^Zframes-invalid
The frames (for example, output from the backtrace command) may havechanged.
^Z^Zbreakpoints-invalid
The breakpoints may have changed. For example, the user just added or deleteda breakpoint.
28.6 Running the Program
When the program starts executing due to a gdb command such as step or continue,^Z^Zstarting
is output. When the program stops,^Z^Zstopped
is output. Before the stopped annotation, a variety of annotations describe how theprogram stopped.
^Z^Zexited exit-status
The program exited, and exit-status is the exit status (zero for successful exit,otherwise nonzero).
^Z^Zsignalled
The program exited with a signal. After the ^Z^Zsignalled, the annotationcontinues:
intro-text
^Z^Zsignal-name
name
^Z^Zsignal-name-end
middle-text
^Z^Zsignal-string
414 Debugging with gdb
string
^Z^Zsignal-string-end
end-text
where name is the name of the signal, such as SIGILL or SIGSEGV, and string isthe explanation of the signal, such as Illegal Instruction or Segmentationfault. intro-text, middle-text, and end-text are for the user’s benefit and haveno particular format.
^Z^Zsignal
The syntax of this annotation is just like signalled, but gdb is just sayingthat the program received the signal, not that it was terminated with it.
^Z^Zbreakpoint number
The program hit breakpoint number number.
^Z^Zwatchpoint number
The program hit watchpoint number number.
28.7 Displaying Source
The following annotation is used instead of displaying source code:^Z^Zsource filename:line:character:middle:addr
where filename is an absolute file name indicating which source file, line is the linenumber within that file (where 1 is the first line in the file), character is the characterposition within the file (where 0 is the first character in the file) (for most debug formatsthis will necessarily point to the beginning of a line), middle is ‘middle’ if addr is in themiddle of the line, or ‘beg’ if addr is at the beginning of the line, and addr is the addressin the target program associated with the source which is being displayed. addr is in theform ‘0x’ followed by one or more lowercase hex digits (note that this does not depend onthe language).
Chapter 29: JIT Compilation Interface 415
29 JIT Compilation Interface
This chapter documents gdb’s just-in-time (JIT) compilation interface. A JIT compileris a program or library that generates native executable code at runtime and executes it,usually in order to achieve good performance while maintaining platform independence.
Programs that use JIT compilation are normally difficult to debug because portions oftheir code are generated at runtime, instead of being loaded from object files, which iswhere gdb normally finds the program’s symbols and debug information. In order to debugprograms that use JIT compilation, gdb has an interface that allows the program to registerin-memory symbol files with gdb at runtime.
If you are using gdb to debug a program that uses this interface, then it should worktransparently so long as you have not stripped the binary. If you are developing a JITcompiler, then the interface is documented in the rest of this chapter. At this time, theonly known client of this interface is the LLVM JIT.
Broadly speaking, the JIT interface mirrors the dynamic loader interface. The JITcompiler communicates with gdb by writing data into a global variable and calling a fuctionat a well-known symbol. When gdb attaches, it reads a linked list of symbol files from theglobal variable to find existing code, and puts a breakpoint in the function so that it canfind out about additional code.
29.1 JIT Declarations
These are the relevant struct declarations that a C program should include to implementthe interface:
typedef enum
{
JIT_NOACTION = 0,
JIT_REGISTER_FN,
JIT_UNREGISTER_FN
} jit_actions_t;
struct jit_code_entry
{
struct jit_code_entry *next_entry;
struct jit_code_entry *prev_entry;
const char *symfile_addr;
uint64_t symfile_size;
};
struct jit_descriptor
{
uint32_t version;
/* This type should be jit_actions_t, but we use uint32_t
to be explicit about the bitwidth. */
uint32_t action_flag;
struct jit_code_entry *relevant_entry;
struct jit_code_entry *first_entry;
};
/* GDB puts a breakpoint in this function. */
void __attribute__((noinline)) __jit_debug_register_code() { };
416 Debugging with gdb
/* Make sure to specify the version statically, because the
debugger may check the version before we can set it. */
struct jit_descriptor __jit_debug_descriptor = { 1, 0, 0, 0 };
If the JIT is multi-threaded, then it is important that the JIT synchronize any modi-fications to this global data properly, which can easily be done by putting a global mutexaround modifications to these structures.
29.2 Registering Code
To register code with gdb, the JIT should follow this protocol:
• Generate an object file in memory with symbols and other desired debug information.The file must include the virtual addresses of the sections.
• Create a code entry for the file, which gives the start and size of the symbol file.
• Add it to the linked list in the JIT descriptor.
• Point the relevant entry field of the descriptor at the entry.
• Set action_flag to JIT_REGISTER and call __jit_debug_register_code.
When gdb is attached and the breakpoint fires, gdb uses the relevant_entry pointerso it doesn’t have to walk the list looking for new code. However, the linked list must stillbe maintained in order to allow gdb to attach to a running process and still find the symbolfiles.
29.3 Unregistering Code
If code is freed, then the JIT should use the following protocol:
• Remove the code entry corresponding to the code from the linked list.
• Point the relevant_entry field of the descriptor at the code entry.
• Set action_flag to JIT_UNREGISTER and call __jit_debug_register_code.
If the JIT frees or recompiles code without unregistering it, then gdb and the JIT willleak the memory used for the associated symbol files.
29.4 Custom Debug Info
Generating debug information in platform-native file formats (like ELF or COFF) may bean overkill for JIT compilers; especially if all the debug info is used for is displaying ameaningful backtrace. The issue can be resolved by having the JIT writers decide on adebug info format and also provide a reader that parses the debug info generated by theJIT compiler. This section gives a brief overview on writing such a parser. More specificdetails can be found in the source file ‘gdb/jit-reader.in’, which is also installed as aheader at ‘includedir/gdb/jit-reader.h’ for easy inclusion.
The reader is implemented as a shared object (so this functionality is not available onplatforms which don’t allow loading shared objects at runtime). Two gdb commands, jit-reader-load and jit-reader-unload are provided, to be used to load and unload thereaders from a preconfigured directory. Once loaded, the shared object is used the parsethe debug information emitted by the JIT compiler.
Chapter 29: JIT Compilation Interface 417
29.4.1 Using JIT Debug Info Readers
Readers can be loaded and unloaded using the jit-reader-load and jit-reader-unload
commands.
jit-reader-load reader-name
Load the JIT reader named reader-name. On a UNIX system, this will usuallyload ‘libdir/gdb/reader-name ’, where libdir is the system library directory,usually ‘/usr/local/lib’. Only one reader can be active at a time; trying toload a second reader when one is already loaded will result in gdb reporting anerror. A new JIT reader can be loaded by first unloading the current one usingjit-reader-load and then invoking jit-reader-load.
jit-reader-unload
Unload the currently loaded JIT reader.
29.4.2 Writing JIT Debug Info Readers
As mentioned, a reader is essentially a shared object conforming to a certain ABI. This ABIis described in ‘jit-reader.h’.
‘jit-reader.h’ defines the structures, macros and functions required to write a reader.It is installed (along with gdb), in ‘includedir/gdb’ where includedir is the system includedirectory.
Readers need to be released under a GPL compatible license. A reader can be declared asreleased under such a license by placing the macro GDB_DECLARE_GPL_COMPATIBLE_READER
in a source file.
The entry point for readers is the symbol gdb_init_reader, which is expected to be afunction with the prototype
extern struct gdb_reader_funcs *gdb_init_reader (void);
struct gdb_reader_funcs contains a set of pointers to callback functions. These func-tions are executed to read the debug info generated by the JIT compiler (read), to unwindstack frames (unwind) and to create canonical frame IDs (get_Frame_id). It also has acallback that is called when the reader is being unloaded (destroy). The struct looks likethis
struct gdb_reader_funcs
{
/* Must be set to GDB_READER_INTERFACE_VERSION. */
int reader_version;
/* For use by the reader. */
void *priv_data;
gdb_read_debug_info *read;
gdb_unwind_frame *unwind;
gdb_get_frame_id *get_frame_id;
gdb_destroy_reader *destroy;
};
The callbacks are provided with another set of callbacks by gdb to do their job. Forread, these callbacks are passed in a struct gdb_symbol_callbacks and for unwind andget_frame_id, in a struct gdb_unwind_callbacks. struct gdb_symbol_callbacks hascallbacks to create new object files and new symbol tables inside those object files. struct

418 Debugging with gdb
gdb_unwind_callbacks has callbacks to read registers off the current frame and to writeout the values of the registers in the previous frame. Both have a callback (target_read)to read bytes off the target’s address space.
Chapter 30: Reporting Bugs in gdb 419
30 Reporting Bugs in gdb
Your bug reports play an essential role in making gdb reliable.
Reporting a bug may help you by bringing a solution to your problem, or it may not.But in any case the principal function of a bug report is to help the entire community bymaking the next version of gdb work better. Bug reports are your contribution to themaintenance of gdb.
In order for a bug report to serve its purpose, you must include the information thatenables us to fix the bug.
30.1 Have You Found a Bug?
If you are not sure whether you have found a bug, here are some guidelines:
• If the debugger gets a fatal signal, for any input whatever, that is a gdb bug. Reliabledebuggers never crash.
• If gdb produces an error message for valid input, that is a bug. (Note that if you’recross debugging, the problem may also be somewhere in the connection to the target.)
• If gdb does not produce an error message for invalid input, that is a bug. However,you should note that your idea of “invalid input” might be our idea of “an extension”or “support for traditional practice”.
• If you are an experienced user of debugging tools, your suggestions for improvement ofgdb are welcome in any case.
30.2 How to Report Bugs
A number of companies and individuals offer support for gnu products. If you obtainedgdb from a support organization, we recommend you contact that organization first.
You can find contact information for many support companies and individuals in the file‘etc/SERVICE’ in the gnu Emacs distribution.
In any event, we also recommend that you submit bug reports for gdb. The preferredmethod is to submit them directly using gdb’s Bugs web page. Alternatively, the e-mailgateway can be used.
Do not send bug reports to ‘info-gdb’, or to ‘help-gdb’, or to any newsgroups. Mostusers of gdb do not want to receive bug reports. Those that do have arranged to receive‘bug-gdb’.
The mailing list ‘bug-gdb’ has a newsgroup ‘gnu.gdb.bug’ which serves as a repeater.The mailing list and the newsgroup carry exactly the same messages. Often people think ofposting bug reports to the newsgroup instead of mailing them. This appears to work, butit has one problem which can be crucial: a newsgroup posting often lacks a mail path backto the sender. Thus, if we need to ask for more information, we may be unable to reachyou. For this reason, it is better to send bug reports to the mailing list.
The fundamental principle of reporting bugs usefully is this: report all the facts. If youare not sure whether to state a fact or leave it out, state it!
Often people omit facts because they think they know what causes the problem andassume that some details do not matter. Thus, you might assume that the name of the
420 Debugging with gdb
variable you use in an example does not matter. Well, probably it does not, but one cannotbe sure. Perhaps the bug is a stray memory reference which happens to fetch from thelocation where that name is stored in memory; perhaps, if the name were different, thecontents of that location would fool the debugger into doing the right thing despite the bug.Play it safe and give a specific, complete example. That is the easiest thing for you to do,and the most helpful.
Keep in mind that the purpose of a bug report is to enable us to fix the bug. It maybe that the bug has been reported previously, but neither you nor we can know that unlessyour bug report is complete and self-contained.
Sometimes people give a few sketchy facts and ask, “Does this ring a bell?” Those bugreports are useless, and we urge everyone to refuse to respond to them except to chide thesender to report bugs properly.
To enable us to fix the bug, you should include all these things:
• The version of gdb. gdb announces it if you start with no arguments; you can alsoprint it at any time using show version.
Without this, we will not know whether there is any point in looking for the bug in thecurrent version of gdb.
• The type of machine you are using, and the operating system name and version number.
• What compiler (and its version) was used to compile gdb—e.g. “gcc–2.8.1”.
• What compiler (and its version) was used to compile the program you are debugging—e.g. “gcc–2.8.1”, or “HP92453-01 A.10.32.03 HP C Compiler”. For gcc, you can saygcc --version to get this information; for other compilers, see the documentation forthose compilers.
• The command arguments you gave the compiler to compile your example and observethe bug. For example, did you use ‘-O’? To guarantee you will not omit somethingimportant, list them all. A copy of the Makefile (or the output from make) is sufficient.
If we were to try to guess the arguments, we would probably guess wrong and then wemight not encounter the bug.
• A complete input script, and all necessary source files, that will reproduce the bug.
• A description of what behavior you observe that you believe is incorrect. For example,“It gets a fatal signal.”
Of course, if the bug is that gdb gets a fatal signal, then we will certainly notice it.But if the bug is incorrect output, we might not notice unless it is glaringly wrong.You might as well not give us a chance to make a mistake.
Even if the problem you experience is a fatal signal, you should still say so explicitly.Suppose something strange is going on, such as, your copy of gdb is out of synch, oryou have encountered a bug in the C library on your system. (This has happened!)Your copy might crash and ours would not. If you told us to expect a crash, then whenours fails to crash, we would know that the bug was not happening for us. If you hadnot told us to expect a crash, then we would not be able to draw any conclusion fromour observations.
To collect all this information, you can use a session recording program such as script,which is available on many Unix systems. Just run your gdb session inside script andthen include the ‘typescript’ file with your bug report.
Chapter 30: Reporting Bugs in gdb 421
Another way to record a gdb session is to run gdb inside Emacs and then save theentire buffer to a file.
• If you wish to suggest changes to the gdb source, send us context diffs. If you evendiscuss something in the gdb source, refer to it by context, not by line number.
The line numbers in our development sources will not match those in your sources.Your line numbers would convey no useful information to us.
Here are some things that are not necessary:
• A description of the envelope of the bug.
Often people who encounter a bug spend a lot of time investigating which changes tothe input file will make the bug go away and which changes will not affect it.
This is often time consuming and not very useful, because the way we will find thebug is by running a single example under the debugger with breakpoints, not by purededuction from a series of examples. We recommend that you save your time forsomething else.
Of course, if you can find a simpler example to report instead of the original one, thatis a convenience for us. Errors in the output will be easier to spot, running under thedebugger will take less time, and so on.
However, simplification is not vital; if you do not want to do this, report the buganyway and send us the entire test case you used.
• A patch for the bug.
A patch for the bug does help us if it is a good one. But do not omit the necessaryinformation, such as the test case, on the assumption that a patch is all we need. Wemight see problems with your patch and decide to fix the problem another way, or wemight not understand it at all.
Sometimes with a program as complicated as gdb it is very hard to construct anexample that will make the program follow a certain path through the code. If you donot send us the example, we will not be able to construct one, so we will not be ableto verify that the bug is fixed.
And if we cannot understand what bug you are trying to fix, or why your patch shouldbe an improvement, we will not install it. A test case will help us to understand.
• A guess about what the bug is or what it depends on.
Such guesses are usually wrong. Even we cannot guess right about such things withoutfirst using the debugger to find the facts.

Chapter 31: Command Line Editing 423
31 Command Line Editing
This chapter describes the basic features of the gnu command line editing interface.
31.1 Introduction to Line Editing
The following paragraphs describe the notation used to represent keystrokes.
The text C-k is read as ‘Control-K’ and describes the character produced when the Kkey is pressed while the Control key is depressed.
The text M-k is read as ‘Meta-K’ and describes the character produced when the Metakey (if you have one) is depressed, and the K key is pressed. The Meta key is labeled ALTon many keyboards. On keyboards with two keys labeled ALT (usually to either side of thespace bar), the ALT on the left side is generally set to work as a Meta key. The ALT keyon the right may also be configured to work as a Meta key or may be configured as someother modifier, such as a Compose key for typing accented characters.
If you do not have a Meta or ALT key, or another key working as a Meta key, the identicalkeystroke can be generated by typing ESC first, and then typing K. Either process is knownas metafying the K key.
The text M-C-k is read as ‘Meta-Control-k’ and describes the character produced bymetafying C-k.
In addition, several keys have their own names. Specifically, DEL, ESC, LFD, SPC,RET, and TAB all stand for themselves when seen in this text, or in an init file (seeSection 31.3 [Readline Init File], page 426). If your keyboard lacks a LFD key, typing C-Jwill produce the desired character. The RET key may be labeled RETURN or ENTER onsome keyboards.
31.2 Readline Interaction
Often during an interactive session you type in a long line of text, only to notice that thefirst word on the line is misspelled. The Readline library gives you a set of commands formanipulating the text as you type it in, allowing you to just fix your typo, and not forcingyou to retype the majority of the line. Using these editing commands, you move the cursorto the place that needs correction, and delete or insert the text of the corrections. Then,when you are satisfied with the line, you simply press RET. You do not have to be at theend of the line to press RET; the entire line is accepted regardless of the location of thecursor within the line.
31.2.1 Readline Bare Essentials
In order to enter characters into the line, simply type them. The typed character appearswhere the cursor was, and then the cursor moves one space to the right. If you mistype acharacter, you can use your erase character to back up and delete the mistyped character.
Sometimes you may mistype a character, and not notice the error until you have typedseveral other characters. In that case, you can type C-b to move the cursor to the left, andthen correct your mistake. Afterwards, you can move the cursor to the right with C-f.
When you add text in the middle of a line, you will notice that characters to the rightof the cursor are ‘pushed over’ to make room for the text that you have inserted. Likewise,
424 Debugging with gdb
when you delete text behind the cursor, characters to the right of the cursor are ‘pulledback’ to fill in the blank space created by the removal of the text. A list of the bare essentialsfor editing the text of an input line follows.
C-b Move back one character.
C-f Move forward one character.
DEL or BACKSPACEDelete the character to the left of the cursor.
C-d Delete the character underneath the cursor.
Printing charactersInsert the character into the line at the cursor.
C-_ or C-x C-u
Undo the last editing command. You can undo all the way back to an emptyline.
(Depending on your configuration, the BACKSPACE key be set to delete the character tothe left of the cursor and the DEL key set to delete the character underneath the cursor,like C-d, rather than the character to the left of the cursor.)
31.2.2 Readline Movement Commands
The above table describes the most basic keystrokes that you need in order to do editing ofthe input line. For your convenience, many other commands have been added in additionto C-b, C-f, C-d, and DEL. Here are some commands for moving more rapidly about theline.
C-a Move to the start of the line.
C-e Move to the end of the line.
M-f Move forward a word, where a word is composed of letters and digits.
M-b Move backward a word.
C-l Clear the screen, reprinting the current line at the top.
Notice how C-f moves forward a character, while M-f moves forward a word. It is a looseconvention that control keystrokes operate on characters while meta keystrokes operate onwords.
31.2.3 Readline Killing Commands
Killing text means to delete the text from the line, but to save it away for later use, usuallyby yanking (re-inserting) it back into the line. (‘Cut’ and ‘paste’ are more recent jargon for‘kill’ and ‘yank’.)
If the description for a command says that it ‘kills’ text, then you can be sure that youcan get the text back in a different (or the same) place later.
When you use a kill command, the text is saved in a kill-ring. Any number of consecutivekills save all of the killed text together, so that when you yank it back, you get it all. Thekill ring is not line specific; the text that you killed on a previously typed line is availableto be yanked back later, when you are typing another line.
Here is the list of commands for killing text.
Chapter 31: Command Line Editing 425
C-k Kill the text from the current cursor position to the end of the line.
M-d Kill from the cursor to the end of the current word, or, if between words, to theend of the next word. Word boundaries are the same as those used by M-f.
M-DEL Kill from the cursor the start of the current word, or, if between words, to thestart of the previous word. Word boundaries are the same as those used byM-b.
C-w Kill from the cursor to the previous whitespace. This is different than M-DEL
because the word boundaries differ.
Here is how to yank the text back into the line. Yanking means to copy the most-recently-killed text from the kill buffer.
C-y Yank the most recently killed text back into the buffer at the cursor.
M-y Rotate the kill-ring, and yank the new top. You can only do this if the priorcommand is C-y or M-y.
31.2.4 Readline Arguments
You can pass numeric arguments to Readline commands. Sometimes the argument actsas a repeat count, other times it is the sign of the argument that is significant. If youpass a negative argument to a command which normally acts in a forward direction, thatcommand will act in a backward direction. For example, to kill text back to the start ofthe line, you might type ‘M-- C-k’.
The general way to pass numeric arguments to a command is to type meta digits beforethe command. If the first ‘digit’ typed is a minus sign (‘-’), then the sign of the argumentwill be negative. Once you have typed one meta digit to get the argument started, youcan type the remainder of the digits, and then the command. For example, to give the C-dcommand an argument of 10, you could type ‘M-1 0 C-d’, which will delete the next tencharacters on the input line.
31.2.5 Searching for Commands in the History
Readline provides commands for searching through the command history for lines containinga specified string. There are two search modes: incremental and non-incremental.
Incremental searches begin before the user has finished typing the search string. As eachcharacter of the search string is typed, Readline displays the next entry from the historymatching the string typed so far. An incremental search requires only as many characters asneeded to find the desired history entry. To search backward in the history for a particularstring, type C-r. Typing C-s searches forward through the history. The characters presentin the value of the isearch-terminators variable are used to terminate an incrementalsearch. If that variable has not been assigned a value, the ESC and C-J characters willterminate an incremental search. C-g will abort an incremental search and restore theoriginal line. When the search is terminated, the history entry containing the search stringbecomes the current line.
To find other matching entries in the history list, type C-r or C-s as appropriate. Thiswill search backward or forward in the history for the next entry matching the search stringtyped so far. Any other key sequence bound to a Readline command will terminate the
426 Debugging with gdb
search and execute that command. For instance, a RET will terminate the search and acceptthe line, thereby executing the command from the history list. A movement command willterminate the search, make the last line found the current line, and begin editing.
Readline remembers the last incremental search string. If two C-rs are typed withoutany intervening characters defining a new search string, any remembered search string isused.
Non-incremental searches read the entire search string before starting to search formatching history lines. The search string may be typed by the user or be part of thecontents of the current line.
31.3 Readline Init File
Although the Readline library comes with a set of Emacs-like keybindings installed bydefault, it is possible to use a different set of keybindings. Any user can customize programsthat use Readline by putting commands in an inputrc file, conventionally in his homedirectory. The name of this file is taken from the value of the environment variable INPUTRC.If that variable is unset, the default is ‘~/.inputrc’. If that file does not exist or cannotbe read, the ultimate default is ‘/etc/inputrc’.
When a program which uses the Readline library starts up, the init file is read, and thekey bindings are set.
In addition, the C-x C-r command re-reads this init file, thus incorporating any changesthat you might have made to it.
31.3.1 Readline Init File Syntax
There are only a few basic constructs allowed in the Readline init file. Blank lines areignored. Lines beginning with a ‘#’ are comments. Lines beginning with a ‘$’ indicateconditional constructs (see Section 31.3.2 [Conditional Init Constructs], page 432). Otherlines denote variable settings and key bindings.
Variable SettingsYou can modify the run-time behavior of Readline by altering the values ofvariables in Readline using the set command within the init file. The syntaxis simple:
set variable value
Here, for example, is how to change from the default Emacs-like key binding touse vi line editing commands:
set editing-mode vi
Variable names and values, where appropriate, are recognized without regardto case. Unrecognized variable names are ignored.
Boolean variables (those that can be set to on or off) are set to on if the value isnull or empty, on (case-insensitive), or 1. Any other value results in the variablebeing set to off.
A great deal of run-time behavior is changeable with the following variables.
bell-style
Controls what happens when Readline wants to ring the termi-nal bell. If set to ‘none’, Readline never rings the bell. If set to
Chapter 31: Command Line Editing 427
‘visible’, Readline uses a visible bell if one is available. If set to‘audible’ (the default), Readline attempts to ring the terminal’sbell.
bind-tty-special-chars
If set to ‘on’, Readline attempts to bind the control characterstreated specially by the kernel’s terminal driver to their Readlineequivalents.
comment-begin
The string to insert at the beginning of the line when the insert-comment command is executed. The default value is "#".
completion-display-width
The number of screen columns used to display possible matcheswhen performing completion. The value is ignored if it is less than0 or greater than the terminal screen width. A value of 0 will causematches to be displayed one per line. The default value is -1.
completion-ignore-case
If set to ‘on’, Readline performs filename matching and completionin a case-insensitive fashion. The default value is ‘off’.
completion-map-case
If set to ‘on’, and completion-ignore-case is enabled, Readline treatshyphens (‘-’) and underscores (‘_’) as equivalent when performingcase-insensitive filename matching and completion.
completion-prefix-display-length
The length in characters of the common prefix of a list of possiblecompletions that is displayed without modification. When set to avalue greater than zero, common prefixes longer than this value arereplaced with an ellipsis when displaying possible completions.
completion-query-items
The number of possible completions that determines when the useris asked whether the list of possibilities should be displayed. If thenumber of possible completions is greater than this value, Readlinewill ask the user whether or not he wishes to view them; otherwise,they are simply listed. This variable must be set to an integer valuegreater than or equal to 0. A negative value means Readline shouldnever ask. The default limit is 100.
convert-meta
If set to ‘on’, Readline will convert characters with the eighth bit setto an ascii key sequence by stripping the eighth bit and prefixing anESC character, converting them to a meta-prefixed key sequence.The default value is ‘on’.
disable-completion
If set to ‘On’, Readline will inhibit word completion. Completioncharacters will be inserted into the line as if they had been mappedto self-insert. The default is ‘off’.
428 Debugging with gdb
editing-mode
The editing-mode variable controls which default set of key bind-ings is used. By default, Readline starts up in Emacs editing mode,where the keystrokes are most similar to Emacs. This variable canbe set to either ‘emacs’ or ‘vi’.
echo-control-characters
When set to ‘on’, on operating systems that indicate they supportit, readline echoes a character corresponding to a signal generatedfrom the keyboard. The default is ‘on’.
enable-keypad
When set to ‘on’, Readline will try to enable the application keypadwhen it is called. Some systems need this to enable the arrow keys.The default is ‘off’.
enable-meta-key
When set to ‘on’, Readline will try to enable any meta modifierkey the terminal claims to support when it is called. On manyterminals, the meta key is used to send eight-bit characters. Thedefault is ‘on’.
expand-tilde
If set to ‘on’, tilde expansion is performed when Readline attemptsword completion. The default is ‘off’.
history-preserve-point
If set to ‘on’, the history code attempts to place the point (thecurrent cursor position) at the same location on each history lineretrieved with previous-history or next-history. The defaultis ‘off’.
history-size
Set the maximum number of history entries saved in the historylist. If set to zero, the number of entries in the history list is notlimited.
horizontal-scroll-mode
This variable can be set to either ‘on’ or ‘off’. Setting it to ‘on’means that the text of the lines being edited will scroll horizontallyon a single screen line when they are longer than the width of thescreen, instead of wrapping onto a new screen line. By default, thisvariable is set to ‘off’.
input-meta
If set to ‘on’, Readline will enable eight-bit input (it will not clearthe eighth bit in the characters it reads), regardless of what theterminal claims it can support. The default value is ‘off’. Thename meta-flag is a synonym for this variable.
isearch-terminators
The string of characters that should terminate an incrementalsearch without subsequently executing the character as a command
Chapter 31: Command Line Editing 429
(see Section 31.2.5 [Searching], page 425). If this variable has notbeen given a value, the characters ESC and C-J will terminate anincremental search.
keymap Sets Readline’s idea of the current keymap for key binding com-mands. Acceptable keymap names are emacs, emacs-standard,emacs-meta, emacs-ctlx, vi, vi-move, vi-command, andvi-insert. vi is equivalent to vi-command; emacs is equivalentto emacs-standard. The default value is emacs. The value of theediting-mode variable also affects the default keymap.
mark-directories
If set to ‘on’, completed directory names have a slash appended.The default is ‘on’.
mark-modified-lines
This variable, when set to ‘on’, causes Readline to display an as-terisk (‘*’) at the start of history lines which have been modified.This variable is ‘off’ by default.
mark-symlinked-directories
If set to ‘on’, completed names which are symbolic links to di-rectories have a slash appended (subject to the value of mark-
directories). The default is ‘off’.
match-hidden-files
This variable, when set to ‘on’, causes Readline to match files whosenames begin with a ‘.’ (hidden files) when performing filenamecompletion. If set to ‘off’, the leading ‘.’ must be supplied bythe user in the filename to be completed. This variable is ‘on’ bydefault.
menu-complete-display-prefix
If set to ‘on’, menu completion displays the common prefix of thelist of possible completions (which may be empty) before cyclingthrough the list. The default is ‘off’.
output-meta
If set to ‘on’, Readline will display characters with the eighth bitset directly rather than as a meta-prefixed escape sequence. Thedefault is ‘off’.
page-completions
If set to ‘on’, Readline uses an internal more-like pager to displaya screenful of possible completions at a time. This variable is ‘on’by default.
print-completions-horizontally
If set to ‘on’, Readline will display completions with matches sortedhorizontally in alphabetical order, rather than down the screen.The default is ‘off’.
430 Debugging with gdb
revert-all-at-newline
If set to ‘on’, Readline will undo all changes to history lines beforereturning when accept-line is executed. By default, history linesmay be modified and retain individual undo lists across calls toreadline. The default is ‘off’.
show-all-if-ambiguous
This alters the default behavior of the completion functions. If setto ‘on’, words which have more than one possible completion causethe matches to be listed immediately instead of ringing the bell.The default value is ‘off’.
show-all-if-unmodified
This alters the default behavior of the completion functions in afashion similar to show-all-if-ambiguous. If set to ‘on’, words whichhave more than one possible completion without any possible par-tial completion (the possible completions don’t share a commonprefix) cause the matches to be listed immediately instead of ring-ing the bell. The default value is ‘off’.
skip-completed-text
If set to ‘on’, this alters the default completion behavior when in-serting a single match into the line. It’s only active when perform-ing completion in the middle of a word. If enabled, readline doesnot insert characters from the completion that match charactersafter point in the word being completed, so portions of the wordfollowing the cursor are not duplicated. For instance, if this is en-abled, attempting completion when the cursor is after the ‘e’ in‘Makefile’ will result in ‘Makefile’ rather than ‘Makefilefile’,assuming there is a single possible completion. The default valueis ‘off’.
visible-stats
If set to ‘on’, a character denoting a file’s type is appended to thefilename when listing possible completions. The default is ‘off’.
Key BindingsThe syntax for controlling key bindings in the init file is simple. First youneed to find the name of the command that you want to change. The followingsections contain tables of the command name, the default keybinding, if any,and a short description of what the command does.
Once you know the name of the command, simply place on a line in the initfile the name of the key you wish to bind the command to, a colon, and thenthe name of the command. There can be no space between the key name andthe colon – that will be interpreted as part of the key name. The name ofthe key can be expressed in different ways, depending on what you find mostcomfortable.
In addition to command names, readline allows keys to be bound to a stringthat is inserted when the key is pressed (a macro).
Chapter 31: Command Line Editing 431
keyname: function-name or macrokeyname is the name of a key spelled out in English. For example:
Control-u: universal-argument
Meta-Rubout: backward-kill-word
Control-o: "> output"
In the above example, C-u is bound to the function universal-
argument, M-DEL is bound to the function backward-kill-word,and C-o is bound to run the macro expressed on the right handside (that is, to insert the text ‘> output’ into the line).
A number of symbolic character names are recognized while pro-cessing this key binding syntax: DEL, ESC, ESCAPE, LFD, NEW-LINE, RET, RETURN, RUBOUT, SPACE, SPC, and TAB.
"keyseq": function-name or macrokeyseq differs from keyname above in that strings denoting an en-tire key sequence can be specified, by placing the key sequence indouble quotes. Some gnu Emacs style key escapes can be used, asin the following example, but the special character names are notrecognized.
"\C-u": universal-argument
"\C-x\C-r": re-read-init-file
"\e[11~": "Function Key 1"
In the above example, C-u is again bound to the functionuniversal-argument (just as it was in the first example), ‘C-xC-r’ is bound to the function re-read-init-file, and ‘ESC [ 1 1
~’ is bound to insert the text ‘Function Key 1’.
The following gnu Emacs style escape sequences are available when specifyingkey sequences:
\C- control prefix
\M- meta prefix
\e an escape character
\\ backslash
\" ", a double quotation mark
\’ ’, a single quote or apostrophe
In addition to the gnu Emacs style escape sequences, a second set of backslashescapes is available:
\a alert (bell)
\b backspace
\d delete
\f form feed
\n newline
432 Debugging with gdb
\r carriage return
\t horizontal tab
\v vertical tab
\nnn the eight-bit character whose value is the octal value nnn (one tothree digits)
\xHH the eight-bit character whose value is the hexadecimal value HH(one or two hex digits)
When entering the text of a macro, single or double quotes must be used toindicate a macro definition. Unquoted text is assumed to be a function name. Inthe macro body, the backslash escapes described above are expanded. Backslashwill quote any other character in the macro text, including ‘"’ and ‘’’. Forexample, the following binding will make ‘C-x \’ insert a single ‘\’ into the line:
"\C-x\\": "\\"
31.3.2 Conditional Init Constructs
Readline implements a facility similar in spirit to the conditional compilation features ofthe C preprocessor which allows key bindings and variable settings to be performed as theresult of tests. There are four parser directives used.
$if The $if construct allows bindings to be made based on the editing mode, theterminal being used, or the application using Readline. The text of the testextends to the end of the line; no characters are required to isolate it.
mode The mode= form of the $if directive is used to test whether Readlineis in emacs or vi mode. This may be used in conjunction with the‘set keymap’ command, for instance, to set bindings in the emacs-standard and emacs-ctlx keymaps only if Readline is starting outin emacs mode.
term The term= form may be used to include terminal-specific key bind-ings, perhaps to bind the key sequences output by the terminal’sfunction keys. The word on the right side of the ‘=’ is tested againstboth the full name of the terminal and the portion of the terminalname before the first ‘-’. This allows sun to match both sun andsun-cmd, for instance.
application
The application construct is used to include application-specific set-tings. Each program using the Readline library sets the applicationname, and you can test for a particular value. This could be used tobind key sequences to functions useful for a specific program. Forinstance, the following command adds a key sequence that quotesthe current or previous word in Bash:
$if Bash
# Quote the current or previous word
"\C-xq": "\eb\"\ef\""
$endif
Chapter 31: Command Line Editing 433
$endif This command, as seen in the previous example, terminates an $if command.
$else Commands in this branch of the $if directive are executed if the test fails.
$include This directive takes a single filename as an argument and reads commandsand bindings from that file. For example, the following directive reads from‘/etc/inputrc’:
$include /etc/inputrc
31.3.3 Sample Init File
Here is an example of an inputrc file. This illustrates key binding, variable assignment, andconditional syntax.
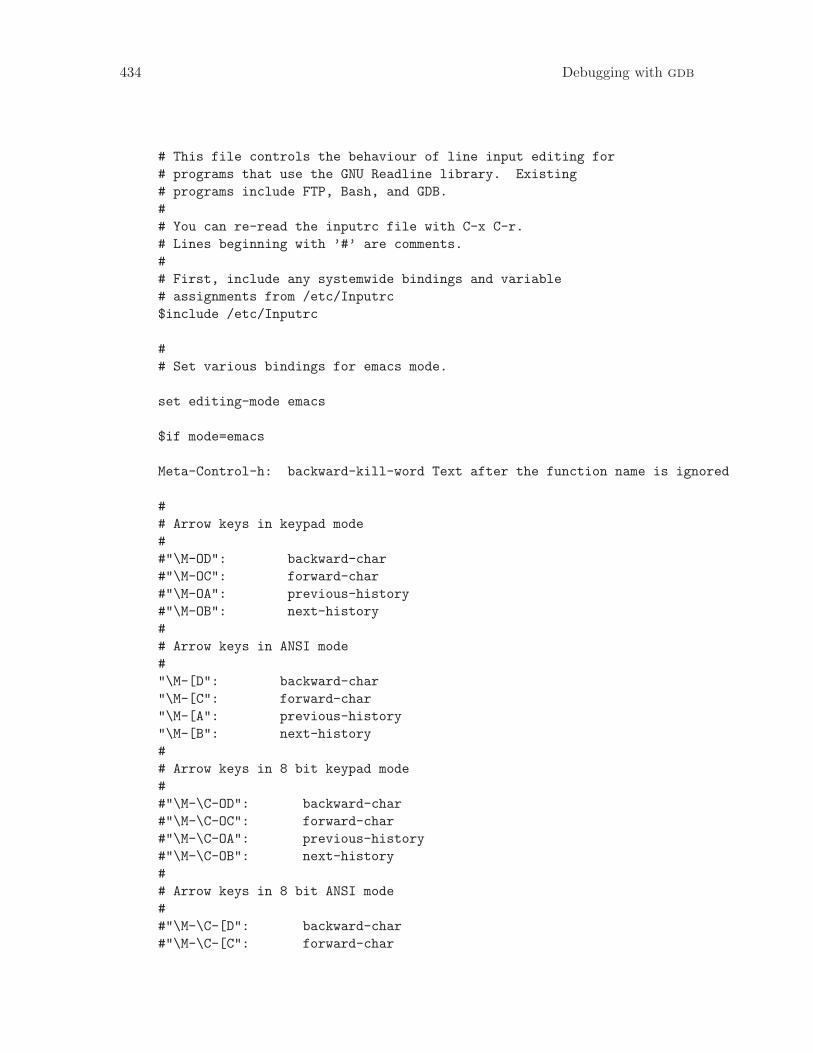
434 Debugging with gdb
# This file controls the behaviour of line input editing for
# programs that use the GNU Readline library. Existing
# programs include FTP, Bash, and GDB.
#
# You can re-read the inputrc file with C-x C-r.
# Lines beginning with ’#’ are comments.
#
# First, include any systemwide bindings and variable
# assignments from /etc/Inputrc
$include /etc/Inputrc
#
# Set various bindings for emacs mode.
set editing-mode emacs
$if mode=emacs
Meta-Control-h: backward-kill-word Text after the function name is ignored
#
# Arrow keys in keypad mode
#
#"\M-OD": backward-char
#"\M-OC": forward-char
#"\M-OA": previous-history
#"\M-OB": next-history
#
# Arrow keys in ANSI mode
#
"\M-[D": backward-char
"\M-[C": forward-char
"\M-[A": previous-history
"\M-[B": next-history
#
# Arrow keys in 8 bit keypad mode
#
#"\M-\C-OD": backward-char
#"\M-\C-OC": forward-char
#"\M-\C-OA": previous-history
#"\M-\C-OB": next-history
#
# Arrow keys in 8 bit ANSI mode
#
#"\M-\C-[D": backward-char
#"\M-\C-[C": forward-char
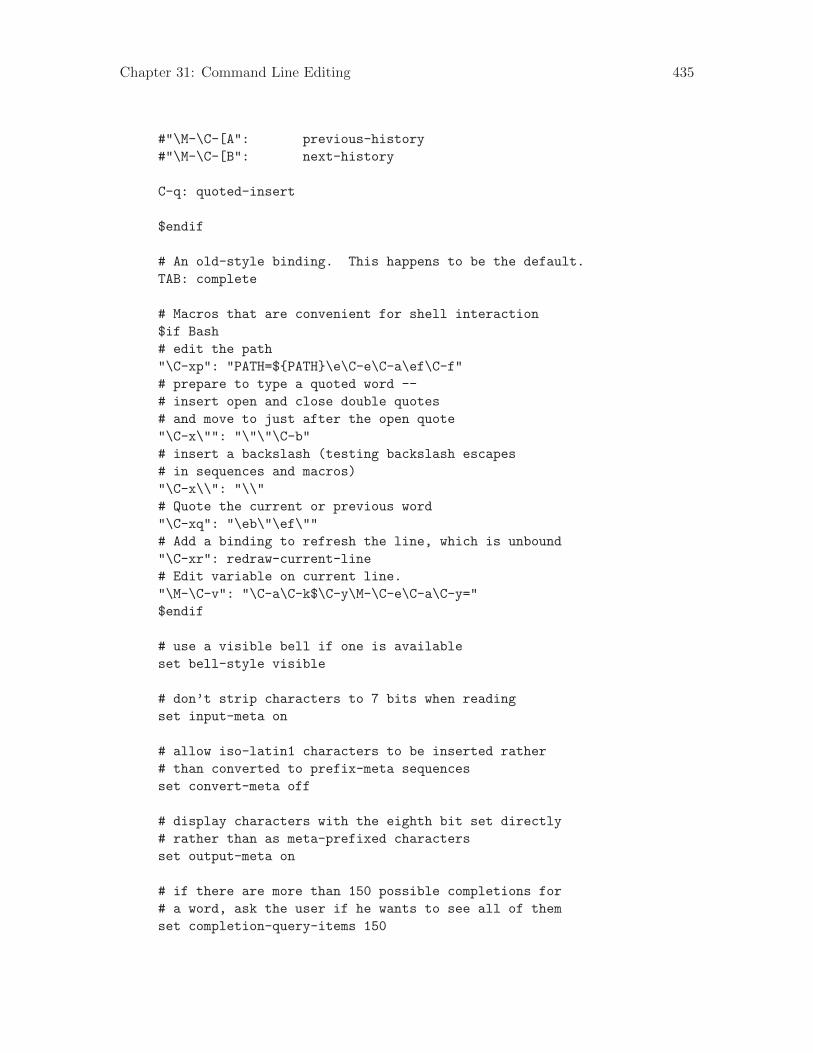
Chapter 31: Command Line Editing 435
#"\M-\C-[A": previous-history
#"\M-\C-[B": next-history
C-q: quoted-insert
$endif
# An old-style binding. This happens to be the default.
TAB: complete
# Macros that are convenient for shell interaction
$if Bash
# edit the path
"\C-xp": "PATH=${PATH}\e\C-e\C-a\ef\C-f"
# prepare to type a quoted word --
# insert open and close double quotes
# and move to just after the open quote
"\C-x\"": "\"\"\C-b"
# insert a backslash (testing backslash escapes
# in sequences and macros)
"\C-x\\": "\\"
# Quote the current or previous word
"\C-xq": "\eb\"\ef\""
# Add a binding to refresh the line, which is unbound
"\C-xr": redraw-current-line
# Edit variable on current line.
"\M-\C-v": "\C-a\C-k$\C-y\M-\C-e\C-a\C-y="
$endif
# use a visible bell if one is available
set bell-style visible
# don’t strip characters to 7 bits when reading
set input-meta on
# allow iso-latin1 characters to be inserted rather
# than converted to prefix-meta sequences
set convert-meta off
# display characters with the eighth bit set directly
# rather than as meta-prefixed characters
set output-meta on
# if there are more than 150 possible completions for
# a word, ask the user if he wants to see all of them
set completion-query-items 150
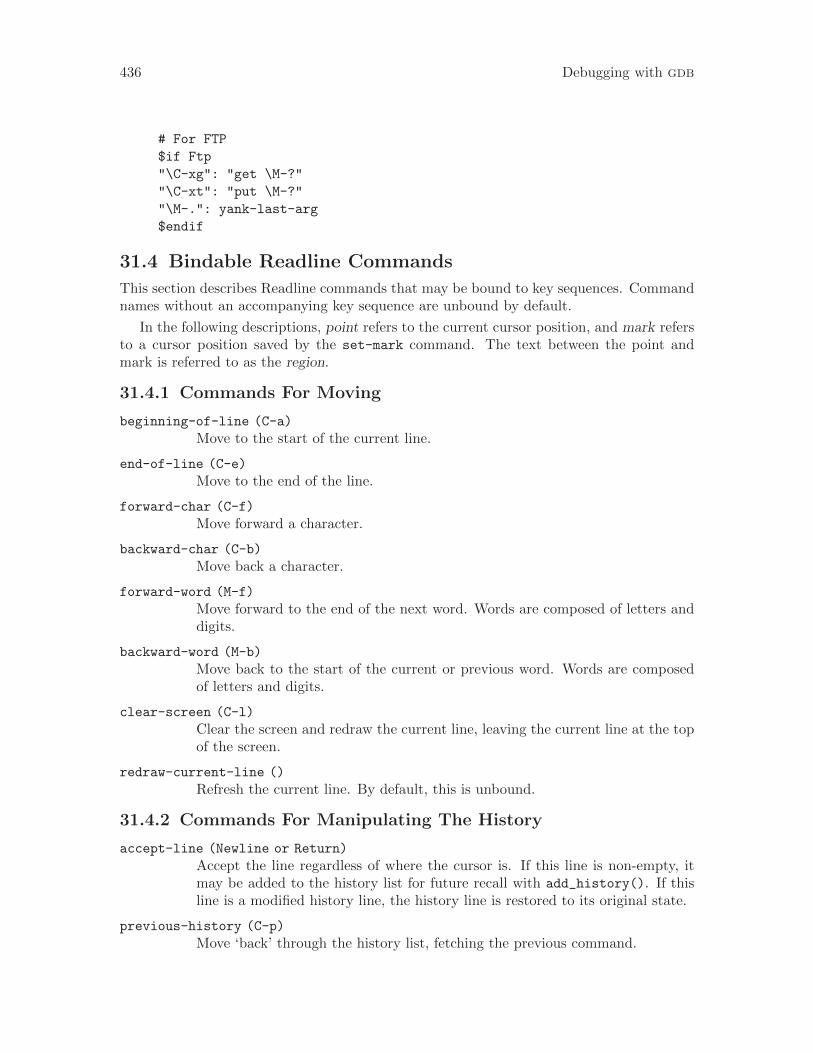
436 Debugging with gdb
# For FTP
$if Ftp
"\C-xg": "get \M-?"
"\C-xt": "put \M-?"
"\M-.": yank-last-arg
$endif
31.4 Bindable Readline Commands
This section describes Readline commands that may be bound to key sequences. Commandnames without an accompanying key sequence are unbound by default.
In the following descriptions, point refers to the current cursor position, and mark refersto a cursor position saved by the set-mark command. The text between the point andmark is referred to as the region.
31.4.1 Commands For Moving
beginning-of-line (C-a)
Move to the start of the current line.
end-of-line (C-e)
Move to the end of the line.
forward-char (C-f)
Move forward a character.
backward-char (C-b)
Move back a character.
forward-word (M-f)
Move forward to the end of the next word. Words are composed of letters anddigits.
backward-word (M-b)
Move back to the start of the current or previous word. Words are composedof letters and digits.
clear-screen (C-l)
Clear the screen and redraw the current line, leaving the current line at the topof the screen.
redraw-current-line ()
Refresh the current line. By default, this is unbound.
31.4.2 Commands For Manipulating The History
accept-line (Newline or Return)
Accept the line regardless of where the cursor is. If this line is non-empty, itmay be added to the history list for future recall with add_history(). If thisline is a modified history line, the history line is restored to its original state.
previous-history (C-p)
Move ‘back’ through the history list, fetching the previous command.
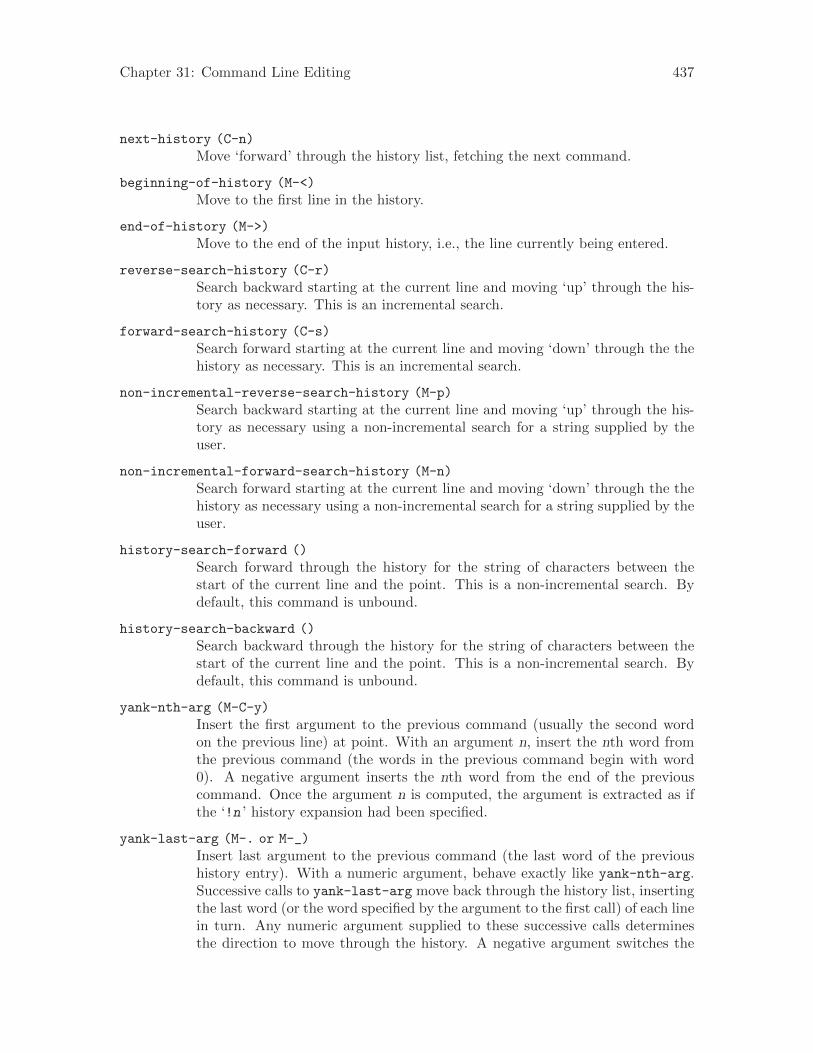
Chapter 31: Command Line Editing 437
next-history (C-n)
Move ‘forward’ through the history list, fetching the next command.
beginning-of-history (M-<)
Move to the first line in the history.
end-of-history (M->)
Move to the end of the input history, i.e., the line currently being entered.
reverse-search-history (C-r)
Search backward starting at the current line and moving ‘up’ through the his-tory as necessary. This is an incremental search.
forward-search-history (C-s)
Search forward starting at the current line and moving ‘down’ through the thehistory as necessary. This is an incremental search.
non-incremental-reverse-search-history (M-p)
Search backward starting at the current line and moving ‘up’ through the his-tory as necessary using a non-incremental search for a string supplied by theuser.
non-incremental-forward-search-history (M-n)
Search forward starting at the current line and moving ‘down’ through the thehistory as necessary using a non-incremental search for a string supplied by theuser.
history-search-forward ()
Search forward through the history for the string of characters between thestart of the current line and the point. This is a non-incremental search. Bydefault, this command is unbound.
history-search-backward ()
Search backward through the history for the string of characters between thestart of the current line and the point. This is a non-incremental search. Bydefault, this command is unbound.
yank-nth-arg (M-C-y)
Insert the first argument to the previous command (usually the second wordon the previous line) at point. With an argument n, insert the nth word fromthe previous command (the words in the previous command begin with word0). A negative argument inserts the nth word from the end of the previouscommand. Once the argument n is computed, the argument is extracted as ifthe ‘!n ’ history expansion had been specified.
yank-last-arg (M-. or M-_)
Insert last argument to the previous command (the last word of the previoushistory entry). With a numeric argument, behave exactly like yank-nth-arg.Successive calls to yank-last-arg move back through the history list, insertingthe last word (or the word specified by the argument to the first call) of each linein turn. Any numeric argument supplied to these successive calls determinesthe direction to move through the history. A negative argument switches the
438 Debugging with gdb
direction through the history (back or forward). The history expansion facilitiesare used to extract the last argument, as if the ‘!$’ history expansion had beenspecified.
31.4.3 Commands For Changing Text
delete-char (C-d)
Delete the character at point. If point is at the beginning of the line, thereare no characters in the line, and the last character typed was not bound todelete-char, then return eof.
backward-delete-char (Rubout)
Delete the character behind the cursor. A numeric argument means to kill thecharacters instead of deleting them.
forward-backward-delete-char ()
Delete the character under the cursor, unless the cursor is at the end of theline, in which case the character behind the cursor is deleted. By default, thisis not bound to a key.
quoted-insert (C-q or C-v)
Add the next character typed to the line verbatim. This is how to insert keysequences like C-q, for example.
tab-insert (M-TAB)
Insert a tab character.
self-insert (a, b, A, 1, !, ...)
Insert yourself.
transpose-chars (C-t)
Drag the character before the cursor forward over the character at the cursor,moving the cursor forward as well. If the insertion point is at the end of theline, then this transposes the last two characters of the line. Negative argumentshave no effect.
transpose-words (M-t)
Drag the word before point past the word after point, moving point past thatword as well. If the insertion point is at the end of the line, this transposes thelast two words on the line.
upcase-word (M-u)
Uppercase the current (or following) word. With a negative argument, upper-case the previous word, but do not move the cursor.
downcase-word (M-l)
Lowercase the current (or following) word. With a negative argument, lowercasethe previous word, but do not move the cursor.
capitalize-word (M-c)
Capitalize the current (or following) word. With a negative argument, capitalizethe previous word, but do not move the cursor.
Chapter 31: Command Line Editing 439
overwrite-mode ()
Toggle overwrite mode. With an explicit positive numeric argument, switchesto overwrite mode. With an explicit non-positive numeric argument, switches toinsert mode. This command affects only emacs mode; vi mode does overwritedifferently. Each call to readline() starts in insert mode.
In overwrite mode, characters bound to self-insert replace the text at pointrather than pushing the text to the right. Characters bound to backward-
delete-char replace the character before point with a space.
By default, this command is unbound.
31.4.4 Killing And Yanking
kill-line (C-k)
Kill the text from point to the end of the line.
backward-kill-line (C-x Rubout)
Kill backward to the beginning of the line.
unix-line-discard (C-u)
Kill backward from the cursor to the beginning of the current line.
kill-whole-line ()
Kill all characters on the current line, no matter where point is. By default,this is unbound.
kill-word (M-d)
Kill from point to the end of the current word, or if between words, to the endof the next word. Word boundaries are the same as forward-word.
backward-kill-word (M-DEL)
Kill the word behind point. Word boundaries are the same as backward-word.
unix-word-rubout (C-w)
Kill the word behind point, using white space as a word boundary. The killedtext is saved on the kill-ring.
unix-filename-rubout ()
Kill the word behind point, using white space and the slash character as theword boundaries. The killed text is saved on the kill-ring.
delete-horizontal-space ()
Delete all spaces and tabs around point. By default, this is unbound.
kill-region ()
Kill the text in the current region. By default, this command is unbound.
copy-region-as-kill ()
Copy the text in the region to the kill buffer, so it can be yanked right away.By default, this command is unbound.
copy-backward-word ()
Copy the word before point to the kill buffer. The word boundaries are thesame as backward-word. By default, this command is unbound.
440 Debugging with gdb
copy-forward-word ()
Copy the word following point to the kill buffer. The word boundaries are thesame as forward-word. By default, this command is unbound.
yank (C-y)
Yank the top of the kill ring into the buffer at point.
yank-pop (M-y)
Rotate the kill-ring, and yank the new top. You can only do this if the priorcommand is yank or yank-pop.
31.4.5 Specifying Numeric Arguments
digit-argument (M-0, M-1, ... M--)
Add this digit to the argument already accumulating, or start a new argument.M-- starts a negative argument.
universal-argument ()
This is another way to specify an argument. If this command is followed by oneor more digits, optionally with a leading minus sign, those digits define the ar-gument. If the command is followed by digits, executing universal-argument
again ends the numeric argument, but is otherwise ignored. As a special case,if this command is immediately followed by a character that is neither a digitor minus sign, the argument count for the next command is multiplied by four.The argument count is initially one, so executing this function the first timemakes the argument count four, a second time makes the argument count six-teen, and so on. By default, this is not bound to a key.
31.4.6 Letting Readline Type For You
complete (TAB)
Attempt to perform completion on the text before point. The actual completionperformed is application-specific. The default is filename completion.
possible-completions (M-?)
List the possible completions of the text before point. When displaying com-pletions, Readline sets the number of columns used for display to the value ofcompletion-display-width, the value of the environment variable COLUMNS,or the screen width, in that order.
insert-completions (M-*)
Insert all completions of the text before point that would have been generatedby possible-completions.
menu-complete ()
Similar to complete, but replaces the word to be completed with a single matchfrom the list of possible completions. Repeated execution of menu-completesteps through the list of possible completions, inserting each match in turn.At the end of the list of completions, the bell is rung (subject to the settingof bell-style) and the original text is restored. An argument of n moves npositions forward in the list of matches; a negative argument may be used to
Chapter 31: Command Line Editing 441
move backward through the list. This command is intended to be bound toTAB, but is unbound by default.
menu-complete-backward ()
Identical to menu-complete, but moves backward through the list of possiblecompletions, as if menu-complete had been given a negative argument.
delete-char-or-list ()
Deletes the character under the cursor if not at the beginning or end of the line(like delete-char). If at the end of the line, behaves identically to possible-
completions. This command is unbound by default.
31.4.7 Keyboard Macros
start-kbd-macro (C-x ()
Begin saving the characters typed into the current keyboard macro.
end-kbd-macro (C-x ))
Stop saving the characters typed into the current keyboard macro and save thedefinition.
call-last-kbd-macro (C-x e)
Re-execute the last keyboard macro defined, by making the characters in themacro appear as if typed at the keyboard.
31.4.8 Some Miscellaneous Commands
re-read-init-file (C-x C-r)
Read in the contents of the inputrc file, and incorporate any bindings or variableassignments found there.
abort (C-g)
Abort the current editing command and ring the terminal’s bell (subject to thesetting of bell-style).
do-uppercase-version (M-a, M-b, M-x, ...)
If the metafied character x is lowercase, run the command that is bound to thecorresponding uppercase character.
prefix-meta (ESC)
Metafy the next character typed. This is for keyboards without a meta key.Typing ‘ESC f’ is equivalent to typing M-f.
undo (C-_ or C-x C-u)
Incremental undo, separately remembered for each line.
revert-line (M-r)
Undo all changes made to this line. This is like executing the undo commandenough times to get back to the beginning.
tilde-expand (M-~)
Perform tilde expansion on the current word.
set-mark (C-@)
Set the mark to the point. If a numeric argument is supplied, the mark is setto that position.
442 Debugging with gdb
exchange-point-and-mark (C-x C-x)
Swap the point with the mark. The current cursor position is set to the savedposition, and the old cursor position is saved as the mark.
character-search (C-])
A character is read and point is moved to the next occurrence of that character.A negative count searches for previous occurrences.
character-search-backward (M-C-])
A character is read and point is moved to the previous occurrence of thatcharacter. A negative count searches for subsequent occurrences.
skip-csi-sequence ()
Read enough characters to consume a multi-key sequence such as those definedfor keys like Home and End. Such sequences begin with a Control SequenceIndicator (CSI), usually ESC-[. If this sequence is bound to "\e[", keys pro-ducing such sequences will have no effect unless explicitly bound to a readlinecommand, instead of inserting stray characters into the editing buffer. This isunbound by default, but usually bound to ESC-[.
insert-comment (M-#)
Without a numeric argument, the value of the comment-begin variable is in-serted at the beginning of the current line. If a numeric argument is supplied,this command acts as a toggle: if the characters at the beginning of the linedo not match the value of comment-begin, the value is inserted, otherwise thecharacters in comment-begin are deleted from the beginning of the line. Ineither case, the line is accepted as if a newline had been typed.
dump-functions ()
Print all of the functions and their key bindings to the Readline output stream.If a numeric argument is supplied, the output is formatted in such a way thatit can be made part of an inputrc file. This command is unbound by default.
dump-variables ()
Print all of the settable variables and their values to the Readline output stream.If a numeric argument is supplied, the output is formatted in such a way thatit can be made part of an inputrc file. This command is unbound by default.
dump-macros ()
Print all of the Readline key sequences bound to macros and the strings theyoutput. If a numeric argument is supplied, the output is formatted in such away that it can be made part of an inputrc file. This command is unbound bydefault.
emacs-editing-mode (C-e)
When in vi command mode, this causes a switch to emacs editing mode.
vi-editing-mode (M-C-j)
When in emacs editing mode, this causes a switch to vi editing mode.
Chapter 31: Command Line Editing 443
31.5 Readline vi Mode
While the Readline library does not have a full set of vi editing functions, it does containenough to allow simple editing of the line. The Readline vi mode behaves as specified inthe posix standard.
In order to switch interactively between emacs and vi editing modes, use the commandM-C-j (bound to emacs-editing-mode when in vi mode and to vi-editing-mode in emacs
mode). The Readline default is emacs mode.
When you enter a line in vi mode, you are already placed in ‘insertion’ mode, as if youhad typed an ‘i’. Pressing ESC switches you into ‘command’ mode, where you can edit thetext of the line with the standard vi movement keys, move to previous history lines with‘k’ and subsequent lines with ‘j’, and so forth.

Chapter 32: Using History Interactively 445
32 Using History Interactively
This chapter describes how to use the gnu History Library interactively, from a user’sstandpoint. It should be considered a user’s guide. For information on using the gnuHistory Library in your own programs, see Section “Programming with GNU History” inGNU History Library .
32.1 History Expansion
The History library provides a history expansion feature that is similar to the historyexpansion provided by csh. This section describes the syntax used to manipulate thehistory information.
History expansions introduce words from the history list into the input stream, makingit easy to repeat commands, insert the arguments to a previous command into the currentinput line, or fix errors in previous commands quickly.
History expansion takes place in two parts. The first is to determine which line fromthe history list should be used during substitution. The second is to select portions ofthat line for inclusion into the current one. The line selected from the history is called theevent, and the portions of that line that are acted upon are called words. Various modifiersare available to manipulate the selected words. The line is broken into words in the samefashion that Bash does, so that several words surrounded by quotes are considered one word.History expansions are introduced by the appearance of the history expansion character,which is ‘!’ by default.
32.1.1 Event Designators
An event designator is a reference to a command line entry in the history list. Unless thereference is absolute, events are relative to the current position in the history list.
! Start a history substitution, except when followed by a space, tab, the end ofthe line, or ‘=’.
!n Refer to command line n.
!-n Refer to the command n lines back.
!! Refer to the previous command. This is a synonym for ‘!-1’.
!string Refer to the most recent command preceding the current position in the historylist starting with string.
!?string[?]
Refer to the most recent command preceding the current position in the historylist containing string. The trailing ‘?’ may be omitted if the string is followedimmediately by a newline.
^string1^string2^
Quick Substitution. Repeat the last command, replacing string1 with string2.Equivalent to !!:s/string1/string2/.
!# The entire command line typed so far.
446 Debugging with gdb
32.1.2 Word Designators
Word designators are used to select desired words from the event. A ‘:’ separates the eventspecification from the word designator. It may be omitted if the word designator beginswith a ‘^’, ‘$’, ‘*’, ‘-’, or ‘%’. Words are numbered from the beginning of the line, with thefirst word being denoted by 0 (zero). Words are inserted into the current line separated bysingle spaces.
For example,
!! designates the preceding command. When you type this, the preceding com-mand is repeated in toto.
!!:$ designates the last argument of the preceding command. This may be shortenedto !$.
!fi:2 designates the second argument of the most recent command starting with theletters fi.
Here are the word designators:
0 (zero) The 0th word. For many applications, this is the command word.
n The nth word.
^ The first argument; that is, word 1.
$ The last argument.
% The word matched by the most recent ‘?string?’ search.
x-y A range of words; ‘-y ’ abbreviates ‘0-y ’.
* All of the words, except the 0th. This is a synonym for ‘1-$’. It is not an errorto use ‘*’ if there is just one word in the event; the empty string is returned inthat case.
x* Abbreviates ‘x-$’
x- Abbreviates ‘x-$’ like ‘x*’, but omits the last word.
If a word designator is supplied without an event specification, the previous commandis used as the event.
32.1.3 Modifiers
After the optional word designator, you can add a sequence of one or more of the followingmodifiers, each preceded by a ‘:’.
h Remove a trailing pathname component, leaving only the head.
t Remove all leading pathname components, leaving the tail.
r Remove a trailing suffix of the form ‘.suffix ’, leaving the basename.
e Remove all but the trailing suffix.
p Print the new command but do not execute it.
Chapter 32: Using History Interactively 447
s/old/new/
Substitute new for the first occurrence of old in the event line. Any delimitermay be used in place of ‘/’. The delimiter may be quoted in old and new with asingle backslash. If ‘&’ appears in new, it is replaced by old. A single backslashwill quote the ‘&’. The final delimiter is optional if it is the last character onthe input line.
& Repeat the previous substitution.
g
a Cause changes to be applied over the entire event line. Used in conjunctionwith ‘s’, as in gs/old/new/, or with ‘&’.
G Apply the following ‘s’ modifier once to each word in the event.

Appendix A: In Memoriam 449
Appendix A In Memoriam
The gdb project mourns the loss of the following long-time contributors:
Fred Fish Fred was a long-standing contributor to gdb (1991-2006), and to Free Softwarein general. Outside of gdb, he was known in the Amiga world for his series ofFish Disks, and the GeekGadget project.
Michael Snyder
Michael was one of the Global Maintainers of the gdb project, with contri-butions recorded as early as 1996, until 2011. In addition to his day to dayparticipation, he was a large driving force behind adding Reverse Debugging togdb.
Beyond their technical contributions to the project, they were also enjoyable membersof the Free Software Community. We will miss them.

Appendix B: Formatting Documentation 451
Appendix B Formatting Documentation
The gdb 4 release includes an already-formatted reference card, ready for printing withPostScript or Ghostscript, in the ‘gdb’ subdirectory of the main source directory1. If youcan use PostScript or Ghostscript with your printer, you can print the reference card im-mediately with ‘refcard.ps’.
The release also includes the source for the reference card. You can format it, usingTEX, by typing:
make refcard.dvi
The gdb reference card is designed to print in landscape mode on US “letter” size paper;that is, on a sheet 11 inches wide by 8.5 inches high. You will need to specify this form ofprinting as an option to your dvi output program.
All the documentation for gdb comes as part of the machine-readable distribution. Thedocumentation is written in Texinfo format, which is a documentation system that uses asingle source file to produce both on-line information and a printed manual. You can useone of the Info formatting commands to create the on-line version of the documentationand TEX (or texi2roff) to typeset the printed version.
gdb includes an already formatted copy of the on-line Info version of this manual in the‘gdb’ subdirectory. The main Info file is ‘gdb-7.4-debian/gdb/gdb.info’, and it refers tosubordinate files matching ‘gdb.info*’ in the same directory. If necessary, you can printout these files, or read them with any editor; but they are easier to read using the info
subsystem in gnu Emacs or the standalone info program, available as part of the gnuTexinfo distribution.
If you want to format these Info files yourself, you need one of the Info formattingprograms, such as texinfo-format-buffer or makeinfo.
If you have makeinfo installed, and are in the top level gdb source directory(‘gdb-7.4-debian’, in the case of version 7.4-debian), you can make the Info file by typing:
cd gdb
make gdb.info
If you want to typeset and print copies of this manual, you need TEX, a program to printits dvi output files, and ‘texinfo.tex’, the Texinfo definitions file.
TEX is a typesetting program; it does not print files directly, but produces output filescalled dvi files. To print a typeset document, you need a program to print dvi files. If yoursystem has TEX installed, chances are it has such a program. The precise command to usedepends on your system; lpr -d is common; another (for PostScript devices) is dvips. Thedvi print command may require a file name without any extension or a ‘.dvi’ extension.
TEX also requires a macro definitions file called ‘texinfo.tex’. This file tells TEX howto typeset a document written in Texinfo format. On its own, TEX cannot either reador typeset a Texinfo file. ‘texinfo.tex’ is distributed with GDB and is located in the‘gdb-version-number/texinfo’ directory.
If you have TEX and a dvi printer program installed, you can typeset and print thismanual. First switch to the ‘gdb’ subdirectory of the main source directory (for example,to ‘gdb-7.4-debian/gdb’) and type:
1 In ‘gdb-7.4-debian/gdb/refcard.ps’ of the version 7.4-debian release.

452 Debugging with gdb
make gdb.dvi
Then give ‘gdb.dvi’ to your dvi printing program.
Appendix C: Installing gdb 453
Appendix C Installing gdb
C.1 Requirements for Building gdb
Building gdb requires various tools and packages to be available. Other packages will beused only if they are found.
Tools/Packages Necessary for Building gdb
ISO C90 compilergdb is written in ISO C90. It should be buildable with any working C90compiler, e.g. GCC.
Tools/Packages Optional for Building gdb
Expat gdb can use the Expat XML parsing library. This library may be included withyour operating system distribution; if it is not, you can get the latest versionfrom http://expat.sourceforge.net. The ‘configure’ script will search forthis library in several standard locations; if it is installed in an unusual path,you can use the ‘--with-libexpat-prefix’ option to specify its location.
Expat is used for:
• Remote protocol memory maps (see Section E.16 [Memory Map Format],page 521)
• Target descriptions (see Appendix G [Target Descriptions], page 537)
• Remote shared library lists (See Section E.14 [Library List Format],page 520, or alternatively see Section E.15 [Library List Format for SVR4Targets], page 521)
• MS-Windows shared libraries (see [Shared Libraries], page 205)
• Traceframe info (see Section E.18 [Traceframe Info Format], page 523)
zlib gdb will use the ‘zlib’ library, if available, to read compressed debug sections.Some linkers, such as GNU gold, are capable of producing binaries with com-pressed debug sections. If gdb is compiled with ‘zlib’, it will be able to readthe debug information in such binaries.
The ‘zlib’ library is likely included with your operating system distribution; ifit is not, you can get the latest version from http://zlib.net.
iconv gdb’s features related to character sets (see Section 10.19 [Character Sets],page 125) require a functioning iconv implementation. If you are on a GNUsystem, then this is provided by the GNU C Library. Some other systems alsoprovide a working iconv.
If gdb is using the iconv program which is installed in a non-standard place,you will need to tell gdb where to find it. This is done with ‘--with-iconv-bin’which specifies the directory that contains the iconv program.
On systems without iconv, you can install GNU Libiconv. If you have previ-ously installed Libiconv, you can use the ‘--with-libiconv-prefix’ option toconfigure.
454 Debugging with gdb
gdb’s top-level ‘configure’ and ‘Makefile’ will arrange to build Libiconv ifa directory named ‘libiconv’ appears in the top-most source directory. IfLibiconv is built this way, and if the operating system does not provide a suitableiconv implementation, then the just-built library will automatically be used bygdb. One easy way to set this up is to download GNU Libiconv, unpack it,and then rename the directory holding the Libiconv source code to ‘libiconv’.
C.2 Invoking the gdb ‘configure’ Script
gdb comes with a ‘configure’ script that automates the process of preparing gdb forinstallation; you can then use make to build the gdb program.1
The gdb distribution includes all the source code you need for gdb in a single directory,whose name is usually composed by appending the version number to ‘gdb’.
For example, the gdb version 7.4-debian distribution is in the ‘gdb-7.4-debian’ direc-tory. That directory contains:
gdb-7.4-debian/configure (and supporting files)script for configuring gdb and all its supporting libraries
gdb-7.4-debian/gdb
the source specific to gdb itself
gdb-7.4-debian/bfd
source for the Binary File Descriptor library
gdb-7.4-debian/include
gnu include files
gdb-7.4-debian/libiberty
source for the ‘-liberty’ free software library
gdb-7.4-debian/opcodes
source for the library of opcode tables and disassemblers
gdb-7.4-debian/readline
source for the gnu command-line interface
gdb-7.4-debian/glob
source for the gnu filename pattern-matching subroutine
gdb-7.4-debian/mmalloc
source for the gnu memory-mapped malloc package
The simplest way to configure and build gdb is to run ‘configure’ from the‘gdb-version-number ’ source directory, which in this example is the ‘gdb-7.4-debian’directory.
First switch to the ‘gdb-version-number ’ source directory if you are not already in it;then run ‘configure’. Pass the identifier for the platform on which gdb will run as anargument.
For example:
1 If you have a more recent version of gdb than 7.4-debian, look at the ‘README’ file in the sources; wemay have improved the installation procedures since publishing this manual.
Appendix C: Installing gdb 455
cd gdb-7.4-debian
./configure host
make
where host is an identifier such as ‘sun4’ or ‘decstation’, that identifies the platform wheregdb will run. (You can often leave off host; ‘configure’ tries to guess the correct value byexamining your system.)
Running ‘configure host ’ and then running make builds the ‘bfd’, ‘readline’,‘mmalloc’, and ‘libiberty’ libraries, then gdb itself. The configured source files, and thebinaries, are left in the corresponding source directories.
‘configure’ is a Bourne-shell (/bin/sh) script; if your system does not recognize thisautomatically when you run a different shell, you may need to run sh on it explicitly:
sh configure host
If you run ‘configure’ from a directory that contains source directories for multiplelibraries or programs, such as the ‘gdb-7.4-debian’ source directory for version 7.4-debian,‘configure’ creates configuration files for every directory level underneath (unless you tellit not to, with the ‘--norecursion’ option).
You should run the ‘configure’ script from the top directory in the source tree, the‘gdb-version-number ’ directory. If you run ‘configure’ from one of the subdirectories,you will configure only that subdirectory. That is usually not what you want. In particular,if you run the first ‘configure’ from the ‘gdb’ subdirectory of the ‘gdb-version-number ’directory, you will omit the configuration of ‘bfd’, ‘readline’, and other sibling directoriesof the ‘gdb’ subdirectory. This leads to build errors about missing include files such as‘bfd/bfd.h’.
You can install gdb anywhere; it has no hardwired paths. However, you should makesure that the shell on your path (named by the ‘SHELL’ environment variable) is publiclyreadable. Remember that gdb uses the shell to start your program—some systems refuseto let gdb debug child processes whose programs are not readable.
C.3 Compiling gdb in Another Directory
If you want to run gdb versions for several host or target machines, you need a differentgdb compiled for each combination of host and target. ‘configure’ is designed to makethis easy by allowing you to generate each configuration in a separate subdirectory, ratherthan in the source directory. If your make program handles the ‘VPATH’ feature (gnu make
does), running make in each of these directories builds the gdb program specified there.
To build gdb in a separate directory, run ‘configure’ with the ‘--srcdir’ option tospecify where to find the source. (You also need to specify a path to find ‘configure’ itselffrom your working directory. If the path to ‘configure’ would be the same as the argumentto ‘--srcdir’, you can leave out the ‘--srcdir’ option; it is assumed.)
For example, with version 7.4-debian, you can build gdb in a separate directory for aSun 4 like this:
cd gdb-7.4-debian
mkdir ../gdb-sun4
cd ../gdb-sun4
../gdb-7.4-debian/configure sun4
make
456 Debugging with gdb
When ‘configure’ builds a configuration using a remote source directory, it creates atree for the binaries with the same structure (and using the same names) as the tree underthe source directory. In the example, you’d find the Sun 4 library ‘libiberty.a’ in thedirectory ‘gdb-sun4/libiberty’, and gdb itself in ‘gdb-sun4/gdb’.
Make sure that your path to the ‘configure’ script has just one instance of ‘gdb’ init. If your path to ‘configure’ looks like ‘../gdb-7.4-debian/gdb/configure’, you areconfiguring only one subdirectory of gdb, not the whole package. This leads to build errorsabout missing include files such as ‘bfd/bfd.h’.
One popular reason to build several gdb configurations in separate directories is to con-figure gdb for cross-compiling (where gdb runs on one machine—the host—while debuggingprograms that run on another machine—the target). You specify a cross-debugging targetby giving the ‘--target=target ’ option to ‘configure’.
When you run make to build a program or library, you must run it in a configureddirectory—whatever directory you were in when you called ‘configure’ (or one of its sub-directories).
The Makefile that ‘configure’ generates in each source directory also runs recursively.If you type make in a source directory such as ‘gdb-7.4-debian’ (or in a separate configureddirectory configured with ‘--srcdir=dirname/gdb-7.4-debian’), you will build all therequired libraries, and then build GDB.
When you have multiple hosts or targets configured in separate directories, you can runmake on them in parallel (for example, if they are NFS-mounted on each of the hosts); theywill not interfere with each other.
C.4 Specifying Names for Hosts and Targets
The specifications used for hosts and targets in the ‘configure’ script are based on a three-part naming scheme, but some short predefined aliases are also supported. The full namingscheme encodes three pieces of information in the following pattern:
architecture-vendor-os
For example, you can use the alias sun4 as a host argument, or as the value for targetin a --target=target option. The equivalent full name is ‘sparc-sun-sunos4’.
The ‘configure’ script accompanying gdb does not provide any query facility to listall supported host and target names or aliases. ‘configure’ calls the Bourne shell scriptconfig.sub to map abbreviations to full names; you can read the script, if you wish, oryou can use it to test your guesses on abbreviations—for example:
% sh config.sub i386-linux
i386-pc-linux-gnu
% sh config.sub alpha-linux
alpha-unknown-linux-gnu
% sh config.sub hp9k700
hppa1.1-hp-hpux
% sh config.sub sun4
sparc-sun-sunos4.1.1
% sh config.sub sun3
m68k-sun-sunos4.1.1
% sh config.sub i986v
Invalid configuration ‘i986v’: machine ‘i986v’ not recognized
Appendix C: Installing gdb 457
config.sub is also distributed in the gdb source directory (‘gdb-7.4-debian’, for version7.4-debian).
C.5 ‘configure’ Options
Here is a summary of the ‘configure’ options and arguments that are most often usefulfor building gdb. ‘configure’ also has several other options not listed here. See Info file‘configure.info’, node ‘What Configure Does’, for a full explanation of ‘configure’.
configure [--help][--prefix=dir ][--exec-prefix=dir ][--srcdir=dirname ][--norecursion] [--rm][--target=target ]host
You may introduce options with a single ‘-’ rather than ‘--’ if you prefer; but you mayabbreviate option names if you use ‘--’.
--help Display a quick summary of how to invoke ‘configure’.
--prefix=dir
Configure the source to install programs and files under directory ‘dir ’.
--exec-prefix=dir
Configure the source to install programs under directory ‘dir ’.
--srcdir=dirname
Warning: using this option requires gnu make, or another make that imple-ments the VPATH feature.Use this option to make configurations in directories separate from the gdbsource directories. Among other things, you can use this to build (or main-tain) several configurations simultaneously, in separate directories. ‘configure’writes configuration-specific files in the current directory, but arranges for themto use the source in the directory dirname. ‘configure’ creates directories un-der the working directory in parallel to the source directories below dirname.
--norecursion
Configure only the directory level where ‘configure’ is executed; do not prop-agate configuration to subdirectories.
--target=target
Configure gdb for cross-debugging programs running on the specified target.Without this option, gdb is configured to debug programs that run on the samemachine (host) as gdb itself.
There is no convenient way to generate a list of all available targets.
host ... Configure gdb to run on the specified host.
There is no convenient way to generate a list of all available hosts.
There are many other options available as well, but they are generally needed for specialpurposes only.
458 Debugging with gdb
C.6 System-wide configuration and settings
gdb can be configured to have a system-wide init file; this file will be read and executed atstartup (see Section 2.1.3 [What gdb does during startup], page 15).
Here is the corresponding configure option:
--with-system-gdbinit=file
Specify that the default location of the system-wide init file is file.
If gdb has been configured with the option ‘--prefix=$prefix’, it may be subject torelocation. Two possible cases:
• If the default location of this init file contains ‘$prefix’, it will be subjectto relocation. Suppose that the configure options are ‘--prefix=$prefix--with-system-gdbinit=$prefix/etc/gdbinit’; if gdb is moved from ‘$prefix’ to‘$install’, the system init file is looked for as ‘$install/etc/gdbinit’ instead of‘$prefix/etc/gdbinit’.
• By contrast, if the default location does not contain the prefix, it will notbe relocated. E.g. if gdb has been configured with ‘--prefix=/usr/local--with-system-gdbinit=/usr/share/gdb/gdbinit’, then gdb will always look for‘/usr/share/gdb/gdbinit’, wherever gdb is installed.
Appendix D: Maintenance Commands 459
Appendix D Maintenance Commands
In addition to commands intended for gdb users, gdb includes a number of commandsintended for gdb developers, that are not documented elsewhere in this manual. Thesecommands are provided here for reference. (For commands that turn on debugging mes-sages, see Section 22.8 [Debugging Output], page 271.)
maint agent expression
maint agent-eval expression
Translate the given expression into remote agent bytecodes. This command isuseful for debugging the Agent Expression mechanism (see Appendix F [AgentExpressions], page 525). The ‘agent’ version produces an expression usefulfor data collection, such as by tracepoints, while ‘maint agent-eval’ producesan expression that evaluates directly to a result. For instance, a collectionexpression for globa + globb will include bytecodes to record four bytes ofmemory at each of the addresses of globa and globb, while discarding theresult of the addition, while an evaluation expression will do the addition andreturn the sum.
maint info breakpoints
Using the same format as ‘info breakpoints’, display both the breakpointsyou’ve set explicitly, and those gdb is using for internal purposes. Internalbreakpoints are shown with negative breakpoint numbers. The type columnidentifies what kind of breakpoint is shown:
breakpoint
Normal, explicitly set breakpoint.
watchpoint
Normal, explicitly set watchpoint.
longjmp Internal breakpoint, used to handle correctly stepping throughlongjmp calls.
longjmp resume
Internal breakpoint at the target of a longjmp.
until Temporary internal breakpoint used by the gdb until command.
finish Temporary internal breakpoint used by the gdb finish command.
shlib events
Shared library events.
set displaced-stepping
show displaced-stepping
Control whether or not gdb will do displaced stepping if the target supports it.Displaced stepping is a way to single-step over breakpoints without removingthem from the inferior, by executing an out-of-line copy of the instruction thatwas originally at the breakpoint location. It is also known as out-of-line single-stepping.
460 Debugging with gdb
set displaced-stepping on
If the target architecture supports it, gdb will use displaced step-ping to step over breakpoints.
set displaced-stepping off
gdb will not use displaced stepping to step over breakpoints, evenif such is supported by the target architecture.
set displaced-stepping auto
This is the default mode. gdb will use displaced stepping onlyif non-stop mode is active (see Section 5.5.2 [Non-Stop Mode],page 69) and the target architecture supports displaced stepping.
maint check-symtabs
Check the consistency of psymtabs and symtabs.
maint cplus first_component name
Print the first C++ class/namespace component of name.
maint cplus namespace
Print the list of possible C++ namespaces.
maint demangle name
Demangle a C++ or Objective-C mangled name.
maint deprecate command [replacement ]maint undeprecate command
Deprecate or undeprecate the named command. Deprecated commands causegdb to issue a warning when you use them. The optional argument replacementsays which newer command should be used in favor of the deprecated one; if itis given, gdb will mention the replacement as part of the warning.
maint dump-me
Cause a fatal signal in the debugger and force it to dump its core. This issupported only on systems which support aborting a program with the SIGQUITsignal.
maint internal-error [message-text ]maint internal-warning [message-text ]
Cause gdb to call the internal function internal_error or internal_warningand hence behave as though an internal error or internal warning has beendetected. In addition to reporting the internal problem, these functions givethe user the opportunity to either quit gdb or create a core file of the currentgdb session.
These commands take an optional parameter message-text that is used as thetext of the error or warning message.
Here’s an example of using internal-error:(gdb) maint internal-error testing, 1, 2
.../maint.c:121: internal-error: testing, 1, 2
A problem internal to GDB has been detected. Further
debugging may prove unreliable.
Quit this debugging session? (y or n) n
Appendix D: Maintenance Commands 461
Create a core file? (y or n) n
(gdb)
maint set internal-error action [ask|yes|no]
maint show internal-error action
maint set internal-warning action [ask|yes|no]
maint show internal-warning action
When gdb reports an internal problem (error or warning) it gives the user theopportunity to both quit gdb and create a core file of the current gdb session.These commands let you override the default behaviour for each particularaction, described in the table below.
‘quit’ You can specify that gdb should always (yes) or never (no) quit.The default is to ask the user what to do.
‘corefile’You can specify that gdb should always (yes) or never (no) createa core file. The default is to ask the user what to do.
maint packet text
If gdb is talking to an inferior via the serial protocol, then this command sendsthe string text to the inferior, and displays the response packet. gdb suppliesthe initial ‘$’ character, the terminating ‘#’ character, and the checksum.
maint print architecture [file ]Print the entire architecture configuration. The optional argument file namesthe file where the output goes.
maint print c-tdesc
Print the current target description (see Appendix G [Target Descriptions],page 537) as a C source file. The created source file can be used in gdb whenan XML parser is not available to parse the description.
maint print dummy-frames
Prints the contents of gdb’s internal dummy-frame stack.
(gdb) b add
...
(gdb) print add(2,3)
Breakpoint 2, add (a=2, b=3) at ...
58 return (a + b);
The program being debugged stopped while in a function called from GDB.
...
(gdb) maint print dummy-frames
0x1a57c80: pc=0x01014068 fp=0x0200bddc sp=0x0200bdd6
top=0x0200bdd4 id={stack=0x200bddc,code=0x101405c}
call_lo=0x01014000 call_hi=0x01014001
(gdb)
Takes an optional file parameter.
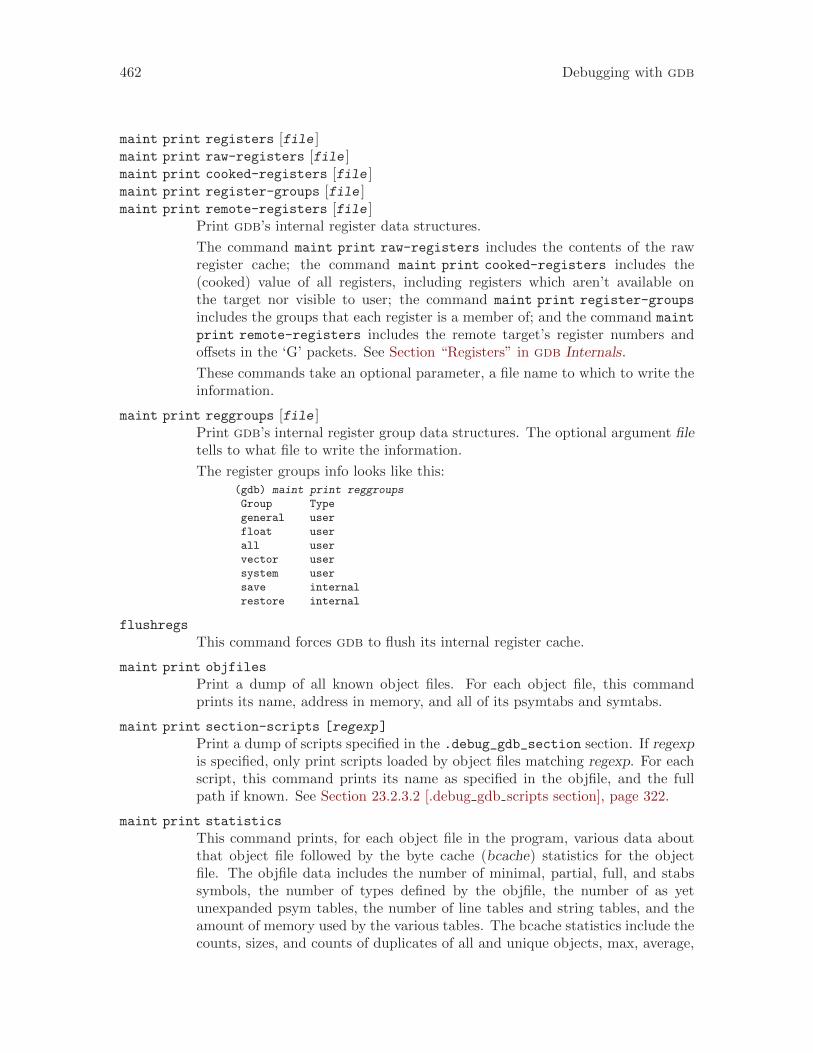
462 Debugging with gdb
maint print registers [file ]maint print raw-registers [file ]maint print cooked-registers [file ]maint print register-groups [file ]maint print remote-registers [file ]
Print gdb’s internal register data structures.
The command maint print raw-registers includes the contents of the rawregister cache; the command maint print cooked-registers includes the(cooked) value of all registers, including registers which aren’t available onthe target nor visible to user; the command maint print register-groups
includes the groups that each register is a member of; and the command maint
print remote-registers includes the remote target’s register numbers andoffsets in the ‘G’ packets. See Section “Registers” in gdb Internals.
These commands take an optional parameter, a file name to which to write theinformation.
maint print reggroups [file ]Print gdb’s internal register group data structures. The optional argument filetells to what file to write the information.
The register groups info looks like this:(gdb) maint print reggroups
Group Type
general user
float user
all user
vector user
system user
save internal
restore internal
flushregs
This command forces gdb to flush its internal register cache.
maint print objfiles
Print a dump of all known object files. For each object file, this commandprints its name, address in memory, and all of its psymtabs and symtabs.
maint print section-scripts [regexp]
Print a dump of scripts specified in the .debug_gdb_section section. If regexpis specified, only print scripts loaded by object files matching regexp. For eachscript, this command prints its name as specified in the objfile, and the fullpath if known. See Section 23.2.3.2 [.debug gdb scripts section], page 322.
maint print statistics
This command prints, for each object file in the program, various data aboutthat object file followed by the byte cache (bcache) statistics for the objectfile. The objfile data includes the number of minimal, partial, full, and stabssymbols, the number of types defined by the objfile, the number of as yetunexpanded psym tables, the number of line tables and string tables, and theamount of memory used by the various tables. The bcache statistics include thecounts, sizes, and counts of duplicates of all and unique objects, max, average,
Appendix D: Maintenance Commands 463
and median entry size, total memory used and its overhead and savings, andvarious measures of the hash table size and chain lengths.
maint print target-stack
A target is an interface between the debugger and a particular kind of file orprocess. Targets can be stacked in strata, so that more than one target canpotentially respond to a request. In particular, memory accesses will walk downthe stack of targets until they find a target that is interested in handling thatparticular address.
This command prints a short description of each layer that was pushed on thetarget stack, starting from the top layer down to the bottom one.
maint print type expr
Print the type chain for a type specified by expr. The argument can be either atype name or a symbol. If it is a symbol, the type of that symbol is described.The type chain produced by this command is a recursive definition of the datatype as stored in gdb’s data structures, including its flags and contained types.
maint set dwarf2 always-disassemble
maint show dwarf2 always-disassemble
Control the behavior of info address when using DWARF debugging informa-tion.
The default is off, which means that gdb should try to describe a variable’slocation in an easily readable format. When on, gdb will instead display theDWARF location expression in an assembly-like format. Note that some loca-tions are too complex for gdb to describe simply; in this case you will alwayssee the disassembly form.
Here is an example of the resulting disassembly:(gdb) info addr argc
Symbol "argc" is a complex DWARF expression:
1: DW_OP_fbreg 0
For more information on these expressions, see the DWARF standard.
maint set dwarf2 max-cache-age
maint show dwarf2 max-cache-age
Control the DWARF 2 compilation unit cache.
In object files with inter-compilation-unit references, such as those produced bythe GCC option ‘-feliminate-dwarf2-dups’, the DWARF 2 reader needs tofrequently refer to previously read compilation units. This setting controls howlong a compilation unit will remain in the cache if it is not referenced. A higherlimit means that cached compilation units will be stored in memory longer, andmore total memory will be used. Setting it to zero disables caching, which willslow down gdb startup, but reduce memory consumption.
maint set profile
maint show profile
Control profiling of gdb.
Profiling will be disabled until you use the ‘maint set profile’ command toenable it. When you enable profiling, the system will begin collecting timing
464 Debugging with gdb
and execution count data; when you disable profiling or exit gdb, the resultswill be written to a log file. Remember that if you use profiling, gdb willoverwrite the profiling log file (often called ‘gmon.out’). If you have a recordof important profiling data in a ‘gmon.out’ file, be sure to move it to a safelocation.
Configuring with ‘--enable-profiling’ arranges for gdb to be compiled withthe ‘-pg’ compiler option.
maint set show-debug-regs
maint show show-debug-regs
Control whether to show variables that mirror the hardware debug registers.Use ON to enable, OFF to disable. If enabled, the debug registers values areshown when gdb inserts or removes a hardware breakpoint or watchpoint, andwhen the inferior triggers a hardware-assisted breakpoint or watchpoint.
maint set show-all-tib
maint show show-all-tib
Control whether to show all non zero areas within a 1k block starting at threadlocal base, when using the ‘info w32 thread-information-block’ command.
maint space
Control whether to display memory usage for each command. If set to a nonzerovalue, gdb will display how much memory each command took, following thecommand’s own output. This can also be requested by invoking gdb withthe ‘--statistics’ command-line switch (see Section 2.1.2 [Mode Options],page 13).
maint time
Control whether to display the execution time of gdb for each command. Ifset to a nonzero value, gdb will display how much time it took to execute eachcommand, following the command’s own output. Both CPU time and wallclocktime are printed. Printing both is useful when trying to determine whether thecost is CPU or, e.g., disk/network, latency. Note that the CPU time printedis for gdb only, it does not include the execution time of the inferior becausethere’s no mechanism currently to compute how much time was spent by gdband how much time was spent by the program been debugged. This can alsobe requested by invoking gdb with the ‘--statistics’ command-line switch(see Section 2.1.2 [Mode Options], page 13).
maint translate-address [section ] addrFind the symbol stored at the location specified by the address addr and anoptional section name section. If found, gdb prints the name of the closestsymbol and an offset from the symbol’s location to the specified address. Thisis similar to the info address command (see Chapter 16 [Symbols], page 189),except that this command also allows to find symbols in other sections.
If section was not specified, the section in which the symbol was found is alsoprinted. For dynamically linked executables, the name of executable or sharedlibrary containing the symbol is printed as well.
Appendix D: Maintenance Commands 465
The following command is useful for non-interactive invocations of gdb, such as in thetest suite.
set watchdog nsec
Set the maximum number of seconds gdb will wait for the target operation tofinish. If this time expires, gdb reports and error and the command is aborted.
show watchdog
Show the current setting of the target wait timeout.

Appendix E: gdb Remote Serial Protocol 467
Appendix E gdb Remote Serial Protocol
E.1 Overview
There may be occasions when you need to know something about the protocol—for example,if there is only one serial port to your target machine, you might want your program to dosomething special if it recognizes a packet meant for gdb.
In the examples below, ‘->’ and ‘<-’ are used to indicate transmitted and received data,respectively.
All gdb commands and responses (other than acknowledgments and notifications, seeSection E.9 [Notification Packets], page 505) are sent as a packet. A packet is introducedwith the character ‘$’, the actual packet-data, and the terminating character ‘#’ followedby a two-digit checksum:
$packet-data#checksum
The two-digit checksum is computed as the modulo 256 sum of all characters between theleading ‘$’ and the trailing ‘#’ (an eight bit unsigned checksum).
Implementors should note that prior to gdb 5.0 the protocol specification also includedan optional two-digit sequence-id:
$sequence-id:packet-data#checksum
That sequence-id was appended to the acknowledgment. gdb has never output sequence-ids. Stubs that handle packets added since gdb 5.0 must not accept sequence-id.
When either the host or the target machine receives a packet, the first response expectedis an acknowledgment: either ‘+’ (to indicate the package was received correctly) or ‘-’ (torequest retransmission):
-> $packet-data#checksum
<- +
The ‘+’/‘-’ acknowledgments can be disabled once a connection is established. SeeSection E.11 [Packet Acknowledgment], page 507, for details.
The host (gdb) sends commands, and the target (the debugging stub incorporated inyour program) sends a response. In the case of step and continue commands, the responseis only sent when the operation has completed, and the target has again stopped all threadsin all attached processes. This is the default all-stop mode behavior, but the remote pro-tocol also supports gdb’s non-stop execution mode; see Section E.10 [Remote Non-Stop],page 506, for details.
packet-data consists of a sequence of characters with the exception of ‘#’ and ‘$’ (see ‘X’packet for additional exceptions).
Fields within the packet should be separated using ‘,’ ‘;’ or ‘:’. Except where otherwisenoted all numbers are represented in hex with leading zeros suppressed.
Implementors should note that prior to gdb 5.0, the character ‘:’ could not appear asthe third character in a packet (as it would potentially conflict with the sequence-id).
Binary data in most packets is encoded either as two hexadecimal digits per byte ofbinary data. This allowed the traditional remote protocol to work over connections whichwere only seven-bit clean. Some packets designed more recently assume an eight-bit cleanconnection, and use a more efficient encoding to send and receive binary data.
468 Debugging with gdb
The binary data representation uses 7d (ascii ‘}’) as an escape character. Any escapedbyte is transmitted as the escape character followed by the original character XORed with0x20. For example, the byte 0x7d would be transmitted as the two bytes 0x7d 0x5d. Thebytes 0x23 (ascii ‘#’), 0x24 (ascii ‘$’), and 0x7d (ascii ‘}’) must always be escaped.Responses sent by the stub must also escape 0x2a (ascii ‘*’), so that it is not interpretedas the start of a run-length encoded sequence (described next).
Response data can be run-length encoded to save space. Run-length encoding replacesruns of identical characters with one instance of the repeated character, followed by a ‘*’and a repeat count. The repeat count is itself sent encoded, to avoid binary characters indata: a value of n is sent as n+29. For a repeat count greater or equal to 3, this producesa printable ascii character, e.g. a space (ascii code 32) for a repeat count of 3. (This isbecause run-length encoding starts to win for counts 3 or more.) Thus, for example, ‘0* ’is a run-length encoding of “0000”: the space character after ‘*’ means repeat the leading0 32 - 29 = 3 more times.
The printable characters ‘#’ and ‘$’ or with a numeric value greater than 126 must notbe used. Runs of six repeats (‘#’) or seven repeats (‘$’) can be expanded using a repeatcount of only five (‘"’). For example, ‘00000000’ can be encoded as ‘0*"00’.
The error response returned for some packets includes a two character error number.That number is not well defined.
For any command not supported by the stub, an empty response (‘$#00’) should bereturned. That way it is possible to extend the protocol. A newer gdb can tell if a packetis supported based on that response.
At a minimum, a stub is required to support the ‘g’ and ‘G’ commands for register access,and the ‘m’ and ‘M’ commands for memory access. Stubs that only control single-threadedtargets can implement run control with the ‘c’ (continue), and ‘s’ (step) commands. Stubsthat support multi-threading targets should support the ‘vCont’ command. All other com-mands are optional.
E.2 Packets
The following table provides a complete list of all currently defined commands and their cor-responding response data. See Section E.13 [File-I/O Remote Protocol Extension], page 508,for details about the File I/O extension of the remote protocol.
Each packet’s description has a template showing the packet’s overall syntax, followedby an explanation of the packet’s meaning. We include spaces in some of the templates forclarity; these are not part of the packet’s syntax. No gdb packet uses spaces to separateits components. For example, a template like ‘foo bar baz ’ describes a packet beginningwith the three ASCII bytes ‘foo’, followed by a bar, followed directly by a baz. gdb doesnot transmit a space character between the ‘foo’ and the bar, or between the bar and thebaz.
Several packets and replies include a thread-id field to identify a thread. Normallythese are positive numbers with a target-specific interpretation, formatted as big-endianhex strings. A thread-id can also be a literal ‘-1’ to indicate all threads, or ‘0’ to pick anythread.
In addition, the remote protocol supports a multiprocess feature in which the thread-idsyntax is extended to optionally include both process and thread ID fields, as ‘ppid.tid ’.
Appendix E: gdb Remote Serial Protocol 469
The pid (process) and tid (thread) components each have the format described above: apositive number with target-specific interpretation formatted as a big-endian hex string,literal ‘-1’ to indicate all processes or threads (respectively), or ‘0’ to indicate an arbitraryprocess or thread. Specifying just a process, as ‘ppid ’, is equivalent to ‘ppid.-1’. It is anerror to specify all processes but a specific thread, such as ‘p-1.tid ’. Note that the ‘p’prefix is not used for those packets and replies explicitly documented to include a processID, rather than a thread-id.
The multiprocess thread-id syntax extensions are only used if both gdb and the stubreport support for the ‘multiprocess’ feature using ‘qSupported’. See [multiprocess ex-tensions], page 489, for more information.
Note that all packet forms beginning with an upper- or lower-case letter, other thanthose described here, are reserved for future use.
Here are the packet descriptions.
‘!’ Enable extended mode. In extended mode, the remote server is made persistent.The ‘R’ packet is used to restart the program being debugged.
Reply:
‘OK’ The remote target both supports and has enabled extended mode.
‘?’ Indicate the reason the target halted. The reply is the same as for step andcontinue. This packet has a special interpretation when the target is in non-stopmode; see Section E.10 [Remote Non-Stop], page 506.
Reply: See Section E.3 [Stop Reply Packets], page 478, for the reply specifica-tions.
‘A arglen,argnum,arg,...’Initialized argv[] array passed into program. arglen specifies the number ofbytes in the hex encoded byte stream arg. See gdbserver for more details.
Reply:
‘OK’ The arguments were set.
‘E NN ’ An error occurred.
‘b baud ’ (Don’t use this packet; its behavior is not well-defined.) Change the serial linespeed to baud.
JTC: When does the transport layer state change? When it’s received, or afterthe ACK is transmitted. In either case, there are problems if the command orthe acknowledgment packet is dropped.
Stan: If people really wanted to add something like this, and get it workingfor the first time, they ought to modify ser-unix.c to send some kind of out-of-band message to a specially-setup stub and have the switch happen "in between"packets, so that from remote protocol’s point of view, nothing actually happened.
‘B addr,mode ’Set (mode is ‘S’) or clear (mode is ‘C’) a breakpoint at addr.
Don’t use this packet. Use the ‘Z’ and ‘z’ packets instead (see [insert breakpointor watchpoint packet], page 476).
470 Debugging with gdb
‘bc’ Backward continue. Execute the target system in reverse. No parameter. SeeChapter 6 [Reverse Execution], page 75, for more information.
Reply: See Section E.3 [Stop Reply Packets], page 478, for the reply specifica-tions.
‘bs’ Backward single step. Execute one instruction in reverse. No parameter. SeeChapter 6 [Reverse Execution], page 75, for more information.
Reply: See Section E.3 [Stop Reply Packets], page 478, for the reply specifica-tions.
‘c [addr ]’ Continue. addr is address to resume. If addr is omitted, resume at currentaddress.
This packet is deprecated for multi-threading support. See [vCont packet],page 473.
Reply: See Section E.3 [Stop Reply Packets], page 478, for the reply specifica-tions.
‘C sig [;addr ]’Continue with signal sig (hex signal number). If ‘;addr ’ is omitted, resume atsame address.
This packet is deprecated for multi-threading support. See [vCont packet],page 473.
Reply: See Section E.3 [Stop Reply Packets], page 478, for the reply specifica-tions.
‘d’ Toggle debug flag.
Don’t use this packet; instead, define a general set packet (see Section E.4[General Query Packets], page 479).
‘D’‘D;pid ’ The first form of the packet is used to detach gdb from the remote system. It
is sent to the remote target before gdb disconnects via the detach command.
The second form, including a process ID, is used when multiprocess protocolextensions are enabled (see [multiprocess extensions], page 489), to detach onlya specific process. The pid is specified as a big-endian hex string.
Reply:
‘OK’ for success
‘E NN ’ for an error
‘F RC,EE,CF;XX ’A reply from gdb to an ‘F’ packet sent by the target. This is part of the File-I/O protocol extension. See Section E.13 [File-I/O Remote Protocol Extension],page 508, for the specification.
‘g’ Read general registers.
Reply:
Appendix E: gdb Remote Serial Protocol 471
‘XX...’ Each byte of register data is described by two hex digits. The byteswith the register are transmitted in target byte order. The size ofeach register and their position within the ‘g’ packet are determinedby the gdb internal gdbarch functions DEPRECATED_REGISTER_RAW_SIZE and gdbarch_register_name. The specification of severalstandard ‘g’ packets is specified below.
When reading registers from a trace frame (see Section 13.2 [Usingthe Collected Data], page 150), the stub may also return a stringof literal ‘x’’s in place of the register data digits, to indicate thatthe corresponding register has not been collected, thus its value isunavailable. For example, for an architecture with 4 registers of4 bytes each, the following reply indicates to gdb that registers 0and 2 have not been collected, while registers 1 and 3 have beencollected, and both have zero value:
-> g
<- xxxxxxxx00000000xxxxxxxx00000000
‘E NN ’ for an error.
‘G XX...’ Write general registers. See [read registers packet], page 470, for a descriptionof the XX. . . data.
Reply:
‘OK’ for success
‘E NN ’ for an error
‘H op thread-id ’Set thread for subsequent operations (‘m’, ‘M’, ‘g’, ‘G’, et.al.). op depends on theoperation to be performed: it should be ‘c’ for step and continue operations(note that this is deprecated, supporting the ‘vCont’ command is a better op-tion), ‘g’ for other operations. The thread designator thread-id has the formatand interpretation described in [thread-id syntax], page 468.
Reply:
‘OK’ for success
‘E NN ’ for an error
‘i [addr [,nnn ]]’Step the remote target by a single clock cycle. If ‘,nnn ’ is present, cycle stepnnn cycles. If addr is present, cycle step starting at that address.
‘I’ Signal, then cycle step. See [step with signal packet], page 473. See [cycle steppacket], page 471.
‘k’ Kill request.
FIXME: There is no description of how to operate when a specific thread contexthas been selected (i.e. does ’k’ kill only that thread?).
‘m addr,length ’Read length bytes of memory starting at address addr. Note that addr maynot be aligned to any particular boundary.
472 Debugging with gdb
The stub need not use any particular size or alignment when gathering datafrom memory for the response; even if addr is word-aligned and length is amultiple of the word size, the stub is free to use byte accesses, or not. Forthis reason, this packet may not be suitable for accessing memory-mapped I/Odevices.
Reply:
‘XX...’ Memory contents; each byte is transmitted as a two-digit hexadec-imal number. The reply may contain fewer bytes than requested ifthe server was able to read only part of the region of memory.
‘E NN ’ NN is errno
‘M addr,length:XX...’Write length bytes of memory starting at address addr. XX. . . is the data;each byte is transmitted as a two-digit hexadecimal number.
Reply:
‘OK’ for success
‘E NN ’ for an error (this includes the case where only part of the data waswritten).
‘p n ’ Read the value of register n; n is in hex. See [read registers packet], page 470,for a description of how the returned register value is encoded.
Reply:
‘XX...’ the register’s value
‘E NN ’ for an error
‘’ Indicating an unrecognized query.
‘P n...=r...’Write register n. . . with value r. . . . The register number n is in hexadecimal,and r. . . contains two hex digits for each byte in the register (target byte order).
Reply:
‘OK’ for success
‘E NN ’ for an error
‘q name params...’‘Q name params...’
General query (‘q’) and set (‘Q’). These packets are described fully inSection E.4 [General Query Packets], page 479.
‘r’ Reset the entire system.
Don’t use this packet; use the ‘R’ packet instead.
‘R XX ’ Restart the program being debugged. XX, while needed, is ignored. This packetis only available in extended mode (see [extended mode], page 469).
The ‘R’ packet has no reply.
Appendix E: gdb Remote Serial Protocol 473
‘s [addr ]’ Single step. addr is the address at which to resume. If addr is omitted, resumeat same address.
This packet is deprecated for multi-threading support. See [vCont packet],page 473.
Reply: See Section E.3 [Stop Reply Packets], page 478, for the reply specifica-tions.
‘S sig [;addr ]’Step with signal. This is analogous to the ‘C’ packet, but requests a single-step,rather than a normal resumption of execution.
This packet is deprecated for multi-threading support. See [vCont packet],page 473.
Reply: See Section E.3 [Stop Reply Packets], page 478, for the reply specifica-tions.
‘t addr:PP,MM ’Search backwards starting at address addr for a match with pattern PP andmask MM. PP and MM are 4 bytes. addr must be at least 3 digits.
‘T thread-id ’Find out if the thread thread-id is alive. See [thread-id syntax], page 468.
Reply:
‘OK’ thread is still alive
‘E NN ’ thread is dead
‘v’ Packets starting with ‘v’ are identified by a multi-letter name, up to the first‘;’ or ‘?’ (or the end of the packet).
‘vAttach;pid ’Attach to a new process with the specified process ID pid. The process ID is ahexadecimal integer identifying the process. In all-stop mode, all threads in theattached process are stopped; in non-stop mode, it may be attached withoutbeing stopped if that is supported by the target.
This packet is only available in extended mode (see [extended mode], page 469).
Reply:
‘E nn ’ for an error
‘Any stop packet’for success in all-stop mode (see Section E.3 [Stop Reply Packets],page 478)
‘OK’ for success in non-stop mode (see Section E.10 [Remote Non-Stop],page 506)
‘vCont[;action [:thread-id ]]...’Resume the inferior, specifying different actions for each thread. If an actionis specified with no thread-id, then it is applied to any threads that don’t havea specific action specified; if no default action is specified then other threads
474 Debugging with gdb
should remain stopped in all-stop mode and in their current state in non-stopmode. Specifying multiple default actions is an error; specifying no actions isalso an error. Thread IDs are specified using the syntax described in [thread-idsyntax], page 468.
Currently supported actions are:
‘c’ Continue.
‘C sig ’ Continue with signal sig. The signal sig should be two hex digits.
‘s’ Step.
‘S sig ’ Step with signal sig. The signal sig should be two hex digits.
‘t’ Stop.
The optional argument addr normally associated with the ‘c’, ‘C’, ‘s’, and ‘S’packets is not supported in ‘vCont’.
The ‘t’ action is only relevant in non-stop mode (see Section E.10 [Remote Non-Stop], page 506) and may be ignored by the stub otherwise. A stop reply shouldbe generated for any affected thread not already stopped. When a thread isstopped by means of a ‘t’ action, the corresponding stop reply should indicatethat the thread has stopped with signal ‘0’, regardless of whether the targetuses some other signal as an implementation detail.
Reply: See Section E.3 [Stop Reply Packets], page 478, for the reply specifica-tions.
‘vCont?’ Request a list of actions supported by the ‘vCont’ packet.
Reply:
‘vCont[;action...]’The ‘vCont’ packet is supported. Each action is a supported com-mand in the ‘vCont’ packet.
‘’ The ‘vCont’ packet is not supported.
‘vFile:operation:parameter...’Perform a file operation on the target system. For details, see Section E.7 [HostI/O Packets], page 503.
‘vFlashErase:addr,length ’Direct the stub to erase length bytes of flash starting at addr. The region mayenclose any number of flash blocks, but its start and end must fall on blockboundaries, as indicated by the flash block size appearing in the memory map(see Section E.16 [Memory Map Format], page 521). gdb groups flash memoryprogramming operations together, and sends a ‘vFlashDone’ request after eachgroup; the stub is allowed to delay erase operation until the ‘vFlashDone’ packetis received.
The stub must support ‘vCont’ if it reports support for multiprocess extensions(see [multiprocess extensions], page 489). Note that in this case ‘vCont’ actionscan be specified to apply to all threads in a process by using the ‘ppid.-1’ formof the thread-id.
Reply:
Appendix E: gdb Remote Serial Protocol 475
‘OK’ for success
‘E NN ’ for an error
‘vFlashWrite:addr:XX...’Direct the stub to write data to flash address addr. The data is passed inbinary form using the same encoding as for the ‘X’ packet (see [Binary Data],page 467). The memory ranges specified by ‘vFlashWrite’ packets preceding a‘vFlashDone’ packet must not overlap, and must appear in order of increasingaddresses (although ‘vFlashErase’ packets for higher addresses may alreadyhave been received; the ordering is guaranteed only between ‘vFlashWrite’packets). If a packet writes to an address that was neither erased by a preceding‘vFlashErase’ packet nor by some other target-specific method, the results areunpredictable.
Reply:
‘OK’ for success
‘E.memtype’for vFlashWrite addressing non-flash memory
‘E NN ’ for an error
‘vFlashDone’Indicate to the stub that flash programming operation is finished. The stubis permitted to delay or batch the effects of a group of ‘vFlashErase’ and‘vFlashWrite’ packets until a ‘vFlashDone’ packet is received. The contents ofthe affected regions of flash memory are unpredictable until the ‘vFlashDone’request is completed.
‘vKill;pid ’Kill the process with the specified process ID. pid is a hexadecimal integer iden-tifying the process. This packet is used in preference to ‘k’ when multiprocessprotocol extensions are supported; see [multiprocess extensions], page 489.
Reply:
‘E nn ’ for an error
‘OK’ for success
‘vRun;filename [;argument ]...’Run the program filename, passing it each argument on its command line. Thefile and arguments are hex-encoded strings. If filename is an empty string, thestub may use a default program (e.g. the last program run). The program iscreated in the stopped state.
This packet is only available in extended mode (see [extended mode], page 469).
Reply:
‘E nn ’ for an error
‘Any stop packet’for success (see Section E.3 [Stop Reply Packets], page 478)
476 Debugging with gdb
‘vStopped’In non-stop mode (see Section E.10 [Remote Non-Stop], page 506), acknowledgea previous stop reply and prompt for the stub to report another one.
Reply:
‘Any stop packet’if there is another unreported stop event (see Section E.3 [StopReply Packets], page 478)
‘OK’ if there are no unreported stop events
‘X addr,length:XX...’Write data to memory, where the data is transmitted in binary. addr is address,length is number of bytes, ‘XX...’ is binary data (see [Binary Data], page 467).
Reply:
‘OK’ for success
‘E NN ’ for an error
‘z type,addr,kind ’‘Z type,addr,kind ’
Insert (‘Z’) or remove (‘z’) a type breakpoint or watchpoint starting at addressaddress of kind kind.
Each breakpoint and watchpoint packet type is documented separately.
Implementation notes: A remote target shall return an empty string for an un-recognized breakpoint or watchpoint packet type. A remote target shall supporteither both or neither of a given ‘Ztype...’ and ‘ztype...’ packet pair. Toavoid potential problems with duplicate packets, the operations should be imple-mented in an idempotent way.
‘z0,addr,kind ’‘Z0,addr,kind ’
Insert (‘Z0’) or remove (‘z0’) a memory breakpoint at address addr of typekind.
A memory breakpoint is implemented by replacing the instruction at addr witha software breakpoint or trap instruction. The kind is target-specific and typi-cally indicates the size of the breakpoint in bytes that should be inserted. E.g.,the arm and mips can insert either a 2 or 4 byte breakpoint. Some architec-tures have additional meanings for kind; see Section E.5 [Architecture-SpecificProtocol Details], page 495.
Implementation note: It is possible for a target to copy or move code that con-tains memory breakpoints (e.g., when implementing overlays). The behavior ofthis packet, in the presence of such a target, is not defined.
Reply:
‘OK’ success
‘’ not supported
‘E NN ’ for an error
Appendix E: gdb Remote Serial Protocol 477
‘z1,addr,kind ’‘Z1,addr,kind ’
Insert (‘Z1’) or remove (‘z1’) a hardware breakpoint at address addr.
A hardware breakpoint is implemented using a mechanism that is not dependanton being able to modify the target’s memory. kind has the same meaning as in‘Z0’ packets.
Implementation note: A hardware breakpoint is not affected by code movement.
Reply:
‘OK’ success
‘’ not supported
‘E NN ’ for an error
‘z2,addr,kind ’‘Z2,addr,kind ’
Insert (‘Z2’) or remove (‘z2’) a write watchpoint at addr. kind is interpretedas the number of bytes to watch.
Reply:
‘OK’ success
‘’ not supported
‘E NN ’ for an error
‘z3,addr,kind ’‘Z3,addr,kind ’
Insert (‘Z3’) or remove (‘z3’) a read watchpoint at addr. kind is interpreted asthe number of bytes to watch.
Reply:
‘OK’ success
‘’ not supported
‘E NN ’ for an error
‘z4,addr,kind ’‘Z4,addr,kind ’
Insert (‘Z4’) or remove (‘z4’) an access watchpoint at addr. kind is interpretedas the number of bytes to watch.
Reply:
‘OK’ success
‘’ not supported
‘E NN ’ for an error
478 Debugging with gdb
E.3 Stop Reply Packets
The ‘C’, ‘c’, ‘S’, ‘s’, ‘vCont’, ‘vAttach’, ‘vRun’, ‘vStopped’, and ‘?’ packets can receive anyof the below as a reply. Except for ‘?’ and ‘vStopped’, that reply is only returned whenthe target halts. In the below the exact meaning of signal number is defined by the header‘include/gdb/signals.h’ in the gdb source code.
As in the description of request packets, we include spaces in the reply templates forclarity; these are not part of the reply packet’s syntax. No gdb stop reply packet usesspaces to separate its components.
‘S AA ’ The program received signal number AA (a two-digit hexadecimal number).This is equivalent to a ‘T’ response with no n:r pairs.
‘T AA n1:r1;n2:r2;...’The program received signal number AA (a two-digit hexadecimal number).This is equivalent to an ‘S’ response, except that the ‘n:r ’ pairs can carry valuesof important registers and other information directly in the stop reply packet,reducing round-trip latency. Single-step and breakpoint traps are reported thisway. Each ‘n:r ’ pair is interpreted as follows:
• If n is a hexadecimal number, it is a register number, and the correspondingr gives that register’s value. r is a series of bytes in target byte order, witheach byte given by a two-digit hex number.
• If n is ‘thread’, then r is the thread-id of the stopped thread, as specifiedin [thread-id syntax], page 468.
• If n is ‘core’, then r is the hexadecimal number of the core on which thestop event was detected.
• If n is a recognized stop reason, it describes a more specific event thatstopped the target. The currently defined stop reasons are listed below. aashould be ‘05’, the trap signal. At most one stop reason should be present.
• Otherwise, gdb should ignore this ‘n:r ’ pair and go on to the next; thisallows us to extend the protocol in the future.
The currently defined stop reasons are:
‘watch’‘rwatch’‘awatch’ The packet indicates a watchpoint hit, and r is the data address,
in hex.
‘library’ The packet indicates that the loaded libraries have changed. gdbshould use ‘qXfer:libraries:read’ to fetch a new list of loadedlibraries. r is ignored.
‘replaylog’The packet indicates that the target cannot continue replayinglogged execution events, because it has reached the end (or thebeginning when executing backward) of the log. The value of rwill be either ‘begin’ or ‘end’. See Chapter 6 [Reverse Execution],page 75, for more information.
Appendix E: gdb Remote Serial Protocol 479
‘W AA ’‘W AA ; process:pid ’
The process exited, and AA is the exit status. This is only applicable to certaintargets.
The second form of the response, including the process ID of the exited process,can be used only when gdb has reported support for multiprocess protocolextensions; see [multiprocess extensions], page 489. The pid is formatted as abig-endian hex string.
‘X AA ’‘X AA ; process:pid ’
The process terminated with signal AA.
The second form of the response, including the process ID of the terminatedprocess, can be used only when gdb has reported support for multiprocess pro-tocol extensions; see [multiprocess extensions], page 489. The pid is formattedas a big-endian hex string.
‘O XX...’ ‘XX...’ is hex encoding of ascii data, to be written as the program’s consoleoutput. This can happen at any time while the program is running and thedebugger should continue to wait for ‘W’, ‘T’, etc. This reply is not permittedin non-stop mode.
‘F call-id,parameter...’call-id is the identifier which says which host system call should be called. Thisis just the name of the function. Translation into the correct system call is onlyapplicable as it’s defined in gdb. See Section E.13 [File-I/O Remote ProtocolExtension], page 508, for a list of implemented system calls.
‘parameter...’ is a list of parameters as defined for this very system call.
The target replies with this packet when it expects gdb to call a host systemcall on behalf of the target. gdb replies with an appropriate ‘F’ packet andkeeps up waiting for the next reply packet from the target. The latest ‘C’, ‘c’,‘S’ or ‘s’ action is expected to be continued. See Section E.13 [File-I/O RemoteProtocol Extension], page 508, for more details.
E.4 General Query Packets
Packets starting with ‘q’ are general query packets; packets starting with ‘Q’ are general setpackets. General query and set packets are a semi-unified form for retrieving and sendinginformation to and from the stub.
The initial letter of a query or set packet is followed by a name indicating what sortof thing the packet applies to. For example, gdb may use a ‘qSymbol’ packet to exchangesymbol definitions with the stub. These packet names follow some conventions:
• The name must not contain commas, colons or semicolons.
• Most gdb query and set packets have a leading upper case letter.
• The names of custom vendor packets should use a company prefix, in lower case, fol-lowed by a period. For example, packets designed at the Acme Corporation mightbegin with ‘qacme.foo’ (for querying foos) or ‘Qacme.bar’ (for setting bars).
480 Debugging with gdb
The name of a query or set packet should be separated from any parameters by a ‘:’; theparameters themselves should be separated by ‘,’ or ‘;’. Stubs must be careful to matchthe full packet name, and check for a separator or the end of the packet, in case two packetnames share a common prefix. New packets should not begin with ‘qC’, ‘qP’, or ‘qL’1.
Like the descriptions of the other packets, each description here has a template showingthe packet’s overall syntax, followed by an explanation of the packet’s meaning. We includespaces in some of the templates for clarity; these are not part of the packet’s syntax. Nogdb packet uses spaces to separate its components.
Here are the currently defined query and set packets:
‘QAllow:op:val...’Specify which operations gdb expects to request of the target, as a semicolon-separated list of operation name and value pairs. Possible values for op include‘WriteReg’, ‘WriteMem’, ‘InsertBreak’, ‘InsertTrace’, ‘InsertFastTrace’,and ‘Stop’. val is either 0, indicating that gdb will not request the opera-tion, or 1, indicating that it may. (The target can then use this to set up itsown internals optimally, for instance if the debugger never expects to insertbreakpoints, it may not need to install its own trap handler.)
‘qC’ Return the current thread ID.
Reply:
‘QC thread-id ’Where thread-id is a thread ID as documented in [thread-id syntax],page 468.
‘(anything else)’Any other reply implies the old thread ID.
‘qCRC:addr,length ’Compute the CRC checksum of a block of memory using CRC-32 defined inIEEE 802.3. The CRC is computed byte at a time, taking the most significantbit of each byte first. The initial pattern code 0xffffffff is used to ensureleading zeros affect the CRC.
Note: This is the same CRC used in validating separate debug files (seeSection 18.2 [Debugging Information in Separate Files], page 209). Howeverthe algorithm is slightly different. When validating separate debug files, theCRC is computed taking the least significant bit of each byte first, and thefinal result is inverted to detect trailing zeros.
Reply:
‘E NN ’ An error (such as memory fault)
‘C crc32 ’ The specified memory region’s checksum is crc32.
1 The ‘qP’ and ‘qL’ packets predate these conventions, and have arguments without any terminator forthe packet name; we suspect they are in widespread use in places that are difficult to upgrade. The ‘qC’packet has no arguments, but some existing stubs (e.g. RedBoot) are known to not check for the end ofthe packet.
Appendix E: gdb Remote Serial Protocol 481
‘QDisableRandomization:value ’Some target operating systems will randomize the virtual address space of theinferior process as a security feature, but provide a feature to disable suchrandomization, e.g. to allow for a more deterministic debugging experience. Onsuch systems, this packet with a value of 1 directs the target to disable addressspace randomization for processes subsequently started via ‘vRun’ packets, whilea packet with a value of 0 tells the target to enable address space randomization.
This packet is only available in extended mode (see [extended mode], page 469).
Reply:
‘OK’ The request succeeded.
‘E nn ’ An error occurred. nn are hex digits.
‘’ An empty reply indicates that ‘QDisableRandomization’ is notsupported by the stub.
This packet is not probed by default; the remote stub must request it, bysupplying an appropriate ‘qSupported’ response (see [qSupported], page 485).This should only be done on targets that actually support disabling addressspace randomization.
‘qfThreadInfo’‘qsThreadInfo’
Obtain a list of all active thread IDs from the target (OS). Since there may betoo many active threads to fit into one reply packet, this query works iteratively:it may require more than one query/reply sequence to obtain the entire list ofthreads. The first query of the sequence will be the ‘qfThreadInfo’ query;subsequent queries in the sequence will be the ‘qsThreadInfo’ query.
NOTE: This packet replaces the ‘qL’ query (see below).
Reply:
‘m thread-id ’A single thread ID
‘m thread-id,thread-id...’a comma-separated list of thread IDs
‘l’ (lower case letter ‘L’) denotes end of list.
In response to each query, the target will reply with a list of one or more threadIDs, separated by commas. gdb will respond to each reply with a request formore thread ids (using the ‘qs’ form of the query), until the target respondswith ‘l’ (lower-case ell, for last). Refer to [thread-id syntax], page 468, for theformat of the thread-id fields.
‘qGetTLSAddr:thread-id,offset,lm ’Fetch the address associated with thread local storage specified by thread-id,offset, and lm.
thread-id is the thread ID associated with the thread for which to fetch theTLS address. See [thread-id syntax], page 468.
482 Debugging with gdb
offset is the (big endian, hex encoded) offset associated with the thread localvariable. (This offset is obtained from the debug information associated withthe variable.)
lm is the (big endian, hex encoded) OS/ABI-specific encoding of the load mod-ule associated with the thread local storage. For example, a gnu/Linux systemwill pass the link map address of the shared object associated with the threadlocal storage under consideration. Other operating environments may choose torepresent the load module differently, so the precise meaning of this parameterwill vary.
Reply:
‘XX...’ Hex encoded (big endian) bytes representing the address of thethread local storage requested.
‘E nn ’ An error occurred. nn are hex digits.
‘’ An empty reply indicates that ‘qGetTLSAddr’ is not supported bythe stub.
‘qGetTIBAddr:thread-id ’Fetch address of the Windows OS specific Thread Information Block.
thread-id is the thread ID associated with the thread.
Reply:
‘XX...’ Hex encoded (big endian) bytes representing the linear address ofthe thread information block.
‘E nn ’ An error occured. This means that either the thread was not found,or the address could not be retrieved.
‘’ An empty reply indicates that ‘qGetTIBAddr’ is not supported bythe stub.
‘qL startflag threadcount nextthread ’Obtain thread information from RTOS. Where: startflag (one hex digit) is oneto indicate the first query and zero to indicate a subsequent query; threadcount(two hex digits) is the maximum number of threads the response packet cancontain; and nextthread (eight hex digits), for subsequent queries (startflag iszero), is returned in the response as argthread.
Don’t use this packet; use the ‘qfThreadInfo’ query instead (see above).
Reply:
‘qM count done argthread thread...’Where: count (two hex digits) is the number of threads beingreturned; done (one hex digit) is zero to indicate more threadsand one indicates no further threads; argthreadid (eight hex dig-its) is nextthread from the request packet; thread . . . is a sequenceof thread IDs from the target. threadid (eight hex digits). Seeremote.c:parse_threadlist_response().
‘qOffsets’Get section offsets that the target used when relocating the downloaded image.
Appendix E: gdb Remote Serial Protocol 483
Reply:
‘Text=xxx;Data=yyy [;Bss=zzz ]’Relocate the Text section by xxx from its original address. Relocatethe Data section by yyy from its original address. If the object fileformat provides segment information (e.g. elf ‘PT_LOAD’ programheaders), gdb will relocate entire segments by the supplied offsets.
Note: while a Bss offset may be included in the response, gdbignores this and instead applies the Data offset to the Bss section.
‘TextSeg=xxx [;DataSeg=yyy ]’Relocate the first segment of the object file, which conventionallycontains program code, to a starting address of xxx. If ‘DataSeg’is specified, relocate the second segment, which conventionally con-tains modifiable data, to a starting address of yyy. gdb will reportan error if the object file does not contain segment information, ordoes not contain at least as many segments as mentioned in thereply. Extra segments are kept at fixed offsets relative to the lastrelocated segment.
‘qP mode thread-id ’Returns information on thread-id. Where: mode is a hex encoded 32 bit mode;thread-id is a thread ID (see [thread-id syntax], page 468).
Don’t use this packet; use the ‘qThreadExtraInfo’ query instead (see below).
Reply: see remote.c:remote_unpack_thread_info_response().
‘QNonStop:1’‘QNonStop:0’
Enter non-stop (‘QNonStop:1’) or all-stop (‘QNonStop:0’) mode. SeeSection E.10 [Remote Non-Stop], page 506, for more information.
Reply:
‘OK’ The request succeeded.
‘E nn ’ An error occurred. nn are hex digits.
‘’ An empty reply indicates that ‘QNonStop’ is not supported by thestub.
This packet is not probed by default; the remote stub must request it, bysupplying an appropriate ‘qSupported’ response (see [qSupported], page 485).Use of this packet is controlled by the set non-stop command; see Section 5.5.2[Non-Stop Mode], page 69.
‘QPassSignals: signal [;signal ]...’Each listed signal should be passed directly to the inferior process. Signals arenumbered identically to continue packets and stop replies (see Section E.3 [StopReply Packets], page 478). Each signal list item should be strictly greater thanthe previous item. These signals do not need to stop the inferior, or be reportedto gdb. All other signals should be reported to gdb. Multiple ‘QPassSignals’packets do not combine; any earlier ‘QPassSignals’ list is completely replaced
484 Debugging with gdb
by the new list. This packet improves performance when using ‘handle signal
nostop noprint pass’.
Reply:
‘OK’ The request succeeded.
‘E nn ’ An error occurred. nn are hex digits.
‘’ An empty reply indicates that ‘QPassSignals’ is not supported bythe stub.
Use of this packet is controlled by the set remote pass-signals command(see Section 20.4 [Remote Configuration], page 226). This packet is not probedby default; the remote stub must request it, by supplying an appropriate‘qSupported’ response (see [qSupported], page 485).
‘qRcmd,command ’command (hex encoded) is passed to the local interpreter for execution. Invalidcommands should be reported using the output string. Before the final resultpacket, the target may also respond with a number of intermediate ‘Ooutput ’console output packets. Implementors should note that providing access to astubs’s interpreter may have security implications.
Reply:
‘OK’ A command response with no output.
‘OUTPUT ’ A command response with the hex encoded output string OUT-PUT.
‘E NN ’ Indicate a badly formed request.
‘’ An empty reply indicates that ‘qRcmd’ is not recognized.
(Note that the qRcmd packet’s name is separated from the command by a ‘,’,not a ‘:’, contrary to the naming conventions above. Please don’t use thispacket as a model for new packets.)
‘qSearch:memory:address;length;search-pattern ’Search length bytes at address for search-pattern. address and length are en-coded in hex. search-pattern is a sequence of bytes, hex encoded.
Reply:
‘0’ The pattern was not found.
‘1,address’The pattern was found at address.
‘E NN ’ A badly formed request or an error was encountered while searchingmemory.
‘’ An empty reply indicates that ‘qSearch:memory’ is not recognized.
‘QStartNoAckMode’Request that the remote stub disable the normal ‘+’/‘-’ protocol acknowledg-ments (see Section E.11 [Packet Acknowledgment], page 507).
Reply:
Appendix E: gdb Remote Serial Protocol 485
‘OK’ The stub has switched to no-acknowledgment mode. gdb acknowl-edges this reponse, but neither the stub nor gdb shall send orexpect further ‘+’/‘-’ acknowledgments in the current connection.
‘’ An empty reply indicates that the stub does not supportno-acknowledgment mode.
‘qSupported [:gdbfeature [;gdbfeature ]... ]’Tell the remote stub about features supported by gdb, and query the stub forfeatures it supports. This packet allows gdb and the remote stub to take advan-tage of each others’ features. ‘qSupported’ also consolidates multiple featureprobes at startup, to improve gdb performance—a single larger packet per-forms better than multiple smaller probe packets on high-latency links. Somefeatures may enable behavior which must not be on by default, e.g. becauseit would confuse older clients or stubs. Other features may describe packetswhich could be automatically probed for, but are not. These features must bereported before gdb will use them. This “default unsupported” behavior isnot appropriate for all packets, but it helps to keep the initial connection timeunder control with new versions of gdb which support increasing numbers ofpackets.
Reply:
‘stubfeature [;stubfeature ]...’The stub supports or does not support each returned stubfeature,depending on the form of each stubfeature (see below for the pos-sible forms).
‘’ An empty reply indicates that ‘qSupported’ is not recognized, orthat no features needed to be reported to gdb.
The allowed forms for each feature (either a gdbfeature in the ‘qSupported’packet, or a stubfeature in the response) are:
‘name=value ’The remote protocol feature name is supported, and associatedwith the specified value. The format of value depends on the fea-ture, but it must not include a semicolon.
‘name+’ The remote protocol feature name is supported, and does not needan associated value.
‘name-’ The remote protocol feature name is not supported.
‘name?’ The remote protocol feature name may be supported, and gdbshould auto-detect support in some other way when it is needed.This form will not be used for gdbfeature notifications, but may beused for stubfeature responses.
Whenever the stub receives a ‘qSupported’ request, the supplied set of gdbfeatures should override any previous request. This allows gdb to put the stubin a known state, even if the stub had previously been communicating with adifferent version of gdb.
The following values of gdbfeature (for the packet sent by gdb) are defined:
486 Debugging with gdb
‘multiprocess’This feature indicates whether gdb supports multiprocess exten-sions to the remote protocol. gdb does not use such extensionsunless the stub also reports that it supports them by including‘multiprocess+’ in its ‘qSupported’ reply. See [multiprocess ex-tensions], page 489, for details.
‘xmlRegisters’This feature indicates that gdb supports the XML target descrip-tion. If the stub sees ‘xmlRegisters=’ with target specific stringsseparated by a comma, it will report register description.
‘qRelocInsn’This feature indicates whether gdb supports the ‘qRelocInsn’packet (see Section E.6 [Relocate instruction reply packet],page 496).
Stubs should ignore any unknown values for gdbfeature. Any gdb which sendsa ‘qSupported’ packet supports receiving packets of unlimited length (ear-lier versions of gdb may reject overly long responses). Additional values forgdbfeature may be defined in the future to let the stub take advantage of newfeatures in gdb, e.g. incompatible improvements in the remote protocol—the‘multiprocess’ feature is an example of such a feature. The stub’s reply shouldbe independent of the gdbfeature entries sent by gdb; first gdb describes all thefeatures it supports, and then the stub replies with all the features it supports.
Similarly, gdb will silently ignore unrecognized stub feature responses, as longas each response uses one of the standard forms.
Some features are flags. A stub which supports a flag feature should respondwith a ‘+’ form response. Other features require values, and the stub shouldrespond with an ‘=’ form response.
Each feature has a default value, which gdb will use if ‘qSupported’ is notavailable or if the feature is not mentioned in the ‘qSupported’ response. Thedefault values are fixed; a stub is free to omit any feature responses that matchthe defaults.
Not all features can be probed, but for those which can, the probing mechanismis useful: in some cases, a stub’s internal architecture may not allow the protocollayer to know some information about the underlying target in advance. Thisis especially common in stubs which may be configured for multiple targets.
These are the currently defined stub features and their properties:
Feature Name Value Required Default Probe Allowed
‘PacketSize’ Yes ‘-’ No
‘qXfer:auxv:read’ No ‘-’ Yes
‘qXfer:features:read’ No ‘-’ Yes

Appendix E: gdb Remote Serial Protocol 487
‘qXfer:libraries:read’ No ‘-’ Yes
‘qXfer:memory-map:read’ No ‘-’ Yes
‘qXfer:sdata:read’ No ‘-’ Yes
‘qXfer:spu:read’ No ‘-’ Yes
‘qXfer:spu:write’ No ‘-’ Yes
‘qXfer:siginfo:read’ No ‘-’ Yes
‘qXfer:siginfo:write’ No ‘-’ Yes
‘qXfer:threads:read’ No ‘-’ Yes
‘qXfer:traceframe-info:read’ No ‘-’ Yes
‘qXfer:fdpic:read’ No ‘-’ Yes
‘QNonStop’ No ‘-’ Yes
‘QPassSignals’ No ‘-’ Yes
‘QStartNoAckMode’ No ‘-’ Yes
‘multiprocess’ No ‘-’ No
‘ConditionalTracepoints’ No ‘-’ No
‘ReverseContinue’ No ‘-’ No
‘ReverseStep’ No ‘-’ No
‘TracepointSource’ No ‘-’ No
‘QAllow’ No ‘-’ No
‘QDisableRandomization’ No ‘-’ No
‘EnableDisableTracepoints’ No ‘-’ No
‘tracenz’ No ‘-’ No
These are the currently defined stub features, in more detail:
488 Debugging with gdb
‘PacketSize=bytes ’The remote stub can accept packets up to at least bytes in length.gdb will send packets up to this size for bulk transfers, and willnever send larger packets. This is a limit on the data characters inthe packet, including the frame and checksum. There is no trailingNUL byte in a remote protocol packet; if the stub stores packets in aNUL-terminated format, it should allow an extra byte in its bufferfor the NUL. If this stub feature is not supported, gdb guessesbased on the size of the ‘g’ packet response.
‘qXfer:auxv:read’The remote stub understands the ‘qXfer:auxv:read’ packet (see[qXfer auxiliary vector read], page 492).
‘qXfer:features:read’The remote stub understands the ‘qXfer:features:read’ packet(see [qXfer target description read], page 492).
‘qXfer:libraries:read’The remote stub understands the ‘qXfer:libraries:read’ packet(see [qXfer library list read], page 492).
‘qXfer:libraries-svr4:read’The remote stub understands the ‘qXfer:libraries-svr4:read’packet (see [qXfer svr4 library list read], page 492).
‘qXfer:memory-map:read’The remote stub understands the ‘qXfer:memory-map:read’ packet(see [qXfer memory map read], page 492).
‘qXfer:sdata:read’The remote stub understands the ‘qXfer:sdata:read’ packet (see[qXfer sdata read], page 493).
‘qXfer:spu:read’The remote stub understands the ‘qXfer:spu:read’ packet (see[qXfer spu read], page 493).
‘qXfer:spu:write’The remote stub understands the ‘qXfer:spu:write’ packet (see[qXfer spu write], page 495).
‘qXfer:siginfo:read’The remote stub understands the ‘qXfer:siginfo:read’ packet(see [qXfer siginfo read], page 493).
‘qXfer:siginfo:write’The remote stub understands the ‘qXfer:siginfo:write’ packet(see [qXfer siginfo write], page 494).
‘qXfer:threads:read’The remote stub understands the ‘qXfer:threads:read’ packet(see [qXfer threads read], page 493).
Appendix E: gdb Remote Serial Protocol 489
‘qXfer:traceframe-info:read’The remote stub understands the ‘qXfer:traceframe-info:read’packet (see [qXfer traceframe info read], page 493).
‘qXfer:fdpic:read’The remote stub understands the ‘qXfer:fdpic:read’ packet (see[qXfer fdpic loadmap read], page 494).
‘QNonStop’The remote stub understands the ‘QNonStop’ packet (see[QNonStop], page 483).
‘QPassSignals’The remote stub understands the ‘QPassSignals’ packet (see[QPassSignals], page 483).
‘QStartNoAckMode’The remote stub understands the ‘QStartNoAckMode’ packet andprefers to operate in no-acknowledgment mode. See Section E.11[Packet Acknowledgment], page 507.
‘multiprocess’The remote stub understands the multiprocess extensions to theremote protocol syntax. The multiprocess extensions affect thesyntax of thread IDs in both packets and replies (see [thread-idsyntax], page 468), and add process IDs to the ‘D’ packet and ‘W’ and‘X’ replies. Note that reporting this feature indicates support forthe syntactic extensions only, not that the stub necessarily supportsdebugging of more than one process at a time. The stub must notuse multiprocess extensions in packet replies unless gdb has alsoindicated it supports them in its ‘qSupported’ request.
‘qXfer:osdata:read’The remote stub understands the ‘qXfer:osdata:read’ packet((see [qXfer osdata read], page 494).
‘ConditionalTracepoints’The remote stub accepts and implements conditional expressionsdefined for tracepoints (see Section 13.1.4 [Tracepoint Conditions],page 143).
‘ReverseContinue’The remote stub accepts and implements the reverse continuepacket (see [bc], page 469).
‘ReverseStep’The remote stub accepts and implements the reverse step packet(see [bs], page 470).
‘TracepointSource’The remote stub understands the ‘QTDPsrc’ packet that suppliesthe source form of tracepoint definitions.
490 Debugging with gdb
‘QAllow’ The remote stub understands the ‘QAllow’ packet.
‘QDisableRandomization’The remote stub understands the ‘QDisableRandomization’packet.
‘StaticTracepoint’The remote stub supports static tracepoints.
‘InstallInTrace’The remote stub supports installing tracepoint in tracing.
‘EnableDisableTracepoints’The remote stub supports the ‘QTEnable’ (see [QTEnable],page 499) and ‘QTDisable’ (see [QTDisable], page 499) packetsthat allow tracepoints to be enabled and disabled while a traceexperiment is running.
‘tracenz’ The remote stub supports the ‘tracenz’ bytecode for collectingstrings. See Section F.2 [Bytecode Descriptions], page 527 for de-tails about the bytecode.
‘qSymbol::’Notify the target that gdb is prepared to serve symbol lookup requests. Acceptrequests from the target for the values of symbols.
Reply:
‘OK’ The target does not need to look up any (more) symbols.
‘qSymbol:sym_name ’The target requests the value of symbol sym name (hexencoded). gdb may provide the value by using the‘qSymbol:sym_value:sym_name ’ message, described below.
‘qSymbol:sym_value:sym_name ’Set the value of sym name to sym value.
sym name (hex encoded) is the name of a symbol whose value the target haspreviously requested.
sym value (hex) is the value for symbol sym name. If gdb cannot supply avalue for sym name, then this field will be empty.
Reply:
‘OK’ The target does not need to look up any (more) symbols.
‘qSymbol:sym_name ’The target requests the value of a new symbol sym name (hexencoded). gdb will continue to supply the values of symbols (ifavailable), until the target ceases to request them.
Appendix E: gdb Remote Serial Protocol 491
‘qTBuffer’‘QTBuffer’‘QTDisconnected’‘QTDP’‘QTDPsrc’‘QTDV’‘qTfP’‘qTfV’‘QTFrame’‘qTMinFTPILen’
See Section E.6 [Tracepoint Packets], page 496.
‘qThreadExtraInfo,thread-id ’Obtain a printable string description of a thread’s attributes from the targetOS. thread-id is a thread ID; see [thread-id syntax], page 468. This string maycontain anything that the target OS thinks is interesting for gdb to tell theuser about the thread. The string is displayed in gdb’s info threads display.Some examples of possible thread extra info strings are ‘Runnable’, or ‘Blockedon Mutex’.
Reply:
‘XX...’ Where ‘XX...’ is a hex encoding of ascii data, comprising theprintable string containing the extra information about the thread’sattributes.
(Note that the qThreadExtraInfo packet’s name is separated from the com-mand by a ‘,’, not a ‘:’, contrary to the naming conventions above. Pleasedon’t use this packet as a model for new packets.)
‘QTNotes’
‘qTP’
‘QTSave’
‘qTsP’
‘qTsV’‘QTStart’‘QTStop’‘QTEnable’‘QTDisable’‘QTinit’‘QTro’‘qTStatus’‘qTV’‘qTfSTM’‘qTsSTM’‘qTSTMat’ See Section E.6 [Tracepoint Packets], page 496.
‘qXfer:object:read:annex:offset,length ’Read uninterpreted bytes from the target’s special data area identified by thekeyword object. Request length bytes starting at offset bytes into the data.
492 Debugging with gdb
The content and encoding of annex is specific to object; it can supply additionaldetails about what data to access.
Here are the specific requests of this form defined so far. All‘qXfer:object:read:...’ requests use the same reply formats, listed below.
‘qXfer:auxv:read::offset,length ’Access the target’s auxiliary vector. See Section 10.15 [OS Infor-mation], page 121. Note annex must be empty.
This packet is not probed by default; the remote stub must re-quest it, by supplying an appropriate ‘qSupported’ response (see[qSupported], page 485).
‘qXfer:features:read:annex:offset,length ’Access the target description. See Appendix G [Target Descrip-tions], page 537. The annex specifies which XML document to ac-cess. The main description is always loaded from the ‘target.xml’annex.
This packet is not probed by default; the remote stub must re-quest it, by supplying an appropriate ‘qSupported’ response (see[qSupported], page 485).
‘qXfer:libraries:read:annex:offset,length ’Access the target’s list of loaded libraries. See Section E.14 [LibraryList Format], page 520. The annex part of the generic ‘qXfer’packet must be empty (see [qXfer read], page 491).
Targets which maintain a list of libraries in the program’s memorydo not need to implement this packet; it is designed for platformswhere the operating system manages the list of loaded libraries.
This packet is not probed by default; the remote stub must re-quest it, by supplying an appropriate ‘qSupported’ response (see[qSupported], page 485).
‘qXfer:libraries-svr4:read:annex:offset,length ’Access the target’s list of loaded libraries when the target is anSVR4 platform. See Section E.15 [Library List Format for SVR4Targets], page 521. The annex part of the generic ‘qXfer’ packetmust be empty (see [qXfer read], page 491).
This packet is optional for better performance on SVR4 targets.gdb uses memory read packets to read the SVR4 library list oth-erwise.
This packet is not probed by default; the remote stub must re-quest it, by supplying an appropriate ‘qSupported’ response (see[qSupported], page 485).
‘qXfer:memory-map:read::offset,length ’Access the target’s memory-map. See Section E.16 [Memory MapFormat], page 521. The annex part of the generic ‘qXfer’ packetmust be empty (see [qXfer read], page 491).
Appendix E: gdb Remote Serial Protocol 493
This packet is not probed by default; the remote stub must re-quest it, by supplying an appropriate ‘qSupported’ response (see[qSupported], page 485).
‘qXfer:sdata:read::offset,length ’Read contents of the extra collected static tracepoint marker in-formation. The annex part of the generic ‘qXfer’ packet must beempty (see [qXfer read], page 491). See Section 13.1.6 [TracepointAction Lists], page 144.
This packet is not probed by default; the remote stub must re-quest it, by supplying an appropriate ‘qSupported’ response (see[qSupported], page 485).
‘qXfer:siginfo:read::offset,length ’Read contents of the extra signal information on the target system.The annex part of the generic ‘qXfer’ packet must be empty (see[qXfer read], page 491).
This packet is not probed by default; the remote stub must re-quest it, by supplying an appropriate ‘qSupported’ response (see[qSupported], page 485).
‘qXfer:spu:read:annex:offset,length ’Read contents of an spufs file on the target system. The annexspecifies which file to read; it must be of the form ‘id/name ’, whereid specifies an SPU context ID in the target process, and nameidentifes the spufs file in that context to be accessed.
This packet is not probed by default; the remote stub must re-quest it, by supplying an appropriate ‘qSupported’ response (see[qSupported], page 485).
‘qXfer:threads:read::offset,length ’Access the list of threads on target. See Section E.17 [Thread ListFormat], page 522. The annex part of the generic ‘qXfer’ packetmust be empty (see [qXfer read], page 491).
This packet is not probed by default; the remote stub must re-quest it, by supplying an appropriate ‘qSupported’ response (see[qSupported], page 485).
‘qXfer:traceframe-info:read::offset,length ’Return a description of the current traceframe’s contents. SeeSection E.18 [Traceframe Info Format], page 523. The annex partof the generic ‘qXfer’ packet must be empty (see [qXfer read],page 491).
This packet is not probed by default; the remote stub must re-quest it, by supplying an appropriate ‘qSupported’ response (see[qSupported], page 485).

494 Debugging with gdb
‘qXfer:fdpic:read:annex:offset,length ’Read contents of loadmaps on the target system. The annex, either‘exec’ or ‘interp’, specifies which loadmap, executable loadmap orinterpreter loadmap to read.
This packet is not probed by default; the remote stub must re-quest it, by supplying an appropriate ‘qSupported’ response (see[qSupported], page 485).
‘qXfer:osdata:read::offset,length ’Access the target’s operating system information. See Appendix H[Operating System Information], page 545.
Reply:
‘m data ’ Data data (see [Binary Data], page 467) has been read from thetarget. There may be more data at a higher address (although itis permitted to return ‘m’ even for the last valid block of data, aslong as at least one byte of data was read). data may have fewerbytes than the length in the request.
‘l data ’ Data data (see [Binary Data], page 467) has been read from thetarget. There is no more data to be read. data may have fewerbytes than the length in the request.
‘l’ The offset in the request is at the end of the data. There is no moredata to be read.
‘E00’ The request was malformed, or annex was invalid.
‘E nn ’ The offset was invalid, or there was an error encountered readingthe data. nn is a hex-encoded errno value.
‘’ An empty reply indicates the object string was not recognized bythe stub, or that the object does not support reading.
‘qXfer:object:write:annex:offset:data...’Write uninterpreted bytes into the target’s special data area identified by thekeyword object, starting at offset bytes into the data. data. . . is the binary-encoded data (see [Binary Data], page 467) to be written. The content andencoding of annex is specific to object; it can supply additional details aboutwhat data to access.
Here are the specific requests of this form defined so far. All‘qXfer:object:write:...’ requests use the same reply formats, listed below.
‘qXfer:siginfo:write::offset:data...’Write data to the extra signal information on the target system.The annex part of the generic ‘qXfer’ packet must be empty (see[qXfer write], page 494).
This packet is not probed by default; the remote stub must re-quest it, by supplying an appropriate ‘qSupported’ response (see[qSupported], page 485).
Appendix E: gdb Remote Serial Protocol 495
‘qXfer:spu:write:annex:offset:data...’Write data to an spufs file on the target system. The annex spec-ifies which file to write; it must be of the form ‘id/name ’, whereid specifies an SPU context ID in the target process, and nameidentifes the spufs file in that context to be accessed.
This packet is not probed by default; the remote stub must re-quest it, by supplying an appropriate ‘qSupported’ response (see[qSupported], page 485).
Reply:
‘nn ’ nn (hex encoded) is the number of bytes written. This may befewer bytes than supplied in the request.
‘E00’ The request was malformed, or annex was invalid.
‘E nn ’ The offset was invalid, or there was an error encountered writingthe data. nn is a hex-encoded errno value.
‘’ An empty reply indicates the object string was not recognized bythe stub, or that the object does not support writing.
‘qXfer:object:operation:...’Requests of this form may be added in the future. When a stub does notrecognize the object keyword, or its support for object does not recognize theoperation keyword, the stub must respond with an empty packet.
‘qAttached:pid ’Return an indication of whether the remote server attached to an existing pro-cess or created a new process. When the multiprocess protocol extensions aresupported (see [multiprocess extensions], page 489), pid is an integer in hex-adecimal format identifying the target process. Otherwise, gdb will omit thepid field and the query packet will be simplified as ‘qAttached’.
This query is used, for example, to know whether the remote process should bedetached or killed when a gdb session is ended with the quit command.
Reply:
‘1’ The remote server attached to an existing process.
‘0’ The remote server created a new process.
‘E NN ’ A badly formed request or an error was encountered.
E.5 Architecture-Specific Protocol Details
This section describes how the remote protocol is applied to specific target architectures.Also see Section G.4 [Standard Target Features], page 542, for details of XML target de-scriptions for each architecture.
E.5.1 ARM
496 Debugging with gdb
E.5.1.1 Breakpoint Kinds
These breakpoint kinds are defined for the ‘Z0’ and ‘Z1’ packets.
2 16-bit Thumb mode breakpoint.
3 32-bit Thumb mode (Thumb-2) breakpoint.
4 32-bit ARM mode breakpoint.
E.5.2 MIPS
E.5.2.1 Register Packet Format
The following g/G packets have previously been defined. In the below, some thirty-two bitregisters are transferred as sixty-four bits. Those registers should be zero/sign extended(which?) to fill the space allocated. Register bytes are transferred in target byte order.The two nibbles within a register byte are transferred most-significant - least-significant.
MIPS32
All registers are transferred as thirty-two bit quantities in the order: 32 general-purpose; sr; lo; hi; bad; cause; pc; 32 floating-point registers; fsr; fir; fp.
MIPS64
All registers are transferred as sixty-four bit quantities (including thirty-two bitregisters such as sr). The ordering is the same as MIPS32.
E.6 Tracepoint Packets
Here we describe the packets gdb uses to implement tracepoints (see Chapter 13 [Trace-points], page 139).
‘QTDP:n:addr:ena:step:pass[:Fflen][:Xlen,bytes][-]’Create a new tracepoint, number n, at addr. If ena is ‘E’, then the tracepoint isenabled; if it is ‘D’, then the tracepoint is disabled. step is the tracepoint’s stepcount, and pass is its pass count. If an ‘F’ is present, then the tracepoint is to bea fast tracepoint, and the flen is the number of bytes that the target should copyelsewhere to make room for the tracepoint. If an ‘X’ is present, it introducesa tracepoint condition, which consists of a hexadecimal length, followed bya comma and hex-encoded bytes, in a manner similar to action encodings asdescribed below. If the trailing ‘-’ is present, further ‘QTDP’ packets will followto specify this tracepoint’s actions.
Replies:
‘OK’ The packet was understood and carried out.
‘qRelocInsn’See Section E.6 [Relocate instruction reply packet], page 496.
‘’ The packet was not recognized.
‘QTDP:-n:addr:[S]action...[-]’Define actions to be taken when a tracepoint is hit. n and addr must be thesame as in the initial ‘QTDP’ packet for this tracepoint. This packet may only
Appendix E: gdb Remote Serial Protocol 497
be sent immediately after another ‘QTDP’ packet that ended with a ‘-’. If thetrailing ‘-’ is present, further ‘QTDP’ packets will follow, specifying more actionsfor this tracepoint.
In the series of action packets for a given tracepoint, at most one can have an‘S’ before its first action. If such a packet is sent, it and the following packetsdefine “while-stepping” actions. Any prior packets define ordinary actions —that is, those taken when the tracepoint is first hit. If no action packet has an‘S’, then all the packets in the series specify ordinary tracepoint actions.
The ‘action...’ portion of the packet is a series of actions, concatenated with-out separators. Each action has one of the following forms:
‘R mask ’ Collect the registers whose bits are set in mask. mask is a hexadec-imal number whose i’th bit is set if register number i should becollected. (The least significant bit is numbered zero.) Note thatmask may be any number of digits long; it may not fit in a 32-bitword.
‘M basereg,offset,len ’Collect len bytes of memory starting at the address in register num-ber basereg, plus offset. If basereg is ‘-1’, then the range has a fixedaddress: offset is the address of the lowest byte to collect. Thebasereg, offset, and len parameters are all unsigned hexadecimalvalues (the ‘-1’ value for basereg is a special case).
‘X len,expr ’Evaluate expr, whose length is len, and collect memory as it directs.expr is an agent expression, as described in Appendix F [AgentExpressions], page 525. Each byte of the expression is encoded asa two-digit hex number in the packet; len is the number of bytes inthe expression (and thus one-half the number of hex digits in thepacket).
Any number of actions may be packed together in a single ‘QTDP’ packet, as longas the packet does not exceed the maximum packet length (400 bytes, for manystubs). There may be only one ‘R’ action per tracepoint, and it must precedeany ‘M’ or ‘X’ actions. Any registers referred to by ‘M’ and ‘X’ actions must becollected by a preceding ‘R’ action. (The “while-stepping” actions are treatedas if they were attached to a separate tracepoint, as far as these restrictions areconcerned.)
Replies:
‘OK’ The packet was understood and carried out.
‘qRelocInsn’See Section E.6 [Relocate instruction reply packet], page 496.
‘’ The packet was not recognized.
‘QTDPsrc:n:addr:type:start:slen:bytes ’Specify a source string of tracepoint n at address addr. This is useful to getaccurate reproduction of the tracepoints originally downloaded at the beginning
498 Debugging with gdb
of the trace run. type is the name of the tracepoint part, such as ‘cond’ for thetracepoint’s conditional expression (see below for a list of types), while bytes isthe string, encoded in hexadecimal.
start is the offset of the bytes within the overall source string, while slen is thetotal length of the source string. This is intended for handling source stringsthat are longer than will fit in a single packet.
The available string types are ‘at’ for the location, ‘cond’ for the conditional,and ‘cmd’ for an action command. gdb sends a separate packet for each com-mand in the action list, in the same order in which the commands are storedin the list.
The target does not need to do anything with source strings except report themback as part of the replies to the ‘qTfP’/‘qTsP’ query packets.
Although this packet is optional, and gdb will only send it if the target replieswith ‘TracepointSource’ See Section E.4 [General Query Packets], page 479, itmakes both disconnected tracing and trace files much easier to use. Otherwisethe user must be careful that the tracepoints in effect while looking at traceframes are identical to the ones in effect during the trace run; even a smalldiscrepancy could cause ‘tdump’ not to work, or a particular trace frame not befound.
‘QTDV:n:value ’Create a new trace state variable, number n, with an initial value of value,which is a 64-bit signed integer. Both n and value are encoded as hexadecimalvalues. gdb has the option of not using this packet for initial values of zero;the target should simply create the trace state variables as they are mentionedin expressions.
‘QTFrame:n ’Select the n’th tracepoint frame from the buffer, and use the register and mem-ory contents recorded there to answer subsequent request packets from gdb.
A successful reply from the stub indicates that the stub has found the requestedframe. The response is a series of parts, concatenated without separators,describing the frame we selected. Each part has one of the following forms:
‘F f ’ The selected frame is number n in the trace frame buffer; f is ahexadecimal number. If f is ‘-1’, then there was no frame matchingthe criteria in the request packet.
‘T t ’ The selected trace frame records a hit of tracepoint number t; t isa hexadecimal number.
‘QTFrame:pc:addr ’Like ‘QTFrame:n ’, but select the first tracepoint frame after the currently se-lected frame whose PC is addr; addr is a hexadecimal number.
‘QTFrame:tdp:t ’Like ‘QTFrame:n ’, but select the first tracepoint frame after the currently se-lected frame that is a hit of tracepoint t; t is a hexadecimal number.
Appendix E: gdb Remote Serial Protocol 499
‘QTFrame:range:start:end ’Like ‘QTFrame:n ’, but select the first tracepoint frame after the currently se-lected frame whose PC is between start (inclusive) and end (inclusive); startand end are hexadecimal numbers.
‘QTFrame:outside:start:end ’Like ‘QTFrame:range:start:end ’, but select the first frame outside the givenrange of addresses (exclusive).
‘qTMinFTPILen’This packet requests the minimum length of instruction at which a fast trace-point (see Section 13.1 [Set Tracepoints], page 139) may be placed. For instance,on the 32-bit x86 architecture, it is possible to use a 4-byte jump, but it de-pends on the target system being able to create trampolines in the first 64K ofmemory, which might or might not be possible for that system. So the reply tothis packet will be 4 if it is able to arrange for that.
Replies:
‘0’ The minimum instruction length is currently unknown.
‘length ’ The minimum instruction length is length, where length is greateror equal to 1. length is a hexadecimal number. A reply of 1 meansthat a fast tracepoint may be placed on any instruction regardlessof size.
‘E’ An error has occurred.
‘’ An empty reply indicates that the request is not supported by thestub.
‘QTStart’ Begin the tracepoint experiment. Begin collecting data from tracepoint hitsin the trace frame buffer. This packet supports the ‘qRelocInsn’ reply (seeSection E.6 [Relocate instruction reply packet], page 496).
‘QTStop’ End the tracepoint experiment. Stop collecting trace frames.
‘QTEnable:n:addr ’Enable tracepoint n at address addr in a started tracepoint experiment. If thetracepoint was previously disabled, then collection of data from it will resume.
‘QTDisable:n:addr ’Disable tracepoint n at address addr in a started tracepoint experiment. Nomore data will be collected from the tracepoint unless ‘QTEnable:n:addr ’ issubsequently issued.
‘QTinit’ Clear the table of tracepoints, and empty the trace frame buffer.
‘QTro:start1,end1:start2,end2:...’Establish the given ranges of memory as “transparent”. The stub will answerrequests for these ranges from memory’s current contents, if they were notcollected as part of the tracepoint hit.
gdb uses this to mark read-only regions of memory, like those containing pro-gram code. Since these areas never change, they should still have the same
500 Debugging with gdb
contents they did when the tracepoint was hit, so there’s no reason for the stubto refuse to provide their contents.
‘QTDisconnected:value ’Set the choice to what to do with the tracing run when gdb disconnects fromthe target. A value of 1 directs the target to continue the tracing run, while 0tells the target to stop tracing if gdb is no longer in the picture.
‘qTStatus’Ask the stub if there is a trace experiment running right now.
The reply has the form:
‘Trunning [;field ]...’running is a single digit 1 if the trace is presently running, or 0 ifnot. It is followed by semicolon-separated optional fields that anagent may use to report additional status.
If the trace is not running, the agent may report any of several explanations asone of the optional fields:
‘tnotrun:0’No trace has been run yet.
‘tstop[:text]:0’The trace was stopped by a user-originated stop command. Theoptional text field is a user-supplied string supplied as part of thestop command (for instance, an explanation of why the trace wasstopped manually). It is hex-encoded.
‘tfull:0’ The trace stopped because the trace buffer filled up.
‘tdisconnected:0’The trace stopped because gdb disconnected from the target.
‘tpasscount:tpnum ’The trace stopped because tracepoint tpnum exceeded its passcount.
‘terror:text:tpnum ’The trace stopped because tracepoint tpnum had an error. Thestring text is available to describe the nature of the error (for in-stance, a divide by zero in the condition expression). text is hexencoded.
‘tunknown:0’The trace stopped for some other reason.
Additional optional fields supply statistical and other information. Althoughnot required, they are extremely useful for users monitoring the progress of atrace run. If a trace has stopped, and these numbers are reported, they mustreflect the state of the just-stopped trace.
‘tframes:n ’The number of trace frames in the buffer.
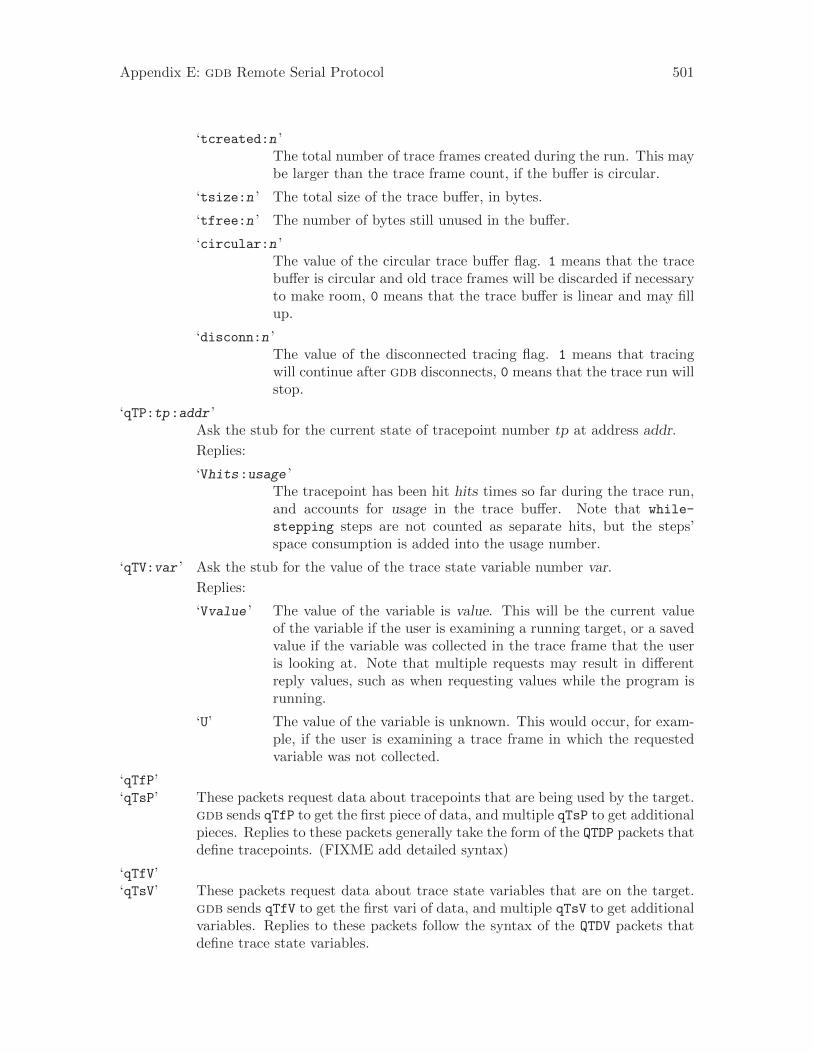
Appendix E: gdb Remote Serial Protocol 501
‘tcreated:n ’The total number of trace frames created during the run. This maybe larger than the trace frame count, if the buffer is circular.
‘tsize:n ’ The total size of the trace buffer, in bytes.
‘tfree:n ’ The number of bytes still unused in the buffer.
‘circular:n ’The value of the circular trace buffer flag. 1 means that the tracebuffer is circular and old trace frames will be discarded if necessaryto make room, 0 means that the trace buffer is linear and may fillup.
‘disconn:n ’The value of the disconnected tracing flag. 1 means that tracingwill continue after gdb disconnects, 0 means that the trace run willstop.
‘qTP:tp:addr ’Ask the stub for the current state of tracepoint number tp at address addr.
Replies:
‘Vhits:usage ’The tracepoint has been hit hits times so far during the trace run,and accounts for usage in the trace buffer. Note that while-
stepping steps are not counted as separate hits, but the steps’space consumption is added into the usage number.
‘qTV:var ’ Ask the stub for the value of the trace state variable number var.
Replies:
‘Vvalue ’ The value of the variable is value. This will be the current valueof the variable if the user is examining a running target, or a savedvalue if the variable was collected in the trace frame that the useris looking at. Note that multiple requests may result in differentreply values, such as when requesting values while the program isrunning.
‘U’ The value of the variable is unknown. This would occur, for exam-ple, if the user is examining a trace frame in which the requestedvariable was not collected.
‘qTfP’‘qTsP’ These packets request data about tracepoints that are being used by the target.
gdb sends qTfP to get the first piece of data, and multiple qTsP to get additionalpieces. Replies to these packets generally take the form of the QTDP packets thatdefine tracepoints. (FIXME add detailed syntax)
‘qTfV’‘qTsV’ These packets request data about trace state variables that are on the target.
gdb sends qTfV to get the first vari of data, and multiple qTsV to get additionalvariables. Replies to these packets follow the syntax of the QTDV packets thatdefine trace state variables.
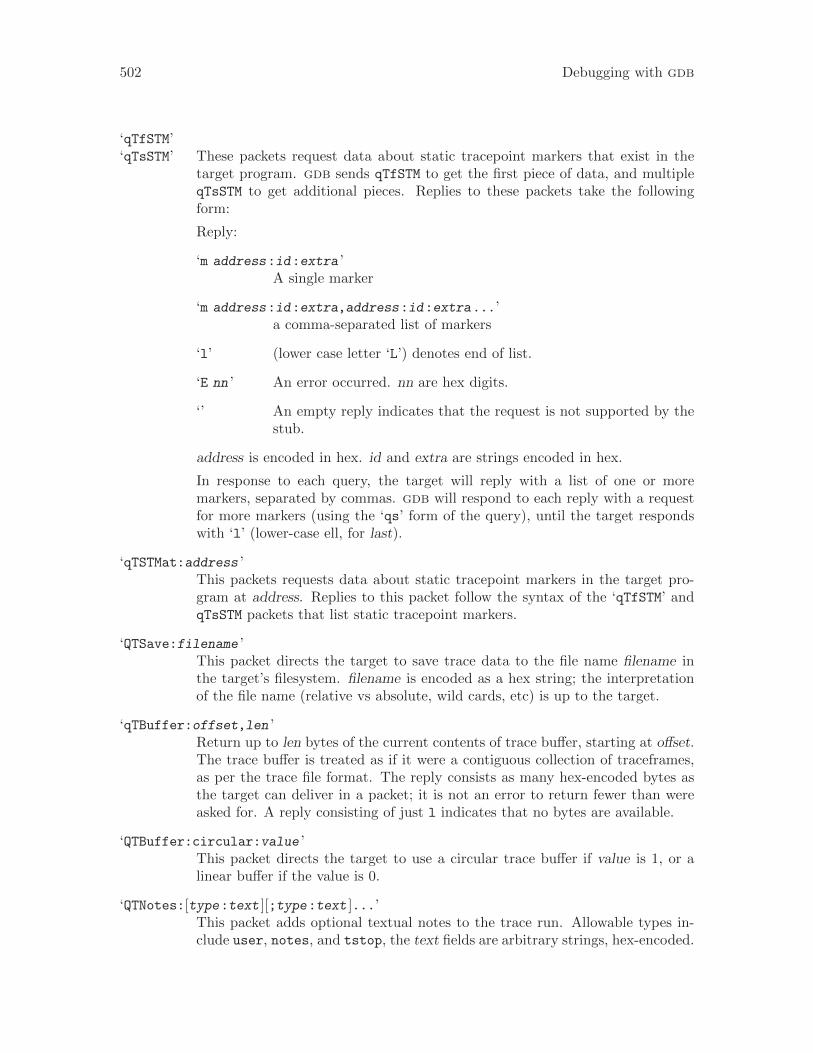
502 Debugging with gdb
‘qTfSTM’‘qTsSTM’ These packets request data about static tracepoint markers that exist in the
target program. gdb sends qTfSTM to get the first piece of data, and multipleqTsSTM to get additional pieces. Replies to these packets take the followingform:
Reply:
‘m address:id:extra ’A single marker
‘m address:id:extra,address:id:extra...’a comma-separated list of markers
‘l’ (lower case letter ‘L’) denotes end of list.
‘E nn ’ An error occurred. nn are hex digits.
‘’ An empty reply indicates that the request is not supported by thestub.
address is encoded in hex. id and extra are strings encoded in hex.
In response to each query, the target will reply with a list of one or moremarkers, separated by commas. gdb will respond to each reply with a requestfor more markers (using the ‘qs’ form of the query), until the target respondswith ‘l’ (lower-case ell, for last).
‘qTSTMat:address ’This packets requests data about static tracepoint markers in the target pro-gram at address. Replies to this packet follow the syntax of the ‘qTfSTM’ andqTsSTM packets that list static tracepoint markers.
‘QTSave:filename ’This packet directs the target to save trace data to the file name filename inthe target’s filesystem. filename is encoded as a hex string; the interpretationof the file name (relative vs absolute, wild cards, etc) is up to the target.
‘qTBuffer:offset,len ’Return up to len bytes of the current contents of trace buffer, starting at offset.The trace buffer is treated as if it were a contiguous collection of traceframes,as per the trace file format. The reply consists as many hex-encoded bytes asthe target can deliver in a packet; it is not an error to return fewer than wereasked for. A reply consisting of just l indicates that no bytes are available.
‘QTBuffer:circular:value ’This packet directs the target to use a circular trace buffer if value is 1, or alinear buffer if the value is 0.
‘QTNotes:[type:text ][;type:text ]...’This packet adds optional textual notes to the trace run. Allowable types in-clude user, notes, and tstop, the text fields are arbitrary strings, hex-encoded.
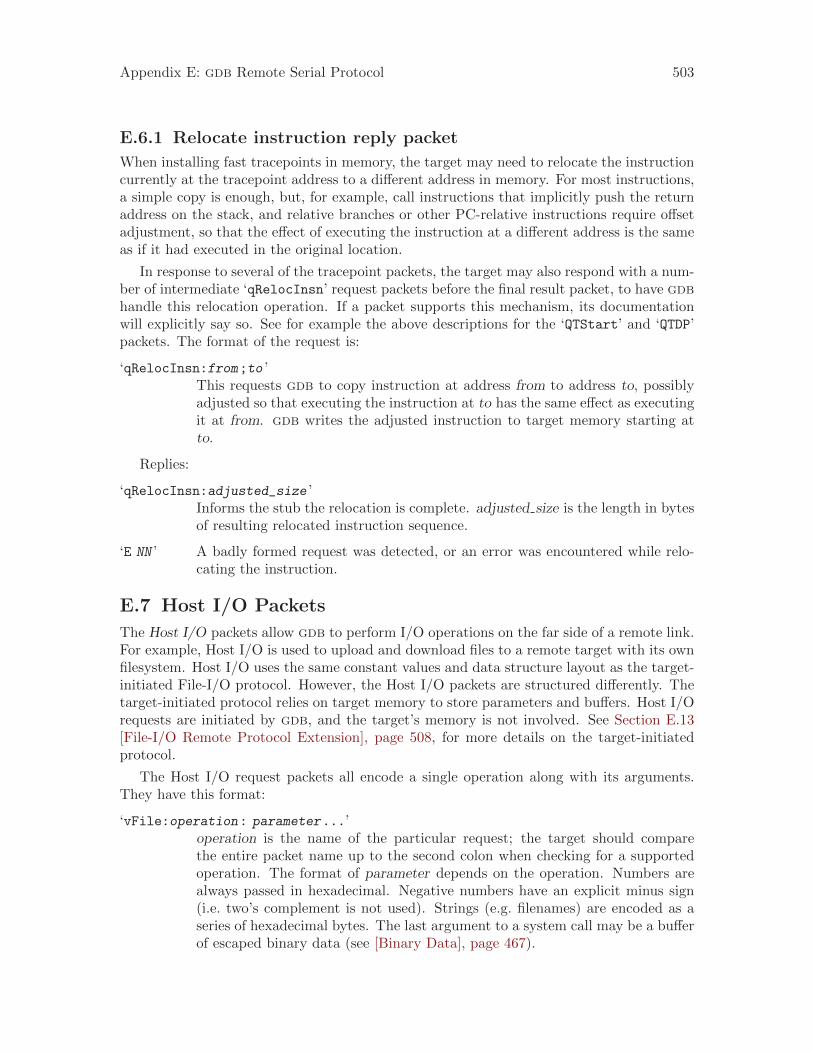
Appendix E: gdb Remote Serial Protocol 503
E.6.1 Relocate instruction reply packet
When installing fast tracepoints in memory, the target may need to relocate the instructioncurrently at the tracepoint address to a different address in memory. For most instructions,a simple copy is enough, but, for example, call instructions that implicitly push the returnaddress on the stack, and relative branches or other PC-relative instructions require offsetadjustment, so that the effect of executing the instruction at a different address is the sameas if it had executed in the original location.
In response to several of the tracepoint packets, the target may also respond with a num-ber of intermediate ‘qRelocInsn’ request packets before the final result packet, to have gdbhandle this relocation operation. If a packet supports this mechanism, its documentationwill explicitly say so. See for example the above descriptions for the ‘QTStart’ and ‘QTDP’packets. The format of the request is:
‘qRelocInsn:from;to ’This requests gdb to copy instruction at address from to address to, possiblyadjusted so that executing the instruction at to has the same effect as executingit at from. gdb writes the adjusted instruction to target memory starting atto.
Replies:
‘qRelocInsn:adjusted_size ’Informs the stub the relocation is complete. adjusted size is the length in bytesof resulting relocated instruction sequence.
‘E NN ’ A badly formed request was detected, or an error was encountered while relo-cating the instruction.
E.7 Host I/O Packets
The Host I/O packets allow gdb to perform I/O operations on the far side of a remote link.For example, Host I/O is used to upload and download files to a remote target with its ownfilesystem. Host I/O uses the same constant values and data structure layout as the target-initiated File-I/O protocol. However, the Host I/O packets are structured differently. Thetarget-initiated protocol relies on target memory to store parameters and buffers. Host I/Orequests are initiated by gdb, and the target’s memory is not involved. See Section E.13[File-I/O Remote Protocol Extension], page 508, for more details on the target-initiatedprotocol.
The Host I/O request packets all encode a single operation along with its arguments.They have this format:
‘vFile:operation: parameter...’operation is the name of the particular request; the target should comparethe entire packet name up to the second colon when checking for a supportedoperation. The format of parameter depends on the operation. Numbers arealways passed in hexadecimal. Negative numbers have an explicit minus sign(i.e. two’s complement is not used). Strings (e.g. filenames) are encoded as aseries of hexadecimal bytes. The last argument to a system call may be a bufferof escaped binary data (see [Binary Data], page 467).
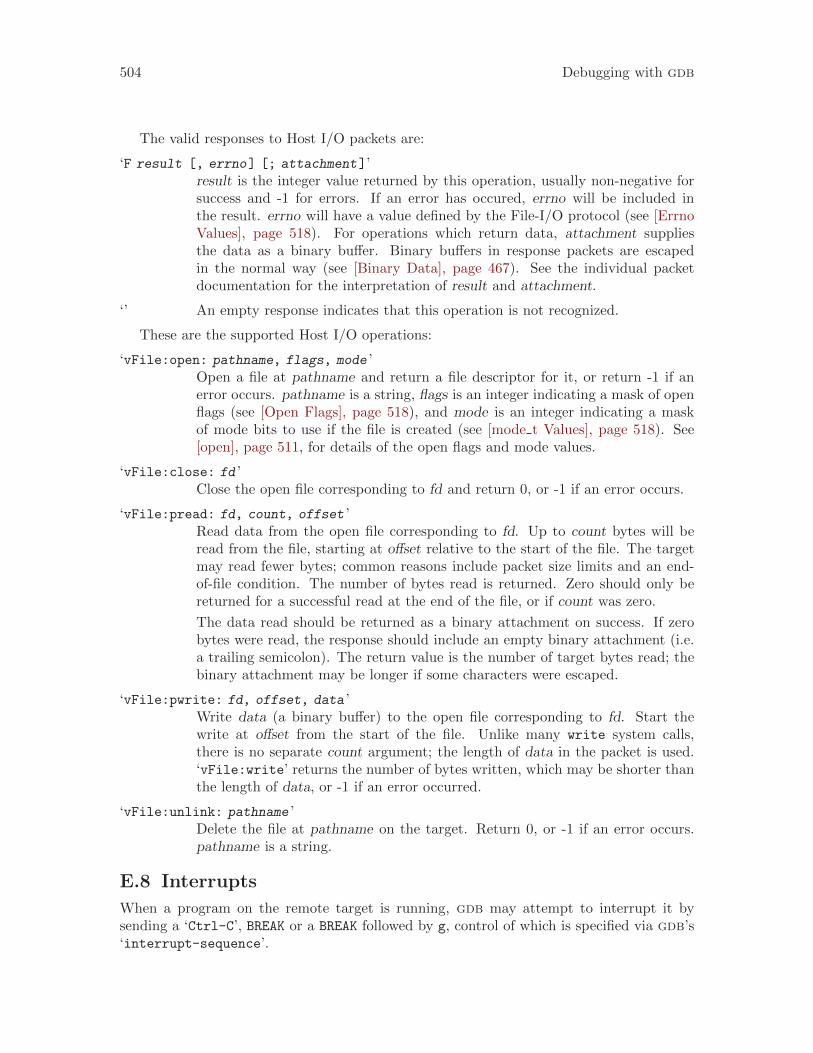
504 Debugging with gdb
The valid responses to Host I/O packets are:
‘F result [, errno] [; attachment]’result is the integer value returned by this operation, usually non-negative forsuccess and -1 for errors. If an error has occured, errno will be included inthe result. errno will have a value defined by the File-I/O protocol (see [ErrnoValues], page 518). For operations which return data, attachment suppliesthe data as a binary buffer. Binary buffers in response packets are escapedin the normal way (see [Binary Data], page 467). See the individual packetdocumentation for the interpretation of result and attachment.
‘’ An empty response indicates that this operation is not recognized.
These are the supported Host I/O operations:
‘vFile:open: pathname, flags, mode ’Open a file at pathname and return a file descriptor for it, or return -1 if anerror occurs. pathname is a string, flags is an integer indicating a mask of openflags (see [Open Flags], page 518), and mode is an integer indicating a maskof mode bits to use if the file is created (see [mode t Values], page 518). See[open], page 511, for details of the open flags and mode values.
‘vFile:close: fd ’Close the open file corresponding to fd and return 0, or -1 if an error occurs.
‘vFile:pread: fd, count, offset ’Read data from the open file corresponding to fd. Up to count bytes will beread from the file, starting at offset relative to the start of the file. The targetmay read fewer bytes; common reasons include packet size limits and an end-of-file condition. The number of bytes read is returned. Zero should only bereturned for a successful read at the end of the file, or if count was zero.
The data read should be returned as a binary attachment on success. If zerobytes were read, the response should include an empty binary attachment (i.e.a trailing semicolon). The return value is the number of target bytes read; thebinary attachment may be longer if some characters were escaped.
‘vFile:pwrite: fd, offset, data ’Write data (a binary buffer) to the open file corresponding to fd. Start thewrite at offset from the start of the file. Unlike many write system calls,there is no separate count argument; the length of data in the packet is used.‘vFile:write’ returns the number of bytes written, which may be shorter thanthe length of data, or -1 if an error occurred.
‘vFile:unlink: pathname ’Delete the file at pathname on the target. Return 0, or -1 if an error occurs.pathname is a string.
E.8 Interrupts
When a program on the remote target is running, gdb may attempt to interrupt it bysending a ‘Ctrl-C’, BREAK or a BREAK followed by g, control of which is specified via gdb’s‘interrupt-sequence’.
Appendix E: gdb Remote Serial Protocol 505
The precise meaning of BREAK is defined by the transport mechanism and may, in fact,be undefined. gdb does not currently define a BREAK mechanism for any of the networkinterfaces except for TCP, in which case gdb sends the telnet BREAK sequence.
‘Ctrl-C’, on the other hand, is defined and implemented for all transport mechanisms.It is represented by sending the single byte 0x03 without any of the usual packet overheaddescribed in the Overview section (see Section E.1 [Overview], page 467). When a 0x03 byteis transmitted as part of a packet, it is considered to be packet data and does not representan interrupt. E.g., an ‘X’ packet (see [X packet], page 476), used for binary downloads, mayinclude an unescaped 0x03 as part of its packet.
BREAK followed by g is also known as Magic SysRq g. When Linux kernel receives thissequence from serial port, it stops execution and connects to gdb.
Stubs are not required to recognize these interrupt mechanisms and the precise meaningassociated with receipt of the interrupt is implementation defined. If the target supportsdebugging of multiple threads and/or processes, it should attempt to interrupt all currently-executing threads and processes. If the stub is successful at interrupting the running pro-gram, it should send one of the stop reply packets (see Section E.3 [Stop Reply Packets],page 478) to gdb as a result of successfully stopping the program in all-stop mode, and astop reply for each stopped thread in non-stop mode. Interrupts received while the programis stopped are discarded.
E.9 Notification Packets
The gdb remote serial protocol includes notifications, packets that require no acknowledg-ment. Both the GDB and the stub may send notifications (although the only notificationsdefined at present are sent by the stub). Notifications carry information without incurringthe round-trip latency of an acknowledgment, and so are useful for low-impact communica-tions where occasional packet loss is not a problem.
A notification packet has the form ‘% data # checksum ’, where data is the content of thenotification, and checksum is a checksum of data, computed and formatted as for ordinarygdb packets. A notification’s data never contains ‘$’, ‘%’ or ‘#’ characters. Upon receivinga notification, the recipient sends no ‘+’ or ‘-’ to acknowledge the notification’s receipt orto report its corruption.
Every notification’s data begins with a name, which contains no colon characters, fol-lowed by a colon character.
Recipients should silently ignore corrupted notifications and notifications they do not un-derstand. Recipients should restart timeout periods on receipt of a well-formed notification,whether or not they understand it.
Senders should only send the notifications described here when this protocol descriptionspecifies that they are permitted. In the future, we may extend the protocol to permitexisting notifications in new contexts; this rule helps older senders avoid confusing newerrecipients.
(Older versions of gdb ignore bytes received until they see the ‘$’ byte that begins anordinary packet, so new stubs may transmit notifications without fear of confusing olderclients. There are no notifications defined for gdb to send at the moment, but we assumethat most older stubs would ignore them, as well.)
The following notification packets from the stub to gdb are defined:
506 Debugging with gdb
‘Stop: reply ’Report an asynchronous stop event in non-stop mode. The reply has the formof a stop reply, as described in Section E.3 [Stop Reply Packets], page 478.Refer to Section E.10 [Remote Non-Stop], page 506, for information on howthese notifications are acknowledged by gdb.
E.10 Remote Protocol Support for Non-Stop Mode
gdb’s remote protocol supports non-stop debugging of multi-threaded programs, as de-scribed in Section 5.5.2 [Non-Stop Mode], page 69. If the stub supports non-stop mode,it should report that to gdb by including ‘QNonStop+’ in its ‘qSupported’ response (see[qSupported], page 485).
gdb typically sends a ‘QNonStop’ packet only when establishing a new connection withthe stub. Entering non-stop mode does not alter the state of any currently-running threads,but targets must stop all threads in any already-attached processes when entering all-stopmode. gdb uses the ‘?’ packet as necessary to probe the target state after a mode change.
In non-stop mode, when an attached process encounters an event that would otherwise bereported with a stop reply, it uses the asynchronous notification mechanism (see Section E.9[Notification Packets], page 505) to inform gdb. In contrast to all-stop mode, where allthreads in all processes are stopped when a stop reply is sent, in non-stop mode only thethread reporting the stop event is stopped. That is, when reporting a ‘S’ or ‘T’ response toindicate completion of a step operation, hitting a breakpoint, or a fault, only the affectedthread is stopped; any other still-running threads continue to run. When reporting a ‘W’ or‘X’ response, all running threads belonging to other attached processes continue to run.
Only one stop reply notification at a time may be pending; if additional stop eventsoccur before gdb has acknowledged the previous notification, they must be queued bythe stub for later synchronous transmission in response to ‘vStopped’ packets from gdb.Because the notification mechanism is unreliable, the stub is permitted to resend a stopreply notification if it believes gdb may not have received it. gdb ignores additional stopreply notifications received before it has finished processing a previous notification and thestub has completed sending any queued stop events.
Otherwise, gdb must be prepared to receive a stop reply notification at any time. Specif-ically, they may appear when gdb is not otherwise reading input from the stub, or whengdb is expecting to read a normal synchronous response or a ‘+’/‘-’ acknowledgment to apacket it has sent. Notification packets are distinct from any other communication fromthe stub so there is no ambiguity.
After receiving a stop reply notification, gdb shall acknowledge it by sending a‘vStopped’ packet (see [vStopped packet], page 476) as a regular, synchronous requestto the stub. Such acknowledgment is not required to happen immediately, as gdb ispermitted to send other, unrelated packets to the stub first, which the stub should processnormally.
Upon receiving a ‘vStopped’ packet, if the stub has other queued stop events to reportto gdb, it shall respond by sending a normal stop reply response. gdb shall then sendanother ‘vStopped’ packet to solicit further responses; again, it is permitted to send other,unrelated packets as well which the stub should process normally.
Appendix E: gdb Remote Serial Protocol 507
If the stub receives a ‘vStopped’ packet and there are no additional stop events to report,the stub shall return an ‘OK’ response. At this point, if further stop events occur, the stubshall send a new stop reply notification, gdb shall accept the notification, and the processshall be repeated.
In non-stop mode, the target shall respond to the ‘?’ packet as follows. First, anyincomplete stop reply notification/‘vStopped’ sequence in progress is abandoned. The targetmust begin a new sequence reporting stop events for all stopped threads, whether or not ithas previously reported those events to gdb. The first stop reply is sent as a synchronousreply to the ‘?’ packet, and subsequent stop replies are sent as responses to ‘vStopped’packets using the mechanism described above. The target must not send asynchronous stopreply notifications until the sequence is complete. If all threads are running when the targetreceives the ‘?’ packet, or if the target is not attached to any process, it shall respond ‘OK’.
E.11 Packet Acknowledgment
By default, when either the host or the target machine receives a packet, the first responseexpected is an acknowledgment: either ‘+’ (to indicate the package was received correctly) or‘-’ (to request retransmission). This mechanism allows the gdb remote protocol to operateover unreliable transport mechanisms, such as a serial line.
In cases where the transport mechanism is itself reliable (such as a pipe or TCP connec-tion), the ‘+’/‘-’ acknowledgments are redundant. It may be desirable to disable them inthat case to reduce communication overhead, or for other reasons. This can be accomplishedby means of the ‘QStartNoAckMode’ packet; see [QStartNoAckMode], page 484.
When in no-acknowledgment mode, neither the stub nor gdb shall send or expect ‘+’/‘-’protocol acknowledgments. The packet and response format still includes the normal check-sum, as described in Section E.1 [Overview], page 467, but the checksum may be ignoredby the receiver.
If the stub supports ‘QStartNoAckMode’ and prefers to operate in no-acknowledgmentmode, it should report that to gdb by including ‘QStartNoAckMode+’ in its response to‘qSupported’; see [qSupported], page 485. If gdb also supports ‘QStartNoAckMode’ and ithas not been disabled via the set remote noack-packet off command (see Section 20.4[Remote Configuration], page 226), gdb may then send a ‘QStartNoAckMode’ packet to thestub. Only then may the stub actually turn off packet acknowledgments. gdb sends a final‘+’ acknowledgment of the stub’s ‘OK’ response, which can be safely ignored by the stub.
Note that set remote noack-packet command only affects negotiation between gdband the stub when subsequent connections are made; it does not affect the protocol ac-knowledgment state for any current connection. Since ‘+’/‘-’ acknowledgments are enabledby default when a new connection is established, there is also no protocol request to re-enable the acknowledgments for the current connection, once disabled.
E.12 Examples
Example sequence of a target being re-started. Notice how the restart does not get anydirect output:
-> R00
<- +
target restarts
508 Debugging with gdb
-> ?
<- +
<- T001:1234123412341234
-> +
Example sequence of a target being stepped by a single instruction:
-> G1445...
<- +
-> s
<- +
time passes
<- T001:1234123412341234
-> +
-> g
<- +
<- 1455...
-> +
E.13 File-I/O Remote Protocol Extension
E.13.1 File-I/O Overview
The File I/O remote protocol extension (short: File-I/O) allows the target to use the host’sfile system and console I/O to perform various system calls. System calls on the targetsystem are translated into a remote protocol packet to the host system, which then performsthe needed actions and returns a response packet to the target system. This simulates filesystem operations even on targets that lack file systems.
The protocol is defined to be independent of both the host and target systems. It uses itsown internal representation of datatypes and values. Both gdb and the target’s gdb stubare responsible for translating the system-dependent value representations into the internalprotocol representations when data is transmitted.
The communication is synchronous. A system call is possible only when gdb is waitingfor a response from the ‘C’, ‘c’, ‘S’ or ‘s’ packets. While gdb handles the request for asystem call, the target is stopped to allow deterministic access to the target’s memory.Therefore File-I/O is not interruptible by target signals. On the other hand, it is possibleto interrupt File-I/O by a user interrupt (‘Ctrl-C’) within gdb.
The target’s request to perform a host system call does not finish the latest ‘C’, ‘c’, ‘S’or ‘s’ action. That means, after finishing the system call, the target returns to continuingthe previous activity (continue, step). No additional continue or step request from gdb isrequired.
(gdb) continue
<- target requests ’system call X’
target is stopped, gdb executes system call
-> gdb returns result
... target continues, gdb returns to wait for the target
<- target hits breakpoint and sends a Txx packet
The protocol only supports I/O on the console and to regular files on the host file system.Character or block special devices, pipes, named pipes, sockets or any other communicationmethod on the host system are not supported by this protocol.
File I/O is not supported in non-stop mode.
Appendix E: gdb Remote Serial Protocol 509
E.13.2 Protocol Basics
The File-I/O protocol uses the F packet as the request as well as reply packet. Since aFile-I/O system call can only occur when gdb is waiting for a response from the continuingor stepping target, the File-I/O request is a reply that gdb has to expect as a result of aprevious ‘C’, ‘c’, ‘S’ or ‘s’ packet. This F packet contains all information needed to allowgdb to call the appropriate host system call:
• A unique identifier for the requested system call.
• All parameters to the system call. Pointers are given as addresses in the target memoryaddress space. Pointers to strings are given as pointer/length pair. Numerical values aregiven as they are. Numerical control flags are given in a protocol-specific representation.
At this point, gdb has to perform the following actions.
• If the parameters include pointer values to data needed as input to a system call, gdbrequests this data from the target with a standard m packet request. This additionalcommunication has to be expected by the target implementation and is handled as anyother m packet.
• gdb translates all value from protocol representation to host representation as needed.Datatypes are coerced into the host types.
• gdb calls the system call.
• It then coerces datatypes back to protocol representation.
• If the system call is expected to return data in buffer space specified by pointer pa-rameters to the call, the data is transmitted to the target using a M or X packet. Thispacket has to be expected by the target implementation and is handled as any other Mor X packet.
Eventually gdb replies with another F packet which contains all necessary informationfor the target to continue. This at least contains
• Return value.
• errno, if has been changed by the system call.
• “Ctrl-C” flag.
After having done the needed type and value coercion, the target continues the latestcontinue or step action.
E.13.3 The F Request Packet
The F request packet has the following format:
‘Fcall-id,parameter...’call-id is the identifier to indicate the host system call to be called. This is justthe name of the function.
parameter. . . are the parameters to the system call. Parameters are hexadeci-mal integer values, either the actual values in case of scalar datatypes, pointersto target buffer space in case of compound datatypes and unspecified memoryareas, or pointer/length pairs in case of string parameters. These are appendedto the call-id as a comma-delimited list. All values are transmitted in ASCIIstring representation, pointer/length pairs separated by a slash.
510 Debugging with gdb
E.13.4 The F Reply Packet
The F reply packet has the following format:
‘Fretcode,errno,Ctrl-C flag;call-specific attachment ’retcode is the return code of the system call as hexadecimal value.
errno is the errno set by the call, in protocol-specific representation. Thisparameter can be omitted if the call was successful.
Ctrl-C flag is only sent if the user requested a break. In this case, errno mustbe sent as well, even if the call was successful. The Ctrl-C flag itself consists ofthe character ‘C’:
F0,0,C
or, if the call was interrupted before the host call has been performed:F-1,4,C
assuming 4 is the protocol-specific representation of EINTR.
E.13.5 The ‘Ctrl-C’ Message
If the ‘Ctrl-C’ flag is set in the gdb reply packet (see Section E.13.4 [The F Reply Packet],page 510), the target should behave as if it had gotten a break message. The meaningfor the target is “system call interrupted by SIGINT”. Consequentially, the target shouldactually stop (as with a break message) and return to gdb with a T02 packet.
It’s important for the target to know in which state the system call was interrupted.There are two possible cases:
• The system call hasn’t been performed on the host yet.
• The system call on the host has been finished.
These two states can be distinguished by the target by the value of the returned errno.If it’s the protocol representation of EINTR, the system call hasn’t been performed. Thisis equivalent to the EINTR handling on POSIX systems. In any other case, the target maypresume that the system call has been finished — successfully or not — and should behaveas if the break message arrived right after the system call.
gdb must behave reliably. If the system call has not been called yet, gdb may send theF reply immediately, setting EINTR as errno in the packet. If the system call on the hosthas been finished before the user requests a break, the full action must be finished by gdb.This requires sending M or X packets as necessary. The F packet may only be sent wheneither nothing has happened or the full action has been completed.
E.13.6 Console I/O
By default and if not explicitly closed by the target system, the file descriptors 0, 1 and 2are connected to the gdb console. Output on the gdb console is handled as any other fileoutput operation (write(1, ...) or write(2, ...)). Console input is handled by gdb sothat after the target read request from file descriptor 0 all following typing is buffered untileither one of the following conditions is met:
• The user types Ctrl-c. The behaviour is as explained above, and the read system callis treated as finished.
• The user presses RET. This is treated as end of input with a trailing newline.
Appendix E: gdb Remote Serial Protocol 511
• The user types Ctrl-d. This is treated as end of input. No trailing character (neithernewline nor ‘Ctrl-D’) is appended to the input.
If the user has typed more characters than fit in the buffer given to the read call, thetrailing characters are buffered in gdb until either another read(0, ...) is requested bythe target, or debugging is stopped at the user’s request.
E.13.7 List of Supported Calls
open
Synopsis:int open(const char *pathname, int flags);
int open(const char *pathname, int flags, mode_t mode);
Request: ‘Fopen,pathptr/len,flags,mode ’
flags is the bitwise OR of the following values:
O_CREAT If the file does not exist it will be created. The host rules apply asfar as file ownership and time stamps are concerned.
O_EXCL When used with O_CREAT, if the file already exists it is an error andopen() fails.
O_TRUNC If the file already exists and the open mode allows writing (O_RDWRor O_WRONLY is given) it will be truncated to zero length.
O_APPEND The file is opened in append mode.
O_RDONLY The file is opened for reading only.
O_WRONLY The file is opened for writing only.
O_RDWR The file is opened for reading and writing.
Other bits are silently ignored.
mode is the bitwise OR of the following values:
S_IRUSR User has read permission.
S_IWUSR User has write permission.
S_IRGRP Group has read permission.
S_IWGRP Group has write permission.
S_IROTH Others have read permission.
S_IWOTH Others have write permission.
Other bits are silently ignored.
Return value:open returns the new file descriptor or -1 if an error occurred.
Errors:
EEXIST pathname already exists and O_CREAT and O_EXCL were used.
512 Debugging with gdb
EISDIR pathname refers to a directory.
EACCES The requested access is not allowed.
ENAMETOOLONG
pathname was too long.
ENOENT A directory component in pathname does not exist.
ENODEV pathname refers to a device, pipe, named pipe or socket.
EROFS pathname refers to a file on a read-only filesystem and write accesswas requested.
EFAULT pathname is an invalid pointer value.
ENOSPC No space on device to create the file.
EMFILE The process already has the maximum number of files open.
ENFILE The limit on the total number of files open on the system has beenreached.
EINTR The call was interrupted by the user.
close
Synopsis:int close(int fd);
Request: ‘Fclose,fd ’
Return value:close returns zero on success, or -1 if an error occurred.
Errors:
EBADF fd isn’t a valid open file descriptor.
EINTR The call was interrupted by the user.
read
Synopsis:int read(int fd, void *buf, unsigned int count);
Request: ‘Fread,fd,bufptr,count ’
Return value:On success, the number of bytes read is returned. Zero indicates end of file. Ifcount is zero, read returns zero as well. On error, -1 is returned.
Errors:
EBADF fd is not a valid file descriptor or is not open for reading.
EFAULT bufptr is an invalid pointer value.
EINTR The call was interrupted by the user.
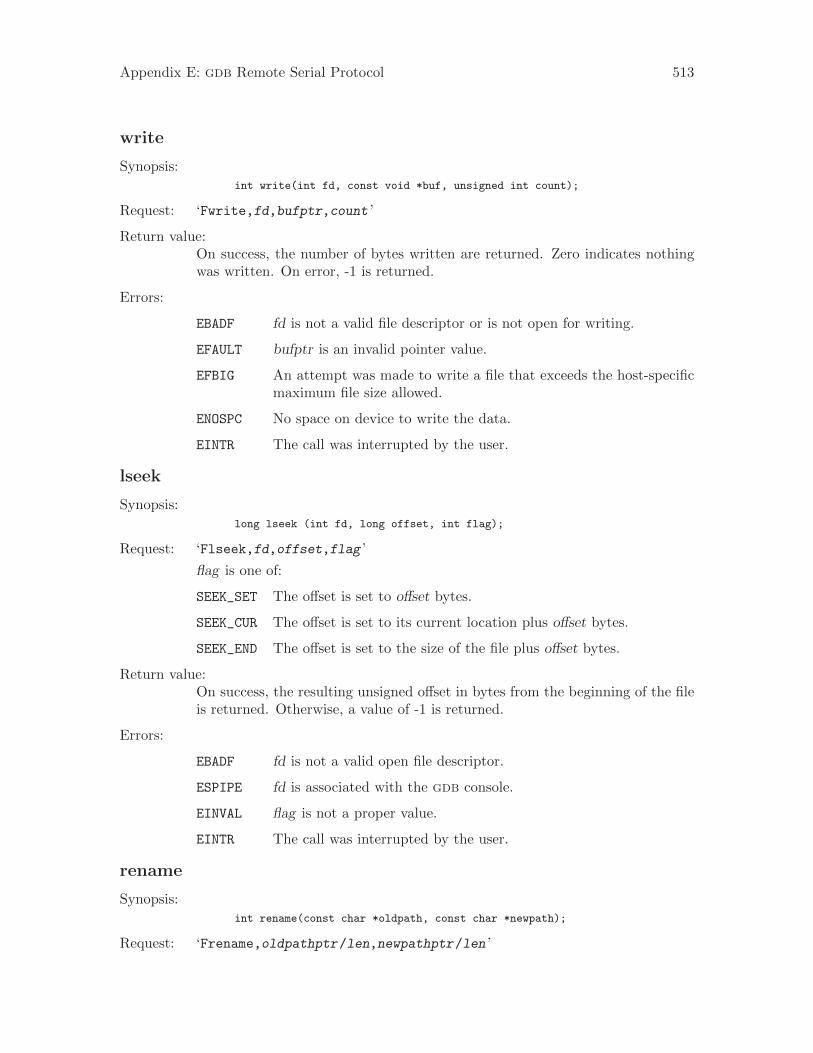
Appendix E: gdb Remote Serial Protocol 513
write
Synopsis:
int write(int fd, const void *buf, unsigned int count);
Request: ‘Fwrite,fd,bufptr,count ’
Return value:On success, the number of bytes written are returned. Zero indicates nothingwas written. On error, -1 is returned.
Errors:
EBADF fd is not a valid file descriptor or is not open for writing.
EFAULT bufptr is an invalid pointer value.
EFBIG An attempt was made to write a file that exceeds the host-specificmaximum file size allowed.
ENOSPC No space on device to write the data.
EINTR The call was interrupted by the user.
lseek
Synopsis:
long lseek (int fd, long offset, int flag);
Request: ‘Flseek,fd,offset,flag ’
flag is one of:
SEEK_SET The offset is set to offset bytes.
SEEK_CUR The offset is set to its current location plus offset bytes.
SEEK_END The offset is set to the size of the file plus offset bytes.
Return value:On success, the resulting unsigned offset in bytes from the beginning of the fileis returned. Otherwise, a value of -1 is returned.
Errors:
EBADF fd is not a valid open file descriptor.
ESPIPE fd is associated with the gdb console.
EINVAL flag is not a proper value.
EINTR The call was interrupted by the user.
rename
Synopsis:
int rename(const char *oldpath, const char *newpath);
Request: ‘Frename,oldpathptr/len,newpathptr/len ’
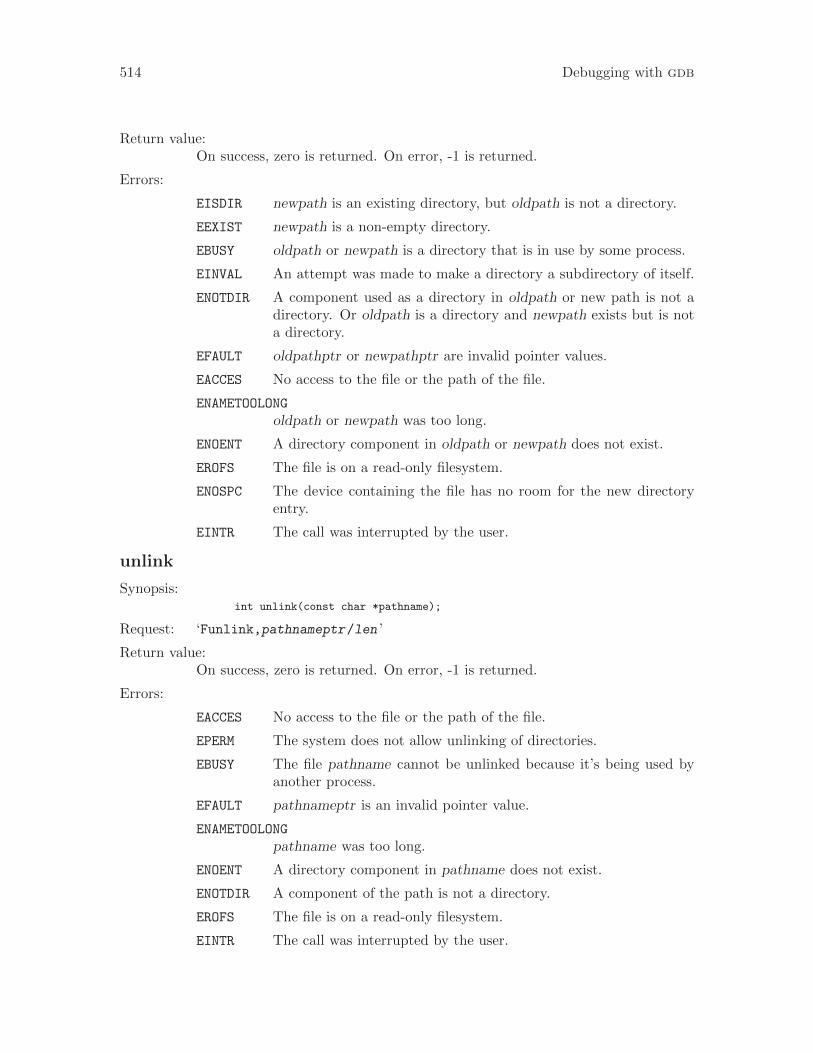
514 Debugging with gdb
Return value:On success, zero is returned. On error, -1 is returned.
Errors:
EISDIR newpath is an existing directory, but oldpath is not a directory.
EEXIST newpath is a non-empty directory.
EBUSY oldpath or newpath is a directory that is in use by some process.
EINVAL An attempt was made to make a directory a subdirectory of itself.
ENOTDIR A component used as a directory in oldpath or new path is not adirectory. Or oldpath is a directory and newpath exists but is nota directory.
EFAULT oldpathptr or newpathptr are invalid pointer values.
EACCES No access to the file or the path of the file.
ENAMETOOLONG
oldpath or newpath was too long.
ENOENT A directory component in oldpath or newpath does not exist.
EROFS The file is on a read-only filesystem.
ENOSPC The device containing the file has no room for the new directoryentry.
EINTR The call was interrupted by the user.
unlink
Synopsis:int unlink(const char *pathname);
Request: ‘Funlink,pathnameptr/len ’
Return value:On success, zero is returned. On error, -1 is returned.
Errors:
EACCES No access to the file or the path of the file.
EPERM The system does not allow unlinking of directories.
EBUSY The file pathname cannot be unlinked because it’s being used byanother process.
EFAULT pathnameptr is an invalid pointer value.
ENAMETOOLONG
pathname was too long.
ENOENT A directory component in pathname does not exist.
ENOTDIR A component of the path is not a directory.
EROFS The file is on a read-only filesystem.
EINTR The call was interrupted by the user.
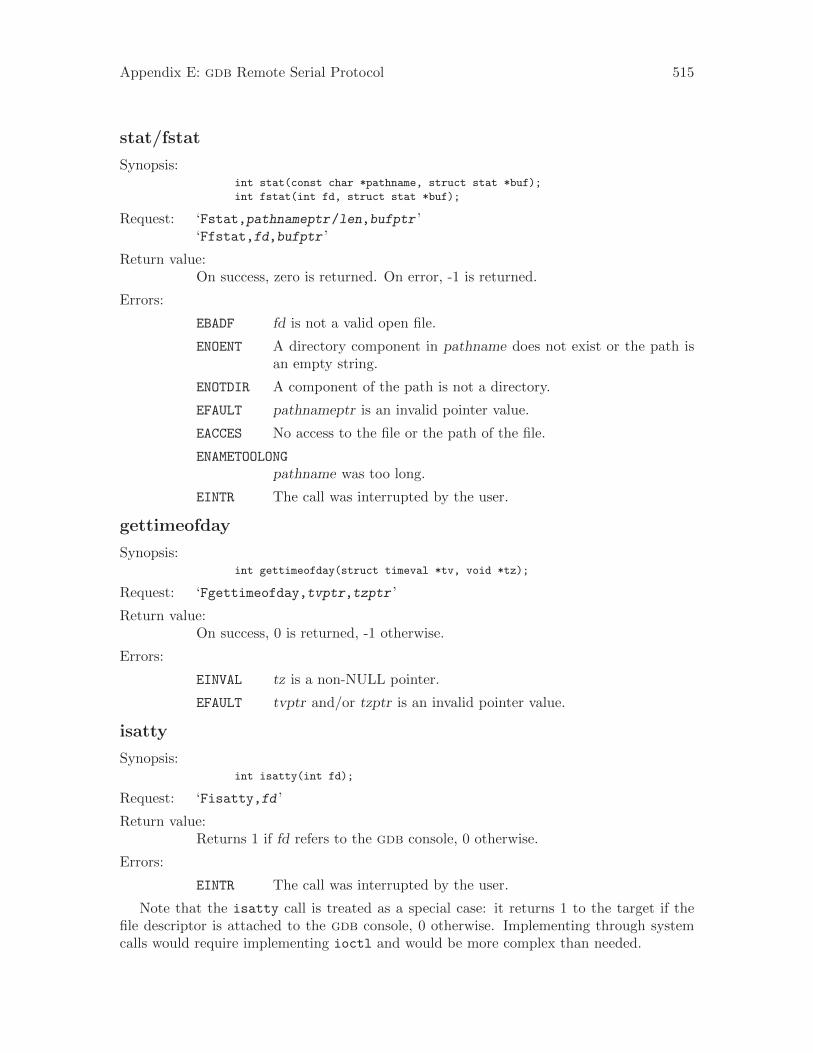
Appendix E: gdb Remote Serial Protocol 515
stat/fstat
Synopsis:int stat(const char *pathname, struct stat *buf);
int fstat(int fd, struct stat *buf);
Request: ‘Fstat,pathnameptr/len,bufptr ’‘Ffstat,fd,bufptr ’
Return value:On success, zero is returned. On error, -1 is returned.
Errors:
EBADF fd is not a valid open file.
ENOENT A directory component in pathname does not exist or the path isan empty string.
ENOTDIR A component of the path is not a directory.
EFAULT pathnameptr is an invalid pointer value.
EACCES No access to the file or the path of the file.
ENAMETOOLONG
pathname was too long.
EINTR The call was interrupted by the user.
gettimeofday
Synopsis:int gettimeofday(struct timeval *tv, void *tz);
Request: ‘Fgettimeofday,tvptr,tzptr ’
Return value:On success, 0 is returned, -1 otherwise.
Errors:
EINVAL tz is a non-NULL pointer.
EFAULT tvptr and/or tzptr is an invalid pointer value.
isatty
Synopsis:int isatty(int fd);
Request: ‘Fisatty,fd ’
Return value:Returns 1 if fd refers to the gdb console, 0 otherwise.
Errors:
EINTR The call was interrupted by the user.
Note that the isatty call is treated as a special case: it returns 1 to the target if thefile descriptor is attached to the gdb console, 0 otherwise. Implementing through systemcalls would require implementing ioctl and would be more complex than needed.
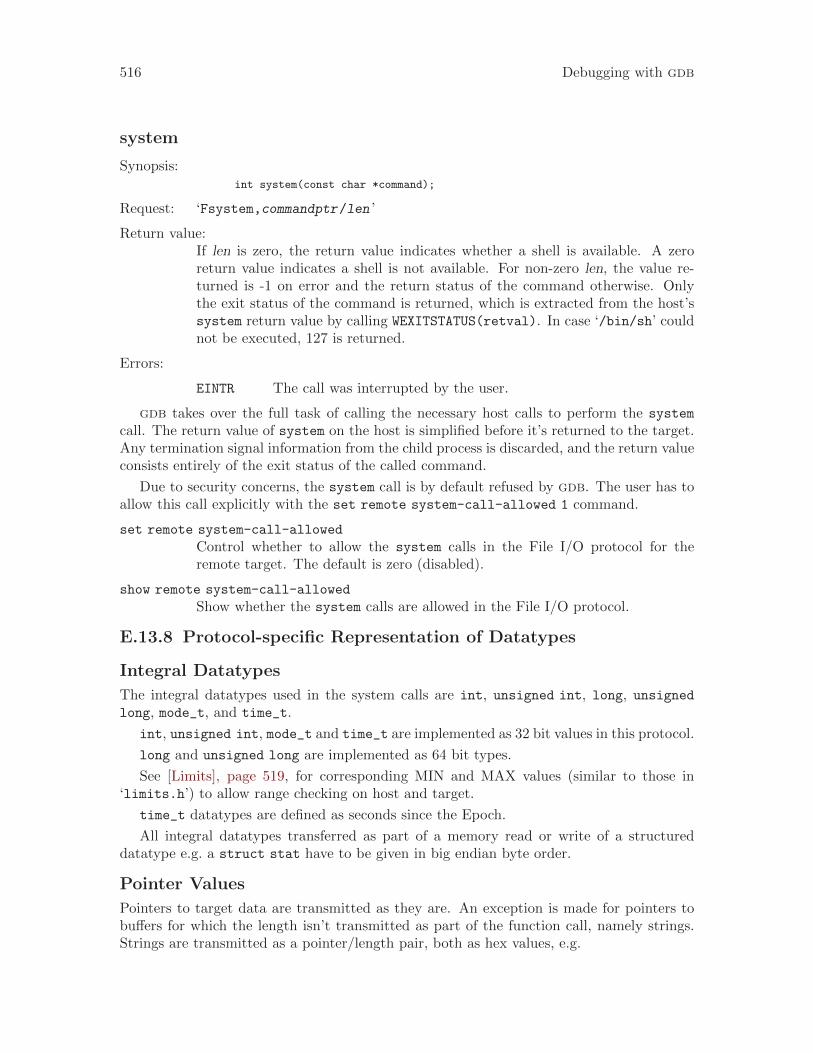
516 Debugging with gdb
system
Synopsis:int system(const char *command);
Request: ‘Fsystem,commandptr/len ’
Return value:If len is zero, the return value indicates whether a shell is available. A zeroreturn value indicates a shell is not available. For non-zero len, the value re-turned is -1 on error and the return status of the command otherwise. Onlythe exit status of the command is returned, which is extracted from the host’ssystem return value by calling WEXITSTATUS(retval). In case ‘/bin/sh’ couldnot be executed, 127 is returned.
Errors:
EINTR The call was interrupted by the user.
gdb takes over the full task of calling the necessary host calls to perform the system
call. The return value of system on the host is simplified before it’s returned to the target.Any termination signal information from the child process is discarded, and the return valueconsists entirely of the exit status of the called command.
Due to security concerns, the system call is by default refused by gdb. The user has toallow this call explicitly with the set remote system-call-allowed 1 command.
set remote system-call-allowed
Control whether to allow the system calls in the File I/O protocol for theremote target. The default is zero (disabled).
show remote system-call-allowed
Show whether the system calls are allowed in the File I/O protocol.
E.13.8 Protocol-specific Representation of Datatypes
Integral Datatypes
The integral datatypes used in the system calls are int, unsigned int, long, unsignedlong, mode_t, and time_t.
int, unsigned int, mode_t and time_t are implemented as 32 bit values in this protocol.
long and unsigned long are implemented as 64 bit types.
See [Limits], page 519, for corresponding MIN and MAX values (similar to those in‘limits.h’) to allow range checking on host and target.
time_t datatypes are defined as seconds since the Epoch.
All integral datatypes transferred as part of a memory read or write of a structureddatatype e.g. a struct stat have to be given in big endian byte order.
Pointer Values
Pointers to target data are transmitted as they are. An exception is made for pointers tobuffers for which the length isn’t transmitted as part of the function call, namely strings.Strings are transmitted as a pointer/length pair, both as hex values, e.g.
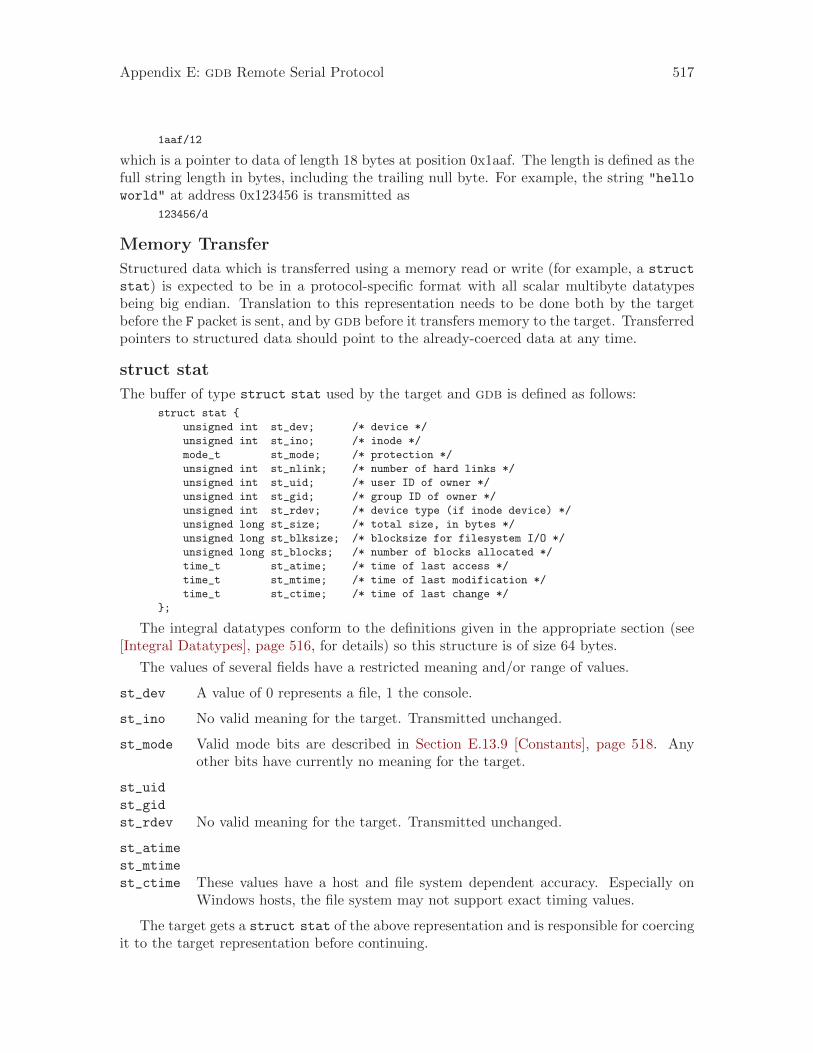
Appendix E: gdb Remote Serial Protocol 517
1aaf/12
which is a pointer to data of length 18 bytes at position 0x1aaf. The length is defined as thefull string length in bytes, including the trailing null byte. For example, the string "hello
world" at address 0x123456 is transmitted as123456/d
Memory Transfer
Structured data which is transferred using a memory read or write (for example, a struct
stat) is expected to be in a protocol-specific format with all scalar multibyte datatypesbeing big endian. Translation to this representation needs to be done both by the targetbefore the F packet is sent, and by gdb before it transfers memory to the target. Transferredpointers to structured data should point to the already-coerced data at any time.
struct stat
The buffer of type struct stat used by the target and gdb is defined as follows:struct stat {
unsigned int st_dev; /* device */
unsigned int st_ino; /* inode */
mode_t st_mode; /* protection */
unsigned int st_nlink; /* number of hard links */
unsigned int st_uid; /* user ID of owner */
unsigned int st_gid; /* group ID of owner */
unsigned int st_rdev; /* device type (if inode device) */
unsigned long st_size; /* total size, in bytes */
unsigned long st_blksize; /* blocksize for filesystem I/O */
unsigned long st_blocks; /* number of blocks allocated */
time_t st_atime; /* time of last access */
time_t st_mtime; /* time of last modification */
time_t st_ctime; /* time of last change */
};
The integral datatypes conform to the definitions given in the appropriate section (see[Integral Datatypes], page 516, for details) so this structure is of size 64 bytes.
The values of several fields have a restricted meaning and/or range of values.
st_dev A value of 0 represents a file, 1 the console.
st_ino No valid meaning for the target. Transmitted unchanged.
st_mode Valid mode bits are described in Section E.13.9 [Constants], page 518. Anyother bits have currently no meaning for the target.
st_uid
st_gid
st_rdev No valid meaning for the target. Transmitted unchanged.
st_atime
st_mtime
st_ctime These values have a host and file system dependent accuracy. Especially onWindows hosts, the file system may not support exact timing values.
The target gets a struct stat of the above representation and is responsible for coercingit to the target representation before continuing.
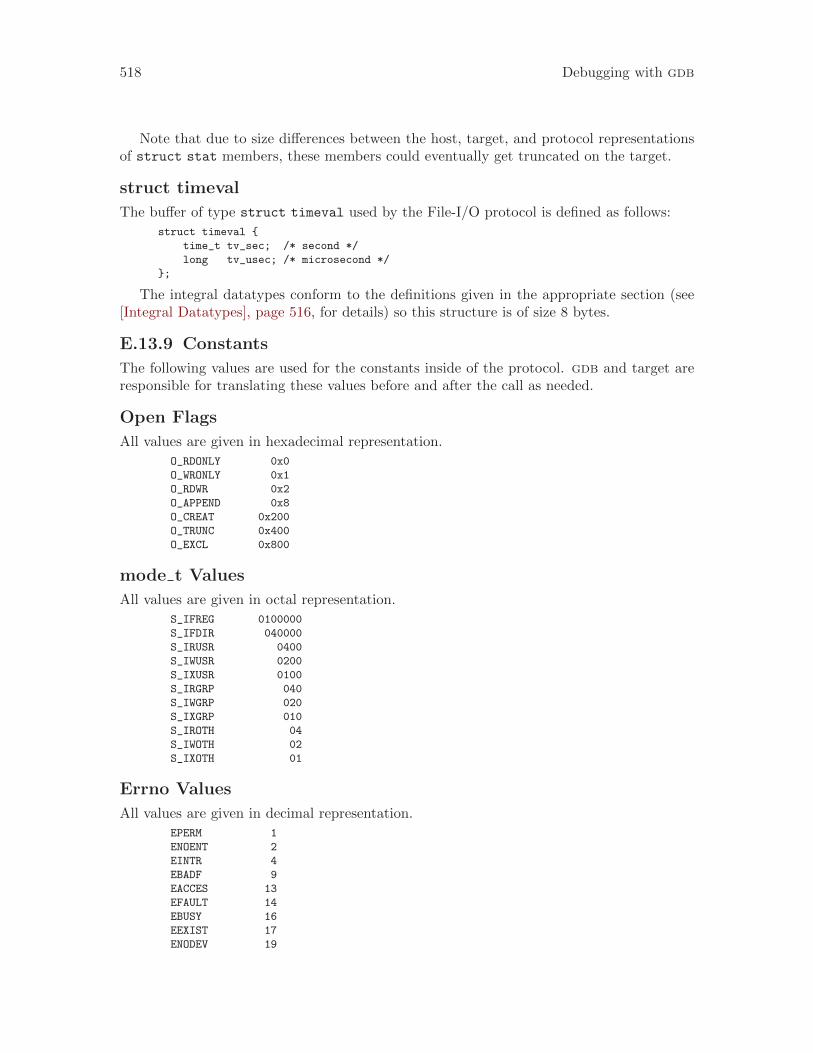
518 Debugging with gdb
Note that due to size differences between the host, target, and protocol representationsof struct stat members, these members could eventually get truncated on the target.
struct timeval
The buffer of type struct timeval used by the File-I/O protocol is defined as follows:
struct timeval {
time_t tv_sec; /* second */
long tv_usec; /* microsecond */
};
The integral datatypes conform to the definitions given in the appropriate section (see[Integral Datatypes], page 516, for details) so this structure is of size 8 bytes.
E.13.9 Constants
The following values are used for the constants inside of the protocol. gdb and target areresponsible for translating these values before and after the call as needed.
Open Flags
All values are given in hexadecimal representation.
O_RDONLY 0x0
O_WRONLY 0x1
O_RDWR 0x2
O_APPEND 0x8
O_CREAT 0x200
O_TRUNC 0x400
O_EXCL 0x800
mode t Values
All values are given in octal representation.
S_IFREG 0100000
S_IFDIR 040000
S_IRUSR 0400
S_IWUSR 0200
S_IXUSR 0100
S_IRGRP 040
S_IWGRP 020
S_IXGRP 010
S_IROTH 04
S_IWOTH 02
S_IXOTH 01
Errno Values
All values are given in decimal representation.
EPERM 1
ENOENT 2
EINTR 4
EBADF 9
EACCES 13
EFAULT 14
EBUSY 16
EEXIST 17
ENODEV 19
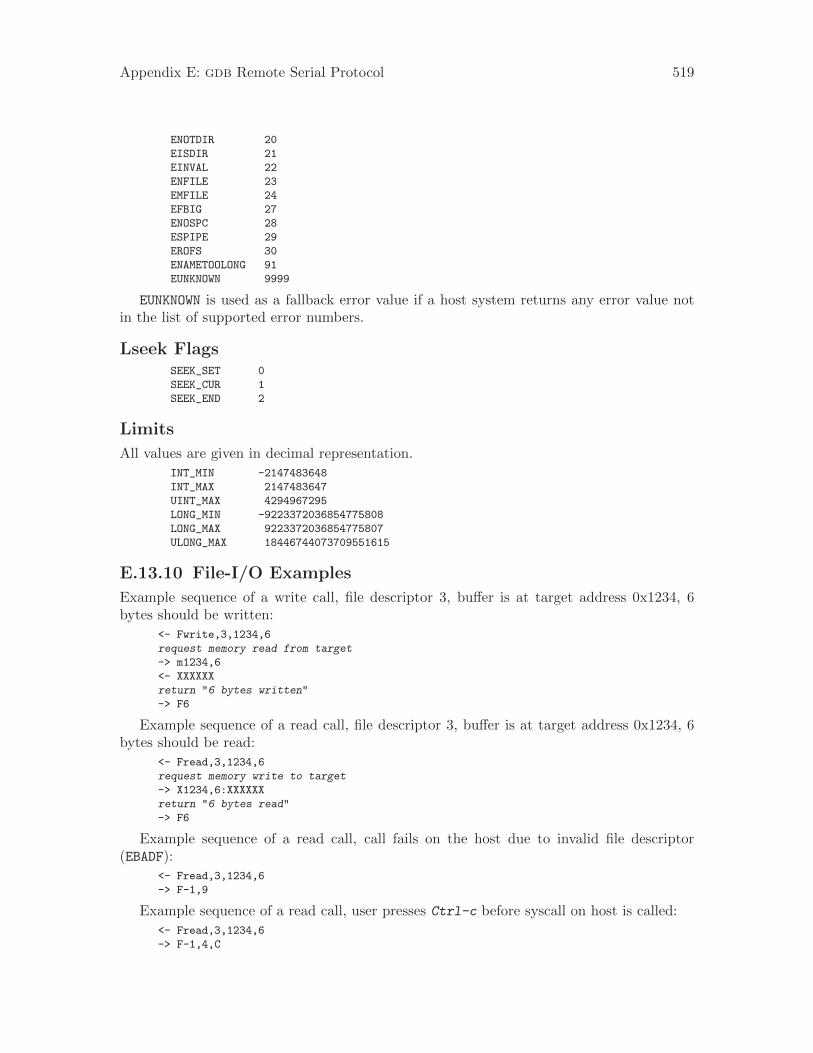
Appendix E: gdb Remote Serial Protocol 519
ENOTDIR 20
EISDIR 21
EINVAL 22
ENFILE 23
EMFILE 24
EFBIG 27
ENOSPC 28
ESPIPE 29
EROFS 30
ENAMETOOLONG 91
EUNKNOWN 9999
EUNKNOWN is used as a fallback error value if a host system returns any error value notin the list of supported error numbers.
Lseek FlagsSEEK_SET 0
SEEK_CUR 1
SEEK_END 2
Limits
All values are given in decimal representation.
INT_MIN -2147483648
INT_MAX 2147483647
UINT_MAX 4294967295
LONG_MIN -9223372036854775808
LONG_MAX 9223372036854775807
ULONG_MAX 18446744073709551615
E.13.10 File-I/O Examples
Example sequence of a write call, file descriptor 3, buffer is at target address 0x1234, 6bytes should be written:
<- Fwrite,3,1234,6
request memory read from target
-> m1234,6
<- XXXXXX
return "6 bytes written"
-> F6
Example sequence of a read call, file descriptor 3, buffer is at target address 0x1234, 6bytes should be read:
<- Fread,3,1234,6
request memory write to target
-> X1234,6:XXXXXX
return "6 bytes read"
-> F6
Example sequence of a read call, call fails on the host due to invalid file descriptor(EBADF):
<- Fread,3,1234,6
-> F-1,9
Example sequence of a read call, user presses Ctrl-c before syscall on host is called:
<- Fread,3,1234,6
-> F-1,4,C
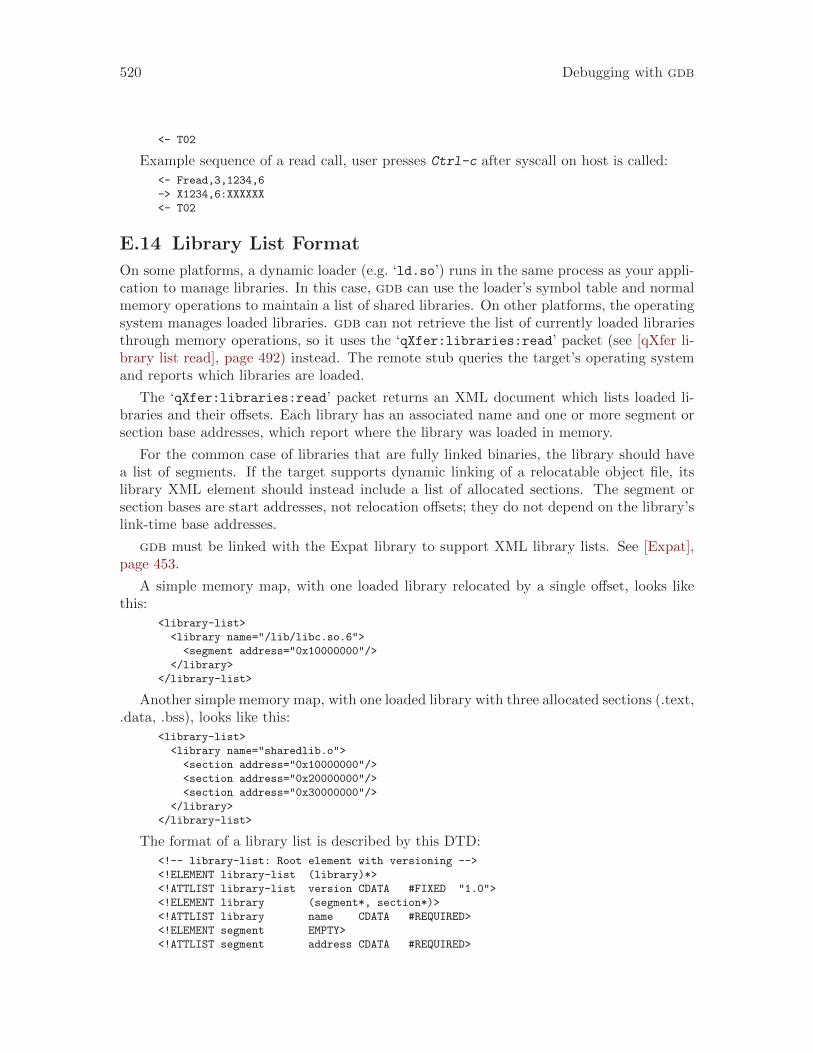
520 Debugging with gdb
<- T02
Example sequence of a read call, user presses Ctrl-c after syscall on host is called:
<- Fread,3,1234,6
-> X1234,6:XXXXXX
<- T02
E.14 Library List Format
On some platforms, a dynamic loader (e.g. ‘ld.so’) runs in the same process as your appli-cation to manage libraries. In this case, gdb can use the loader’s symbol table and normalmemory operations to maintain a list of shared libraries. On other platforms, the operatingsystem manages loaded libraries. gdb can not retrieve the list of currently loaded librariesthrough memory operations, so it uses the ‘qXfer:libraries:read’ packet (see [qXfer li-brary list read], page 492) instead. The remote stub queries the target’s operating systemand reports which libraries are loaded.
The ‘qXfer:libraries:read’ packet returns an XML document which lists loaded li-braries and their offsets. Each library has an associated name and one or more segment orsection base addresses, which report where the library was loaded in memory.
For the common case of libraries that are fully linked binaries, the library should havea list of segments. If the target supports dynamic linking of a relocatable object file, itslibrary XML element should instead include a list of allocated sections. The segment orsection bases are start addresses, not relocation offsets; they do not depend on the library’slink-time base addresses.
gdb must be linked with the Expat library to support XML library lists. See [Expat],page 453.
A simple memory map, with one loaded library relocated by a single offset, looks likethis:
<library-list>
<library name="/lib/libc.so.6">
<segment address="0x10000000"/>
</library>
</library-list>
Another simple memory map, with one loaded library with three allocated sections (.text,.data, .bss), looks like this:
<library-list>
<library name="sharedlib.o">
<section address="0x10000000"/>
<section address="0x20000000"/>
<section address="0x30000000"/>
</library>
</library-list>
The format of a library list is described by this DTD:
<!-- library-list: Root element with versioning -->
<!ELEMENT library-list (library)*>
<!ATTLIST library-list version CDATA #FIXED "1.0">
<!ELEMENT library (segment*, section*)>
<!ATTLIST library name CDATA #REQUIRED>
<!ELEMENT segment EMPTY>
<!ATTLIST segment address CDATA #REQUIRED>
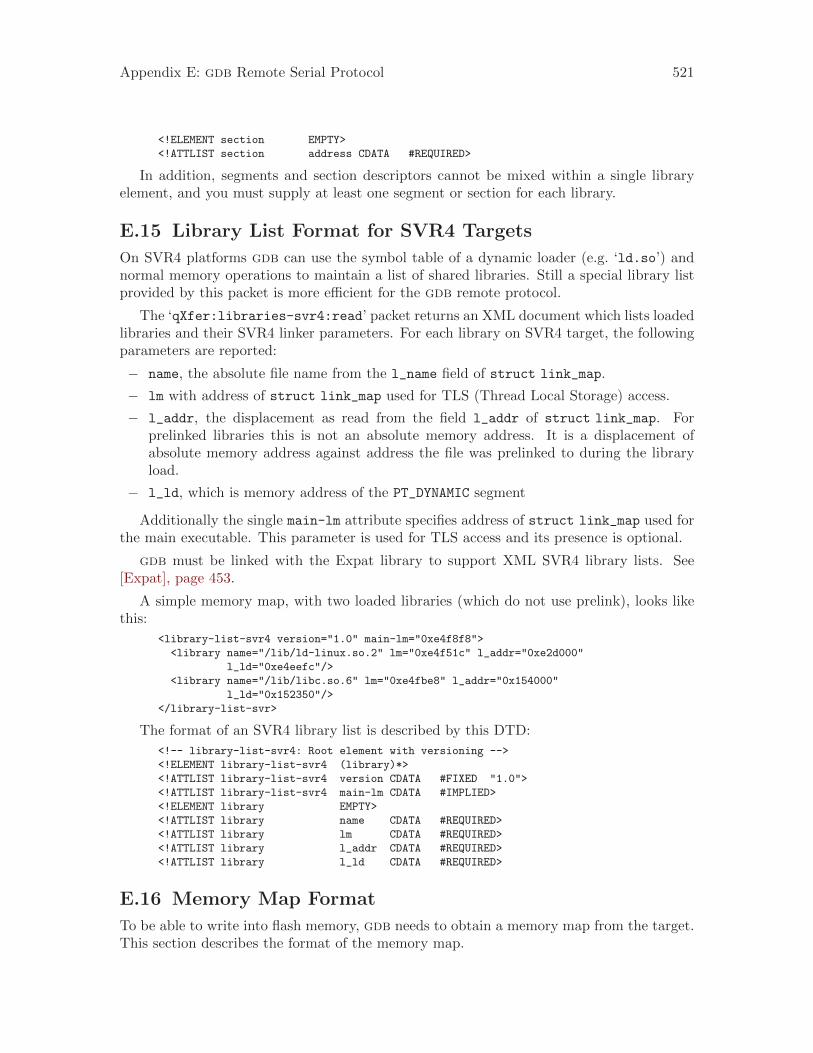
Appendix E: gdb Remote Serial Protocol 521
<!ELEMENT section EMPTY>
<!ATTLIST section address CDATA #REQUIRED>
In addition, segments and section descriptors cannot be mixed within a single libraryelement, and you must supply at least one segment or section for each library.
E.15 Library List Format for SVR4 Targets
On SVR4 platforms gdb can use the symbol table of a dynamic loader (e.g. ‘ld.so’) andnormal memory operations to maintain a list of shared libraries. Still a special library listprovided by this packet is more efficient for the gdb remote protocol.
The ‘qXfer:libraries-svr4:read’ packet returns an XML document which lists loadedlibraries and their SVR4 linker parameters. For each library on SVR4 target, the followingparameters are reported:
− name, the absolute file name from the l_name field of struct link_map.
− lm with address of struct link_map used for TLS (Thread Local Storage) access.
− l_addr, the displacement as read from the field l_addr of struct link_map. Forprelinked libraries this is not an absolute memory address. It is a displacement ofabsolute memory address against address the file was prelinked to during the libraryload.
− l_ld, which is memory address of the PT_DYNAMIC segment
Additionally the single main-lm attribute specifies address of struct link_map used forthe main executable. This parameter is used for TLS access and its presence is optional.
gdb must be linked with the Expat library to support XML SVR4 library lists. See[Expat], page 453.
A simple memory map, with two loaded libraries (which do not use prelink), looks likethis:
<library-list-svr4 version="1.0" main-lm="0xe4f8f8">
<library name="/lib/ld-linux.so.2" lm="0xe4f51c" l_addr="0xe2d000"
l_ld="0xe4eefc"/>
<library name="/lib/libc.so.6" lm="0xe4fbe8" l_addr="0x154000"
l_ld="0x152350"/>
</library-list-svr>
The format of an SVR4 library list is described by this DTD:
<!-- library-list-svr4: Root element with versioning -->
<!ELEMENT library-list-svr4 (library)*>
<!ATTLIST library-list-svr4 version CDATA #FIXED "1.0">
<!ATTLIST library-list-svr4 main-lm CDATA #IMPLIED>
<!ELEMENT library EMPTY>
<!ATTLIST library name CDATA #REQUIRED>
<!ATTLIST library lm CDATA #REQUIRED>
<!ATTLIST library l_addr CDATA #REQUIRED>
<!ATTLIST library l_ld CDATA #REQUIRED>
E.16 Memory Map Format
To be able to write into flash memory, gdb needs to obtain a memory map from the target.This section describes the format of the memory map.
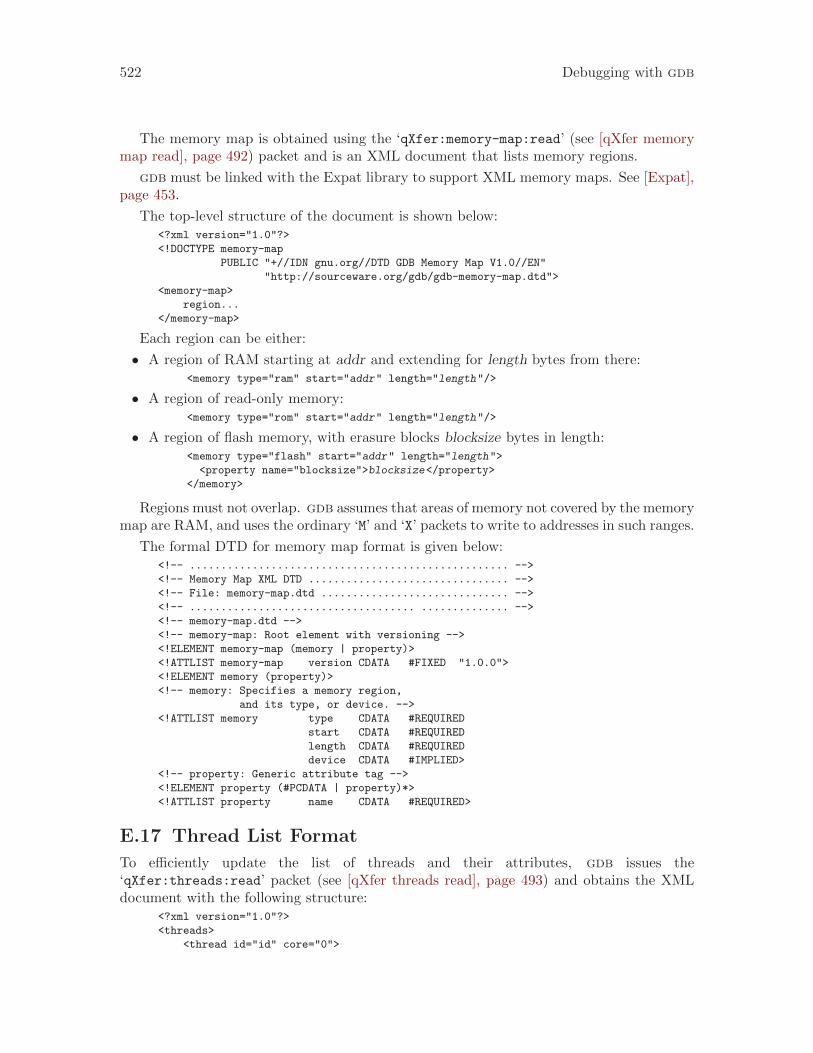
522 Debugging with gdb
The memory map is obtained using the ‘qXfer:memory-map:read’ (see [qXfer memorymap read], page 492) packet and is an XML document that lists memory regions.
gdb must be linked with the Expat library to support XML memory maps. See [Expat],page 453.
The top-level structure of the document is shown below:<?xml version="1.0"?>
<!DOCTYPE memory-map
PUBLIC "+//IDN gnu.org//DTD GDB Memory Map V1.0//EN"
"http://sourceware.org/gdb/gdb-memory-map.dtd">
<memory-map>
region...
</memory-map>
Each region can be either:
• A region of RAM starting at addr and extending for length bytes from there:<memory type="ram" start="addr" length="length"/>
• A region of read-only memory:<memory type="rom" start="addr" length="length"/>
• A region of flash memory, with erasure blocks blocksize bytes in length:<memory type="flash" start="addr" length="length">
<property name="blocksize">blocksize</property>
</memory>
Regions must not overlap. gdb assumes that areas of memory not covered by the memorymap are RAM, and uses the ordinary ‘M’ and ‘X’ packets to write to addresses in such ranges.
The formal DTD for memory map format is given below:<!-- ................................................... -->
<!-- Memory Map XML DTD ................................ -->
<!-- File: memory-map.dtd .............................. -->
<!-- .................................... .............. -->
<!-- memory-map.dtd -->
<!-- memory-map: Root element with versioning -->
<!ELEMENT memory-map (memory | property)>
<!ATTLIST memory-map version CDATA #FIXED "1.0.0">
<!ELEMENT memory (property)>
<!-- memory: Specifies a memory region,
and its type, or device. -->
<!ATTLIST memory type CDATA #REQUIRED
start CDATA #REQUIRED
length CDATA #REQUIRED
device CDATA #IMPLIED>
<!-- property: Generic attribute tag -->
<!ELEMENT property (#PCDATA | property)*>
<!ATTLIST property name CDATA #REQUIRED>
E.17 Thread List Format
To efficiently update the list of threads and their attributes, gdb issues the‘qXfer:threads:read’ packet (see [qXfer threads read], page 493) and obtains the XMLdocument with the following structure:
<?xml version="1.0"?>
<threads>
<thread id="id" core="0">
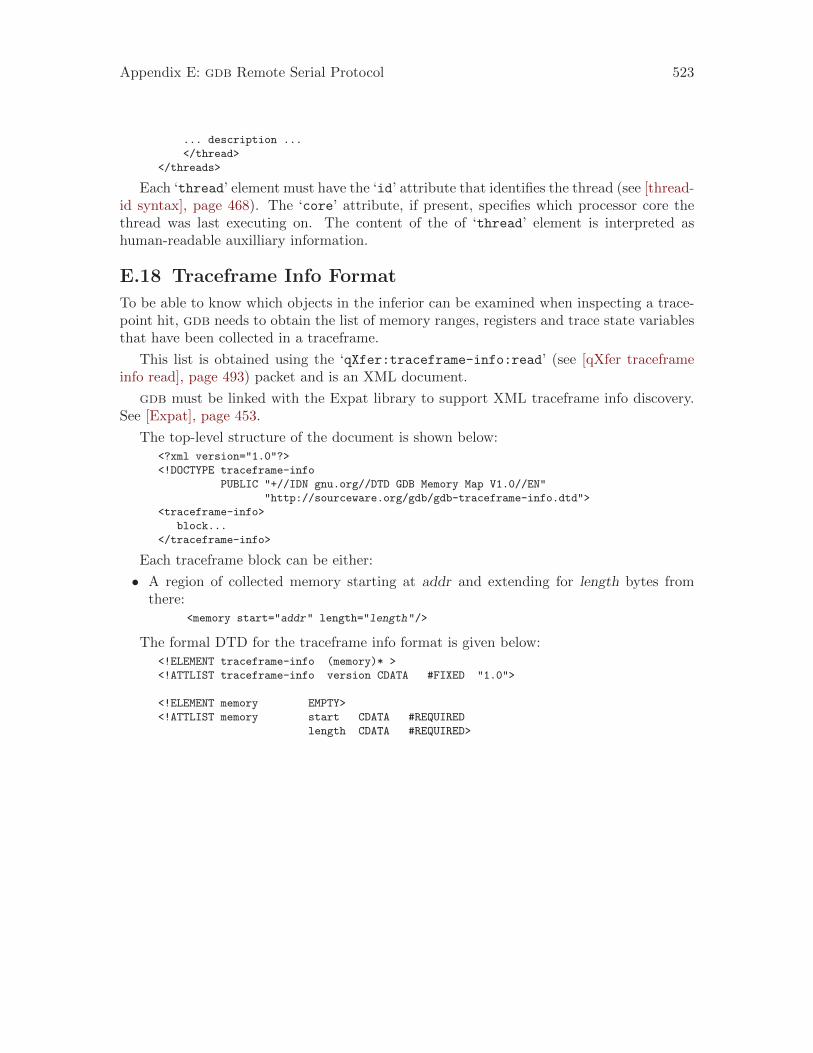
Appendix E: gdb Remote Serial Protocol 523
... description ...
</thread>
</threads>
Each ‘thread’ element must have the ‘id’ attribute that identifies the thread (see [thread-id syntax], page 468). The ‘core’ attribute, if present, specifies which processor core thethread was last executing on. The content of the of ‘thread’ element is interpreted ashuman-readable auxilliary information.
E.18 Traceframe Info Format
To be able to know which objects in the inferior can be examined when inspecting a trace-point hit, gdb needs to obtain the list of memory ranges, registers and trace state variablesthat have been collected in a traceframe.
This list is obtained using the ‘qXfer:traceframe-info:read’ (see [qXfer traceframeinfo read], page 493) packet and is an XML document.
gdb must be linked with the Expat library to support XML traceframe info discovery.See [Expat], page 453.
The top-level structure of the document is shown below:<?xml version="1.0"?>
<!DOCTYPE traceframe-info
PUBLIC "+//IDN gnu.org//DTD GDB Memory Map V1.0//EN"
"http://sourceware.org/gdb/gdb-traceframe-info.dtd">
<traceframe-info>
block...
</traceframe-info>
Each traceframe block can be either:
• A region of collected memory starting at addr and extending for length bytes fromthere:
<memory start="addr" length="length"/>
The formal DTD for the traceframe info format is given below:<!ELEMENT traceframe-info (memory)* >
<!ATTLIST traceframe-info version CDATA #FIXED "1.0">
<!ELEMENT memory EMPTY>
<!ATTLIST memory start CDATA #REQUIRED
length CDATA #REQUIRED>

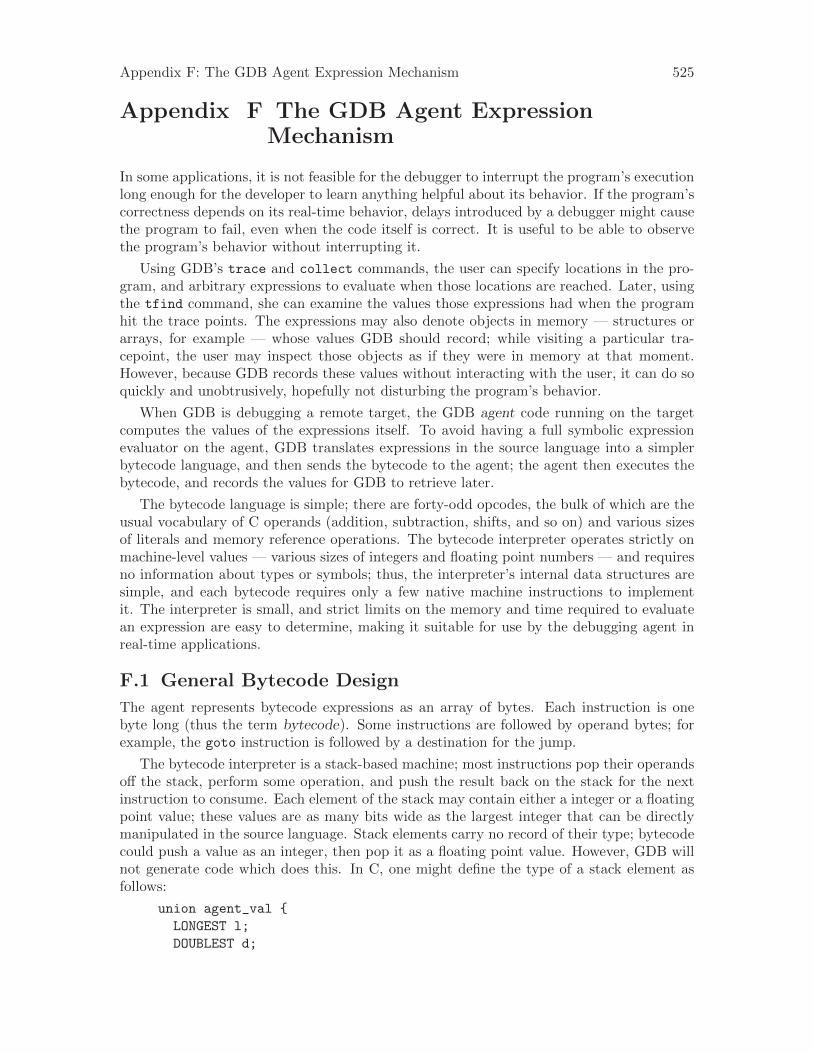
Appendix F: The GDB Agent Expression Mechanism 525
Appendix F The GDB Agent ExpressionMechanism
In some applications, it is not feasible for the debugger to interrupt the program’s executionlong enough for the developer to learn anything helpful about its behavior. If the program’scorrectness depends on its real-time behavior, delays introduced by a debugger might causethe program to fail, even when the code itself is correct. It is useful to be able to observethe program’s behavior without interrupting it.
Using GDB’s trace and collect commands, the user can specify locations in the pro-gram, and arbitrary expressions to evaluate when those locations are reached. Later, usingthe tfind command, she can examine the values those expressions had when the programhit the trace points. The expressions may also denote objects in memory — structures orarrays, for example — whose values GDB should record; while visiting a particular tra-cepoint, the user may inspect those objects as if they were in memory at that moment.However, because GDB records these values without interacting with the user, it can do soquickly and unobtrusively, hopefully not disturbing the program’s behavior.
When GDB is debugging a remote target, the GDB agent code running on the targetcomputes the values of the expressions itself. To avoid having a full symbolic expressionevaluator on the agent, GDB translates expressions in the source language into a simplerbytecode language, and then sends the bytecode to the agent; the agent then executes thebytecode, and records the values for GDB to retrieve later.
The bytecode language is simple; there are forty-odd opcodes, the bulk of which are theusual vocabulary of C operands (addition, subtraction, shifts, and so on) and various sizesof literals and memory reference operations. The bytecode interpreter operates strictly onmachine-level values — various sizes of integers and floating point numbers — and requiresno information about types or symbols; thus, the interpreter’s internal data structures aresimple, and each bytecode requires only a few native machine instructions to implementit. The interpreter is small, and strict limits on the memory and time required to evaluatean expression are easy to determine, making it suitable for use by the debugging agent inreal-time applications.
F.1 General Bytecode Design
The agent represents bytecode expressions as an array of bytes. Each instruction is onebyte long (thus the term bytecode). Some instructions are followed by operand bytes; forexample, the goto instruction is followed by a destination for the jump.
The bytecode interpreter is a stack-based machine; most instructions pop their operandsoff the stack, perform some operation, and push the result back on the stack for the nextinstruction to consume. Each element of the stack may contain either a integer or a floatingpoint value; these values are as many bits wide as the largest integer that can be directlymanipulated in the source language. Stack elements carry no record of their type; bytecodecould push a value as an integer, then pop it as a floating point value. However, GDB willnot generate code which does this. In C, one might define the type of a stack element asfollows:
union agent_val {
LONGEST l;
DOUBLEST d;
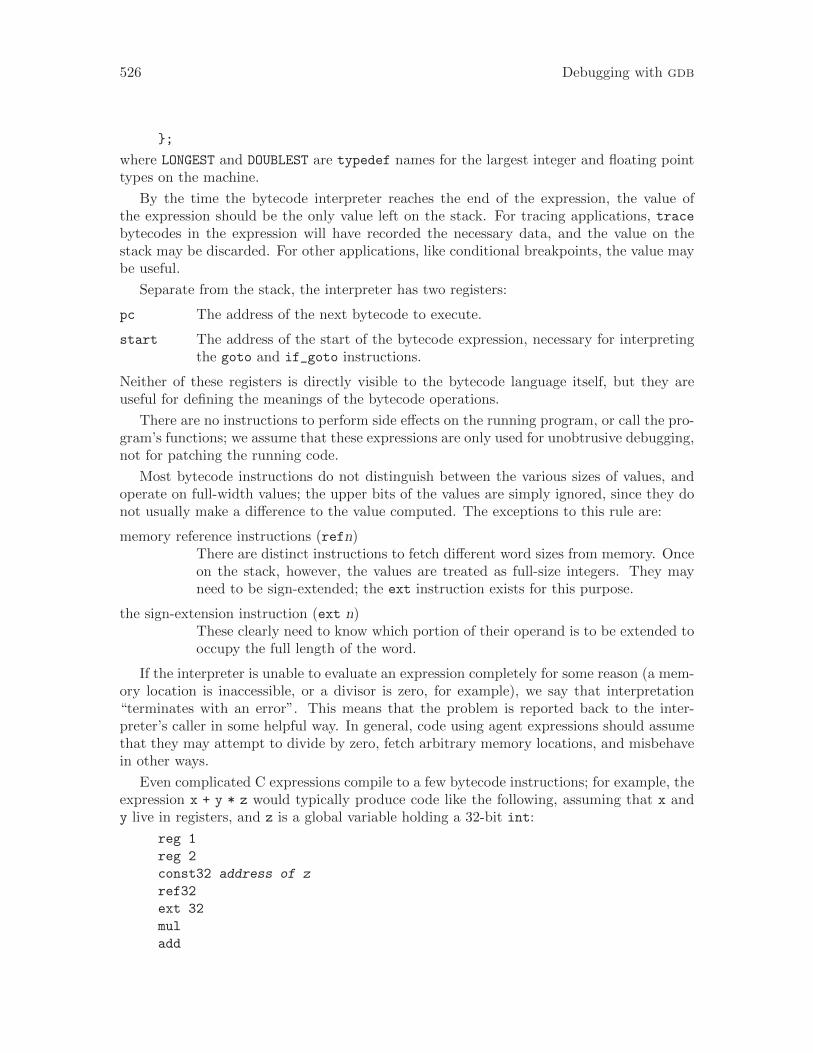
526 Debugging with gdb
};
where LONGEST and DOUBLEST are typedef names for the largest integer and floating pointtypes on the machine.
By the time the bytecode interpreter reaches the end of the expression, the value ofthe expression should be the only value left on the stack. For tracing applications, tracebytecodes in the expression will have recorded the necessary data, and the value on thestack may be discarded. For other applications, like conditional breakpoints, the value maybe useful.
Separate from the stack, the interpreter has two registers:
pc The address of the next bytecode to execute.
start The address of the start of the bytecode expression, necessary for interpretingthe goto and if_goto instructions.
Neither of these registers is directly visible to the bytecode language itself, but they areuseful for defining the meanings of the bytecode operations.
There are no instructions to perform side effects on the running program, or call the pro-gram’s functions; we assume that these expressions are only used for unobtrusive debugging,not for patching the running code.
Most bytecode instructions do not distinguish between the various sizes of values, andoperate on full-width values; the upper bits of the values are simply ignored, since they donot usually make a difference to the value computed. The exceptions to this rule are:
memory reference instructions (refn)There are distinct instructions to fetch different word sizes from memory. Onceon the stack, however, the values are treated as full-size integers. They mayneed to be sign-extended; the ext instruction exists for this purpose.
the sign-extension instruction (ext n)These clearly need to know which portion of their operand is to be extended tooccupy the full length of the word.
If the interpreter is unable to evaluate an expression completely for some reason (a mem-ory location is inaccessible, or a divisor is zero, for example), we say that interpretation“terminates with an error”. This means that the problem is reported back to the inter-preter’s caller in some helpful way. In general, code using agent expressions should assumethat they may attempt to divide by zero, fetch arbitrary memory locations, and misbehavein other ways.
Even complicated C expressions compile to a few bytecode instructions; for example, theexpression x + y * z would typically produce code like the following, assuming that x andy live in registers, and z is a global variable holding a 32-bit int:
reg 1
reg 2
const32 address of z
ref32
ext 32
mul
add
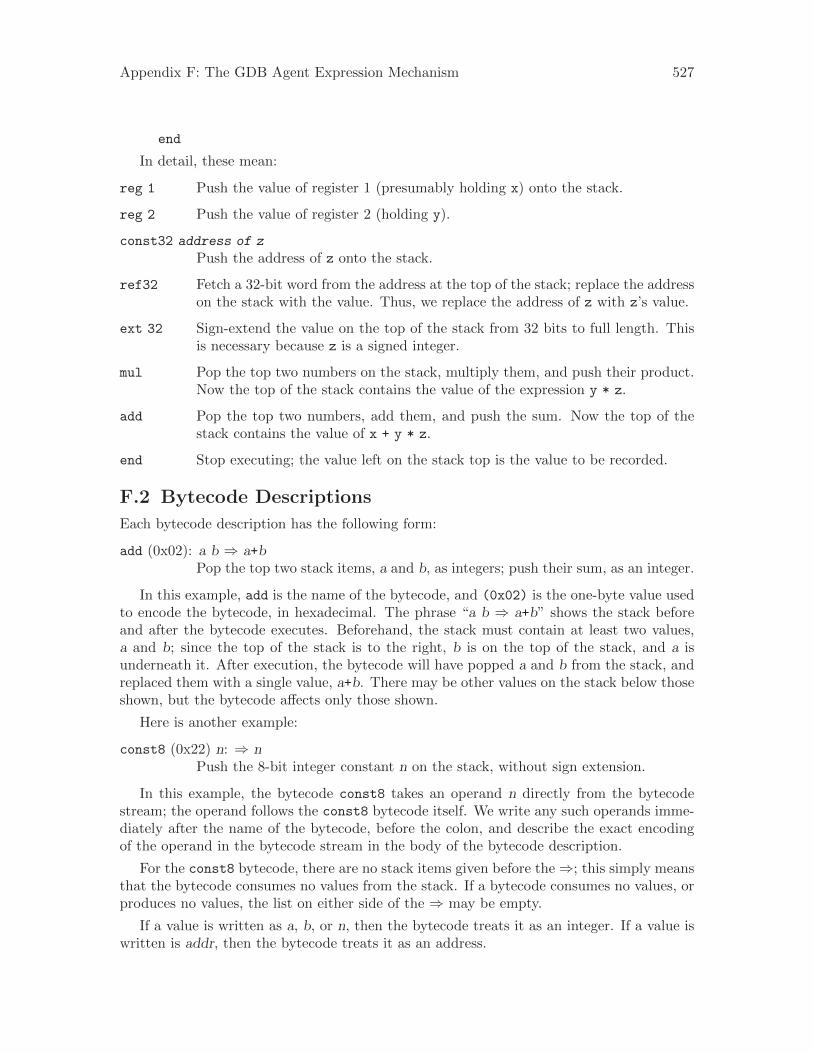
Appendix F: The GDB Agent Expression Mechanism 527
end
In detail, these mean:
reg 1 Push the value of register 1 (presumably holding x) onto the stack.
reg 2 Push the value of register 2 (holding y).
const32 address of z
Push the address of z onto the stack.
ref32 Fetch a 32-bit word from the address at the top of the stack; replace the addresson the stack with the value. Thus, we replace the address of z with z’s value.
ext 32 Sign-extend the value on the top of the stack from 32 bits to full length. Thisis necessary because z is a signed integer.
mul Pop the top two numbers on the stack, multiply them, and push their product.Now the top of the stack contains the value of the expression y * z.
add Pop the top two numbers, add them, and push the sum. Now the top of thestack contains the value of x + y * z.
end Stop executing; the value left on the stack top is the value to be recorded.
F.2 Bytecode Descriptions
Each bytecode description has the following form:
add (0x02): a b ⇒ a+bPop the top two stack items, a and b, as integers; push their sum, as an integer.
In this example, add is the name of the bytecode, and (0x02) is the one-byte value usedto encode the bytecode, in hexadecimal. The phrase “a b ⇒ a+b” shows the stack beforeand after the bytecode executes. Beforehand, the stack must contain at least two values,a and b; since the top of the stack is to the right, b is on the top of the stack, and a isunderneath it. After execution, the bytecode will have popped a and b from the stack, andreplaced them with a single value, a+b. There may be other values on the stack below thoseshown, but the bytecode affects only those shown.
Here is another example:
const8 (0x22) n: ⇒ nPush the 8-bit integer constant n on the stack, without sign extension.
In this example, the bytecode const8 takes an operand n directly from the bytecodestream; the operand follows the const8 bytecode itself. We write any such operands imme-diately after the name of the bytecode, before the colon, and describe the exact encodingof the operand in the bytecode stream in the body of the bytecode description.
For the const8 bytecode, there are no stack items given before the⇒; this simply meansthat the bytecode consumes no values from the stack. If a bytecode consumes no values, orproduces no values, the list on either side of the ⇒ may be empty.
If a value is written as a, b, or n, then the bytecode treats it as an integer. If a value iswritten is addr, then the bytecode treats it as an address.
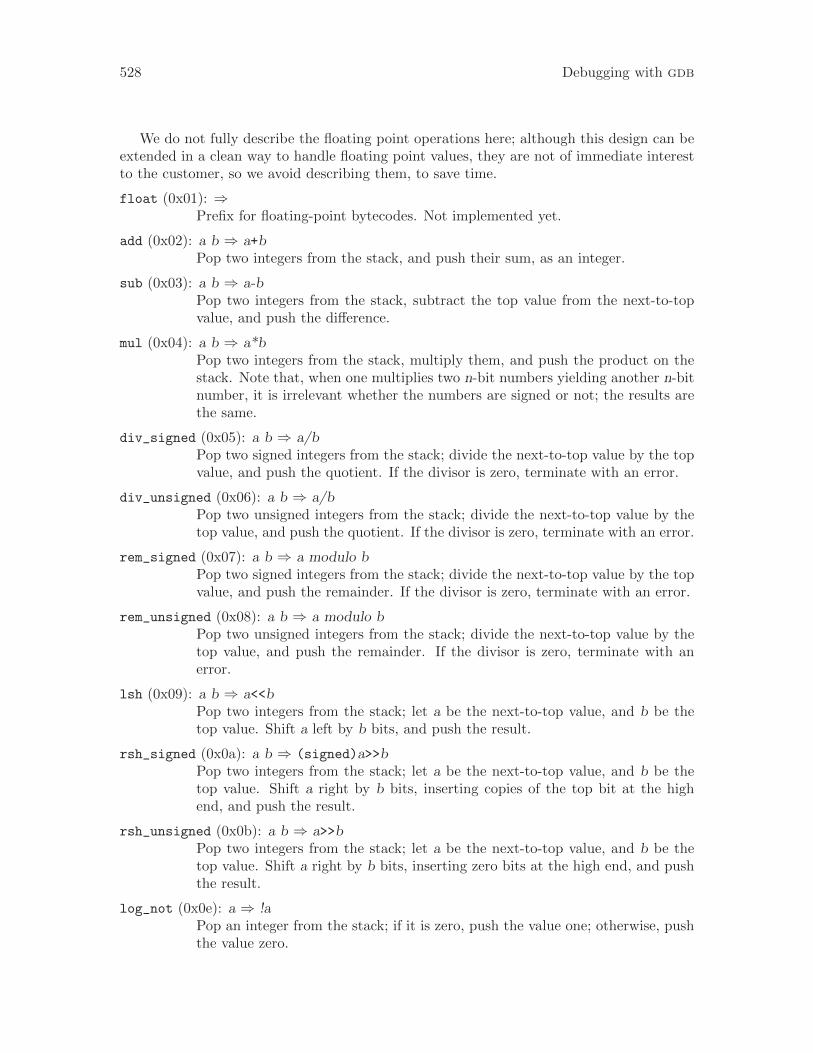
528 Debugging with gdb
We do not fully describe the floating point operations here; although this design can beextended in a clean way to handle floating point values, they are not of immediate interestto the customer, so we avoid describing them, to save time.
float (0x01): ⇒Prefix for floating-point bytecodes. Not implemented yet.
add (0x02): a b ⇒ a+bPop two integers from the stack, and push their sum, as an integer.
sub (0x03): a b ⇒ a-bPop two integers from the stack, subtract the top value from the next-to-topvalue, and push the difference.
mul (0x04): a b ⇒ a*bPop two integers from the stack, multiply them, and push the product on thestack. Note that, when one multiplies two n-bit numbers yielding another n-bitnumber, it is irrelevant whether the numbers are signed or not; the results arethe same.
div_signed (0x05): a b ⇒ a/bPop two signed integers from the stack; divide the next-to-top value by the topvalue, and push the quotient. If the divisor is zero, terminate with an error.
div_unsigned (0x06): a b ⇒ a/bPop two unsigned integers from the stack; divide the next-to-top value by thetop value, and push the quotient. If the divisor is zero, terminate with an error.
rem_signed (0x07): a b ⇒ a modulo bPop two signed integers from the stack; divide the next-to-top value by the topvalue, and push the remainder. If the divisor is zero, terminate with an error.
rem_unsigned (0x08): a b ⇒ a modulo bPop two unsigned integers from the stack; divide the next-to-top value by thetop value, and push the remainder. If the divisor is zero, terminate with anerror.
lsh (0x09): a b ⇒ a<<bPop two integers from the stack; let a be the next-to-top value, and b be thetop value. Shift a left by b bits, and push the result.
rsh_signed (0x0a): a b ⇒ (signed)a>>bPop two integers from the stack; let a be the next-to-top value, and b be thetop value. Shift a right by b bits, inserting copies of the top bit at the highend, and push the result.
rsh_unsigned (0x0b): a b ⇒ a>>bPop two integers from the stack; let a be the next-to-top value, and b be thetop value. Shift a right by b bits, inserting zero bits at the high end, and pushthe result.
log_not (0x0e): a ⇒ !aPop an integer from the stack; if it is zero, push the value one; otherwise, pushthe value zero.
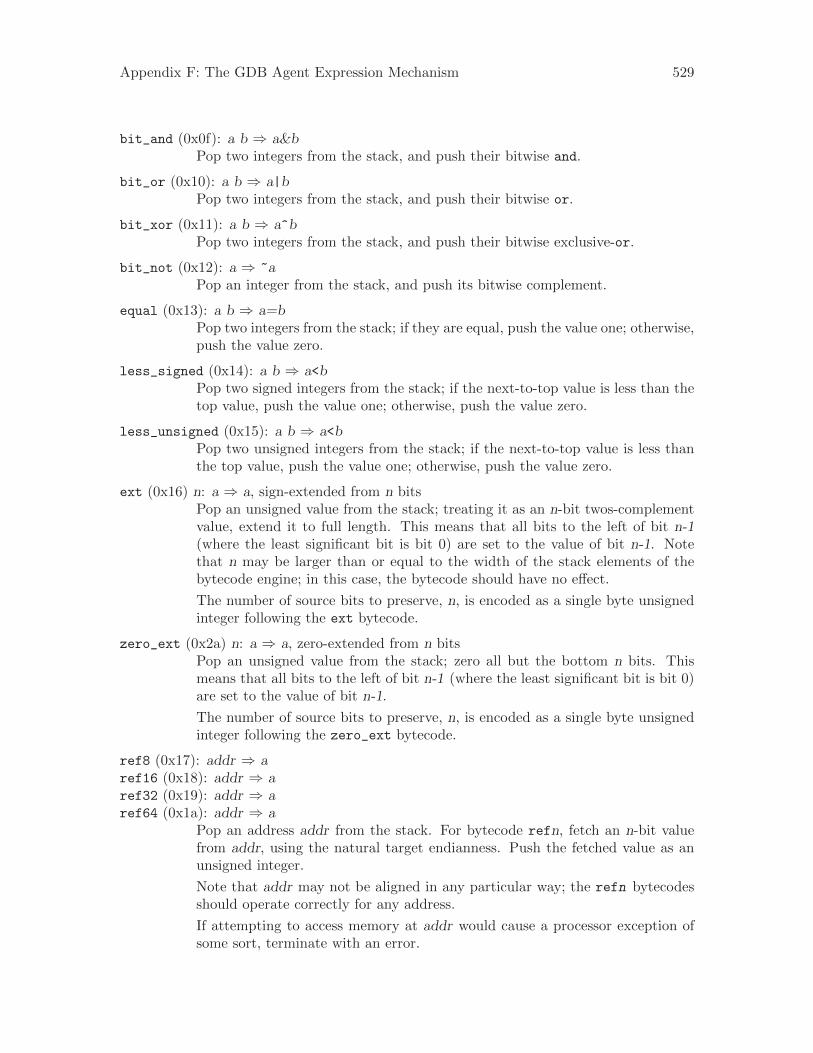
Appendix F: The GDB Agent Expression Mechanism 529
bit_and (0x0f): a b ⇒ a&bPop two integers from the stack, and push their bitwise and.
bit_or (0x10): a b ⇒ a|bPop two integers from the stack, and push their bitwise or.
bit_xor (0x11): a b ⇒ a^bPop two integers from the stack, and push their bitwise exclusive-or.
bit_not (0x12): a ⇒ ~aPop an integer from the stack, and push its bitwise complement.
equal (0x13): a b ⇒ a=bPop two integers from the stack; if they are equal, push the value one; otherwise,push the value zero.
less_signed (0x14): a b ⇒ a<bPop two signed integers from the stack; if the next-to-top value is less than thetop value, push the value one; otherwise, push the value zero.
less_unsigned (0x15): a b ⇒ a<bPop two unsigned integers from the stack; if the next-to-top value is less thanthe top value, push the value one; otherwise, push the value zero.
ext (0x16) n: a ⇒ a, sign-extended from n bitsPop an unsigned value from the stack; treating it as an n-bit twos-complementvalue, extend it to full length. This means that all bits to the left of bit n-1(where the least significant bit is bit 0) are set to the value of bit n-1. Notethat n may be larger than or equal to the width of the stack elements of thebytecode engine; in this case, the bytecode should have no effect.
The number of source bits to preserve, n, is encoded as a single byte unsignedinteger following the ext bytecode.
zero_ext (0x2a) n: a ⇒ a, zero-extended from n bitsPop an unsigned value from the stack; zero all but the bottom n bits. Thismeans that all bits to the left of bit n-1 (where the least significant bit is bit 0)are set to the value of bit n-1.
The number of source bits to preserve, n, is encoded as a single byte unsignedinteger following the zero_ext bytecode.
ref8 (0x17): addr ⇒ aref16 (0x18): addr ⇒ aref32 (0x19): addr ⇒ aref64 (0x1a): addr ⇒ a
Pop an address addr from the stack. For bytecode refn, fetch an n-bit valuefrom addr, using the natural target endianness. Push the fetched value as anunsigned integer.
Note that addr may not be aligned in any particular way; the refn bytecodesshould operate correctly for any address.
If attempting to access memory at addr would cause a processor exception ofsome sort, terminate with an error.
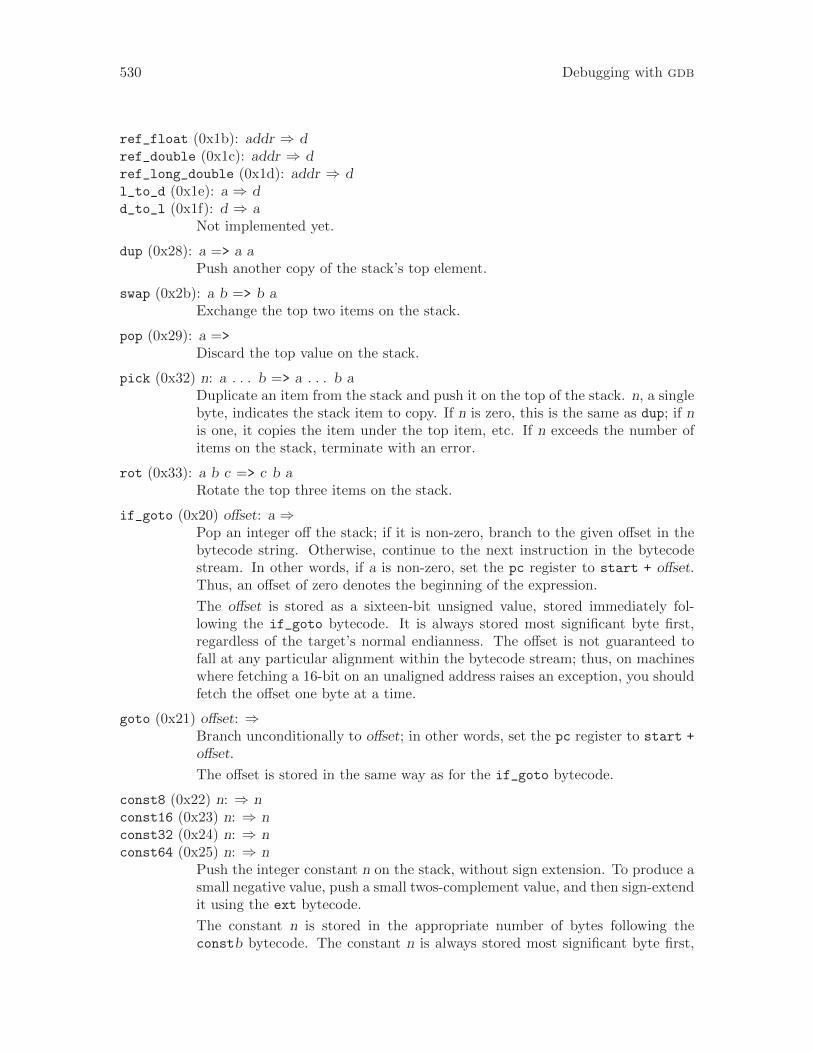
530 Debugging with gdb
ref_float (0x1b): addr ⇒ dref_double (0x1c): addr ⇒ dref_long_double (0x1d): addr ⇒ dl_to_d (0x1e): a ⇒ dd_to_l (0x1f): d ⇒ a
Not implemented yet.
dup (0x28): a => a aPush another copy of the stack’s top element.
swap (0x2b): a b => b aExchange the top two items on the stack.
pop (0x29): a =>Discard the top value on the stack.
pick (0x32) n: a . . . b => a . . . b aDuplicate an item from the stack and push it on the top of the stack. n, a singlebyte, indicates the stack item to copy. If n is zero, this is the same as dup; if nis one, it copies the item under the top item, etc. If n exceeds the number ofitems on the stack, terminate with an error.
rot (0x33): a b c => c b aRotate the top three items on the stack.
if_goto (0x20) offset: a ⇒Pop an integer off the stack; if it is non-zero, branch to the given offset in thebytecode string. Otherwise, continue to the next instruction in the bytecodestream. In other words, if a is non-zero, set the pc register to start + offset.Thus, an offset of zero denotes the beginning of the expression.
The offset is stored as a sixteen-bit unsigned value, stored immediately fol-lowing the if_goto bytecode. It is always stored most significant byte first,regardless of the target’s normal endianness. The offset is not guaranteed tofall at any particular alignment within the bytecode stream; thus, on machineswhere fetching a 16-bit on an unaligned address raises an exception, you shouldfetch the offset one byte at a time.
goto (0x21) offset: ⇒Branch unconditionally to offset; in other words, set the pc register to start +
offset.
The offset is stored in the same way as for the if_goto bytecode.
const8 (0x22) n: ⇒ nconst16 (0x23) n: ⇒ nconst32 (0x24) n: ⇒ nconst64 (0x25) n: ⇒ n
Push the integer constant n on the stack, without sign extension. To produce asmall negative value, push a small twos-complement value, and then sign-extendit using the ext bytecode.
The constant n is stored in the appropriate number of bytes following theconstb bytecode. The constant n is always stored most significant byte first,
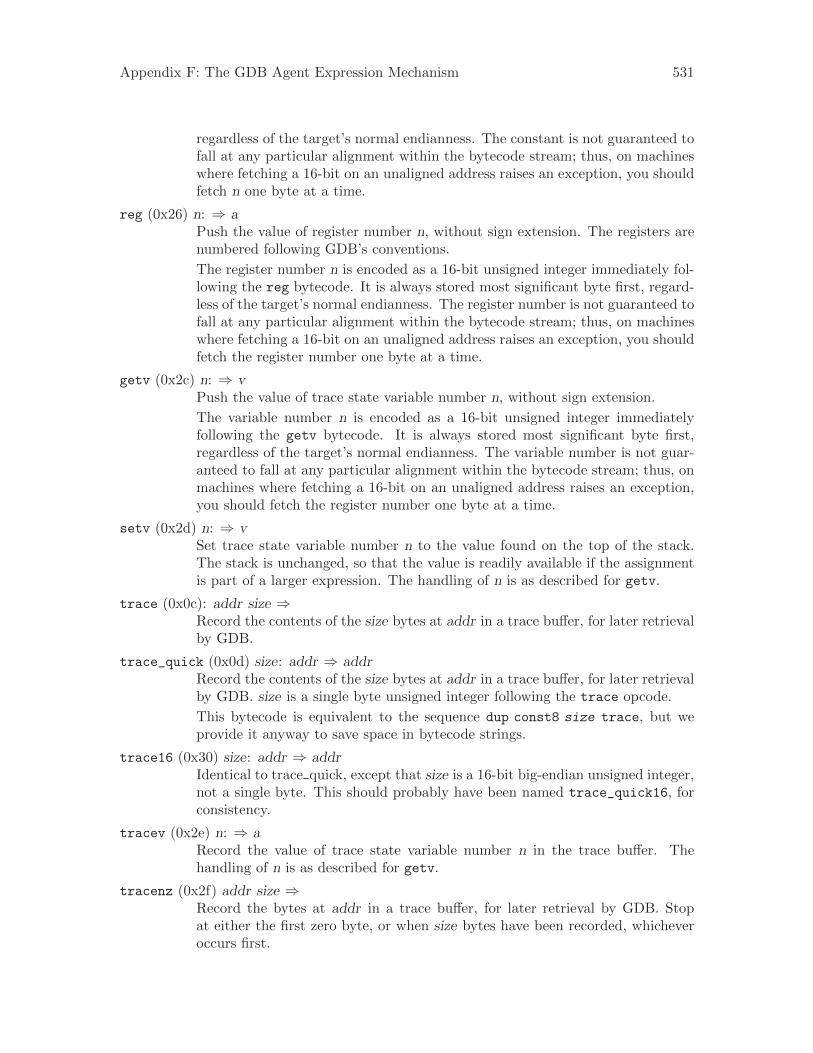
Appendix F: The GDB Agent Expression Mechanism 531
regardless of the target’s normal endianness. The constant is not guaranteed tofall at any particular alignment within the bytecode stream; thus, on machineswhere fetching a 16-bit on an unaligned address raises an exception, you shouldfetch n one byte at a time.
reg (0x26) n: ⇒ aPush the value of register number n, without sign extension. The registers arenumbered following GDB’s conventions.
The register number n is encoded as a 16-bit unsigned integer immediately fol-lowing the reg bytecode. It is always stored most significant byte first, regard-less of the target’s normal endianness. The register number is not guaranteed tofall at any particular alignment within the bytecode stream; thus, on machineswhere fetching a 16-bit on an unaligned address raises an exception, you shouldfetch the register number one byte at a time.
getv (0x2c) n: ⇒ vPush the value of trace state variable number n, without sign extension.
The variable number n is encoded as a 16-bit unsigned integer immediatelyfollowing the getv bytecode. It is always stored most significant byte first,regardless of the target’s normal endianness. The variable number is not guar-anteed to fall at any particular alignment within the bytecode stream; thus, onmachines where fetching a 16-bit on an unaligned address raises an exception,you should fetch the register number one byte at a time.
setv (0x2d) n: ⇒ vSet trace state variable number n to the value found on the top of the stack.The stack is unchanged, so that the value is readily available if the assignmentis part of a larger expression. The handling of n is as described for getv.
trace (0x0c): addr size ⇒Record the contents of the size bytes at addr in a trace buffer, for later retrievalby GDB.
trace_quick (0x0d) size: addr ⇒ addrRecord the contents of the size bytes at addr in a trace buffer, for later retrievalby GDB. size is a single byte unsigned integer following the trace opcode.
This bytecode is equivalent to the sequence dup const8 size trace, but weprovide it anyway to save space in bytecode strings.
trace16 (0x30) size: addr ⇒ addrIdentical to trace quick, except that size is a 16-bit big-endian unsigned integer,not a single byte. This should probably have been named trace_quick16, forconsistency.
tracev (0x2e) n: ⇒ aRecord the value of trace state variable number n in the trace buffer. Thehandling of n is as described for getv.
tracenz (0x2f) addr size ⇒Record the bytes at addr in a trace buffer, for later retrieval by GDB. Stopat either the first zero byte, or when size bytes have been recorded, whicheveroccurs first.
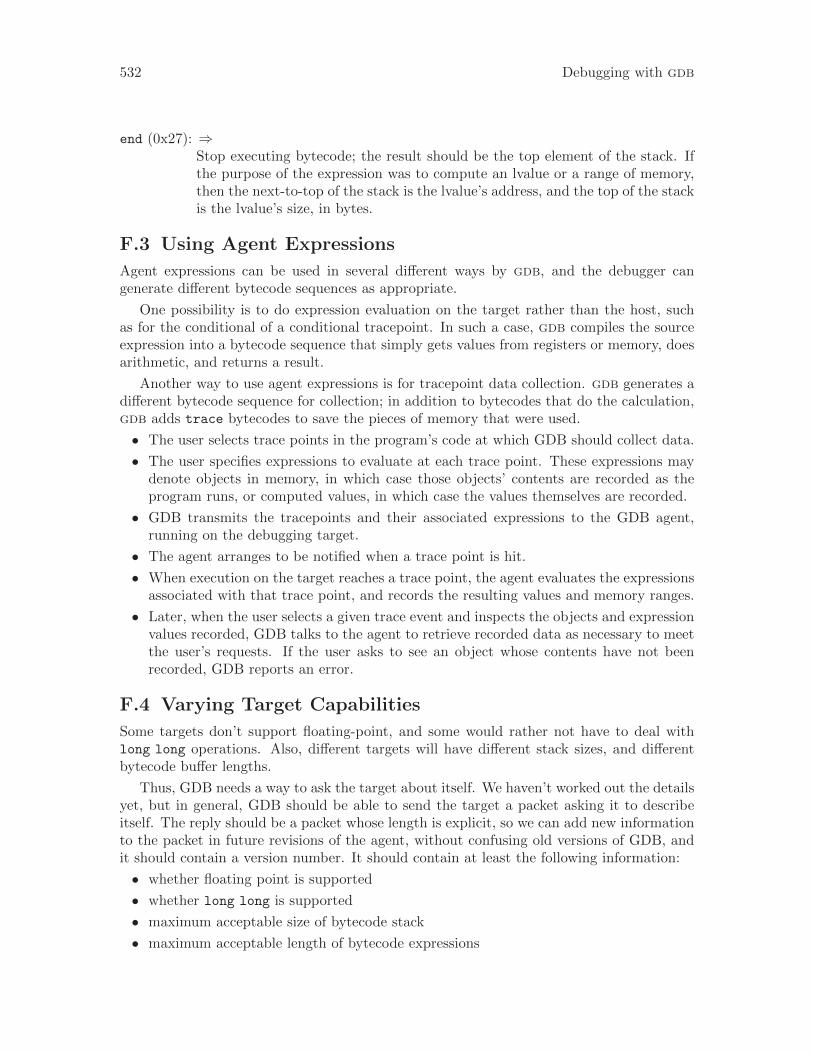
532 Debugging with gdb
end (0x27): ⇒Stop executing bytecode; the result should be the top element of the stack. Ifthe purpose of the expression was to compute an lvalue or a range of memory,then the next-to-top of the stack is the lvalue’s address, and the top of the stackis the lvalue’s size, in bytes.
F.3 Using Agent Expressions
Agent expressions can be used in several different ways by gdb, and the debugger cangenerate different bytecode sequences as appropriate.
One possibility is to do expression evaluation on the target rather than the host, suchas for the conditional of a conditional tracepoint. In such a case, gdb compiles the sourceexpression into a bytecode sequence that simply gets values from registers or memory, doesarithmetic, and returns a result.
Another way to use agent expressions is for tracepoint data collection. gdb generates adifferent bytecode sequence for collection; in addition to bytecodes that do the calculation,gdb adds trace bytecodes to save the pieces of memory that were used.
• The user selects trace points in the program’s code at which GDB should collect data.
• The user specifies expressions to evaluate at each trace point. These expressions maydenote objects in memory, in which case those objects’ contents are recorded as theprogram runs, or computed values, in which case the values themselves are recorded.
• GDB transmits the tracepoints and their associated expressions to the GDB agent,running on the debugging target.
• The agent arranges to be notified when a trace point is hit.
• When execution on the target reaches a trace point, the agent evaluates the expressionsassociated with that trace point, and records the resulting values and memory ranges.
• Later, when the user selects a given trace event and inspects the objects and expressionvalues recorded, GDB talks to the agent to retrieve recorded data as necessary to meetthe user’s requests. If the user asks to see an object whose contents have not beenrecorded, GDB reports an error.
F.4 Varying Target Capabilities
Some targets don’t support floating-point, and some would rather not have to deal withlong long operations. Also, different targets will have different stack sizes, and differentbytecode buffer lengths.
Thus, GDB needs a way to ask the target about itself. We haven’t worked out the detailsyet, but in general, GDB should be able to send the target a packet asking it to describeitself. The reply should be a packet whose length is explicit, so we can add new informationto the packet in future revisions of the agent, without confusing old versions of GDB, andit should contain a version number. It should contain at least the following information:
• whether floating point is supported
• whether long long is supported
• maximum acceptable size of bytecode stack
• maximum acceptable length of bytecode expressions
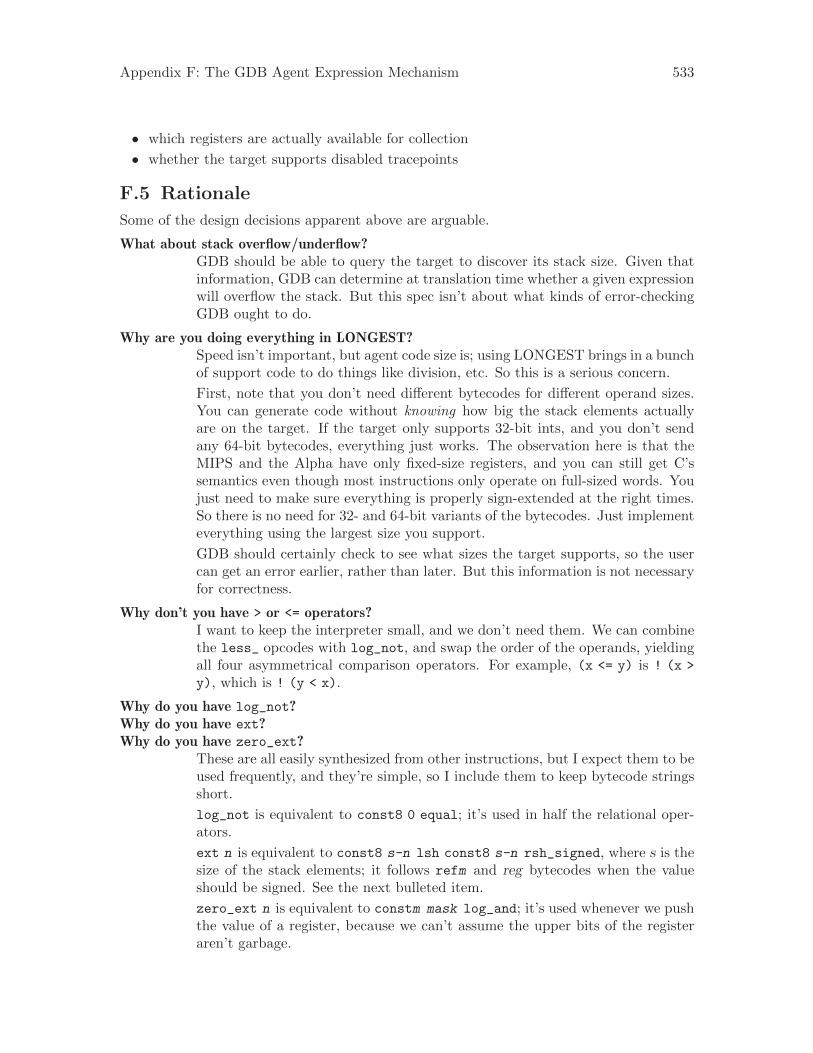
Appendix F: The GDB Agent Expression Mechanism 533
• which registers are actually available for collection
• whether the target supports disabled tracepoints
F.5 Rationale
Some of the design decisions apparent above are arguable.
What about stack overflow/underflow?GDB should be able to query the target to discover its stack size. Given thatinformation, GDB can determine at translation time whether a given expressionwill overflow the stack. But this spec isn’t about what kinds of error-checkingGDB ought to do.
Why are you doing everything in LONGEST?Speed isn’t important, but agent code size is; using LONGEST brings in a bunchof support code to do things like division, etc. So this is a serious concern.
First, note that you don’t need different bytecodes for different operand sizes.You can generate code without knowing how big the stack elements actuallyare on the target. If the target only supports 32-bit ints, and you don’t sendany 64-bit bytecodes, everything just works. The observation here is that theMIPS and the Alpha have only fixed-size registers, and you can still get C’ssemantics even though most instructions only operate on full-sized words. Youjust need to make sure everything is properly sign-extended at the right times.So there is no need for 32- and 64-bit variants of the bytecodes. Just implementeverything using the largest size you support.
GDB should certainly check to see what sizes the target supports, so the usercan get an error earlier, rather than later. But this information is not necessaryfor correctness.
Why don’t you have > or <= operators?I want to keep the interpreter small, and we don’t need them. We can combinethe less_ opcodes with log_not, and swap the order of the operands, yieldingall four asymmetrical comparison operators. For example, (x <= y) is ! (x >
y), which is ! (y < x).
Why do you have log_not?Why do you have ext?Why do you have zero_ext?
These are all easily synthesized from other instructions, but I expect them to beused frequently, and they’re simple, so I include them to keep bytecode stringsshort.
log_not is equivalent to const8 0 equal; it’s used in half the relational oper-ators.
ext n is equivalent to const8 s-n lsh const8 s-n rsh_signed, where s is thesize of the stack elements; it follows refm and reg bytecodes when the valueshould be signed. See the next bulleted item.
zero_ext n is equivalent to constm mask log_and; it’s used whenever we pushthe value of a register, because we can’t assume the upper bits of the registeraren’t garbage.
534 Debugging with gdb
Why not have sign-extending variants of the ref operators?Because that would double the number of ref operators, and we need the extbytecode anyway for accessing bitfields.
Why not have constant-address variants of the ref operators?Because that would double the number of ref operators again, and const32
address ref32 is only one byte longer.
Why do the refn operators have to support unaligned fetches?GDB will generate bytecode that fetches multi-byte values at unaligned ad-dresses whenever the executable’s debugging information tells it to. Further-more, GDB does not know the value the pointer will have when GDB generatesthe bytecode, so it cannot determine whether a particular fetch will be alignedor not.
In particular, structure bitfields may be several bytes long, but follow no align-ment rules; members of packed structures are not necessarily aligned either.
In general, there are many cases where unaligned references occur in correct Ccode, either at the programmer’s explicit request, or at the compiler’s discretion.Thus, it is simpler to make the GDB agent bytecodes work correctly in allcircumstances than to make GDB guess in each case whether the compiler didthe usual thing.
Why are there no side-effecting operators?Because our current client doesn’t want them? That’s a cheap answer. I thinkthe real answer is that I’m afraid of implementing function calls. We shouldre-visit this issue after the present contract is delivered.
Why aren’t the goto ops PC-relative?The interpreter has the base address around anyway for PC bounds checking,and it seemed simpler.
Why is there only one offset size for the goto ops?Offsets are currently sixteen bits. I’m not happy with this situation either:
Suppose we have multiple branch ops with different offset sizes. As I generatecode left-to-right, all my jumps are forward jumps (there are no loops in ex-pressions), so I never know the target when I emit the jump opcode. Thus, Ihave to either always assume the largest offset size, or do jump relaxation onthe code after I generate it, which seems like a big waste of time.
I can imagine a reasonable expression being longer than 256 bytes. I can’timagine one being longer than 64k. Thus, we need 16-bit offsets. This kind ofreasoning is so bogus, but relaxation is pathetic.
The other approach would be to generate code right-to-left. Then I’d alwaysknow my offset size. That might be fun.
Where is the function call bytecode?When we add side-effects, we should add this.
Why does the reg bytecode take a 16-bit register number?Intel’s IA-64 architecture has 128 general-purpose registers, and 128 floating-point registers, and I’m sure it has some random control registers.
Appendix F: The GDB Agent Expression Mechanism 535
Why do we need trace and trace_quick?Because GDB needs to record all the memory contents and registers an expres-sion touches. If the user wants to evaluate an expression x->y->z, the agentmust record the values of x and x->y as well as the value of x->y->z.
Don’t the trace bytecodes make the interpreter less general?They do mean that the interpreter contains special-purpose code, but thatdoesn’t mean the interpreter can only be used for that purpose. If an expressiondoesn’t use the trace bytecodes, they don’t get in its way.
Why doesn’t trace_quick consume its arguments the way everything else does?In general, you do want your operators to consume their arguments; it’s con-sistent, and generally reduces the amount of stack rearrangement necessary.However, trace_quick is a kludge to save space; it only exists so we needn’twrite dup const8 SIZE trace before every memory reference. Therefore, it’sokay for it not to consume its arguments; it’s meant for a specific context inwhich we know exactly what it should do with the stack. If we’re going to havea kludge, it should be an effective kludge.
Why does trace16 exist?That opcode was added by the customer that contracted Cygnus for the datatracing work. I personally think it is unnecessary; objects that large will bequite rare, so it is okay to use dup const16 size trace in those cases.
Whatever we decide to do with trace16, we should at least leave opcode 0x30reserved, to remain compatible with the customer who added it.

Appendix G: Target Descriptions 537
Appendix G Target Descriptions
One of the challenges of using gdb to debug embedded systems is that there are so manyminor variants of each processor architecture in use. It is common practice for vendors tostart with a standard processor core — ARM, PowerPC, or MIPS, for example — and thenmake changes to adapt it to a particular market niche. Some architectures have hundredsof variants, available from dozens of vendors. This leads to a number of problems:
• With so many different customized processors, it is difficult for the gdb maintainers tokeep up with the changes.
• Since individual variants may have short lifetimes or limited audiences, it may not beworthwhile to carry information about every variant in the gdb source tree.
• When gdb does support the architecture of the embedded system at hand, the task offinding the correct architecture name to give the set architecture command can beerror-prone.
To address these problems, the gdb remote protocol allows a target system to notonly identify itself to gdb, but to actually describe its own features. This lets gdb supportprocessor variants it has never seen before — to the extent that the descriptions are accurate,and that gdb understands them.
gdb must be linked with the Expat library to support XML target descriptions. See[Expat], page 453.
G.1 Retrieving Descriptions
Target descriptions can be read from the target automatically, or specified by the usermanually. The default behavior is to read the description from the target. gdb retrievesit via the remote protocol using ‘qXfer’ requests (see Section E.4 [General Query Packets],page 479). The annex in the ‘qXfer’ packet will be ‘target.xml’. The contents of the‘target.xml’ annex are an XML document, of the form described in Section G.2 [TargetDescription Format], page 537.
Alternatively, you can specify a file to read for the target description. If a file is set, thetarget will not be queried. The commands to specify a file are:
set tdesc filename path
Read the target description from path.
unset tdesc filename
Do not read the XML target description from a file. gdb will use the descriptionsupplied by the current target.
show tdesc filename
Show the filename to read for a target description, if any.
G.2 Target Description Format
A target description annex is an XML document which complies with the Document TypeDefinition provided in the gdb sources in ‘gdb/features/gdb-target.dtd’. This meansyou can use generally available tools like xmllint to check that your feature descriptions
538 Debugging with gdb
are well-formed and valid. However, to help people unfamiliar with XML write descriptionsfor their targets, we also describe the grammar here.
Target descriptions can identify the architecture of the remote target and (for somearchitectures) provide information about custom register sets. They can also identify theOS ABI of the remote target. gdb can use this information to autoconfigure for your target,or to warn you if you connect to an unsupported target.
Here is a simple target description:
<target version="1.0">
<architecture>i386:x86-64</architecture>
</target>
This minimal description only says that the target uses the x86-64 architecture.
A target description has the following overall form, with [ ] marking optional elementsand . . . marking repeatable elements. The elements are explained further below.
<?xml version="1.0"?>
<!DOCTYPE target SYSTEM "gdb-target.dtd">
<target version="1.0">
[architecture ][osabi ][compatible ][feature...]
</target>
The description is generally insensitive to whitespace and line breaks, under the usualcommon-sense rules. The XML version declaration and document type declaration cangenerally be omitted (gdb does not require them), but specifying them may be usefulfor XML validation tools. The ‘version’ attribute for ‘<target>’ may also be omitted,but we recommend including it; if future versions of gdb use an incompatible revision of‘gdb-target.dtd’, they will detect and report the version mismatch.
G.2.1 Inclusion
It can sometimes be valuable to split a target description up into several different annexes,either for organizational purposes, or to share files between different possible target descrip-tions. You can divide a description into multiple files by replacing any element of the targetdescription with an inclusion directive of the form:
<xi:include href="document"/>
When gdb encounters an element of this form, it will retrieve the named XML document,and replace the inclusion directive with the contents of that document. If the currentdescription was read using ‘qXfer’, then so will be the included document; document willbe interpreted as the name of an annex. If the current description was read from a file, gdbwill look for document as a file in the same directory where it found the original description.
G.2.2 Architecture
An ‘<architecture>’ element has this form:
<architecture>arch</architecture>
arch is one of the architectures from the set accepted by set architecture (seeChapter 19 [Specifying a Debugging Target], page 215).
Appendix G: Target Descriptions 539
G.2.3 OS ABI
This optional field was introduced in gdb version 7.0. Previous versions of gdb ignore it.
An ‘<osabi>’ element has this form:
<osabi>abi-name</osabi>
abi-name is an OS ABI name from the same selection accepted by set osabi (seeSection 22.6 [Configuring the Current ABI], page 269).
G.2.4 Compatible Architecture
This optional field was introduced in gdb version 7.0. Previous versions of gdb ignore it.
A ‘<compatible>’ element has this form:
<compatible>arch</compatible>
arch is one of the architectures from the set accepted by set architecture (seeChapter 19 [Specifying a Debugging Target], page 215).
A ‘<compatible>’ element is used to specify that the target is able to run binariesin some other than the main target architecture given by the ‘<architecture>’ element.For example, on the Cell Broadband Engine, the main architecture is powerpc:common orpowerpc:common64, but the system is able to run binaries in the spu architecture as well.The way to describe this capability with ‘<compatible>’ is as follows:
<architecture>powerpc:common</architecture>
<compatible>spu</compatible>
G.2.5 Features
Each ‘<feature>’ describes some logical portion of the target system. Features are currentlyused to describe available CPU registers and the types of their contents. A ‘<feature>’element has this form:
<feature name="name">
[type...]reg...
</feature>
Each feature’s name should be unique within the description. The name of a feature doesnot matter unless gdb has some special knowledge of the contents of that feature; if it does,the feature should have its standard name. See Section G.4 [Standard Target Features],page 542.
G.2.6 Types
Any register’s value is a collection of bits which gdb must interpret. The default interpreta-tion is a two’s complement integer, but other types can be requested by name in the registerdescription. Some predefined types are provided by gdb (see Section G.3 [Predefined TargetTypes], page 541), and the description can define additional composite types.
Each type element must have an ‘id’ attribute, which gives a unique (within the con-taining ‘<feature>’) name to the type. Types must be defined before they are used.
Some targets offer vector registers, which can be treated as arrays of scalar elements.These types are written as ‘<vector>’ elements, specifying the array element type, type,and the number of elements, count:
540 Debugging with gdb
<vector id="id" type="type" count="count"/>
If a register’s value is usefully viewed in multiple ways, define it with a union type con-taining the useful representations. The ‘<union>’ element contains one or more ‘<field>’elements, each of which has a name and a type:
<union id="id">
<field name="name" type="type"/>
...
</union>
If a register’s value is composed from several separate values, define it with a structuretype. There are two forms of the ‘<struct>’ element; a ‘<struct>’ element must eithercontain only bitfields or contain no bitfields. If the structure contains only bitfields, itstotal size in bytes must be specified, each bitfield must have an explicit start and end, andbitfields are automatically assigned an integer type. The field’s start should be less than orequal to its end, and zero represents the least significant bit.
<struct id="id" size="size">
<field name="name" start="start" end="end"/>
...
</struct>
If the structure contains no bitfields, then each field has an explicit type, and no implicitpadding is added.
<struct id="id">
<field name="name" type="type"/>
...
</struct>
If a register’s value is a series of single-bit flags, define it with a flags type. The ‘<flags>’element has an explicit size and contains one or more ‘<field>’ elements. Each field has aname, a start, and an end. Only single-bit flags are supported.
<flags id="id" size="size">
<field name="name" start="start" end="end"/>
...
</flags>
G.2.7 Registers
Each register is represented as an element with this form:
<reg name="name"
bitsize="size"
[regnum="num"][save-restore="save-restore"][type="type"][group="group"]/>
The components are as follows:
name The register’s name; it must be unique within the target description.
bitsize The register’s size, in bits.
regnum The register’s number. If omitted, a register’s number is one greater than thatof the previous register (either in the current feature or in a preceding feature);the first register in the target description defaults to zero. This register numberis used to read or write the register; e.g. it is used in the remote p and P
Appendix G: Target Descriptions 541
packets, and registers appear in the g and G packets in order of increasingregister number.
save-restoreWhether the register should be preserved across inferior function calls; this mustbe either yes or no. The default is yes, which is appropriate for most registersexcept for some system control registers; this is not related to the target’s ABI.
type The type of the register. type may be a predefined type, a type defined in thecurrent feature, or one of the special types int and float. int is an integertype of the correct size for bitsize, and float is a floating point type (in thearchitecture’s normal floating point format) of the correct size for bitsize. Thedefault is int.
group The register group to which this register belongs. group must be either general,float, or vector. If no group is specified, gdb will not display the register ininfo registers.
G.3 Predefined Target Types
Type definitions in the self-description can build up composite types from basic buildingblocks, but can not define fundamental types. Instead, standard identifiers are provided bygdb for the fundamental types. The currently supported types are:
int8
int16
int32
int64
int128 Signed integer types holding the specified number of bits.
uint8
uint16
uint32
uint64
uint128 Unsigned integer types holding the specified number of bits.
code_ptr
data_ptr Pointers to unspecified code and data. The program counter and any dedicatedreturn address register may be marked as code pointers; printing a code pointerconverts it into a symbolic address. The stack pointer and any dedicated addressregisters may be marked as data pointers.
ieee_single
Single precision IEEE floating point.
ieee_double
Double precision IEEE floating point.
arm_fpa_ext
The 12-byte extended precision format used by ARM FPA registers.
i387_ext The 10-byte extended precision format used by x87 registers.
542 Debugging with gdb
i386_eflags
32bit eflags register used by x86.
i386_mxcsr
32bit mxcsr register used by x86.
G.4 Standard Target Features
A target description must contain either no registers or all the target’s registers. If thedescription contains no registers, then gdb will assume a default register layout, selectedbased on the architecture. If the description contains any registers, the default layout willnot be used; the standard registers must be described in the target description, in such away that gdb can recognize them.
This is accomplished by giving specific names to feature elements which contain standardregisters. gdb will look for features with those names and verify that they contain theexpected registers; if any known feature is missing required registers, or if any requiredfeature is missing, gdb will reject the target description. You can add additional registersto any of the standard features — gdb will display them just as if they were added to anunrecognized feature.
This section lists the known features and their expected contents. Sample XML docu-ments for these features are included in the gdb source tree, in the directory ‘gdb/features’.
Names recognized by gdb should include the name of the company or organizationwhich selected the name, and the overall architecture to which the feature applies; so e.g.the feature containing ARM core registers is named ‘org.gnu.gdb.arm.core’.
The names of registers are not case sensitive for the purpose of recognizing standardfeatures, but gdb will only display registers using the capitalization used in the description.
G.4.1 ARM Features
The ‘org.gnu.gdb.arm.core’ feature is required for non-M-profile ARM targets. It shouldcontain registers ‘r0’ through ‘r13’, ‘sp’, ‘lr’, ‘pc’, and ‘cpsr’.
For M-profile targets (e.g. Cortex-M3), the ‘org.gnu.gdb.arm.core’ feature is replacedby ‘org.gnu.gdb.arm.m-profile’. It should contain registers ‘r0’ through ‘r13’, ‘sp’, ‘lr’,‘pc’, and ‘xpsr’.
The ‘org.gnu.gdb.arm.fpa’ feature is optional. If present, it should contain registers‘f0’ through ‘f7’ and ‘fps’.
The ‘org.gnu.gdb.xscale.iwmmxt’ feature is optional. If present, it should containat least registers ‘wR0’ through ‘wR15’ and ‘wCGR0’ through ‘wCGR3’. The ‘wCID’, ‘wCon’,‘wCSSF’, and ‘wCASF’ registers are optional.
The ‘org.gnu.gdb.arm.vfp’ feature is optional. If present, it should contain at leastregisters ‘d0’ through ‘d15’. If they are present, ‘d16’ through ‘d31’ should also be included.gdb will synthesize the single-precision registers from halves of the double-precision regis-ters.
The ‘org.gnu.gdb.arm.neon’ feature is optional. It does not need to contain registers; itinstructs gdb to display the VFP double-precision registers as vectors and to synthesize thequad-precision registers from pairs of double-precision registers. If this feature is present,‘org.gnu.gdb.arm.vfp’ must also be present and include 32 double-precision registers.
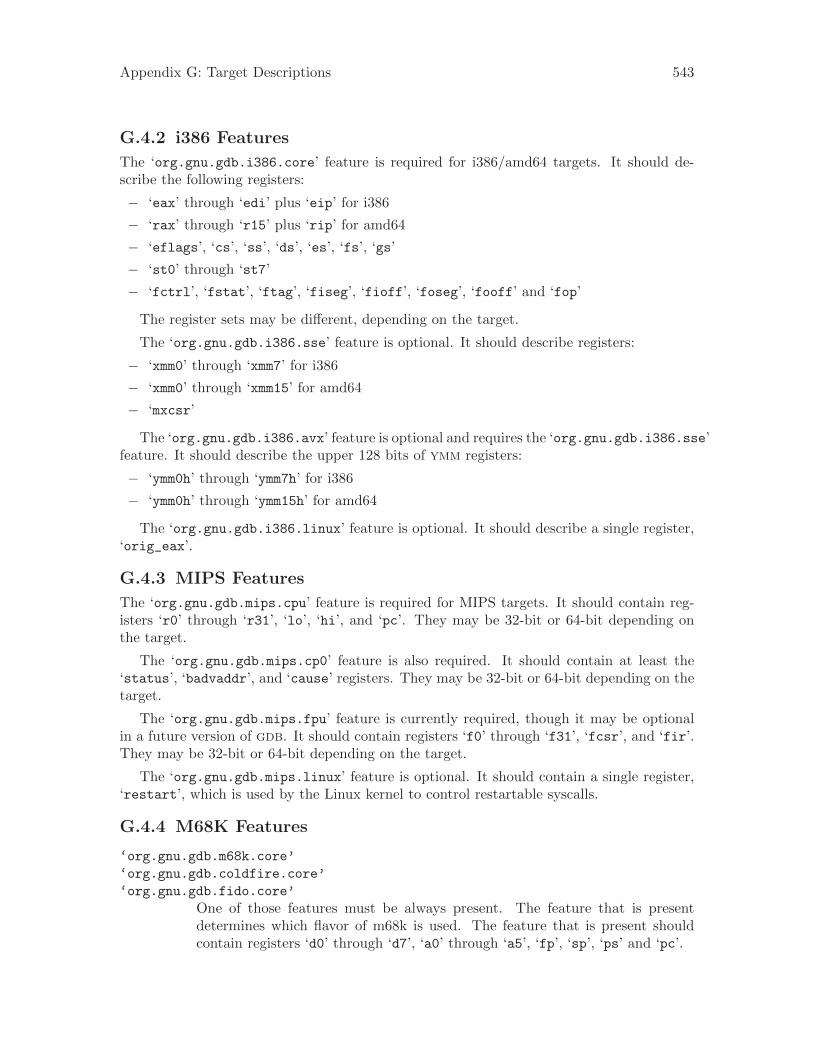
Appendix G: Target Descriptions 543
G.4.2 i386 Features
The ‘org.gnu.gdb.i386.core’ feature is required for i386/amd64 targets. It should de-scribe the following registers:
− ‘eax’ through ‘edi’ plus ‘eip’ for i386
− ‘rax’ through ‘r15’ plus ‘rip’ for amd64
− ‘eflags’, ‘cs’, ‘ss’, ‘ds’, ‘es’, ‘fs’, ‘gs’
− ‘st0’ through ‘st7’
− ‘fctrl’, ‘fstat’, ‘ftag’, ‘fiseg’, ‘fioff’, ‘foseg’, ‘fooff’ and ‘fop’
The register sets may be different, depending on the target.
The ‘org.gnu.gdb.i386.sse’ feature is optional. It should describe registers:
− ‘xmm0’ through ‘xmm7’ for i386
− ‘xmm0’ through ‘xmm15’ for amd64
− ‘mxcsr’
The ‘org.gnu.gdb.i386.avx’ feature is optional and requires the ‘org.gnu.gdb.i386.sse’feature. It should describe the upper 128 bits of ymm registers:
− ‘ymm0h’ through ‘ymm7h’ for i386
− ‘ymm0h’ through ‘ymm15h’ for amd64
The ‘org.gnu.gdb.i386.linux’ feature is optional. It should describe a single register,‘orig_eax’.
G.4.3 MIPS Features
The ‘org.gnu.gdb.mips.cpu’ feature is required for MIPS targets. It should contain reg-isters ‘r0’ through ‘r31’, ‘lo’, ‘hi’, and ‘pc’. They may be 32-bit or 64-bit depending onthe target.
The ‘org.gnu.gdb.mips.cp0’ feature is also required. It should contain at least the‘status’, ‘badvaddr’, and ‘cause’ registers. They may be 32-bit or 64-bit depending on thetarget.
The ‘org.gnu.gdb.mips.fpu’ feature is currently required, though it may be optionalin a future version of gdb. It should contain registers ‘f0’ through ‘f31’, ‘fcsr’, and ‘fir’.They may be 32-bit or 64-bit depending on the target.
The ‘org.gnu.gdb.mips.linux’ feature is optional. It should contain a single register,‘restart’, which is used by the Linux kernel to control restartable syscalls.
G.4.4 M68K Features
‘org.gnu.gdb.m68k.core’
‘org.gnu.gdb.coldfire.core’
‘org.gnu.gdb.fido.core’
One of those features must be always present. The feature that is presentdetermines which flavor of m68k is used. The feature that is present shouldcontain registers ‘d0’ through ‘d7’, ‘a0’ through ‘a5’, ‘fp’, ‘sp’, ‘ps’ and ‘pc’.
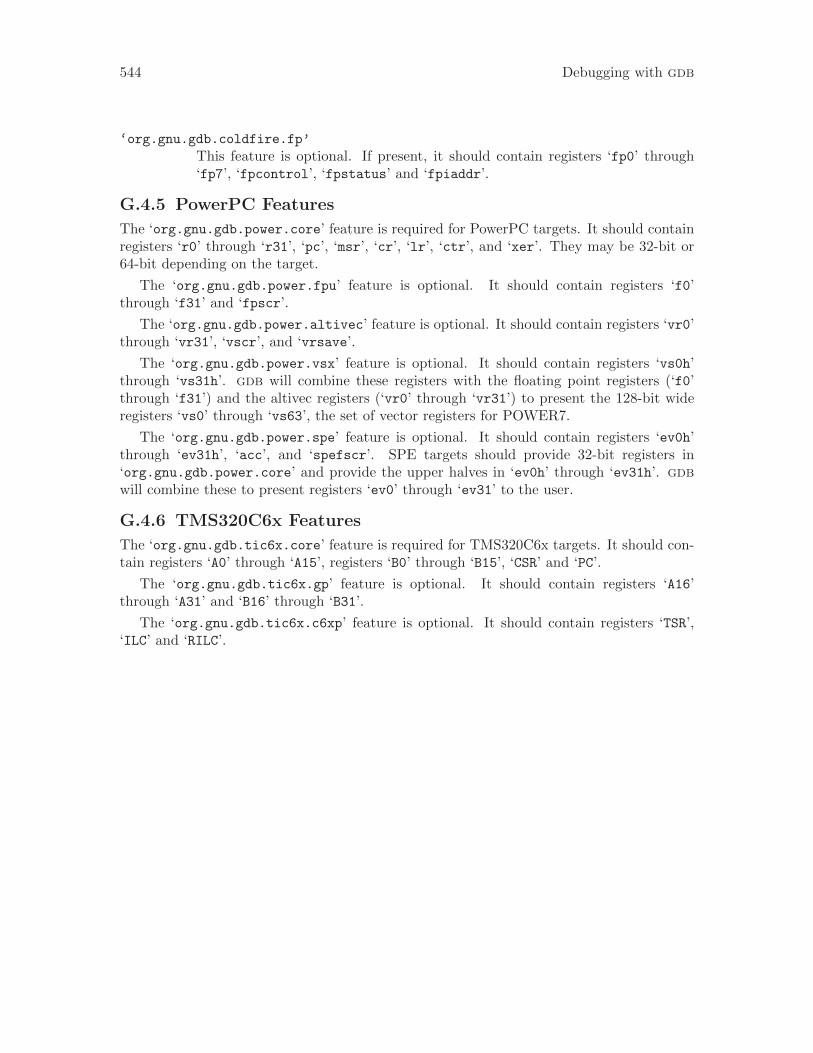
544 Debugging with gdb
‘org.gnu.gdb.coldfire.fp’
This feature is optional. If present, it should contain registers ‘fp0’ through‘fp7’, ‘fpcontrol’, ‘fpstatus’ and ‘fpiaddr’.
G.4.5 PowerPC Features
The ‘org.gnu.gdb.power.core’ feature is required for PowerPC targets. It should containregisters ‘r0’ through ‘r31’, ‘pc’, ‘msr’, ‘cr’, ‘lr’, ‘ctr’, and ‘xer’. They may be 32-bit or64-bit depending on the target.
The ‘org.gnu.gdb.power.fpu’ feature is optional. It should contain registers ‘f0’through ‘f31’ and ‘fpscr’.
The ‘org.gnu.gdb.power.altivec’ feature is optional. It should contain registers ‘vr0’through ‘vr31’, ‘vscr’, and ‘vrsave’.
The ‘org.gnu.gdb.power.vsx’ feature is optional. It should contain registers ‘vs0h’through ‘vs31h’. gdb will combine these registers with the floating point registers (‘f0’through ‘f31’) and the altivec registers (‘vr0’ through ‘vr31’) to present the 128-bit wideregisters ‘vs0’ through ‘vs63’, the set of vector registers for POWER7.
The ‘org.gnu.gdb.power.spe’ feature is optional. It should contain registers ‘ev0h’through ‘ev31h’, ‘acc’, and ‘spefscr’. SPE targets should provide 32-bit registers in‘org.gnu.gdb.power.core’ and provide the upper halves in ‘ev0h’ through ‘ev31h’. gdbwill combine these to present registers ‘ev0’ through ‘ev31’ to the user.
G.4.6 TMS320C6x Features
The ‘org.gnu.gdb.tic6x.core’ feature is required for TMS320C6x targets. It should con-tain registers ‘A0’ through ‘A15’, registers ‘B0’ through ‘B15’, ‘CSR’ and ‘PC’.
The ‘org.gnu.gdb.tic6x.gp’ feature is optional. It should contain registers ‘A16’through ‘A31’ and ‘B16’ through ‘B31’.
The ‘org.gnu.gdb.tic6x.c6xp’ feature is optional. It should contain registers ‘TSR’,‘ILC’ and ‘RILC’.
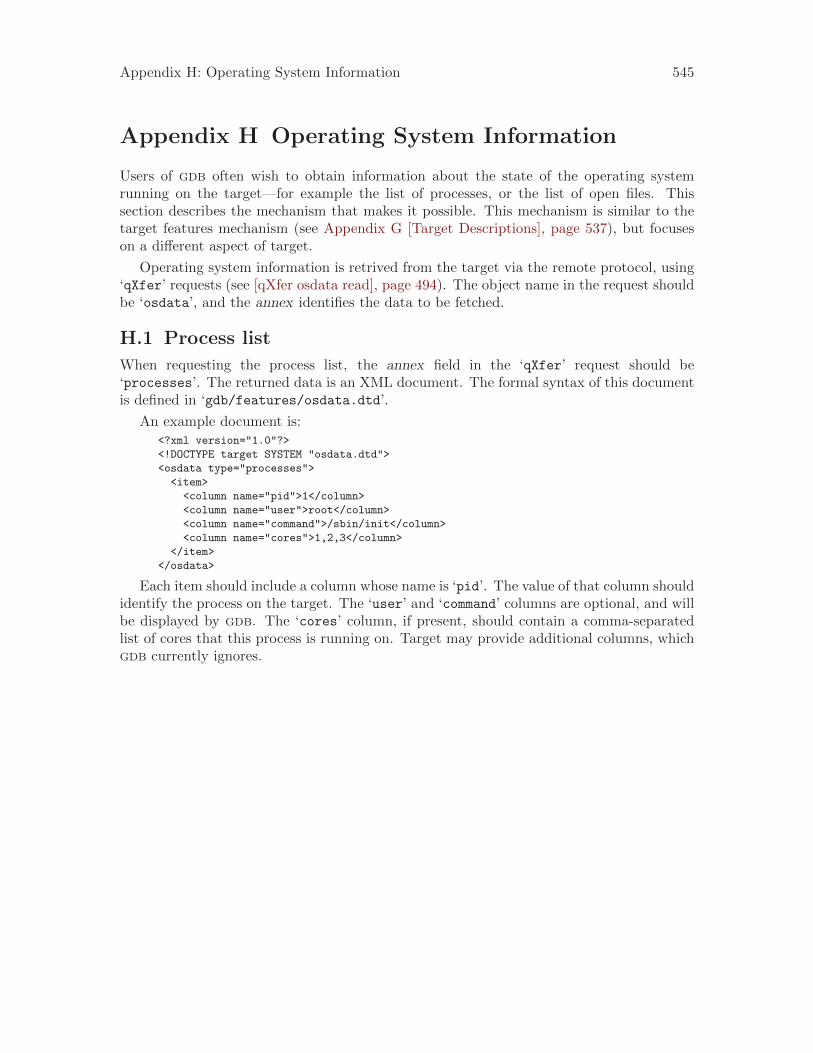
Appendix H: Operating System Information 545
Appendix H Operating System Information
Users of gdb often wish to obtain information about the state of the operating systemrunning on the target—for example the list of processes, or the list of open files. Thissection describes the mechanism that makes it possible. This mechanism is similar to thetarget features mechanism (see Appendix G [Target Descriptions], page 537), but focuseson a different aspect of target.
Operating system information is retrived from the target via the remote protocol, using‘qXfer’ requests (see [qXfer osdata read], page 494). The object name in the request shouldbe ‘osdata’, and the annex identifies the data to be fetched.
H.1 Process list
When requesting the process list, the annex field in the ‘qXfer’ request should be‘processes’. The returned data is an XML document. The formal syntax of this documentis defined in ‘gdb/features/osdata.dtd’.
An example document is:<?xml version="1.0"?>
<!DOCTYPE target SYSTEM "osdata.dtd">
<osdata type="processes">
<item>
<column name="pid">1</column>
<column name="user">root</column>
<column name="command">/sbin/init</column>
<column name="cores">1,2,3</column>
</item>
</osdata>
Each item should include a column whose name is ‘pid’. The value of that column shouldidentify the process on the target. The ‘user’ and ‘command’ columns are optional, and willbe displayed by gdb. The ‘cores’ column, if present, should contain a comma-separatedlist of cores that this process is running on. Target may provide additional columns, whichgdb currently ignores.

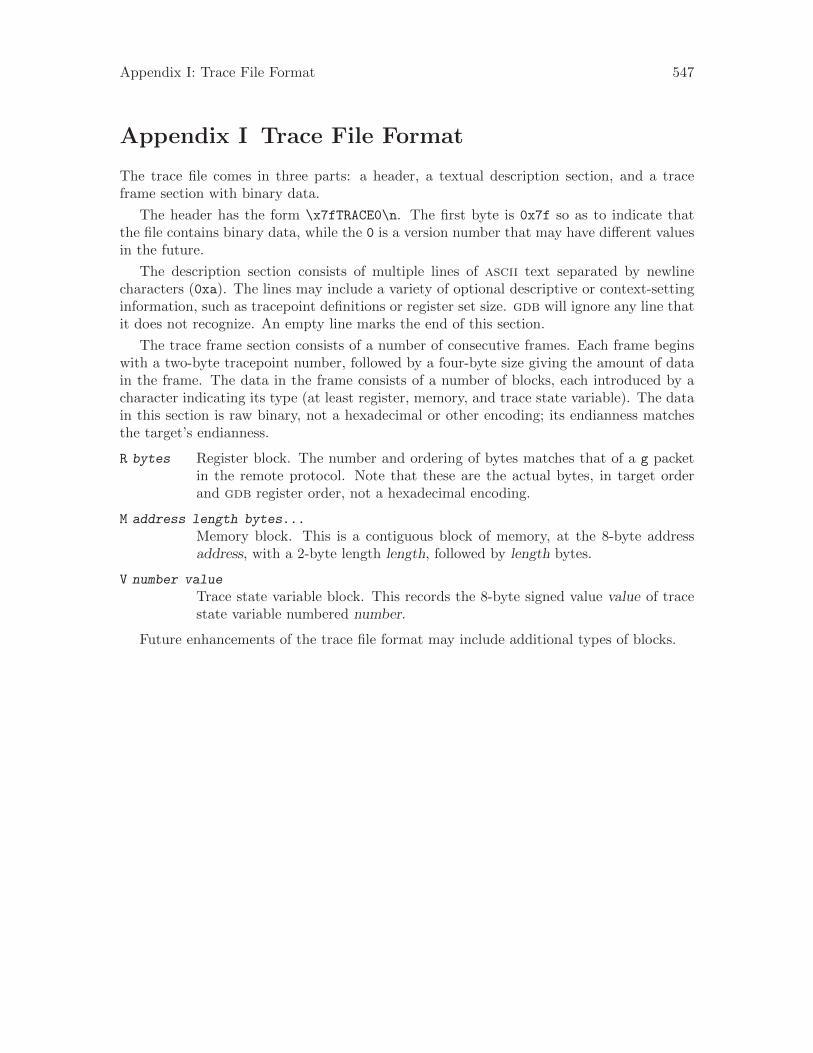
Appendix I: Trace File Format 547
Appendix I Trace File Format
The trace file comes in three parts: a header, a textual description section, and a traceframe section with binary data.
The header has the form \x7fTRACE0\n. The first byte is 0x7f so as to indicate thatthe file contains binary data, while the 0 is a version number that may have different valuesin the future.
The description section consists of multiple lines of ascii text separated by newlinecharacters (0xa). The lines may include a variety of optional descriptive or context-settinginformation, such as tracepoint definitions or register set size. gdb will ignore any line thatit does not recognize. An empty line marks the end of this section.
The trace frame section consists of a number of consecutive frames. Each frame beginswith a two-byte tracepoint number, followed by a four-byte size giving the amount of datain the frame. The data in the frame consists of a number of blocks, each introduced by acharacter indicating its type (at least register, memory, and trace state variable). The datain this section is raw binary, not a hexadecimal or other encoding; its endianness matchesthe target’s endianness.
R bytes Register block. The number and ordering of bytes matches that of a g packetin the remote protocol. Note that these are the actual bytes, in target orderand gdb register order, not a hexadecimal encoding.
M address length bytes...
Memory block. This is a contiguous block of memory, at the 8-byte addressaddress, with a 2-byte length length, followed by length bytes.
V number value
Trace state variable block. This records the 8-byte signed value value of tracestate variable numbered number.
Future enhancements of the trace file format may include additional types of blocks.

Appendix J: .gdb_index section format 549
Appendix J .gdb_index section format
This section documents the index section that is created by save gdb-index (seeSection 18.3 [Index Files], page 212). The index section is DWARF-specific; someknowledge of DWARF is assumed in this description.
The mapped index file format is designed to be directly mmapable on any architecture.In most cases, a datum is represented using a little-endian 32-bit integer value, called anoffset_type. Big endian machines must byte-swap the values before using them. Excep-tions to this rule are noted. The data is laid out such that alignment is always respected.
A mapped index consists of several areas, laid out in order.
1. The file header. This is a sequence of values, of offset_type unless otherwise noted:
1. The version number, currently 5. Versions 1, 2 and 3 are obsolete. Version 4 differsby its hashing function.
2. The offset, from the start of the file, of the CU list.
3. The offset, from the start of the file, of the types CU list. Note that this area canbe empty, in which case this offset will be equal to the next offset.
4. The offset, from the start of the file, of the address area.
5. The offset, from the start of the file, of the symbol table.
6. The offset, from the start of the file, of the constant pool.
2. The CU list. This is a sequence of pairs of 64-bit little-endian values, sorted by the CUoffset. The first element in each pair is the offset of a CU in the .debug_info section.The second element in each pair is the length of that CU. References to a CU elsewherein the map are done using a CU index, which is just the 0-based index into this table.Note that if there are type CUs, then conceptually CUs and type CUs form a singlelist for the purposes of CU indices.
3. The types CU list. This is a sequence of triplets of 64-bit little-endian values. In atriplet, the first value is the CU offset, the second value is the type offset in the CU,and the third value is the type signature. The types CU list is not sorted.
4. The address area. The address area consists of a sequence of address entries. Eachaddress entry has three elements:
1. The low address. This is a 64-bit little-endian value.
2. The high address. This is a 64-bit little-endian value. Like DW_AT_high_pc, thevalue is one byte beyond the end.
3. The CU index. This is an offset_type value.
5. The symbol table. This is an open-addressed hash table. The size of the hash table isalways a power of 2.
Each slot in the hash table consists of a pair of offset_type values. The first value isthe offset of the symbol’s name in the constant pool. The second value is the offset ofthe CU vector in the constant pool.
If both values are 0, then this slot in the hash table is empty. This is ok because while0 is a valid constant pool index, it cannot be a valid index for both a string and a CUvector.
550 Debugging with gdb
The hash value for a table entry is computed by applying an iterative hash function tothe symbol’s name. Starting with an initial value of r = 0, each (unsigned) character‘c’ in the string is incorporated into the hash using the formula depending on the indexversion:
Version 4 The formula is r = r * 67 + c - 113.
Version 5 The formula is r = r * 67 + tolower (c) - 113.
The terminating ‘\0’ is not incorporated into the hash.
The step size used in the hash table is computed via ((hash * 17) & (size - 1)) | 1,where ‘hash’ is the hash value, and ‘size’ is the size of the hash table. The step sizeis used to find the next candidate slot when handling a hash collision.
The names of C++ symbols in the hash table are canonicalized. We don’t currentlyhave a simple description of the canonicalization algorithm; if you intend to create newindex sections, you must read the code.
6. The constant pool. This is simply a bunch of bytes. It is organized so that alignmentis correct: CU vectors are stored first, followed by strings.
A CU vector in the constant pool is a sequence of offset_type values. The first valueis the number of CU indices in the vector. Each subsequent value is the index of a CUin the CU list. This element in the hash table is used to indicate which CUs define thesymbol.
A string in the constant pool is zero-terminated.
Appendix K: GNU GENERAL PUBLIC LICENSE 551
Appendix K GNU GENERAL PUBLIC LICENSE
Version 3, 29 June 2007
Copyright c© 2007 Free Software Foundation, Inc. http://fsf.org/
Everyone is permitted to copy and distribute verbatim copies of thislicense document, but changing it is not allowed.
Preamble
The GNU General Public License is a free, copyleft license for software and other kinds ofworks.
The licenses for most software and other practical works are designed to take away yourfreedom to share and change the works. By contrast, the GNU General Public License isintended to guarantee your freedom to share and change all versions of a program—to makesure it remains free software for all its users. We, the Free Software Foundation, use theGNU General Public License for most of our software; it applies also to any other workreleased this way by its authors. You can apply it to your programs, too.
When we speak of free software, we are referring to freedom, not price. Our GeneralPublic Licenses are designed to make sure that you have the freedom to distribute copiesof free software (and charge for them if you wish), that you receive source code or can getit if you want it, that you can change the software or use pieces of it in new free programs,and that you know you can do these things.
To protect your rights, we need to prevent others from denying you these rights or askingyou to surrender the rights. Therefore, you have certain responsibilities if you distributecopies of the software, or if you modify it: responsibilities to respect the freedom of others.
For example, if you distribute copies of such a program, whether gratis or for a fee, youmust pass on to the recipients the same freedoms that you received. You must make surethat they, too, receive or can get the source code. And you must show them these terms sothey know their rights.
Developers that use the GNU GPL protect your rights with two steps: (1) assert copy-right on the software, and (2) offer you this License giving you legal permission to copy,distribute and/or modify it.
For the developers’ and authors’ protection, the GPL clearly explains that there is nowarranty for this free software. For both users’ and authors’ sake, the GPL requires thatmodified versions be marked as changed, so that their problems will not be attributederroneously to authors of previous versions.
Some devices are designed to deny users access to install or run modified versions of thesoftware inside them, although the manufacturer can do so. This is fundamentally incom-patible with the aim of protecting users’ freedom to change the software. The systematicpattern of such abuse occurs in the area of products for individuals to use, which is pre-cisely where it is most unacceptable. Therefore, we have designed this version of the GPLto prohibit the practice for those products. If such problems arise substantially in otherdomains, we stand ready to extend this provision to those domains in future versions of theGPL, as needed to protect the freedom of users.
552 Debugging with gdb
Finally, every program is threatened constantly by software patents. States should notallow patents to restrict development and use of software on general-purpose computers, butin those that do, we wish to avoid the special danger that patents applied to a free programcould make it effectively proprietary. To prevent this, the GPL assures that patents cannotbe used to render the program non-free.
The precise terms and conditions for copying, distribution and modification follow.
TERMS AND CONDITIONS
0. Definitions.
“This License” refers to version 3 of the GNU General Public License.
“Copyright” also means copyright-like laws that apply to other kinds of works, such assemiconductor masks.
“The Program” refers to any copyrightable work licensed under this License. Eachlicensee is addressed as “you”. “Licensees” and “recipients” may be individuals ororganizations.
To “modify” a work means to copy from or adapt all or part of the work in a fashionrequiring copyright permission, other than the making of an exact copy. The resultingwork is called a “modified version” of the earlier work or a work “based on” the earlierwork.
A “covered work” means either the unmodified Program or a work based on the Pro-gram.
To “propagate” a work means to do anything with it that, without permission, wouldmake you directly or secondarily liable for infringement under applicable copyright law,except executing it on a computer or modifying a private copy. Propagation includescopying, distribution (with or without modification), making available to the public,and in some countries other activities as well.
To “convey” a work means any kind of propagation that enables other parties to makeor receive copies. Mere interaction with a user through a computer network, with notransfer of a copy, is not conveying.
An interactive user interface displays “Appropriate Legal Notices” to the extent that itincludes a convenient and prominently visible feature that (1) displays an appropriatecopyright notice, and (2) tells the user that there is no warranty for the work (exceptto the extent that warranties are provided), that licensees may convey the work underthis License, and how to view a copy of this License. If the interface presents a listof user commands or options, such as a menu, a prominent item in the list meets thiscriterion.
1. Source Code.
The “source code” for a work means the preferred form of the work for making modi-fications to it. “Object code” means any non-source form of a work.
A “Standard Interface” means an interface that either is an official standard definedby a recognized standards body, or, in the case of interfaces specified for a particularprogramming language, one that is widely used among developers working in thatlanguage.
Appendix K: GNU GENERAL PUBLIC LICENSE 553
The “System Libraries” of an executable work include anything, other than the work asa whole, that (a) is included in the normal form of packaging a Major Component, butwhich is not part of that Major Component, and (b) serves only to enable use of thework with that Major Component, or to implement a Standard Interface for which animplementation is available to the public in source code form. A “Major Component”,in this context, means a major essential component (kernel, window system, and soon) of the specific operating system (if any) on which the executable work runs, or acompiler used to produce the work, or an object code interpreter used to run it.
The “Corresponding Source” for a work in object code form means all the source codeneeded to generate, install, and (for an executable work) run the object code and tomodify the work, including scripts to control those activities. However, it does notinclude the work’s System Libraries, or general-purpose tools or generally availablefree programs which are used unmodified in performing those activities but which arenot part of the work. For example, Corresponding Source includes interface definitionfiles associated with source files for the work, and the source code for shared librariesand dynamically linked subprograms that the work is specifically designed to require,such as by intimate data communication or control flow between those subprogramsand other parts of the work.
The Corresponding Source need not include anything that users can regenerate auto-matically from other parts of the Corresponding Source.
The Corresponding Source for a work in source code form is that same work.
2. Basic Permissions.
All rights granted under this License are granted for the term of copyright on theProgram, and are irrevocable provided the stated conditions are met. This License ex-plicitly affirms your unlimited permission to run the unmodified Program. The outputfrom running a covered work is covered by this License only if the output, given itscontent, constitutes a covered work. This License acknowledges your rights of fair useor other equivalent, as provided by copyright law.
You may make, run and propagate covered works that you do not convey, withoutconditions so long as your license otherwise remains in force. You may convey coveredworks to others for the sole purpose of having them make modifications exclusivelyfor you, or provide you with facilities for running those works, provided that youcomply with the terms of this License in conveying all material for which you do notcontrol copyright. Those thus making or running the covered works for you must doso exclusively on your behalf, under your direction and control, on terms that prohibitthem from making any copies of your copyrighted material outside their relationshipwith you.
Conveying under any other circumstances is permitted solely under the conditionsstated below. Sublicensing is not allowed; section 10 makes it unnecessary.
3. Protecting Users’ Legal Rights From Anti-Circumvention Law.
No covered work shall be deemed part of an effective technological measure underany applicable law fulfilling obligations under article 11 of the WIPO copyright treatyadopted on 20 December 1996, or similar laws prohibiting or restricting circumventionof such measures.
554 Debugging with gdb
When you convey a covered work, you waive any legal power to forbid circumvention oftechnological measures to the extent such circumvention is effected by exercising rightsunder this License with respect to the covered work, and you disclaim any intentionto limit operation or modification of the work as a means of enforcing, against thework’s users, your or third parties’ legal rights to forbid circumvention of technologicalmeasures.
4. Conveying Verbatim Copies.
You may convey verbatim copies of the Program’s source code as you receive it, in anymedium, provided that you conspicuously and appropriately publish on each copy anappropriate copyright notice; keep intact all notices stating that this License and anynon-permissive terms added in accord with section 7 apply to the code; keep intact allnotices of the absence of any warranty; and give all recipients a copy of this Licensealong with the Program.
You may charge any price or no price for each copy that you convey, and you may offersupport or warranty protection for a fee.
5. Conveying Modified Source Versions.
You may convey a work based on the Program, or the modifications to produce it fromthe Program, in the form of source code under the terms of section 4, provided thatyou also meet all of these conditions:
a. The work must carry prominent notices stating that you modified it, and giving arelevant date.
b. The work must carry prominent notices stating that it is released under this Li-cense and any conditions added under section 7. This requirement modifies therequirement in section 4 to “keep intact all notices”.
c. You must license the entire work, as a whole, under this License to anyone whocomes into possession of a copy. This License will therefore apply, along with anyapplicable section 7 additional terms, to the whole of the work, and all its parts,regardless of how they are packaged. This License gives no permission to licensethe work in any other way, but it does not invalidate such permission if you haveseparately received it.
d. If the work has interactive user interfaces, each must display Appropriate LegalNotices; however, if the Program has interactive interfaces that do not displayAppropriate Legal Notices, your work need not make them do so.
A compilation of a covered work with other separate and independent works, whichare not by their nature extensions of the covered work, and which are not combinedwith it such as to form a larger program, in or on a volume of a storage or distributionmedium, is called an “aggregate” if the compilation and its resulting copyright arenot used to limit the access or legal rights of the compilation’s users beyond what theindividual works permit. Inclusion of a covered work in an aggregate does not causethis License to apply to the other parts of the aggregate.
6. Conveying Non-Source Forms.
You may convey a covered work in object code form under the terms of sections 4 and5, provided that you also convey the machine-readable Corresponding Source underthe terms of this License, in one of these ways:
Appendix K: GNU GENERAL PUBLIC LICENSE 555
a. Convey the object code in, or embodied in, a physical product (including a phys-ical distribution medium), accompanied by the Corresponding Source fixed on adurable physical medium customarily used for software interchange.
b. Convey the object code in, or embodied in, a physical product (including a physi-cal distribution medium), accompanied by a written offer, valid for at least threeyears and valid for as long as you offer spare parts or customer support for thatproduct model, to give anyone who possesses the object code either (1) a copy ofthe Corresponding Source for all the software in the product that is covered by thisLicense, on a durable physical medium customarily used for software interchange,for a price no more than your reasonable cost of physically performing this con-veying of source, or (2) access to copy the Corresponding Source from a networkserver at no charge.
c. Convey individual copies of the object code with a copy of the written offer toprovide the Corresponding Source. This alternative is allowed only occasionallyand noncommercially, and only if you received the object code with such an offer,in accord with subsection 6b.
d. Convey the object code by offering access from a designated place (gratis or fora charge), and offer equivalent access to the Corresponding Source in the sameway through the same place at no further charge. You need not require recipientsto copy the Corresponding Source along with the object code. If the place tocopy the object code is a network server, the Corresponding Source may be ona different server (operated by you or a third party) that supports equivalentcopying facilities, provided you maintain clear directions next to the object codesaying where to find the Corresponding Source. Regardless of what server hoststhe Corresponding Source, you remain obligated to ensure that it is available foras long as needed to satisfy these requirements.
e. Convey the object code using peer-to-peer transmission, provided you inform otherpeers where the object code and Corresponding Source of the work are being offeredto the general public at no charge under subsection 6d.
A separable portion of the object code, whose source code is excluded from the Cor-responding Source as a System Library, need not be included in conveying the objectcode work.
A “User Product” is either (1) a “consumer product”, which means any tangible per-sonal property which is normally used for personal, family, or household purposes, or(2) anything designed or sold for incorporation into a dwelling. In determining whethera product is a consumer product, doubtful cases shall be resolved in favor of coverage.For a particular product received by a particular user, “normally used” refers to atypical or common use of that class of product, regardless of the status of the par-ticular user or of the way in which the particular user actually uses, or expects or isexpected to use, the product. A product is a consumer product regardless of whetherthe product has substantial commercial, industrial or non-consumer uses, unless suchuses represent the only significant mode of use of the product.
“Installation Information” for a User Product means any methods, procedures, autho-rization keys, or other information required to install and execute modified versions of acovered work in that User Product from a modified version of its Corresponding Source.
556 Debugging with gdb
The information must suffice to ensure that the continued functioning of the modifiedobject code is in no case prevented or interfered with solely because modification hasbeen made.
If you convey an object code work under this section in, or with, or specifically foruse in, a User Product, and the conveying occurs as part of a transaction in whichthe right of possession and use of the User Product is transferred to the recipient inperpetuity or for a fixed term (regardless of how the transaction is characterized),the Corresponding Source conveyed under this section must be accompanied by theInstallation Information. But this requirement does not apply if neither you nor anythird party retains the ability to install modified object code on the User Product (forexample, the work has been installed in ROM).
The requirement to provide Installation Information does not include a requirementto continue to provide support service, warranty, or updates for a work that has beenmodified or installed by the recipient, or for the User Product in which it has beenmodified or installed. Access to a network may be denied when the modification itselfmaterially and adversely affects the operation of the network or violates the rules andprotocols for communication across the network.
Corresponding Source conveyed, and Installation Information provided, in accord withthis section must be in a format that is publicly documented (and with an implementa-tion available to the public in source code form), and must require no special passwordor key for unpacking, reading or copying.
7. Additional Terms.
“Additional permissions” are terms that supplement the terms of this License by mak-ing exceptions from one or more of its conditions. Additional permissions that areapplicable to the entire Program shall be treated as though they were included in thisLicense, to the extent that they are valid under applicable law. If additional permis-sions apply only to part of the Program, that part may be used separately under thosepermissions, but the entire Program remains governed by this License without regardto the additional permissions.
When you convey a copy of a covered work, you may at your option remove anyadditional permissions from that copy, or from any part of it. (Additional permissionsmay be written to require their own removal in certain cases when you modify thework.) You may place additional permissions on material, added by you to a coveredwork, for which you have or can give appropriate copyright permission.
Notwithstanding any other provision of this License, for material you add to a coveredwork, you may (if authorized by the copyright holders of that material) supplementthe terms of this License with terms:
a. Disclaiming warranty or limiting liability differently from the terms of sections 15and 16 of this License; or
b. Requiring preservation of specified reasonable legal notices or author attributionsin that material or in the Appropriate Legal Notices displayed by works containingit; or
c. Prohibiting misrepresentation of the origin of that material, or requiring that mod-ified versions of such material be marked in reasonable ways as different from theoriginal version; or
Appendix K: GNU GENERAL PUBLIC LICENSE 557
d. Limiting the use for publicity purposes of names of licensors or authors of thematerial; or
e. Declining to grant rights under trademark law for use of some trade names, trade-marks, or service marks; or
f. Requiring indemnification of licensors and authors of that material by anyone whoconveys the material (or modified versions of it) with contractual assumptionsof liability to the recipient, for any liability that these contractual assumptionsdirectly impose on those licensors and authors.
All other non-permissive additional terms are considered “further restrictions” withinthe meaning of section 10. If the Program as you received it, or any part of it, con-tains a notice stating that it is governed by this License along with a term that is afurther restriction, you may remove that term. If a license document contains a furtherrestriction but permits relicensing or conveying under this License, you may add to acovered work material governed by the terms of that license document, provided thatthe further restriction does not survive such relicensing or conveying.
If you add terms to a covered work in accord with this section, you must place, in therelevant source files, a statement of the additional terms that apply to those files, or anotice indicating where to find the applicable terms.
Additional terms, permissive or non-permissive, may be stated in the form of a sep-arately written license, or stated as exceptions; the above requirements apply eitherway.
8. Termination.
You may not propagate or modify a covered work except as expressly provided un-der this License. Any attempt otherwise to propagate or modify it is void, and willautomatically terminate your rights under this License (including any patent licensesgranted under the third paragraph of section 11).
However, if you cease all violation of this License, then your license from a particularcopyright holder is reinstated (a) provisionally, unless and until the copyright holderexplicitly and finally terminates your license, and (b) permanently, if the copyrightholder fails to notify you of the violation by some reasonable means prior to 60 daysafter the cessation.
Moreover, your license from a particular copyright holder is reinstated permanently ifthe copyright holder notifies you of the violation by some reasonable means, this is thefirst time you have received notice of violation of this License (for any work) from thatcopyright holder, and you cure the violation prior to 30 days after your receipt of thenotice.
Termination of your rights under this section does not terminate the licenses of partieswho have received copies or rights from you under this License. If your rights havebeen terminated and not permanently reinstated, you do not qualify to receive newlicenses for the same material under section 10.
9. Acceptance Not Required for Having Copies.
You are not required to accept this License in order to receive or run a copy of theProgram. Ancillary propagation of a covered work occurring solely as a consequence ofusing peer-to-peer transmission to receive a copy likewise does not require acceptance.
558 Debugging with gdb
However, nothing other than this License grants you permission to propagate or modifyany covered work. These actions infringe copyright if you do not accept this License.Therefore, by modifying or propagating a covered work, you indicate your acceptanceof this License to do so.
10. Automatic Licensing of Downstream Recipients.
Each time you convey a covered work, the recipient automatically receives a licensefrom the original licensors, to run, modify and propagate that work, subject to thisLicense. You are not responsible for enforcing compliance by third parties with thisLicense.
An “entity transaction” is a transaction transferring control of an organization, orsubstantially all assets of one, or subdividing an organization, or merging organizations.If propagation of a covered work results from an entity transaction, each party to thattransaction who receives a copy of the work also receives whatever licenses to the workthe party’s predecessor in interest had or could give under the previous paragraph, plusa right to possession of the Corresponding Source of the work from the predecessor ininterest, if the predecessor has it or can get it with reasonable efforts.
You may not impose any further restrictions on the exercise of the rights granted oraffirmed under this License. For example, you may not impose a license fee, royalty, orother charge for exercise of rights granted under this License, and you may not initiatelitigation (including a cross-claim or counterclaim in a lawsuit) alleging that any patentclaim is infringed by making, using, selling, offering for sale, or importing the Programor any portion of it.
11. Patents.
A “contributor” is a copyright holder who authorizes use under this License of theProgram or a work on which the Program is based. The work thus licensed is calledthe contributor’s “contributor version”.
A contributor’s “essential patent claims” are all patent claims owned or controlled bythe contributor, whether already acquired or hereafter acquired, that would be infringedby some manner, permitted by this License, of making, using, or selling its contributorversion, but do not include claims that would be infringed only as a consequence offurther modification of the contributor version. For purposes of this definition, “con-trol” includes the right to grant patent sublicenses in a manner consistent with therequirements of this License.
Each contributor grants you a non-exclusive, worldwide, royalty-free patent licenseunder the contributor’s essential patent claims, to make, use, sell, offer for sale, importand otherwise run, modify and propagate the contents of its contributor version.
In the following three paragraphs, a “patent license” is any express agreement or com-mitment, however denominated, not to enforce a patent (such as an express permissionto practice a patent or covenant not to sue for patent infringement). To “grant” sucha patent license to a party means to make such an agreement or commitment not toenforce a patent against the party.
If you convey a covered work, knowingly relying on a patent license, and the Corre-sponding Source of the work is not available for anyone to copy, free of charge and underthe terms of this License, through a publicly available network server or other readilyaccessible means, then you must either (1) cause the Corresponding Source to be so
Appendix K: GNU GENERAL PUBLIC LICENSE 559
available, or (2) arrange to deprive yourself of the benefit of the patent license for thisparticular work, or (3) arrange, in a manner consistent with the requirements of thisLicense, to extend the patent license to downstream recipients. “Knowingly relying”means you have actual knowledge that, but for the patent license, your conveying thecovered work in a country, or your recipient’s use of the covered work in a country,would infringe one or more identifiable patents in that country that you have reasonto believe are valid.
If, pursuant to or in connection with a single transaction or arrangement, you convey,or propagate by procuring conveyance of, a covered work, and grant a patent licenseto some of the parties receiving the covered work authorizing them to use, propagate,modify or convey a specific copy of the covered work, then the patent license you grantis automatically extended to all recipients of the covered work and works based on it.
A patent license is “discriminatory” if it does not include within the scope of its cover-age, prohibits the exercise of, or is conditioned on the non-exercise of one or more of therights that are specifically granted under this License. You may not convey a coveredwork if you are a party to an arrangement with a third party that is in the business ofdistributing software, under which you make payment to the third party based on theextent of your activity of conveying the work, and under which the third party grants,to any of the parties who would receive the covered work from you, a discriminatorypatent license (a) in connection with copies of the covered work conveyed by you (orcopies made from those copies), or (b) primarily for and in connection with specificproducts or compilations that contain the covered work, unless you entered into thatarrangement, or that patent license was granted, prior to 28 March 2007.
Nothing in this License shall be construed as excluding or limiting any implied license orother defenses to infringement that may otherwise be available to you under applicablepatent law.
12. No Surrender of Others’ Freedom.
If conditions are imposed on you (whether by court order, agreement or otherwise) thatcontradict the conditions of this License, they do not excuse you from the conditionsof this License. If you cannot convey a covered work so as to satisfy simultaneouslyyour obligations under this License and any other pertinent obligations, then as aconsequence you may not convey it at all. For example, if you agree to terms thatobligate you to collect a royalty for further conveying from those to whom you conveythe Program, the only way you could satisfy both those terms and this License wouldbe to refrain entirely from conveying the Program.
13. Use with the GNU Affero General Public License.
Notwithstanding any other provision of this License, you have permission to link orcombine any covered work with a work licensed under version 3 of the GNU AfferoGeneral Public License into a single combined work, and to convey the resulting work.The terms of this License will continue to apply to the part which is the covered work,but the special requirements of the GNU Affero General Public License, section 13,concerning interaction through a network will apply to the combination as such.
14. Revised Versions of this License.
560 Debugging with gdb
The Free Software Foundation may publish revised and/or new versions of the GNUGeneral Public License from time to time. Such new versions will be similar in spiritto the present version, but may differ in detail to address new problems or concerns.
Each version is given a distinguishing version number. If the Program specifies thata certain numbered version of the GNU General Public License “or any later version”applies to it, you have the option of following the terms and conditions either of thatnumbered version or of any later version published by the Free Software Foundation.If the Program does not specify a version number of the GNU General Public License,you may choose any version ever published by the Free Software Foundation.
If the Program specifies that a proxy can decide which future versions of the GNUGeneral Public License can be used, that proxy’s public statement of acceptance of aversion permanently authorizes you to choose that version for the Program.
Later license versions may give you additional or different permissions. However, noadditional obligations are imposed on any author or copyright holder as a result of yourchoosing to follow a later version.
15. Disclaimer of Warranty.
THERE IS NO WARRANTY FOR THE PROGRAM, TO THE EXTENT PER-MITTED BY APPLICABLE LAW. EXCEPT WHEN OTHERWISE STATED INWRITING THE COPYRIGHT HOLDERS AND/OR OTHER PARTIES PROVIDETHE PROGRAM “AS IS” WITHOUT WARRANTY OF ANY KIND, EITHER EX-PRESSED OR IMPLIED, INCLUDING, BUT NOT LIMITED TO, THE IMPLIEDWARRANTIES OF MERCHANTABILITY AND FITNESS FOR A PARTICULARPURPOSE. THE ENTIRE RISK AS TO THE QUALITY AND PERFORMANCEOF THE PROGRAM IS WITH YOU. SHOULD THE PROGRAM PROVE DEFEC-TIVE, YOU ASSUME THE COST OF ALL NECESSARY SERVICING, REPAIR ORCORRECTION.
16. Limitation of Liability.
IN NO EVENT UNLESS REQUIRED BY APPLICABLE LAW OR AGREED TO INWRITING WILL ANY COPYRIGHT HOLDER, OR ANY OTHER PARTY WHOMODIFIES AND/OR CONVEYS THE PROGRAM AS PERMITTED ABOVE, BELIABLE TO YOU FOR DAMAGES, INCLUDING ANY GENERAL, SPECIAL, IN-CIDENTAL OR CONSEQUENTIAL DAMAGES ARISING OUT OF THE USE ORINABILITY TO USE THE PROGRAM (INCLUDING BUT NOT LIMITED TOLOSS OF DATA OR DATA BEING RENDERED INACCURATE OR LOSSES SUS-TAINED BY YOU OR THIRD PARTIES OR A FAILURE OF THE PROGRAMTO OPERATE WITH ANY OTHER PROGRAMS), EVEN IF SUCH HOLDER OROTHER PARTY HAS BEEN ADVISED OF THE POSSIBILITY OF SUCH DAM-AGES.
17. Interpretation of Sections 15 and 16.
If the disclaimer of warranty and limitation of liability provided above cannot be givenlocal legal effect according to their terms, reviewing courts shall apply local law thatmost closely approximates an absolute waiver of all civil liability in connection withthe Program, unless a warranty or assumption of liability accompanies a copy of theProgram in return for a fee.
Appendix K: GNU GENERAL PUBLIC LICENSE 561
END OF TERMS AND CONDITIONS
How to Apply These Terms to Your New Programs
If you develop a new program, and you want it to be of the greatest possible use to the public,the best way to achieve this is to make it free software which everyone can redistribute andchange under these terms.
To do so, attach the following notices to the program. It is safest to attach them to thestart of each source file to most effectively state the exclusion of warranty; and each fileshould have at least the “copyright” line and a pointer to where the full notice is found.
one line to give the program’s name and a brief idea of what it does.
Copyright (C) year name of author
This program is free software: you can redistribute it and/or modify
it under the terms of the GNU General Public License as published by
the Free Software Foundation, either version 3 of the License, or (at
your option) any later version.
This program is distributed in the hope that it will be useful, but
WITHOUT ANY WARRANTY; without even the implied warranty of
MERCHANTABILITY or FITNESS FOR A PARTICULAR PURPOSE. See the GNU
General Public License for more details.
You should have received a copy of the GNU General Public License
along with this program. If not, see http://www.gnu.org/licenses/.
Also add information on how to contact you by electronic and paper mail.
If the program does terminal interaction, make it output a short notice like this when itstarts in an interactive mode:
program Copyright (C) year name of author
This program comes with ABSOLUTELY NO WARRANTY; for details type ‘show w’.
This is free software, and you are welcome to redistribute it
under certain conditions; type ‘show c’ for details.
The hypothetical commands ‘show w’ and ‘show c’ should show the appropriate parts ofthe General Public License. Of course, your program’s commands might be different; for aGUI interface, you would use an “about box”.
You should also get your employer (if you work as a programmer) or school, if any, tosign a “copyright disclaimer” for the program, if necessary. For more information on this,and how to apply and follow the GNU GPL, see http://www.gnu.org/licenses/.
The GNU General Public License does not permit incorporating your program intoproprietary programs. If your program is a subroutine library, you may consider it moreuseful to permit linking proprietary applications with the library. If this is what you wantto do, use the GNU Lesser General Public License instead of this License. But first, pleaseread http://www.gnu.org/philosophy/why-not-lgpl.html.

Appendix L: GNU Free Documentation License 563
Appendix L GNU Free Documentation License
Version 1.3, 3 November 2008
Copyright c© 2000, 2001, 2002, 2007, 2008 Free Software Foundation, Inc.http://fsf.org/
Everyone is permitted to copy and distribute verbatim copiesof this license document, but changing it is not allowed.
0. PREAMBLE
The purpose of this License is to make a manual, textbook, or other functional anduseful document free in the sense of freedom: to assure everyone the effective freedomto copy and redistribute it, with or without modifying it, either commercially or non-commercially. Secondarily, this License preserves for the author and publisher a wayto get credit for their work, while not being considered responsible for modificationsmade by others.
This License is a kind of “copyleft”, which means that derivative works of the documentmust themselves be free in the same sense. It complements the GNU General PublicLicense, which is a copyleft license designed for free software.
We have designed this License in order to use it for manuals for free software, becausefree software needs free documentation: a free program should come with manualsproviding the same freedoms that the software does. But this License is not limited tosoftware manuals; it can be used for any textual work, regardless of subject matter orwhether it is published as a printed book. We recommend this License principally forworks whose purpose is instruction or reference.
1. APPLICABILITY AND DEFINITIONS
This License applies to any manual or other work, in any medium, that contains anotice placed by the copyright holder saying it can be distributed under the termsof this License. Such a notice grants a world-wide, royalty-free license, unlimited induration, to use that work under the conditions stated herein. The “Document”,below, refers to any such manual or work. Any member of the public is a licensee, andis addressed as “you”. You accept the license if you copy, modify or distribute the workin a way requiring permission under copyright law.
A “Modified Version” of the Document means any work containing the Document ora portion of it, either copied verbatim, or with modifications and/or translated intoanother language.
A “Secondary Section” is a named appendix or a front-matter section of the Documentthat deals exclusively with the relationship of the publishers or authors of the Documentto the Document’s overall subject (or to related matters) and contains nothing thatcould fall directly within that overall subject. (Thus, if the Document is in part atextbook of mathematics, a Secondary Section may not explain any mathematics.) Therelationship could be a matter of historical connection with the subject or with relatedmatters, or of legal, commercial, philosophical, ethical or political position regardingthem.
The “Invariant Sections” are certain Secondary Sections whose titles are designated, asbeing those of Invariant Sections, in the notice that says that the Document is released
564 Debugging with gdb
under this License. If a section does not fit the above definition of Secondary then it isnot allowed to be designated as Invariant. The Document may contain zero InvariantSections. If the Document does not identify any Invariant Sections then there are none.
The “Cover Texts” are certain short passages of text that are listed, as Front-CoverTexts or Back-Cover Texts, in the notice that says that the Document is released underthis License. A Front-Cover Text may be at most 5 words, and a Back-Cover Text maybe at most 25 words.
A “Transparent” copy of the Document means a machine-readable copy, representedin a format whose specification is available to the general public, that is suitable forrevising the document straightforwardly with generic text editors or (for images com-posed of pixels) generic paint programs or (for drawings) some widely available drawingeditor, and that is suitable for input to text formatters or for automatic translation toa variety of formats suitable for input to text formatters. A copy made in an otherwiseTransparent file format whose markup, or absence of markup, has been arranged tothwart or discourage subsequent modification by readers is not Transparent. An imageformat is not Transparent if used for any substantial amount of text. A copy that isnot “Transparent” is called “Opaque”.
Examples of suitable formats for Transparent copies include plain ascii withoutmarkup, Texinfo input format, LaTEX input format, SGML or XML using a publiclyavailable DTD, and standard-conforming simple HTML, PostScript or PDF designedfor human modification. Examples of transparent image formats include PNG, XCF
and JPG. Opaque formats include proprietary formats that can be read and editedonly by proprietary word processors, SGML or XML for which the DTD and/orprocessing tools are not generally available, and the machine-generated HTML,PostScript or PDF produced by some word processors for output purposes only.
The “Title Page” means, for a printed book, the title page itself, plus such followingpages as are needed to hold, legibly, the material this License requires to appear in thetitle page. For works in formats which do not have any title page as such, “Title Page”means the text near the most prominent appearance of the work’s title, preceding thebeginning of the body of the text.
The “publisher” means any person or entity that distributes copies of the Documentto the public.
A section “Entitled XYZ” means a named subunit of the Document whose title eitheris precisely XYZ or contains XYZ in parentheses following text that translates XYZ inanother language. (Here XYZ stands for a specific section name mentioned below, suchas “Acknowledgements”, “Dedications”, “Endorsements”, or “History”.) To “Preservethe Title” of such a section when you modify the Document means that it remains asection “Entitled XYZ” according to this definition.
The Document may include Warranty Disclaimers next to the notice which states thatthis License applies to the Document. These Warranty Disclaimers are considered tobe included by reference in this License, but only as regards disclaiming warranties:any other implication that these Warranty Disclaimers may have is void and has noeffect on the meaning of this License.
2. VERBATIM COPYING
Appendix L: GNU Free Documentation License 565
You may copy and distribute the Document in any medium, either commercially ornoncommercially, provided that this License, the copyright notices, and the licensenotice saying this License applies to the Document are reproduced in all copies, andthat you add no other conditions whatsoever to those of this License. You may not usetechnical measures to obstruct or control the reading or further copying of the copiesyou make or distribute. However, you may accept compensation in exchange for copies.If you distribute a large enough number of copies you must also follow the conditionsin section 3.
You may also lend copies, under the same conditions stated above, and you may publiclydisplay copies.
3. COPYING IN QUANTITY
If you publish printed copies (or copies in media that commonly have printed covers) ofthe Document, numbering more than 100, and the Document’s license notice requiresCover Texts, you must enclose the copies in covers that carry, clearly and legibly, allthese Cover Texts: Front-Cover Texts on the front cover, and Back-Cover Texts onthe back cover. Both covers must also clearly and legibly identify you as the publisherof these copies. The front cover must present the full title with all words of the titleequally prominent and visible. You may add other material on the covers in addition.Copying with changes limited to the covers, as long as they preserve the title of theDocument and satisfy these conditions, can be treated as verbatim copying in otherrespects.
If the required texts for either cover are too voluminous to fit legibly, you should putthe first ones listed (as many as fit reasonably) on the actual cover, and continue therest onto adjacent pages.
If you publish or distribute Opaque copies of the Document numbering more than 100,you must either include a machine-readable Transparent copy along with each Opaquecopy, or state in or with each Opaque copy a computer-network location from whichthe general network-using public has access to download using public-standard networkprotocols a complete Transparent copy of the Document, free of added material. Ifyou use the latter option, you must take reasonably prudent steps, when you begindistribution of Opaque copies in quantity, to ensure that this Transparent copy willremain thus accessible at the stated location until at least one year after the last timeyou distribute an Opaque copy (directly or through your agents or retailers) of thatedition to the public.
It is requested, but not required, that you contact the authors of the Document wellbefore redistributing any large number of copies, to give them a chance to provide youwith an updated version of the Document.
4. MODIFICATIONS
You may copy and distribute a Modified Version of the Document under the conditionsof sections 2 and 3 above, provided that you release the Modified Version under preciselythis License, with the Modified Version filling the role of the Document, thus licensingdistribution and modification of the Modified Version to whoever possesses a copy ofit. In addition, you must do these things in the Modified Version:
A. Use in the Title Page (and on the covers, if any) a title distinct from that of theDocument, and from those of previous versions (which should, if there were any,
566 Debugging with gdb
be listed in the History section of the Document). You may use the same title asa previous version if the original publisher of that version gives permission.
B. List on the Title Page, as authors, one or more persons or entities responsible forauthorship of the modifications in the Modified Version, together with at least fiveof the principal authors of the Document (all of its principal authors, if it has fewerthan five), unless they release you from this requirement.
C. State on the Title page the name of the publisher of the Modified Version, as thepublisher.
D. Preserve all the copyright notices of the Document.
E. Add an appropriate copyright notice for your modifications adjacent to the othercopyright notices.
F. Include, immediately after the copyright notices, a license notice giving the publicpermission to use the Modified Version under the terms of this License, in the formshown in the Addendum below.
G. Preserve in that license notice the full lists of Invariant Sections and required CoverTexts given in the Document’s license notice.
H. Include an unaltered copy of this License.
I. Preserve the section Entitled “History”, Preserve its Title, and add to it an itemstating at least the title, year, new authors, and publisher of the Modified Versionas given on the Title Page. If there is no section Entitled “History” in the Docu-ment, create one stating the title, year, authors, and publisher of the Documentas given on its Title Page, then add an item describing the Modified Version asstated in the previous sentence.
J. Preserve the network location, if any, given in the Document for public access toa Transparent copy of the Document, and likewise the network locations given inthe Document for previous versions it was based on. These may be placed in the“History” section. You may omit a network location for a work that was publishedat least four years before the Document itself, or if the original publisher of theversion it refers to gives permission.
K. For any section Entitled “Acknowledgements” or “Dedications”, Preserve the Titleof the section, and preserve in the section all the substance and tone of each of thecontributor acknowledgements and/or dedications given therein.
L. Preserve all the Invariant Sections of the Document, unaltered in their text andin their titles. Section numbers or the equivalent are not considered part of thesection titles.
M. Delete any section Entitled “Endorsements”. Such a section may not be includedin the Modified Version.
N. Do not retitle any existing section to be Entitled “Endorsements” or to conflict intitle with any Invariant Section.
O. Preserve any Warranty Disclaimers.
If the Modified Version includes new front-matter sections or appendices that qualifyas Secondary Sections and contain no material copied from the Document, you may atyour option designate some or all of these sections as invariant. To do this, add their
Appendix L: GNU Free Documentation License 567
titles to the list of Invariant Sections in the Modified Version’s license notice. Thesetitles must be distinct from any other section titles.
You may add a section Entitled “Endorsements”, provided it contains nothing butendorsements of your Modified Version by various parties—for example, statements ofpeer review or that the text has been approved by an organization as the authoritativedefinition of a standard.
You may add a passage of up to five words as a Front-Cover Text, and a passage of upto 25 words as a Back-Cover Text, to the end of the list of Cover Texts in the ModifiedVersion. Only one passage of Front-Cover Text and one of Back-Cover Text may beadded by (or through arrangements made by) any one entity. If the Document alreadyincludes a cover text for the same cover, previously added by you or by arrangementmade by the same entity you are acting on behalf of, you may not add another; butyou may replace the old one, on explicit permission from the previous publisher thatadded the old one.
The author(s) and publisher(s) of the Document do not by this License give permissionto use their names for publicity for or to assert or imply endorsement of any ModifiedVersion.
5. COMBINING DOCUMENTS
You may combine the Document with other documents released under this License,under the terms defined in section 4 above for modified versions, provided that youinclude in the combination all of the Invariant Sections of all of the original documents,unmodified, and list them all as Invariant Sections of your combined work in its licensenotice, and that you preserve all their Warranty Disclaimers.
The combined work need only contain one copy of this License, and multiple identicalInvariant Sections may be replaced with a single copy. If there are multiple InvariantSections with the same name but different contents, make the title of each such sectionunique by adding at the end of it, in parentheses, the name of the original author orpublisher of that section if known, or else a unique number. Make the same adjustmentto the section titles in the list of Invariant Sections in the license notice of the combinedwork.
In the combination, you must combine any sections Entitled “History” in the vari-ous original documents, forming one section Entitled “History”; likewise combine anysections Entitled “Acknowledgements”, and any sections Entitled “Dedications”. Youmust delete all sections Entitled “Endorsements.”
6. COLLECTIONS OF DOCUMENTS
You may make a collection consisting of the Document and other documents releasedunder this License, and replace the individual copies of this License in the variousdocuments with a single copy that is included in the collection, provided that youfollow the rules of this License for verbatim copying of each of the documents in allother respects.
You may extract a single document from such a collection, and distribute it individu-ally under this License, provided you insert a copy of this License into the extracteddocument, and follow this License in all other respects regarding verbatim copying ofthat document.
568 Debugging with gdb
7. AGGREGATION WITH INDEPENDENT WORKS
A compilation of the Document or its derivatives with other separate and independentdocuments or works, in or on a volume of a storage or distribution medium, is calledan “aggregate” if the copyright resulting from the compilation is not used to limit thelegal rights of the compilation’s users beyond what the individual works permit. Whenthe Document is included in an aggregate, this License does not apply to the otherworks in the aggregate which are not themselves derivative works of the Document.
If the Cover Text requirement of section 3 is applicable to these copies of the Document,then if the Document is less than one half of the entire aggregate, the Document’s CoverTexts may be placed on covers that bracket the Document within the aggregate, or theelectronic equivalent of covers if the Document is in electronic form. Otherwise theymust appear on printed covers that bracket the whole aggregate.
8. TRANSLATION
Translation is considered a kind of modification, so you may distribute translationsof the Document under the terms of section 4. Replacing Invariant Sections withtranslations requires special permission from their copyright holders, but you mayinclude translations of some or all Invariant Sections in addition to the original versionsof these Invariant Sections. You may include a translation of this License, and all thelicense notices in the Document, and any Warranty Disclaimers, provided that youalso include the original English version of this License and the original versions ofthose notices and disclaimers. In case of a disagreement between the translation andthe original version of this License or a notice or disclaimer, the original version willprevail.
If a section in the Document is Entitled “Acknowledgements”, “Dedications”, or “His-tory”, the requirement (section 4) to Preserve its Title (section 1) will typically requirechanging the actual title.
9. TERMINATION
You may not copy, modify, sublicense, or distribute the Document except as expresslyprovided under this License. Any attempt otherwise to copy, modify, sublicense, ordistribute it is void, and will automatically terminate your rights under this License.
However, if you cease all violation of this License, then your license from a particularcopyright holder is reinstated (a) provisionally, unless and until the copyright holderexplicitly and finally terminates your license, and (b) permanently, if the copyrightholder fails to notify you of the violation by some reasonable means prior to 60 daysafter the cessation.
Moreover, your license from a particular copyright holder is reinstated permanently ifthe copyright holder notifies you of the violation by some reasonable means, this is thefirst time you have received notice of violation of this License (for any work) from thatcopyright holder, and you cure the violation prior to 30 days after your receipt of thenotice.
Termination of your rights under this section does not terminate the licenses of partieswho have received copies or rights from you under this License. If your rights havebeen terminated and not permanently reinstated, receipt of a copy of some or all of thesame material does not give you any rights to use it.
Appendix L: GNU Free Documentation License 569
10. FUTURE REVISIONS OF THIS LICENSE
The Free Software Foundation may publish new, revised versions of the GNU FreeDocumentation License from time to time. Such new versions will be similar in spiritto the present version, but may differ in detail to address new problems or concerns.See http://www.gnu.org/copyleft/.
Each version of the License is given a distinguishing version number. If the Documentspecifies that a particular numbered version of this License “or any later version”applies to it, you have the option of following the terms and conditions either of thatspecified version or of any later version that has been published (not as a draft) bythe Free Software Foundation. If the Document does not specify a version number ofthis License, you may choose any version ever published (not as a draft) by the FreeSoftware Foundation. If the Document specifies that a proxy can decide which futureversions of this License can be used, that proxy’s public statement of acceptance of aversion permanently authorizes you to choose that version for the Document.
11. RELICENSING
“Massive Multiauthor Collaboration Site” (or “MMC Site”) means any World WideWeb server that publishes copyrightable works and also provides prominent facilitiesfor anybody to edit those works. A public wiki that anybody can edit is an example ofsuch a server. A “Massive Multiauthor Collaboration” (or “MMC”) contained in thesite means any set of copyrightable works thus published on the MMC site.
“CC-BY-SA” means the Creative Commons Attribution-Share Alike 3.0 license pub-lished by Creative Commons Corporation, a not-for-profit corporation with a principalplace of business in San Francisco, California, as well as future copyleft versions of thatlicense published by that same organization.
“Incorporate” means to publish or republish a Document, in whole or in part, as partof another Document.
An MMC is “eligible for relicensing” if it is licensed under this License, and if all worksthat were first published under this License somewhere other than this MMC, andsubsequently incorporated in whole or in part into the MMC, (1) had no cover textsor invariant sections, and (2) were thus incorporated prior to November 1, 2008.
The operator of an MMC Site may republish an MMC contained in the site underCC-BY-SA on the same site at any time before August 1, 2009, provided the MMC iseligible for relicensing.
570 Debugging with gdb
ADDENDUM: How to use this License for your documents
To use this License in a document you have written, include a copy of the License in thedocument and put the following copyright and license notices just after the title page:
Copyright (C) year your name.
Permission is granted to copy, distribute and/or modify this document
under the terms of the GNU Free Documentation License, Version 1.3
or any later version published by the Free Software Foundation;
with no Invariant Sections, no Front-Cover Texts, and no Back-Cover
Texts. A copy of the license is included in the section entitled ‘‘GNU
Free Documentation License’’.
If you have Invariant Sections, Front-Cover Texts and Back-Cover Texts, replace the“with. . .Texts.” line with this:
with the Invariant Sections being list their titles, with
the Front-Cover Texts being list, and with the Back-Cover Texts
being list.
If you have Invariant Sections without Cover Texts, or some other combination of thethree, merge those two alternatives to suit the situation.
If your document contains nontrivial examples of program code, we recommend releasingthese examples in parallel under your choice of free software license, such as the GNUGeneral Public License, to permit their use in free software.
Index 571
Index
!! . . . . . . . . . . . . . . . . . . . . . . . . . . . . . . . . . . . . . . . . . . . . . . 17‘!’ packet . . . . . . . . . . . . . . . . . . . . . . . . . . . . . . . . . . . . 469
## (a comment) . . . . . . . . . . . . . . . . . . . . . . . . . . . . . . . . . 19# in Modula-2 . . . . . . . . . . . . . . . . . . . . . . . . . . . . . . . . 180
$$ . . . . . . . . . . . . . . . . . . . . . . . . . . . . . . . . . . . . . . . . . . . . . 116$$ . . . . . . . . . . . . . . . . . . . . . . . . . . . . . . . . . . . . . . . . . . . . 116$_ and info breakpoints . . . . . . . . . . . . . . . . . . . . . . 46$_ and info line . . . . . . . . . . . . . . . . . . . . . . . . . . . . . . 93$_, $__, and value history . . . . . . . . . . . . . . . . . . . . 104$_, convenience variable . . . . . . . . . . . . . . . . . . . . . . 118$__, convenience variable . . . . . . . . . . . . . . . . . . . . . 118$_exitcode, convenience variable . . . . . . . . . . . . . 118$_sdata, collect . . . . . . . . . . . . . . . . . . . . . . . . . . . . . . 145$_sdata, inspect, convenience variable . . . . . . . . 118$_siginfo, convenience variable . . . . . . . . . . . . . . 118$_thread, convenience variable . . . . . . . . . . . . . . . . 36$_tlb, convenience variable . . . . . . . . . . . . . . . . . . . 118$bpnum, convenience variable . . . . . . . . . . . . . . . . . . . 44$cdir, convenience variable . . . . . . . . . . . . . . . . . . . . 92$cwd, convenience variable . . . . . . . . . . . . . . . . . . . . . 92$tpnum . . . . . . . . . . . . . . . . . . . . . . . . . . . . . . . . . . . . . . . 142$trace_file . . . . . . . . . . . . . . . . . . . . . . . . . . . . . . . . . 154$trace_frame . . . . . . . . . . . . . . . . . . . . . . . . . . . . . . . . 153$trace_func . . . . . . . . . . . . . . . . . . . . . . . . . . . . . . . . . 154$trace_line . . . . . . . . . . . . . . . . . . . . . . . . . . . . . . . . . 153$tracepoint . . . . . . . . . . . . . . . . . . . . . . . . . . . . . . . . . 153
---annotate . . . . . . . . . . . . . . . . . . . . . . . . . . . . . . . . . . . . 14--args . . . . . . . . . . . . . . . . . . . . . . . . . . . . . . . . . . . . . . . . 14‘--attach’, gdbserver option . . . . . . . . . . . . . . . . . 222--batch . . . . . . . . . . . . . . . . . . . . . . . . . . . . . . . . . . . . . . . 13--batch-silent . . . . . . . . . . . . . . . . . . . . . . . . . . . . . . . 13--baud . . . . . . . . . . . . . . . . . . . . . . . . . . . . . . . . . . . . . . . . 14--cd . . . . . . . . . . . . . . . . . . . . . . . . . . . . . . . . . . . . . . . . . . 14--command . . . . . . . . . . . . . . . . . . . . . . . . . . . . . . . . . . . . . 12--core . . . . . . . . . . . . . . . . . . . . . . . . . . . . . . . . . . . . . . . . 12--data-directory . . . . . . . . . . . . . . . . . . . . . . . . . . . . . 14‘--debug’, gdbserver option . . . . . . . . . . . . . . . . . . 223--directory . . . . . . . . . . . . . . . . . . . . . . . . . . . . . . . . . . 12--epoch . . . . . . . . . . . . . . . . . . . . . . . . . . . . . . . . . . . . . . . 14--eval-command . . . . . . . . . . . . . . . . . . . . . . . . . . . . . . . 12--exec . . . . . . . . . . . . . . . . . . . . . . . . . . . . . . . . . . . . . . . . 12--fullname . . . . . . . . . . . . . . . . . . . . . . . . . . . . . . . . . . . . 14--interpreter . . . . . . . . . . . . . . . . . . . . . . . . . . . . . . . . 15‘--multi’, gdbserver option . . . . . . . . . . . . . . . . . . 222
--nowindows . . . . . . . . . . . . . . . . . . . . . . . . . . . . . . . . . . 14--nx . . . . . . . . . . . . . . . . . . . . . . . . . . . . . . . . . . . . . . . . . . 13‘--once’, gdbserver option . . . . . . . . . . . . . . . . . . . 223--pid . . . . . . . . . . . . . . . . . . . . . . . . . . . . . . . . . . . . . . . . . 12--quiet . . . . . . . . . . . . . . . . . . . . . . . . . . . . . . . . . . . . . . . 13--readnow . . . . . . . . . . . . . . . . . . . . . . . . . . . . . . . . . . . . . 13‘--remote-debug’, gdbserver option . . . . . . . . . . 223--return-child-result . . . . . . . . . . . . . . . . . . . . . . . 13--se . . . . . . . . . . . . . . . . . . . . . . . . . . . . . . . . . . . . . . . . . . 12--silent . . . . . . . . . . . . . . . . . . . . . . . . . . . . . . . . . . . . . . 13--statistics . . . . . . . . . . . . . . . . . . . . . . . . . . . . . . . . . 15--symbols . . . . . . . . . . . . . . . . . . . . . . . . . . . . . . . . . . . . . 12--tty . . . . . . . . . . . . . . . . . . . . . . . . . . . . . . . . . . . . . . . . . 15--tui . . . . . . . . . . . . . . . . . . . . . . . . . . . . . . . . . . . . . . . . . 15--version . . . . . . . . . . . . . . . . . . . . . . . . . . . . . . . . . . . . . 15--windows . . . . . . . . . . . . . . . . . . . . . . . . . . . . . . . . . . . . . 14‘--with-gdb-datadir’ . . . . . . . . . . . . . . . . . . . . . . . . 214‘--with-relocated-sources’ . . . . . . . . . . . . . . . . . . 91‘--with-sysroot’ . . . . . . . . . . . . . . . . . . . . . . . . . . . . . 207‘--wrapper’, gdbserver option . . . . . . . . . . . . . . . . 223--write . . . . . . . . . . . . . . . . . . . . . . . . . . . . . . . . . . . . . . . 15-ada-task-info . . . . . . . . . . . . . . . . . . . . . . . . . . . . . . 362-add-inferior . . . . . . . . . . . . . . . . . . . . . . . . . . . . . . . 407-b . . . . . . . . . . . . . . . . . . . . . . . . . . . . . . . . . . . . . . . . . . . . . 14-break-after . . . . . . . . . . . . . . . . . . . . . . . . . . . . . . . . 349-break-commands . . . . . . . . . . . . . . . . . . . . . . . . . . . . . 350-break-condition . . . . . . . . . . . . . . . . . . . . . . . . . . . . 350-break-delete . . . . . . . . . . . . . . . . . . . . . . . . . . . . . . . 351-break-disable . . . . . . . . . . . . . . . . . . . . . . . . . . . . . . 351-break-enable . . . . . . . . . . . . . . . . . . . . . . . . . . . . . . . 352-break-info . . . . . . . . . . . . . . . . . . . . . . . . . . . . . . . . . 353-break-insert . . . . . . . . . . . . . . . . . . . . . . . . . . . . . . . 353-break-list . . . . . . . . . . . . . . . . . . . . . . . . . . . . . . . . . 354-break-passcount . . . . . . . . . . . . . . . . . . . . . . . . . . . . 355-break-watch . . . . . . . . . . . . . . . . . . . . . . . . . . . . . . . . 355-c . . . . . . . . . . . . . . . . . . . . . . . . . . . . . . . . . . . . . . . . . . . . . 12-d . . . . . . . . . . . . . . . . . . . . . . . . . . . . . . . . . . . . . . . . . . . . . 12-data-disassemble . . . . . . . . . . . . . . . . . . . . . . . . . . 385-data-evaluate-expression . . . . . . . . . . . . . . . . . 387-data-list-changed-registers . . . . . . . . . . . . . . 388-data-list-register-names . . . . . . . . . . . . . . . . . 388-data-list-register-values . . . . . . . . . . . . . . . . 389-data-read-memory . . . . . . . . . . . . . . . . . . . . . . . . . . 390-data-read-memory-bytes . . . . . . . . . . . . . . . . . . . 391-data-write-memory-bytes . . . . . . . . . . . . . . . . . . 392-e . . . . . . . . . . . . . . . . . . . . . . . . . . . . . . . . . . . . . . . . . . . . . 12-enable-pretty-printing . . . . . . . . . . . . . . . . . . . 376-enable-timings . . . . . . . . . . . . . . . . . . . . . . . . . . . . . 409-environment-cd . . . . . . . . . . . . . . . . . . . . . . . . . . . . . 358-environment-directory . . . . . . . . . . . . . . . . . . . . . 358-environment-path . . . . . . . . . . . . . . . . . . . . . . . . . . 359-environment-pwd . . . . . . . . . . . . . . . . . . . . . . . . . . . . 360-ex . . . . . . . . . . . . . . . . . . . . . . . . . . . . . . . . . . . . . . . . . . . . 12-exec-arguments . . . . . . . . . . . . . . . . . . . . . . . . . . . . . 358-exec-continue . . . . . . . . . . . . . . . . . . . . . . . . . . . . . . 363
572 Debugging with gdb
-exec-finish . . . . . . . . . . . . . . . . . . . . . . . . . . . . . . . . 364-exec-interrupt . . . . . . . . . . . . . . . . . . . . . . . . . . . . . 364-exec-jump . . . . . . . . . . . . . . . . . . . . . . . . . . . . . . . . . . 365-exec-next . . . . . . . . . . . . . . . . . . . . . . . . . . . . . . . . . . 365-exec-next-instruction . . . . . . . . . . . . . . . . . . . . . 366-exec-return . . . . . . . . . . . . . . . . . . . . . . . . . . . . . . . . 366-exec-run . . . . . . . . . . . . . . . . . . . . . . . . . . . . . . . . . . . . 367-exec-step . . . . . . . . . . . . . . . . . . . . . . . . . . . . . . . . . . 368-exec-step-instruction . . . . . . . . . . . . . . . . . . . . . 369-exec-until . . . . . . . . . . . . . . . . . . . . . . . . . . . . . . . . . 369-f . . . . . . . . . . . . . . . . . . . . . . . . . . . . . . . . . . . . . . . . . . . . . 14-file-exec-and-symbols . . . . . . . . . . . . . . . . . . . . . 397-file-exec-file . . . . . . . . . . . . . . . . . . . . . . . . . . . . . 397-file-list-exec-source-file . . . . . . . . . . . . . . . 398-file-list-exec-source-files . . . . . . . . . . . . . . 398-file-symbol-file . . . . . . . . . . . . . . . . . . . . . . . . . . 398-gdb-exit . . . . . . . . . . . . . . . . . . . . . . . . . . . . . . . . . . . . 403-gdb-set . . . . . . . . . . . . . . . . . . . . . . . . . . . . . . . . . . . . . 404-gdb-show . . . . . . . . . . . . . . . . . . . . . . . . . . . . . . . . . . . . 404-gdb-version . . . . . . . . . . . . . . . . . . . . . . . . . . . . . . . . 404-inferior-tty-set . . . . . . . . . . . . . . . . . . . . . . . . . . 408-inferior-tty-show . . . . . . . . . . . . . . . . . . . . . . . . . 408-interpreter-exec . . . . . . . . . . . . . . . . . . . . . . . . . . 408-l . . . . . . . . . . . . . . . . . . . . . . . . . . . . . . . . . . . . . . . . . . . . . 15-list-features . . . . . . . . . . . . . . . . . . . . . . . . . . . . . . 405-list-target-features . . . . . . . . . . . . . . . . . . . . . . 406-list-thread-groups . . . . . . . . . . . . . . . . . . . . . . . . 406-n . . . . . . . . . . . . . . . . . . . . . . . . . . . . . . . . . . . . . . . . . . . . . 13-nw . . . . . . . . . . . . . . . . . . . . . . . . . . . . . . . . . . . . . . . . . . . . 14-p . . . . . . . . . . . . . . . . . . . . . . . . . . . . . . . . . . . . . . . . . . . . . 12-q . . . . . . . . . . . . . . . . . . . . . . . . . . . . . . . . . . . . . . . . . . . . . 13-r . . . . . . . . . . . . . . . . . . . . . . . . . . . . . . . . . . . . . . . . . . . . . 13-s . . . . . . . . . . . . . . . . . . . . . . . . . . . . . . . . . . . . . . . . . . . . . 12-stack-info-depth . . . . . . . . . . . . . . . . . . . . . . . . . . 370-stack-info-frame . . . . . . . . . . . . . . . . . . . . . . . . . . 370-stack-list-arguments . . . . . . . . . . . . . . . . . . . . . . 371-stack-list-frames . . . . . . . . . . . . . . . . . . . . . . . . . 372-stack-list-locals . . . . . . . . . . . . . . . . . . . . . . . . . 373-stack-list-variables . . . . . . . . . . . . . . . . . . . . . . 374-stack-select-frame . . . . . . . . . . . . . . . . . . . . . . . . 374-symbol-list-lines . . . . . . . . . . . . . . . . . . . . . . . . . 397-t . . . . . . . . . . . . . . . . . . . . . . . . . . . . . . . . . . . . . . . . . . . . . 15-target-attach . . . . . . . . . . . . . . . . . . . . . . . . . . . . . . 399-target-detach . . . . . . . . . . . . . . . . . . . . . . . . . . . . . . 399-target-disconnect . . . . . . . . . . . . . . . . . . . . . . . . . 400-target-download . . . . . . . . . . . . . . . . . . . . . . . . . . . . 400-target-file-delete . . . . . . . . . . . . . . . . . . . . . . . . 403-target-file-get . . . . . . . . . . . . . . . . . . . . . . . . . . . . 403-target-file-put . . . . . . . . . . . . . . . . . . . . . . . . . . . . 402-target-select . . . . . . . . . . . . . . . . . . . . . . . . . . . . . . 402-thread-info . . . . . . . . . . . . . . . . . . . . . . . . . . . . . . . . 360-thread-list-ids . . . . . . . . . . . . . . . . . . . . . . . . . . . . 361-thread-select . . . . . . . . . . . . . . . . . . . . . . . . . . . . . . 361-trace-define-variable . . . . . . . . . . . . . . . . . . . . . 394-trace-find . . . . . . . . . . . . . . . . . . . . . . . . . . . . . . . . . 393-trace-list-variables . . . . . . . . . . . . . . . . . . . . . . 394-trace-save . . . . . . . . . . . . . . . . . . . . . . . . . . . . . . . . . 395-trace-start . . . . . . . . . . . . . . . . . . . . . . . . . . . . . . . . 395
-trace-status . . . . . . . . . . . . . . . . . . . . . . . . . . . . . . . 395-trace-stop . . . . . . . . . . . . . . . . . . . . . . . . . . . . . . . . . 396-var-assign . . . . . . . . . . . . . . . . . . . . . . . . . . . . . . . . . 381-var-create . . . . . . . . . . . . . . . . . . . . . . . . . . . . . . . . . 377-var-delete . . . . . . . . . . . . . . . . . . . . . . . . . . . . . . . . . 378-var-evaluate-expression . . . . . . . . . . . . . . . . . . 381-var-info-expression . . . . . . . . . . . . . . . . . . . . . . . 380-var-info-num-children . . . . . . . . . . . . . . . . . . . . . 379-var-info-path-expression . . . . . . . . . . . . . . . . . 380-var-info-type . . . . . . . . . . . . . . . . . . . . . . . . . . . . . . 380-var-list-children . . . . . . . . . . . . . . . . . . . . . . . . . 379-var-set-format . . . . . . . . . . . . . . . . . . . . . . . . . . . . . 378-var-set-frozen . . . . . . . . . . . . . . . . . . . . . . . . . . . . . 383-var-set-update-range . . . . . . . . . . . . . . . . . . . . . . 384-var-set-visualizer . . . . . . . . . . . . . . . . . . . . . . . . 384-var-show-attributes . . . . . . . . . . . . . . . . . . . . . . . 381-var-show-format . . . . . . . . . . . . . . . . . . . . . . . . . . . . 378-var-update . . . . . . . . . . . . . . . . . . . . . . . . . . . . . . . . . 382-w . . . . . . . . . . . . . . . . . . . . . . . . . . . . . . . . . . . . . . . . . . . . . 14-x . . . . . . . . . . . . . . . . . . . . . . . . . . . . . . . . . . . . . . . . . . . . . 12
.
., Modula-2 scope operator . . . . . . . . . . . . . . . . . . . 179‘.build-id’ directory . . . . . . . . . . . . . . . . . . . . . . . . . 209‘.debug’ subdirectories . . . . . . . . . . . . . . . . . . . . . . . 209.debug_gdb_scripts section . . . . . . . . . . . . . . . . . . 322‘.gdb_index’ section . . . . . . . . . . . . . . . . . . . . . . . . . . 212.gdb index section format . . . . . . . . . . . . . . . . . . . . . 549‘.gdbinit’ . . . . . . . . . . . . . . . . . . . . . . . . . . . . . . . . . . . . . 16.gnu_debuglink sections . . . . . . . . . . . . . . . . . . . . . 210.note.gnu.build-id sections . . . . . . . . . . . . . . . . . 210‘.o’ files, reading symbols from . . . . . . . . . . . . . . . 203
//proc . . . . . . . . . . . . . . . . . . . . . . . . . . . . . . . . . . . . . . . . 235
:::, context for variables/functions . . . . . . . . . . . . . 99::, in Modula-2 . . . . . . . . . . . . . . . . . . . . . . . . . . . . . . 179
<<architecture> . . . . . . . . . . . . . . . . . . . . . . . . . . . . . . . . 538<compatible> . . . . . . . . . . . . . . . . . . . . . . . . . . . . . . . . 539<feature> . . . . . . . . . . . . . . . . . . . . . . . . . . . . . . . . . . . . . 539<flags> . . . . . . . . . . . . . . . . . . . . . . . . . . . . . . . . . . . . . . . 540<osabi> . . . . . . . . . . . . . . . . . . . . . . . . . . . . . . . . . . . . . . 539<reg> . . . . . . . . . . . . . . . . . . . . . . . . . . . . . . . . . . . . . . . . . 540<struct> . . . . . . . . . . . . . . . . . . . . . . . . . . . . . . . . . . . . . . 540<union> . . . . . . . . . . . . . . . . . . . . . . . . . . . . . . . . . . . . . . 540<vector> . . . . . . . . . . . . . . . . . . . . . . . . . . . . . . . . . . . . . . 539<xi:include> . . . . . . . . . . . . . . . . . . . . . . . . . . . . . . . . . . 538
Index 573
?‘?’ packet . . . . . . . . . . . . . . . . . . . . . . . . . . . . . . . . . . . . 469
@@, referencing memory as an array . . . . . . . . . . . . 101
^^connected . . . . . . . . . . . . . . . . . . . . . . . . . . . . . . . . . . 343^done . . . . . . . . . . . . . . . . . . . . . . . . . . . . . . . . . . . . . . . . 343^error . . . . . . . . . . . . . . . . . . . . . . . . . . . . . . . . . . . . . . . 343^exit . . . . . . . . . . . . . . . . . . . . . . . . . . . . . . . . . . . . . . . . 343^running . . . . . . . . . . . . . . . . . . . . . . . . . . . . . . . . . . . . . 343
_NSPrintForDebugger, and printing Objective-Cobjects . . . . . . . . . . . . . . . . . . . . . . . . . . . . . . . . . . 172
‘“No symbol "foo" in current context” . . . . . . . . . 100
{{type} . . . . . . . . . . . . . . . . . . . . . . . . . . . . . . . . . . . . . . . . 98
A‘A’ packet . . . . . . . . . . . . . . . . . . . . . . . . . . . . . . . . . . . . 469abbreviation . . . . . . . . . . . . . . . . . . . . . . . . . . . . . . . . . . . 19abort (C-g) . . . . . . . . . . . . . . . . . . . . . . . . . . . . . . . . . . 441accept-line (Newline or Return) . . . . . . . . . . . 436acknowledgment, for gdb remote . . . . . . . . . . . . . 507actions . . . . . . . . . . . . . . . . . . . . . . . . . . . . . . . . . . . . . . 144active targets . . . . . . . . . . . . . . . . . . . . . . . . . . . . . . . . . 215Ada . . . . . . . . . . . . . . . . . . . . . . . . . . . . . . . . . . . . . . . . . . 180Ada exception catching . . . . . . . . . . . . . . . . . . . . . . . . 52Ada mode, general . . . . . . . . . . . . . . . . . . . . . . . . . . . 180Ada task switching . . . . . . . . . . . . . . . . . . . . . . . . . . . 185Ada tasking and core file debugging . . . . . . . . . . . 186Ada, deviations from . . . . . . . . . . . . . . . . . . . . . . . . . 182Ada, omissions from . . . . . . . . . . . . . . . . . . . . . . . . . . 181Ada, problems . . . . . . . . . . . . . . . . . . . . . . . . . . . . . . . . 187Ada, tasking . . . . . . . . . . . . . . . . . . . . . . . . . . . . . . . . . 183add new commands for external monitor . . . . . . 220add-inferior . . . . . . . . . . . . . . . . . . . . . . . . . . . . . . . . . 33add-shared-symbol-files . . . . . . . . . . . . . . . . . . . 203add-symbol-file . . . . . . . . . . . . . . . . . . . . . . . . . . . . . 202add-symbol-file-from-memory . . . . . . . . . . . . . . . 203address of a symbol . . . . . . . . . . . . . . . . . . . . . . . . . . . 189address size for remote targets . . . . . . . . . . . . . . . . 226ADP (Angel Debugger Protocol) logging . . . . . . 248advance location . . . . . . . . . . . . . . . . . . . . . . . . . . . . . 64aggregates (Ada) . . . . . . . . . . . . . . . . . . . . . . . . . . . . . 181AIX threads . . . . . . . . . . . . . . . . . . . . . . . . . . . . . . . . . . 271
alias . . . . . . . . . . . . . . . . . . . . . . . . . . . . . . . . . . . . . . . . 326aliases for commands . . . . . . . . . . . . . . . . . . . . . . . . . 325alignment of remote memory accesses . . . . . . . . . 472all-stop mode . . . . . . . . . . . . . . . . . . . . . . . . . . . . . . . . . . 68Alpha stack . . . . . . . . . . . . . . . . . . . . . . . . . . . . . . . . . . 260ambiguous expressions . . . . . . . . . . . . . . . . . . . . . . . . . 98AMD 29K register stack . . . . . . . . . . . . . . . . . . . . . . 260annotations . . . . . . . . . . . . . . . . . . . . . . . . . . . . . . . . . . 411annotations for errors, warnings and interrupts
. . . . . . . . . . . . . . . . . . . . . . . . . . . . . . . . . . . . . . . . . 413annotations for invalidation messages . . . . . . . . . 413annotations for prompts . . . . . . . . . . . . . . . . . . . . . . 412annotations for running programs . . . . . . . . . . . . . 413annotations for source display . . . . . . . . . . . . . . . . 414append . . . . . . . . . . . . . . . . . . . . . . . . . . . . . . . . . . . . . . . 124append data to a file . . . . . . . . . . . . . . . . . . . . . . . . . 124apply command to several threads . . . . . . . . . . . . . 36apropos . . . . . . . . . . . . . . . . . . . . . . . . . . . . . . . . . . . . . . . 22architecture debugging info . . . . . . . . . . . . . . . . . . . 271argument count in user-defined commands . . . . 275arguments (to your program) . . . . . . . . . . . . . . . . . . 28arguments, to gdbserver . . . . . . . . . . . . . . . . . . . . . 221arguments, to user-defined commands . . . . . . . . . 275ARM 32-bit mode . . . . . . . . . . . . . . . . . . . . . . . . . . . . 247ARM RDI . . . . . . . . . . . . . . . . . . . . . . . . . . . . . . . . . . . . 247array aggregates (Ada) . . . . . . . . . . . . . . . . . . . . . . . 181arrays . . . . . . . . . . . . . . . . . . . . . . . . . . . . . . . . . . . . . . . . 101arrays in expressions . . . . . . . . . . . . . . . . . . . . . . . . . . . 97artificial array . . . . . . . . . . . . . . . . . . . . . . . . . . . . . . . . 101assembly instructions . . . . . . . . . . . . . . . . . . . . . . . . . . 93assf . . . . . . . . . . . . . . . . . . . . . . . . . . . . . . . . . . . . . . . . . 203assignment . . . . . . . . . . . . . . . . . . . . . . . . . . . . . . . . . . . 195async output in gdb/mi . . . . . . . . . . . . . . . . . . . . . . 342async records in gdb/mi . . . . . . . . . . . . . . . . . . . . . . 344asynchronous execution . . . . . . . . . . . . . . . . . . . . . . . . 71asynchronous execution, and process record and
replay . . . . . . . . . . . . . . . . . . . . . . . . . . . . . . . . . . . . . 77AT&T disassembly flavor . . . . . . . . . . . . . . . . . . . . . . 95attach . . . . . . . . . . . . . . . . . . . . . . . . . . . . . . . . . . . . . . . . 31attach to a program, gdbserver . . . . . . . . . . . . . . 222attach& . . . . . . . . . . . . . . . . . . . . . . . . . . . . . . . . . . . . . . . 71auto-loading, Python . . . . . . . . . . . . . . . . . . . . . . . . . 321auto-retry, for remote TCP target . . . . . . . . . . . . 227automatic display . . . . . . . . . . . . . . . . . . . . . . . . . . . . 105automatic hardware breakpoints . . . . . . . . . . . . . . . 48automatic overlay debugging . . . . . . . . . . . . . . . . . . 158automatic thread selection . . . . . . . . . . . . . . . . . . . . . 69auxiliary vector . . . . . . . . . . . . . . . . . . . . . . . . . . . . . . . 121AVR . . . . . . . . . . . . . . . . . . . . . . . . . . . . . . . . . . . . . . . . . 259awatch . . . . . . . . . . . . . . . . . . . . . . . . . . . . . . . . . . . . . . . . 50
Bb (break) . . . . . . . . . . . . . . . . . . . . . . . . . . . . . . . . . . . . . . 44‘b’ packet . . . . . . . . . . . . . . . . . . . . . . . . . . . . . . . . . . . . 469‘B’ packet . . . . . . . . . . . . . . . . . . . . . . . . . . . . . . . . . . . . 469background execution . . . . . . . . . . . . . . . . . . . . . . . . . . 71backtrace . . . . . . . . . . . . . . . . . . . . . . . . . . . . . . . . . . . . . 82
574 Debugging with gdb
backtrace beyond main function . . . . . . . . . . . . . . . . 83backtrace limit . . . . . . . . . . . . . . . . . . . . . . . . . . . . . . . . 84backward-char (C-b) . . . . . . . . . . . . . . . . . . . . . . . . 436backward-delete-char (Rubout) . . . . . . . . . . . . . 438backward-kill-line (C-x Rubout) . . . . . . . . . . . 439backward-kill-word (M-DEL) . . . . . . . . . . . . . . . . 439backward-word (M-b) . . . . . . . . . . . . . . . . . . . . . . . . 436base name differences . . . . . . . . . . . . . . . . . . . . . . . . . 209baud rate for remote targets . . . . . . . . . . . . . . . . . . 226‘bc’ packet . . . . . . . . . . . . . . . . . . . . . . . . . . . . . . . . . . . 469bcache statistics . . . . . . . . . . . . . . . . . . . . . . . . . . . . . . 462beginning-of-history (M-<) . . . . . . . . . . . . . . . . 437beginning-of-line (C-a) . . . . . . . . . . . . . . . . . . . . 436bell-style . . . . . . . . . . . . . . . . . . . . . . . . . . . . . . . . . . 426bind-tty-special-chars . . . . . . . . . . . . . . . . . . . . . 427bits in remote address . . . . . . . . . . . . . . . . . . . . . . . . 226Block.end . . . . . . . . . . . . . . . . . . . . . . . . . . . . . . . . . . . . 313Block.function . . . . . . . . . . . . . . . . . . . . . . . . . . . . . . 313Block.global_block . . . . . . . . . . . . . . . . . . . . . . . . . 313Block.is_global . . . . . . . . . . . . . . . . . . . . . . . . . . . . . 313Block.is_static . . . . . . . . . . . . . . . . . . . . . . . . . . . . . 313Block.is_valid . . . . . . . . . . . . . . . . . . . . . . . . . . . . . . 312Block.start . . . . . . . . . . . . . . . . . . . . . . . . . . . . . . . . . 312Block.static_block . . . . . . . . . . . . . . . . . . . . . . . . . 313Block.superblock . . . . . . . . . . . . . . . . . . . . . . . . . . . . 313blocks in python . . . . . . . . . . . . . . . . . . . . . . . . . . . . . . 312bookmark . . . . . . . . . . . . . . . . . . . . . . . . . . . . . . . . . . . . . 40BP_ACCESS_WATCHPOINT . . . . . . . . . . . . . . . . . . . . . . . 319BP_BREAKPOINT . . . . . . . . . . . . . . . . . . . . . . . . . . . . . . . 319BP_HARDWARE_WATCHPOINT . . . . . . . . . . . . . . . . . . . . . 319BP_READ_WATCHPOINT . . . . . . . . . . . . . . . . . . . . . . . . . 319BP_WATCHPOINT . . . . . . . . . . . . . . . . . . . . . . . . . . . . . . . 319break . . . . . . . . . . . . . . . . . . . . . . . . . . . . . . . . . . . . . . . . . 44break ... task taskno (Ada) . . . . . . . . . . . . . . . . 186break ... thread threadno . . . . . . . . . . . . . . . . . . . 72break in overloaded functions . . . . . . . . . . . . . . . . . 170break on a system call. . . . . . . . . . . . . . . . . . . . . . . . . 53break on fork/exec . . . . . . . . . . . . . . . . . . . . . . . . . . . . . 53BREAK signal instead of Ctrl-C . . . . . . . . . . . . . . 226break, and Objective-C . . . . . . . . . . . . . . . . . . . . . . . 171break-range . . . . . . . . . . . . . . . . . . . . . . . . . . . . . . . . . 255breakpoint address adjusted . . . . . . . . . . . . . . . . . . . 60breakpoint annotation . . . . . . . . . . . . . . . . . . . . . . 414breakpoint commands . . . . . . . . . . . . . . . . . . . . . . . . . 59breakpoint commands for gdb/mi . . . . . . . . . . . . 349breakpoint conditions . . . . . . . . . . . . . . . . . . . . . . . . . . 57breakpoint numbers . . . . . . . . . . . . . . . . . . . . . . . . . . . 43breakpoint on events . . . . . . . . . . . . . . . . . . . . . . . . . . . 43breakpoint on memory address . . . . . . . . . . . . . . . . . 43breakpoint on variable modification . . . . . . . . . . . . 43breakpoint ranges . . . . . . . . . . . . . . . . . . . . . . . . . . . . . 43breakpoint subroutine, remote . . . . . . . . . . . . . . . 232Breakpoint.__init__ . . . . . . . . . . . . . . . . . . . . . . . . 317Breakpoint.commands . . . . . . . . . . . . . . . . . . . . . . . . 320Breakpoint.condition . . . . . . . . . . . . . . . . . . . . . . . 319Breakpoint.delete . . . . . . . . . . . . . . . . . . . . . . . . . . 318Breakpoint.enabled . . . . . . . . . . . . . . . . . . . . . . . . . 318Breakpoint.expression . . . . . . . . . . . . . . . . . . . . . . 319
Breakpoint.hit_count . . . . . . . . . . . . . . . . . . . . . . . 319Breakpoint.ignore_count . . . . . . . . . . . . . . . . . . . 319Breakpoint.is_valid . . . . . . . . . . . . . . . . . . . . . . . . 318Breakpoint.location . . . . . . . . . . . . . . . . . . . . . . . . 319Breakpoint.number . . . . . . . . . . . . . . . . . . . . . . . . . . 319Breakpoint.silent . . . . . . . . . . . . . . . . . . . . . . . . . . 318Breakpoint.stop . . . . . . . . . . . . . . . . . . . . . . . . . . . . . 317Breakpoint.task . . . . . . . . . . . . . . . . . . . . . . . . . . . . . 318Breakpoint.thread . . . . . . . . . . . . . . . . . . . . . . . . . . 318Breakpoint.type . . . . . . . . . . . . . . . . . . . . . . . . . . . . . 319Breakpoint.visible . . . . . . . . . . . . . . . . . . . . . . . . . 319BreakpointEvent.breakpoint . . . . . . . . . . . . . . . . 301BreakpointEvent.breakpoints . . . . . . . . . . . . . . . 300breakpointing Ada elaboration code . . . . . . . . . . . 183breakpoints . . . . . . . . . . . . . . . . . . . . . . . . . . . . . . . . . . . . 43breakpoints and tasks, in Ada . . . . . . . . . . . . . . . . 186breakpoints and threads . . . . . . . . . . . . . . . . . . . . . . . 72breakpoints at functions matching a regexp . . . . 45breakpoints in overlays . . . . . . . . . . . . . . . . . . . . . . . 158breakpoints in python . . . . . . . . . . . . . . . . . . . . . . . . 317breakpoints, multiple locations . . . . . . . . . . . . . . . . . 47breakpoints-invalid annotation . . . . . . . . . . . . 413‘bs’ packet . . . . . . . . . . . . . . . . . . . . . . . . . . . . . . . . . . . 470bt (backtrace) . . . . . . . . . . . . . . . . . . . . . . . . . . . . . . . . 82bug criteria . . . . . . . . . . . . . . . . . . . . . . . . . . . . . . . . . . . 419bug reports . . . . . . . . . . . . . . . . . . . . . . . . . . . . . . . . . . . 419bugs in gdb . . . . . . . . . . . . . . . . . . . . . . . . . . . . . . . . . . 419build ID sections . . . . . . . . . . . . . . . . . . . . . . . . . . . . . 210build ID, and separate debugging files . . . . . . . . 209building gdb, requirements for . . . . . . . . . . . . . . . . 453built-in simulator target . . . . . . . . . . . . . . . . . . . . . . 216
Cc (continue) . . . . . . . . . . . . . . . . . . . . . . . . . . . . . . . . . . 61c (SingleKey TUI key) . . . . . . . . . . . . . . . . . . . . . . . . 331C and C++ . . . . . . . . . . . . . . . . . . . . . . . . . . . . . . . . . . . 165C and C++ checks . . . . . . . . . . . . . . . . . . . . . . . . . . . . 169C and C++ constants . . . . . . . . . . . . . . . . . . . . . . . . . 167C and C++ defaults . . . . . . . . . . . . . . . . . . . . . . . . . . . 169C and C++ operators . . . . . . . . . . . . . . . . . . . . . . . . . 166‘c’ packet . . . . . . . . . . . . . . . . . . . . . . . . . . . . . . . . . . . . 470‘C’ packet . . . . . . . . . . . . . . . . . . . . . . . . . . . . . . . . . . . . 470C++ . . . . . . . . . . . . . . . . . . . . . . . . . . . . . . . . . . . . . . . . . . 165C++ compilers . . . . . . . . . . . . . . . . . . . . . . . . . . . . . . . . 168C++ exception handling . . . . . . . . . . . . . . . . . . . . . . . 170C++ overload debugging info . . . . . . . . . . . . . . . . . . 273C++ scope resolution . . . . . . . . . . . . . . . . . . . . . . . . . . 100C++ symbol decoding style . . . . . . . . . . . . . . . . . . . . 113C++ symbol display . . . . . . . . . . . . . . . . . . . . . . . . . . . 170C-L . . . . . . . . . . . . . . . . . . . . . . . . . . . . . . . . . . . . . . . . . . 331C-x 1 . . . . . . . . . . . . . . . . . . . . . . . . . . . . . . . . . . . . . . . . . 330C-x 2 . . . . . . . . . . . . . . . . . . . . . . . . . . . . . . . . . . . . . . . . . 330C-x a . . . . . . . . . . . . . . . . . . . . . . . . . . . . . . . . . . . . . . . . . 330C-x A . . . . . . . . . . . . . . . . . . . . . . . . . . . . . . . . . . . . . . . . . 330C-x C-a . . . . . . . . . . . . . . . . . . . . . . . . . . . . . . . . . . . . . . 330C-x o . . . . . . . . . . . . . . . . . . . . . . . . . . . . . . . . . . . . . . . . . 330C-x s . . . . . . . . . . . . . . . . . . . . . . . . . . . . . . . . . . . . . . . . . 330
Index 575
caching data of remote targets . . . . . . . . . . . . . . . . 127call . . . . . . . . . . . . . . . . . . . . . . . . . . . . . . . . . . . . . . . . . 198call dummy stack unwinding . . . . . . . . . . . . . . . . . . 199call dummy stack unwinding on unhandled
exception. . . . . . . . . . . . . . . . . . . . . . . . . . . . . . . . 199call overloaded functions . . . . . . . . . . . . . . . . . . . . . . 168call stack . . . . . . . . . . . . . . . . . . . . . . . . . . . . . . . . . . . . . . 81call stack traces . . . . . . . . . . . . . . . . . . . . . . . . . . . . . . . 82call-last-kbd-macro (C-x e) . . . . . . . . . . . . . . . . 441calling functions . . . . . . . . . . . . . . . . . . . . . . . . . . . . . . 198calling make . . . . . . . . . . . . . . . . . . . . . . . . . . . . . . . . . . . 17capitalize-word (M-c) . . . . . . . . . . . . . . . . . . . . . . 438case sensitivity in symbol names . . . . . . . . . . . . . . 189case-insensitive symbol names . . . . . . . . . . . . . . . . 189casts, in expressions . . . . . . . . . . . . . . . . . . . . . . . . . . . 97casts, to view memory . . . . . . . . . . . . . . . . . . . . . . . . . 98catch . . . . . . . . . . . . . . . . . . . . . . . . . . . . . . . . . . . . . . . . . 52catch Ada exceptions . . . . . . . . . . . . . . . . . . . . . . . . . . 52catch exceptions, list active handlers . . . . . . . . . . . 86catchpoints . . . . . . . . . . . . . . . . . . . . . . . . . . . . . . . . . . . . 43catchpoints, setting . . . . . . . . . . . . . . . . . . . . . . . . . . . . 52cd . . . . . . . . . . . . . . . . . . . . . . . . . . . . . . . . . . . . . . . . . . . . . 30cdir . . . . . . . . . . . . . . . . . . . . . . . . . . . . . . . . . . . . . . . . . . 92Cell Broadband Engine . . . . . . . . . . . . . . . . . . . . . . . 262change working directory . . . . . . . . . . . . . . . . . . . . . . 30character sets . . . . . . . . . . . . . . . . . . . . . . . . . . . . . . . . 125character-search (C-]) . . . . . . . . . . . . . . . . . . . . . 442character-search-backward (M-C-]) . . . . . . . . 442charset . . . . . . . . . . . . . . . . . . . . . . . . . . . . . . . . . . . . . . . 125checkpoint . . . . . . . . . . . . . . . . . . . . . . . . . . . . . . . . . . . . . 40checkpoint . . . . . . . . . . . . . . . . . . . . . . . . . . . . . . . . . . . . 41checkpoints and process id . . . . . . . . . . . . . . . . . . . . . 41checks, range . . . . . . . . . . . . . . . . . . . . . . . . . . . . . . . . . 164checks, type . . . . . . . . . . . . . . . . . . . . . . . . . . . . . . . . . . 163checksum, for gdb remote . . . . . . . . . . . . . . . . . . . . 467choosing target byte order . . . . . . . . . . . . . . . . . . . . 218circular trace buffer . . . . . . . . . . . . . . . . . . . . . . . . . . 148clear . . . . . . . . . . . . . . . . . . . . . . . . . . . . . . . . . . . . . . . . . 56clear, and Objective-C . . . . . . . . . . . . . . . . . . . . . . . 171clear-screen (C-l) . . . . . . . . . . . . . . . . . . . . . . . . . . 436clearing breakpoints, watchpoints, catchpoints . . 55clone-inferior . . . . . . . . . . . . . . . . . . . . . . . . . . . . . . . 33close, file-i/o system call . . . . . . . . . . . . . . . . . . . . . . 512closest symbol and offset for an address . . . . . . . 189code address and its source line . . . . . . . . . . . . . . . . 93collect (tracepoints) . . . . . . . . . . . . . . . . . . . . . . . . 145collected data discarded . . . . . . . . . . . . . . . . . . . . . . 147colon, doubled as scope operator . . . . . . . . . . . . . . 179colon-colon, context for variables/functions . . . . . 99command editing . . . . . . . . . . . . . . . . . . . . . . . . . . . . . 423command files . . . . . . . . . . . . . . . . . . . . . . . . . . . . . . . . 278command history . . . . . . . . . . . . . . . . . . . . . . . . . . . . . 266command hooks . . . . . . . . . . . . . . . . . . . . . . . . . . . . . . 277command interpreters . . . . . . . . . . . . . . . . . . . . . . . . 327command line editing . . . . . . . . . . . . . . . . . . . . . . . . . 265command scripts, debugging . . . . . . . . . . . . . . . . . . 271command tracing . . . . . . . . . . . . . . . . . . . . . . . . . . . . . 271Command.__init__ . . . . . . . . . . . . . . . . . . . . . . . . . . . . 302
Command.complete . . . . . . . . . . . . . . . . . . . . . . . . . . . . 303Command.dont_repeat . . . . . . . . . . . . . . . . . . . . . . . . 302Command.invoke . . . . . . . . . . . . . . . . . . . . . . . . . . . . . . 303COMMAND_BREAKPOINTS . . . . . . . . . . . . . . . . . . . . . . . . 304COMMAND_DATA . . . . . . . . . . . . . . . . . . . . . . . . . . . . . . . . 304COMMAND_FILES . . . . . . . . . . . . . . . . . . . . . . . . . . . . . . . 304COMMAND_MAINTENANCE . . . . . . . . . . . . . . . . . . . . . . . . 304COMMAND_NONE . . . . . . . . . . . . . . . . . . . . . . . . . . . . . . . . 303COMMAND_OBSCURE . . . . . . . . . . . . . . . . . . . . . . . . . . . . . 304COMMAND_RUNNING . . . . . . . . . . . . . . . . . . . . . . . . . . . . . 303COMMAND_STACK . . . . . . . . . . . . . . . . . . . . . . . . . . . . . . . 304COMMAND_STATUS . . . . . . . . . . . . . . . . . . . . . . . . . . . . . . 304COMMAND_SUPPORT . . . . . . . . . . . . . . . . . . . . . . . . . . . . . 304COMMAND_TRACEPOINTS . . . . . . . . . . . . . . . . . . . . . . . . 304commands . . . . . . . . . . . . . . . . . . . . . . . . . . . . . . . . . . . . . . 59commands annotation . . . . . . . . . . . . . . . . . . . . . . . . 412commands for C++ . . . . . . . . . . . . . . . . . . . . . . . . . . . 170commands in python . . . . . . . . . . . . . . . . . . . . . . . . . 302commands to access python . . . . . . . . . . . . . . . . . . . 281comment . . . . . . . . . . . . . . . . . . . . . . . . . . . . . . . . . . . . . . 19comment-begin . . . . . . . . . . . . . . . . . . . . . . . . . . . . . . . 427COMMON blocks, Fortran . . . . . . . . . . . . . . . . . . . . . . . 173common targets . . . . . . . . . . . . . . . . . . . . . . . . . . . . . . 216compare-sections . . . . . . . . . . . . . . . . . . . . . . . . . . . . 105compatibility, gdb/mi and CLI . . . . . . . . . . . . . . . 342compilation directory . . . . . . . . . . . . . . . . . . . . . . . . . . 92compiling, on Sparclet . . . . . . . . . . . . . . . . . . . . . . . . 257complete . . . . . . . . . . . . . . . . . . . . . . . . . . . . . . . . . . . . . . 22complete (TAB) . . . . . . . . . . . . . . . . . . . . . . . . . . . . . . 440COMPLETE_COMMAND . . . . . . . . . . . . . . . . . . . . . . . . . . . . 305COMPLETE_FILENAME . . . . . . . . . . . . . . . . . . . . . . . . . . 305COMPLETE_LOCATION . . . . . . . . . . . . . . . . . . . . . . . . . . 305COMPLETE_NONE . . . . . . . . . . . . . . . . . . . . . . . . . . . . . . . 305COMPLETE_SYMBOL . . . . . . . . . . . . . . . . . . . . . . . . . . . . . 305completion . . . . . . . . . . . . . . . . . . . . . . . . . . . . . . . . . . . . 19completion of Python commands . . . . . . . . . . . . . . 303completion of quoted strings . . . . . . . . . . . . . . . . . . . 20completion of structure field names . . . . . . . . . . . . 21completion of union field names . . . . . . . . . . . . . . . . 21completion-display-width . . . . . . . . . . . . . . . . . . 427completion-ignore-case . . . . . . . . . . . . . . . . . . . . . 427completion-map-case . . . . . . . . . . . . . . . . . . . . . . . . 427completion-prefix-display-length . . . . . . . . . 427completion-query-items . . . . . . . . . . . . . . . . . . . . . 427compressed debug sections . . . . . . . . . . . . . . . . . . . . 453condition . . . . . . . . . . . . . . . . . . . . . . . . . . . . . . . . . . . . . 58conditional breakpoints . . . . . . . . . . . . . . . . . . . . . . . . 57conditional tracepoints . . . . . . . . . . . . . . . . . . . . . . . 143configuring gdb . . . . . . . . . . . . . . . . . . . . . . . . . . . . . . 454confirmation . . . . . . . . . . . . . . . . . . . . . . . . . . . . . . . . . . 270connection timeout, for remote TCP target . . . 228console i/o as part of file-i/o . . . . . . . . . . . . . . . . . . 510console interpreter . . . . . . . . . . . . . . . . . . . . . . . . . . . . 327console output in gdb/mi . . . . . . . . . . . . . . . . . . . . . 342constants, in file-i/o protocol . . . . . . . . . . . . . . . . . 518continue . . . . . . . . . . . . . . . . . . . . . . . . . . . . . . . . . . . . . . 61continue& . . . . . . . . . . . . . . . . . . . . . . . . . . . . . . . . . . . . . 71continuing . . . . . . . . . . . . . . . . . . . . . . . . . . . . . . . . . . . . . 61
576 Debugging with gdb
continuing threads . . . . . . . . . . . . . . . . . . . . . . . . . . . . . 68control C, and remote debugging . . . . . . . . . . . . . 232controlling terminal . . . . . . . . . . . . . . . . . . . . . . . . . . . . 31convenience functions . . . . . . . . . . . . . . . . . . . . . . . . . 119convenience functions in python . . . . . . . . . . . . . . 307convenience variables . . . . . . . . . . . . . . . . . . . . . . . . . 117convenience variables for tracepoints . . . . . . . . . . 153convenience variables, and trace state variables
. . . . . . . . . . . . . . . . . . . . . . . . . . . . . . . . . . . . . . . . . 144convenience variables, initializing . . . . . . . . . . . . . 118convert-meta . . . . . . . . . . . . . . . . . . . . . . . . . . . . . . . . 427copy-backward-word () . . . . . . . . . . . . . . . . . . . . . . 439copy-forward-word () . . . . . . . . . . . . . . . . . . . . . . . 440copy-region-as-kill () . . . . . . . . . . . . . . . . . . . . . 439core dump file . . . . . . . . . . . . . . . . . . . . . . . . . . . . . . . . 201core dump file target . . . . . . . . . . . . . . . . . . . . . . . . . 216core-file . . . . . . . . . . . . . . . . . . . . . . . . . . . . . . . . . . . . 202crash of debugger . . . . . . . . . . . . . . . . . . . . . . . . . . . . . 419CRC algorithm definition . . . . . . . . . . . . . . . . . . . . . 211CRC of memory block, remote request . . . . . . . . 480CRIS . . . . . . . . . . . . . . . . . . . . . . . . . . . . . . . . . . . . . . . . . 259CRIS mode . . . . . . . . . . . . . . . . . . . . . . . . . . . . . . . . . . . 259CRIS version . . . . . . . . . . . . . . . . . . . . . . . . . . . . . . . . . 259Ctrl-BREAK, MS-Windows. . . . . . . . . . . . . . . . . . . 239ctrl-c message, in file-i/o protocol . . . . . . . . . . . . . 510Ctrl-o (operate-and-get-next) . . . . . . . . . . . . . . . . . 19current Ada task ID . . . . . . . . . . . . . . . . . . . . . . . . . . 185current directory . . . . . . . . . . . . . . . . . . . . . . . . . . . . . . 92current stack frame . . . . . . . . . . . . . . . . . . . . . . . . . . . . 82current thread . . . . . . . . . . . . . . . . . . . . . . . . . . . . . . . . . 35current thread, remote request . . . . . . . . . . . . . . . . 480custom JIT debug info . . . . . . . . . . . . . . . . . . . . . . . . 416cwd . . . . . . . . . . . . . . . . . . . . . . . . . . . . . . . . . . . . . . . . . . . . 92Cygwin DLL, debugging . . . . . . . . . . . . . . . . . . . . . . 239Cygwin-specific commands . . . . . . . . . . . . . . . . . . . . 239
DD . . . . . . . . . . . . . . . . . . . . . . . . . . . . . . . . . . . . . . . . . . . . 171d (delete) . . . . . . . . . . . . . . . . . . . . . . . . . . . . . . . . . . . . . 56d (SingleKey TUI key) . . . . . . . . . . . . . . . . . . . . . . . . 331‘d’ packet . . . . . . . . . . . . . . . . . . . . . . . . . . . . . . . . . . . . 470‘D’ packet . . . . . . . . . . . . . . . . . . . . . . . . . . . . . . . . . . . . 470Darwin . . . . . . . . . . . . . . . . . . . . . . . . . . . . . . . . . . . . . . . 245data breakpoints . . . . . . . . . . . . . . . . . . . . . . . . . . . . . . 43data manipulation, in gdb/mi . . . . . . . . . . . . . . . . 385dcache line-size . . . . . . . . . . . . . . . . . . . . . . . . . . . . . . . 128dcache size . . . . . . . . . . . . . . . . . . . . . . . . . . . . . . . . . . . 128dead names, gnu Hurd . . . . . . . . . . . . . . . . . . . . . . . 243debug expression parser . . . . . . . . . . . . . . . . . . . . . . 273debug formats and C++ . . . . . . . . . . . . . . . . . . . . . . . 168debug link sections . . . . . . . . . . . . . . . . . . . . . . . . . . . 210debug remote protocol . . . . . . . . . . . . . . . . . . . . . . . . 273debug_chaos . . . . . . . . . . . . . . . . . . . . . . . . . . . . . . . . . 250debugger crash . . . . . . . . . . . . . . . . . . . . . . . . . . . . . . . 419debugging C++ programs . . . . . . . . . . . . . . . . . . . . . 168debugging information directory, global . . . . . . . 209debugging information in separate files . . . . . . . . 209
debugging libthread_db . . . . . . . . . . . . . . . . . . . . . . . 38debugging multiple processes . . . . . . . . . . . . . . . . . . . 39debugging optimized code . . . . . . . . . . . . . . . . . . . . 131debugging stub, example . . . . . . . . . . . . . . . . . . . . . 230debugging target . . . . . . . . . . . . . . . . . . . . . . . . . . . . . 215debugging the Cygwin DLL . . . . . . . . . . . . . . . . . . . 239decimal floating point format . . . . . . . . . . . . . . . . . 171default collection action . . . . . . . . . . . . . . . . . . . . . . 146default data directory . . . . . . . . . . . . . . . . . . . . . . . . 214default source path substitution . . . . . . . . . . . . . . . . 91default system root . . . . . . . . . . . . . . . . . . . . . . . . . . . 207define . . . . . . . . . . . . . . . . . . . . . . . . . . . . . . . . . . . . . . . 276define trace state variable, remote request . . . . . 498defining macros interactively . . . . . . . . . . . . . . . . . . 135definition of a macro, showing . . . . . . . . . . . . . . . . 135delete . . . . . . . . . . . . . . . . . . . . . . . . . . . . . . . . . . . . . . . . 56delete breakpoints . . . . . . . . . . . . . . . . . . . . . . . . . . . . . 56delete checkpoint checkpoint-id . . . . . . . . . . . . 41delete display . . . . . . . . . . . . . . . . . . . . . . . . . . . . . . 105delete mem . . . . . . . . . . . . . . . . . . . . . . . . . . . . . . . . . . . 122delete tracepoint . . . . . . . . . . . . . . . . . . . . . . . . . . . 142delete tvariable . . . . . . . . . . . . . . . . . . . . . . . . . . . . 144delete-char (C-d) . . . . . . . . . . . . . . . . . . . . . . . . . . . 438delete-char-or-list () . . . . . . . . . . . . . . . . . . . . . 441delete-horizontal-space () . . . . . . . . . . . . . . . . 439deleting breakpoints, watchpoints, catchpoints
. . . . . . . . . . . . . . . . . . . . . . . . . . . . . . . . . . . . . . . . . . . 55deliver a signal to a program . . . . . . . . . . . . . . . . . . 197demangling C++ names . . . . . . . . . . . . . . . . . . . . . . . 112deprecated commands . . . . . . . . . . . . . . . . . . . . . . . . 460derived type of an object, printing . . . . . . . . . . . . 113descriptor tables display . . . . . . . . . . . . . . . . . . . . . . 237detach . . . . . . . . . . . . . . . . . . . . . . . . . . . . . . . . . . . . . . . . 32detach (remote) . . . . . . . . . . . . . . . . . . . . . . . . . . . . . 220detach from task, gnu Hurd . . . . . . . . . . . . . . . . . . 243detach from thread, gnu Hurd . . . . . . . . . . . . . . . . 244detach inferiors infno... . . . . . . . . . . . . . . . . . . . 34digit-argument (M-0, M-1, ... M--) . . . . . . . . 440dir . . . . . . . . . . . . . . . . . . . . . . . . . . . . . . . . . . . . . . . . . . . . 91direct memory access (DMA) on MS-DOS . . . . 238directories for source files . . . . . . . . . . . . . . . . . . . . . . 90directory . . . . . . . . . . . . . . . . . . . . . . . . . . . . . . . . . . . . . 91directory, compilation . . . . . . . . . . . . . . . . . . . . . . . . . . 92directory, current . . . . . . . . . . . . . . . . . . . . . . . . . . . . . . 92dis (disable) . . . . . . . . . . . . . . . . . . . . . . . . . . . . . . . . . 57disable . . . . . . . . . . . . . . . . . . . . . . . . . . . . . . . . . . . . . . . 57disable address space randomization, remote
request . . . . . . . . . . . . . . . . . . . . . . . . . . . . . . . . . . 481disable display . . . . . . . . . . . . . . . . . . . . . . . . . . . . . 106disable mem . . . . . . . . . . . . . . . . . . . . . . . . . . . . . . . . . . 122disable pretty-printer . . . . . . . . . . . . . . . . . . . . . 115disable tracepoint . . . . . . . . . . . . . . . . . . . . . . . . . . 142disable-completion . . . . . . . . . . . . . . . . . . . . . . . . . 427disassemble . . . . . . . . . . . . . . . . . . . . . . . . . . . . . . . . . . 93disconnect . . . . . . . . . . . . . . . . . . . . . . . . . . . . . . . . . . 220disconnected tracing . . . . . . . . . . . . . . . . . . . . . . . . . . 148displaced stepping debugging info . . . . . . . . . . . . . 272displaced stepping support . . . . . . . . . . . . . . . . . . . . 459
Index 577
displaced stepping, and process record and replay. . . . . . . . . . . . . . . . . . . . . . . . . . . . . . . . . . . . . . . . . . . 77
display . . . . . . . . . . . . . . . . . . . . . . . . . . . . . . . . . . . . . . 105display command history . . . . . . . . . . . . . . . . . . . . . 267display derived types . . . . . . . . . . . . . . . . . . . . . . . . . 113display disabled out of scope . . . . . . . . . . . . . . . . . . 106display gdb copyright . . . . . . . . . . . . . . . . . . . . . . . . . 23display of expressions . . . . . . . . . . . . . . . . . . . . . . . . . 105display remote monitor communications . . . . . . 217display remote packets . . . . . . . . . . . . . . . . . . . . . . . . 273djgpp debugging . . . . . . . . . . . . . . . . . . . . . . . . . . . . . 237dll-symbols . . . . . . . . . . . . . . . . . . . . . . . . . . . . . . . . . 239DLLs with no debugging symbols . . . . . . . . . . . . . 240do (down) . . . . . . . . . . . . . . . . . . . . . . . . . . . . . . . . . . . . . . 84do not print frame argument values . . . . . . . . . . . 108do-uppercase-version (M-a, M-b, M-x, ...)
. . . . . . . . . . . . . . . . . . . . . . . . . . . . . . . . . . . . . . . . . 441document . . . . . . . . . . . . . . . . . . . . . . . . . . . . . . . . . . . . . 276documentation . . . . . . . . . . . . . . . . . . . . . . . . . . . . . . . 451don’t repeat command . . . . . . . . . . . . . . . . . . . . . . . . 276don’t repeat Python command . . . . . . . . . . . . . . . . 302dont-repeat . . . . . . . . . . . . . . . . . . . . . . . . . . . . . . . . . 276DOS file-name semantics of file names. . . . . . . . . 208DOS serial data link, remote debugging . . . . . . . 238DOS serial port status . . . . . . . . . . . . . . . . . . . . . . . . 239down . . . . . . . . . . . . . . . . . . . . . . . . . . . . . . . . . . . . . . . . . . 84Down . . . . . . . . . . . . . . . . . . . . . . . . . . . . . . . . . . . . . . . . . 331down-silently . . . . . . . . . . . . . . . . . . . . . . . . . . . . . . . . 85downcase-word (M-l) . . . . . . . . . . . . . . . . . . . . . . . . 438download server address (M32R) . . . . . . . . . . . . . . 250download to Sparclet . . . . . . . . . . . . . . . . . . . . . . . . . 257download to VxWorks . . . . . . . . . . . . . . . . . . . . . . . . 246DPMI . . . . . . . . . . . . . . . . . . . . . . . . . . . . . . . . . . . . . . . . 237dump . . . . . . . . . . . . . . . . . . . . . . . . . . . . . . . . . . . . . . . . . 124dump all data collected at tracepoint . . . . . . . . . 152dump core from inferior . . . . . . . . . . . . . . . . . . . . . . 124dump data to a file . . . . . . . . . . . . . . . . . . . . . . . . . . . 124dump-functions () . . . . . . . . . . . . . . . . . . . . . . . . . . . 442dump-macros () . . . . . . . . . . . . . . . . . . . . . . . . . . . . . . 442dump-variables () . . . . . . . . . . . . . . . . . . . . . . . . . . . 442dump/restore files . . . . . . . . . . . . . . . . . . . . . . . . . . . . 124DVC register . . . . . . . . . . . . . . . . . . . . . . . . . . . . . . . . . 255DWARF 2 compilation units cache . . . . . . . . . . . . 463DWARF-2 CFI and CRIS . . . . . . . . . . . . . . . . . . . . 259DWARF2 DIEs . . . . . . . . . . . . . . . . . . . . . . . . . . . . . . . 271dynamic linking . . . . . . . . . . . . . . . . . . . . . . . . . . . . . . 202dynamic varobj . . . . . . . . . . . . . . . . . . . . . . . . . . . . . . . 377
Ee (edit) . . . . . . . . . . . . . . . . . . . . . . . . . . . . . . . . . . . . . . . 89echo . . . . . . . . . . . . . . . . . . . . . . . . . . . . . . . . . . . . . . . . . 279edit . . . . . . . . . . . . . . . . . . . . . . . . . . . . . . . . . . . . . . . . . . 89editing . . . . . . . . . . . . . . . . . . . . . . . . . . . . . . . . . . . . . . . 265editing command lines . . . . . . . . . . . . . . . . . . . . . . . . 423editing source files . . . . . . . . . . . . . . . . . . . . . . . . . . . . . 89editing-mode . . . . . . . . . . . . . . . . . . . . . . . . . . . . . . . . 428eight-bit characters in strings . . . . . . . . . . . . . . . . . 111
elaboration phase . . . . . . . . . . . . . . . . . . . . . . . . . . . . . . 27else . . . . . . . . . . . . . . . . . . . . . . . . . . . . . . . . . . . . . . . . . 279Emacs . . . . . . . . . . . . . . . . . . . . . . . . . . . . . . . . . . . . . . . . 335emacs-editing-mode (C-e) . . . . . . . . . . . . . . . . . . . 442empty response, for unsupported packets . . . . . . 468enable . . . . . . . . . . . . . . . . . . . . . . . . . . . . . . . . . . . . . . . . 57enable display . . . . . . . . . . . . . . . . . . . . . . . . . . . . . . 106enable mem . . . . . . . . . . . . . . . . . . . . . . . . . . . . . . . . . . . 122enable pretty-printer . . . . . . . . . . . . . . . . . . . . . . 115enable tracepoint . . . . . . . . . . . . . . . . . . . . . . . . . . . 142enable-keypad . . . . . . . . . . . . . . . . . . . . . . . . . . . . . . . 428enable/disable a breakpoint . . . . . . . . . . . . . . . . . . . . 56end (breakpoint commands) . . . . . . . . . . . . . . . . . . . 59end (if/else/while commands) . . . . . . . . . . . . . . . . . 279end (user-defined commands) . . . . . . . . . . . . . . . . . 276end-kbd-macro (C-x )) . . . . . . . . . . . . . . . . . . . . . . . 441end-of-history (M->) . . . . . . . . . . . . . . . . . . . . . . . 437end-of-line (C-e) . . . . . . . . . . . . . . . . . . . . . . . . . . . 436entering numbers . . . . . . . . . . . . . . . . . . . . . . . . . . . . . 268environment (of your program) . . . . . . . . . . . . . . . . 29errno values, in file-i/o protocol . . . . . . . . . . . . . . . 518error annotation . . . . . . . . . . . . . . . . . . . . . . . . . . . . 413error on valid input . . . . . . . . . . . . . . . . . . . . . . . . . . . 419error-begin annotation . . . . . . . . . . . . . . . . . . . . . 413eval . . . . . . . . . . . . . . . . . . . . . . . . . . . . . . . . . . . . . . . . . 281event debugging info . . . . . . . . . . . . . . . . . . . . . . . . . . 272event designators . . . . . . . . . . . . . . . . . . . . . . . . . . . . . 445event handling . . . . . . . . . . . . . . . . . . . . . . . . . . . . . . . . . 52EventRegistry.connect . . . . . . . . . . . . . . . . . . . . . . 299EventRegistry.disconnect . . . . . . . . . . . . . . . . . . 299examine process image . . . . . . . . . . . . . . . . . . . . . . . . 235examining data . . . . . . . . . . . . . . . . . . . . . . . . . . . . . . . . 97examining memory . . . . . . . . . . . . . . . . . . . . . . . . . . . 103exception handlers . . . . . . . . . . . . . . . . . . . . . . . . . . . . . 52exception handlers, how to list . . . . . . . . . . . . . . . . . 86exceptionHandler . . . . . . . . . . . . . . . . . . . . . . . . . . . . 232exceptions, python . . . . . . . . . . . . . . . . . . . . . . . . . . . 285exchange-point-and-mark (C-x C-x) . . . . . . . . . 442exec-file . . . . . . . . . . . . . . . . . . . . . . . . . . . . . . . . . . . . 201executable file . . . . . . . . . . . . . . . . . . . . . . . . . . . . . . . . 201executable file target . . . . . . . . . . . . . . . . . . . . . . . . . 216executable file, for remote target . . . . . . . . . . . . . . 227execute commands from a file . . . . . . . . . . . . . . . . . 278execute forward or backward in time . . . . . . . . . . . 76execute remote command, remote request . . . . . 484execution, foreground, background and
asynchronous . . . . . . . . . . . . . . . . . . . . . . . . . . . . . 71exited annotation . . . . . . . . . . . . . . . . . . . . . . . . . . . 413ExitedEvent . . . . . . . . . . . . . . . . . . . . . . . . . . . . . . . . . 300ExitedEvent.exit_code . . . . . . . . . . . . . . . . . . . . . . 300exiting gdb . . . . . . . . . . . . . . . . . . . . . . . . . . . . . . . . . . . . 16expand macro once . . . . . . . . . . . . . . . . . . . . . . . . . . . 135expand-tilde . . . . . . . . . . . . . . . . . . . . . . . . . . . . . . . . 428expanding preprocessor macros . . . . . . . . . . . . . . . 135expression debugging info . . . . . . . . . . . . . . . . . . . . . 272expression parser, debugging info . . . . . . . . . . . . . 273expressions . . . . . . . . . . . . . . . . . . . . . . . . . . . . . . . . . . . . 97expressions in Ada . . . . . . . . . . . . . . . . . . . . . . . . . . . . 180
578 Debugging with gdb
expressions in C or C++ . . . . . . . . . . . . . . . . . . . . . . . 165expressions in C++ . . . . . . . . . . . . . . . . . . . . . . . . . . . . 168expressions in Modula-2 . . . . . . . . . . . . . . . . . . . . . . 174extend gdb for remote targets . . . . . . . . . . . . . . . . 220extending GDB . . . . . . . . . . . . . . . . . . . . . . . . . . . . . . . 275extra signal information . . . . . . . . . . . . . . . . . . . . . . . 67
Ff (frame) . . . . . . . . . . . . . . . . . . . . . . . . . . . . . . . . . . . . . . 84f (SingleKey TUI key) . . . . . . . . . . . . . . . . . . . . . . . . 331‘F’ packet . . . . . . . . . . . . . . . . . . . . . . . . . . . . . . . . . . . . 470F reply packet . . . . . . . . . . . . . . . . . . . . . . . . . . . . . . . . 510F request packet . . . . . . . . . . . . . . . . . . . . . . . . . . . . . . 509fast tracepoints . . . . . . . . . . . . . . . . . . . . . . . . . . . . . . . 139fast tracepoints, setting . . . . . . . . . . . . . . . . . . . . . . . 141fatal signal . . . . . . . . . . . . . . . . . . . . . . . . . . . . . . . . . . . 419fatal signals . . . . . . . . . . . . . . . . . . . . . . . . . . . . . . . . . . . 66features of the remote protocol . . . . . . . . . . . . . . . 485fg (resume foreground execution) . . . . . . . . . . . . . . 61file . . . . . . . . . . . . . . . . . . . . . . . . . . . . . . . . . . . . . . . . . 201file name canonicalization . . . . . . . . . . . . . . . . . . . . . 209file transfer . . . . . . . . . . . . . . . . . . . . . . . . . . . . . . . . . . . 221file transfer, remote protocol . . . . . . . . . . . . . . . . . . 503file-i/o examples . . . . . . . . . . . . . . . . . . . . . . . . . . . . . . 519file-i/o overview . . . . . . . . . . . . . . . . . . . . . . . . . . . . . . 508File-I/O remote protocol extension . . . . . . . . . . . 508file-i/o reply packet . . . . . . . . . . . . . . . . . . . . . . . . . . . 510file-i/o request packet . . . . . . . . . . . . . . . . . . . . . . . . . 509fin (finish) . . . . . . . . . . . . . . . . . . . . . . . . . . . . . . . . . . 63find . . . . . . . . . . . . . . . . . . . . . . . . . . . . . . . . . . . . . . . . . 129find downloadable srec files (M32R) . . . . . . . . . . 249find trace snapshot . . . . . . . . . . . . . . . . . . . . . . . . . . . 150finish . . . . . . . . . . . . . . . . . . . . . . . . . . . . . . . . . . . . . . . . 63finish& . . . . . . . . . . . . . . . . . . . . . . . . . . . . . . . . . . . . . . . 71FinishBreakpoint.__init__ . . . . . . . . . . . . . . . . . 320FinishBreakpoint.out_of_scope . . . . . . . . . . . . . 320FinishBreakpoint.return_value . . . . . . . . . . . . . 320flinching . . . . . . . . . . . . . . . . . . . . . . . . . . . . . . . . . . . . . . 270float promotion . . . . . . . . . . . . . . . . . . . . . . . . . . . . . . . 269floating point . . . . . . . . . . . . . . . . . . . . . . . . . . . . . . . . . 120floating point registers . . . . . . . . . . . . . . . . . . . . . . . . 119floating point, MIPS remote . . . . . . . . . . . . . . . . . . 252flush_i_cache . . . . . . . . . . . . . . . . . . . . . . . . . . . . . . . 233flushregs . . . . . . . . . . . . . . . . . . . . . . . . . . . . . . . . . . . . 462focus . . . . . . . . . . . . . . . . . . . . . . . . . . . . . . . . . . . . . . . . 332focus of debugging . . . . . . . . . . . . . . . . . . . . . . . . . . . . . 35foo . . . . . . . . . . . . . . . . . . . . . . . . . . . . . . . . . . . . . . . . . . . 214foreground execution . . . . . . . . . . . . . . . . . . . . . . . . . . 71fork, debugging programs which call . . . . . . . . . . . 38format options . . . . . . . . . . . . . . . . . . . . . . . . . . . . . . . 106formatted output . . . . . . . . . . . . . . . . . . . . . . . . . . . . . 102Fortran . . . . . . . . . . . . . . . . . . . . . . . . . . . . . . . . . . . . . . . . . 1Fortran Defaults . . . . . . . . . . . . . . . . . . . . . . . . . . . . . . 173Fortran operators and expressions . . . . . . . . . . . . 173Fortran-specific support in gdb . . . . . . . . . . . . . . . 173forward-backward-delete-char () . . . . . . . . . . . 438forward-char (C-f) . . . . . . . . . . . . . . . . . . . . . . . . . . 436
forward-search . . . . . . . . . . . . . . . . . . . . . . . . . . . . . . . 90forward-search-history (C-s) . . . . . . . . . . . . . . 437forward-word (M-f) . . . . . . . . . . . . . . . . . . . . . . . . . . 436FR-V shared-library debugging . . . . . . . . . . . . . . . 273frame debugging info . . . . . . . . . . . . . . . . . . . . . . . . . 272frame number . . . . . . . . . . . . . . . . . . . . . . . . . . . . . . . . . 81frame pointer . . . . . . . . . . . . . . . . . . . . . . . . . . . . . . . . . . 81frame pointer register . . . . . . . . . . . . . . . . . . . . . . . . . 119frame, command . . . . . . . . . . . . . . . . . . . . . . . . . . . . . . 82frame, definition . . . . . . . . . . . . . . . . . . . . . . . . . . . . . . . 81frame, selecting . . . . . . . . . . . . . . . . . . . . . . . . . . . . . . . . 84Frame.block . . . . . . . . . . . . . . . . . . . . . . . . . . . . . . . . . 311Frame.find_sal . . . . . . . . . . . . . . . . . . . . . . . . . . . . . . 312Frame.function . . . . . . . . . . . . . . . . . . . . . . . . . . . . . . 312Frame.is_valid . . . . . . . . . . . . . . . . . . . . . . . . . . . . . . 310Frame.name . . . . . . . . . . . . . . . . . . . . . . . . . . . . . . . . . . 310Frame.newer . . . . . . . . . . . . . . . . . . . . . . . . . . . . . . . . . 312Frame.older . . . . . . . . . . . . . . . . . . . . . . . . . . . . . . . . . 312Frame.pc . . . . . . . . . . . . . . . . . . . . . . . . . . . . . . . . . . . . . 311Frame.read_var . . . . . . . . . . . . . . . . . . . . . . . . . . . . . . 312Frame.select . . . . . . . . . . . . . . . . . . . . . . . . . . . . . . . . 312Frame.type . . . . . . . . . . . . . . . . . . . . . . . . . . . . . . . . . . 310Frame.unwind_stop_reason . . . . . . . . . . . . . . . . . . 311frameless execution . . . . . . . . . . . . . . . . . . . . . . . . . . . . 81frames in python . . . . . . . . . . . . . . . . . . . . . . . . . . . . . 309frames-invalid annotation . . . . . . . . . . . . . . . . . . 413free memory information (MS-DOS) . . . . . . . . . . 237fstat, file-i/o system call . . . . . . . . . . . . . . . . . . . . . . 515ftrace . . . . . . . . . . . . . . . . . . . . . . . . . . . . . . . . . . . . . . . 141Fujitsu . . . . . . . . . . . . . . . . . . . . . . . . . . . . . . . . . . . . . . . 231full symbol tables, listing gdb’s internal . . . . . . . 194Function . . . . . . . . . . . . . . . . . . . . . . . . . . . . . . . . . . . . . 307function call arguments, optimized out . . . . . . . . . 83function entry/exit, wrong values of variables
. . . . . . . . . . . . . . . . . . . . . . . . . . . . . . . . . . . . . . . . . 100Function.__init__ . . . . . . . . . . . . . . . . . . . . . . . . . . 307Function.invoke . . . . . . . . . . . . . . . . . . . . . . . . . . . . . 308functions without line info, and stepping . . . . . . . 62
G‘g’ packet . . . . . . . . . . . . . . . . . . . . . . . . . . . . . . . . . . . . 470‘G’ packet . . . . . . . . . . . . . . . . . . . . . . . . . . . . . . . . . . . . 471g++, gnu C++ compiler . . . . . . . . . . . . . . . . . . . . . . . 165garbled pointers . . . . . . . . . . . . . . . . . . . . . . . . . . . . . . 237gcc and C++ . . . . . . . . . . . . . . . . . . . . . . . . . . . . . . . . . 168gcore . . . . . . . . . . . . . . . . . . . . . . . . . . . . . . . . . . . . . . . . 125gdb bugs, reporting . . . . . . . . . . . . . . . . . . . . . . . . . . 419gdb internal error . . . . . . . . . . . . . . . . . . . . . . . . . . . . 461gdb module . . . . . . . . . . . . . . . . . . . . . . . . . . . . . . . . . . 282gdb reference card . . . . . . . . . . . . . . . . . . . . . . . . . . . 451gdb startup . . . . . . . . . . . . . . . . . . . . . . . . . . . . . . . . . . . 15gdb version number . . . . . . . . . . . . . . . . . . . . . . . . . . . 23gdb.Block . . . . . . . . . . . . . . . . . . . . . . . . . . . . . . . . . . . . 312gdb.block_for_pc . . . . . . . . . . . . . . . . . . . . . . . . . . . . 312gdb.BP_ACCESS_WATCHPOINT . . . . . . . . . . . . . . . . . . 319gdb.BP_BREAKPOINT . . . . . . . . . . . . . . . . . . . . . . . . . . 319gdb.BP_HARDWARE_WATCHPOINT . . . . . . . . . . . . . . . . 319

Index 579
gdb.BP_READ_WATCHPOINT . . . . . . . . . . . . . . . . . . . . . 319gdb.BP_WATCHPOINT . . . . . . . . . . . . . . . . . . . . . . . . . . 319gdb.Breakpoint . . . . . . . . . . . . . . . . . . . . . . . . . . . . . . 317gdb.breakpoints . . . . . . . . . . . . . . . . . . . . . . . . . . . . . 283gdb.COMMAND_BREAKPOINTS . . . . . . . . . . . . . . . . . . . 304gdb.COMMAND_DATA . . . . . . . . . . . . . . . . . . . . . . . . . . . . 304gdb.COMMAND_FILES . . . . . . . . . . . . . . . . . . . . . . . . . . 304gdb.COMMAND_MAINTENANCE . . . . . . . . . . . . . . . . . . . 304gdb.COMMAND_NONE . . . . . . . . . . . . . . . . . . . . . . . . . . . . 303gdb.COMMAND_OBSCURE . . . . . . . . . . . . . . . . . . . . . . . . 304gdb.COMMAND_RUNNING . . . . . . . . . . . . . . . . . . . . . . . . 303gdb.COMMAND_STACK . . . . . . . . . . . . . . . . . . . . . . . . . . 304gdb.COMMAND_STATUS . . . . . . . . . . . . . . . . . . . . . . . . . 304gdb.COMMAND_SUPPORT . . . . . . . . . . . . . . . . . . . . . . . . 304gdb.COMMAND_TRACEPOINTS . . . . . . . . . . . . . . . . . . . 304gdb.COMPLETE_COMMAND . . . . . . . . . . . . . . . . . . . . . . . 305gdb.COMPLETE_FILENAME . . . . . . . . . . . . . . . . . . . . . . 305gdb.COMPLETE_LOCATION . . . . . . . . . . . . . . . . . . . . . . 305gdb.COMPLETE_NONE . . . . . . . . . . . . . . . . . . . . . . . . . . 305gdb.COMPLETE_SYMBOL . . . . . . . . . . . . . . . . . . . . . . . . 305gdb.current_objfile . . . . . . . . . . . . . . . . . . . . . . . . 309gdb.current_progspace . . . . . . . . . . . . . . . . . . . . . . 308gdb.decode_line . . . . . . . . . . . . . . . . . . . . . . . . . . . . . 285gdb.default_visualizer . . . . . . . . . . . . . . . . . . . . . 295gdb.error . . . . . . . . . . . . . . . . . . . . . . . . . . . . . . . . . . . . 285gdb.execute . . . . . . . . . . . . . . . . . . . . . . . . . . . . . . . . . 282gdb.FinishBreakpoint . . . . . . . . . . . . . . . . . . . . . . . 320gdb.flush . . . . . . . . . . . . . . . . . . . . . . . . . . . . . . . . . . . . 284gdb.frame_stop_reason_string . . . . . . . . . . . . . . 310gdb.Function . . . . . . . . . . . . . . . . . . . . . . . . . . . . . . . . 307gdb.GdbError . . . . . . . . . . . . . . . . . . . . . . . . . . . . . . . . 286gdb.history . . . . . . . . . . . . . . . . . . . . . . . . . . . . . . . . . 283gdb.Inferior . . . . . . . . . . . . . . . . . . . . . . . . . . . . . . . . 298gdb.inferiors . . . . . . . . . . . . . . . . . . . . . . . . . . . . . . . 298gdb.InferiorThread . . . . . . . . . . . . . . . . . . . . . . . . . 301‘gdb.ini’ . . . . . . . . . . . . . . . . . . . . . . . . . . . . . . . . . . . . . . 16gdb.LazyString . . . . . . . . . . . . . . . . . . . . . . . . . . . . . . 320gdb.lookup_global_symbol . . . . . . . . . . . . . . . . . . 313gdb.lookup_symbol . . . . . . . . . . . . . . . . . . . . . . . . . . 313gdb.lookup_type . . . . . . . . . . . . . . . . . . . . . . . . . . . . . 290gdb.MemoryError . . . . . . . . . . . . . . . . . . . . . . . . . . . . . 286gdb.newest_frame . . . . . . . . . . . . . . . . . . . . . . . . . . . . 310gdb.Objfile . . . . . . . . . . . . . . . . . . . . . . . . . . . . . . . . . 309gdb.objfiles . . . . . . . . . . . . . . . . . . . . . . . . . . . . . . . . 309gdb.PARAM_AUTO_BOOLEAN . . . . . . . . . . . . . . . . . . . . . 307gdb.PARAM_BOOLEAN . . . . . . . . . . . . . . . . . . . . . . . . . . 307gdb.PARAM_ENUM . . . . . . . . . . . . . . . . . . . . . . . . . . . . . . 307gdb.PARAM_FILENAME . . . . . . . . . . . . . . . . . . . . . . . . . 307gdb.PARAM_INTEGER . . . . . . . . . . . . . . . . . . . . . . . . . . 307gdb.PARAM_OPTIONAL_FILENAME . . . . . . . . . . . . . . . 307gdb.PARAM_STRING . . . . . . . . . . . . . . . . . . . . . . . . . . . . 307gdb.PARAM_STRING_NOESCAPE . . . . . . . . . . . . . . . . . 307gdb.PARAM_UINTEGER . . . . . . . . . . . . . . . . . . . . . . . . . 307gdb.PARAM_ZINTEGER . . . . . . . . . . . . . . . . . . . . . . . . . 307gdb.parameter . . . . . . . . . . . . . . . . . . . . . . . . . . . . . . . 283gdb.Parameter . . . . . . . . . . . . . . . . . . . . . . . . . . . . . . . 305gdb.parse_and_eval . . . . . . . . . . . . . . . . . . . . . . . . . 283gdb.post_event . . . . . . . . . . . . . . . . . . . . . . . . . . . . . . 283
gdb.printing . . . . . . . . . . . . . . . . . . . . . . . . . . . . . . . . . . 323gdb.Progspace . . . . . . . . . . . . . . . . . . . . . . . . . . . . . . . 308gdb.progspaces . . . . . . . . . . . . . . . . . . . . . . . . . . . . . . 308gdb.prompt . . . . . . . . . . . . . . . . . . . . . . . . . . . . . . . . . . 325gdb.prompt_hook . . . . . . . . . . . . . . . . . . . . . . . . . . . . . 285gdb.PYTHONDIR . . . . . . . . . . . . . . . . . . . . . . . . . . . . . . . 282gdb.read_memory . . . . . . . . . . . . . . . . . . . . . . . . . . . . . 298gdb.search_memory . . . . . . . . . . . . . . . . . . . . . . . . . . 299gdb.selected_frame . . . . . . . . . . . . . . . . . . . . . . . . . 310gdb.selected_inferior . . . . . . . . . . . . . . . . . . . . . . 298gdb.selected_thread . . . . . . . . . . . . . . . . . . . . . . . . 301gdb.solib_name . . . . . . . . . . . . . . . . . . . . . . . . . . . . . . 285gdb.STDERR . . . . . . . . . . . . . . . . . . . . . . . . . . . . . . . . . . 284gdb.STDLOG . . . . . . . . . . . . . . . . . . . . . . . . . . . . . . . . . . 284gdb.STDOUT . . . . . . . . . . . . . . . . . . . . . . . . . . . . . . . . . . 284gdb.string_to_argv . . . . . . . . . . . . . . . . . . . . . . . . . 303gdb.Symbol . . . . . . . . . . . . . . . . . . . . . . . . . . . . . . . . . . 313gdb.SYMBOL_FUNCTIONS_DOMAIN . . . . . . . . . . . . . . . 315gdb.SYMBOL_LABEL_DOMAIN . . . . . . . . . . . . . . . . . . . 315gdb.SYMBOL_LOC_ARG . . . . . . . . . . . . . . . . . . . . . . . . . 315gdb.SYMBOL_LOC_BLOCK . . . . . . . . . . . . . . . . . . . . . . . 316gdb.SYMBOL_LOC_COMPUTED . . . . . . . . . . . . . . . . . . . 316gdb.SYMBOL_LOC_CONST . . . . . . . . . . . . . . . . . . . . . . . 315gdb.SYMBOL_LOC_CONST_BYTES . . . . . . . . . . . . . . . . 316gdb.SYMBOL_LOC_LOCAL . . . . . . . . . . . . . . . . . . . . . . . 315gdb.SYMBOL_LOC_OPTIMIZED_OUT . . . . . . . . . . . . . . 316gdb.SYMBOL_LOC_REF_ARG . . . . . . . . . . . . . . . . . . . . . 315gdb.SYMBOL_LOC_REGISTER . . . . . . . . . . . . . . . . . . . 315gdb.SYMBOL_LOC_REGPARM_ADDR . . . . . . . . . . . . . . . 315gdb.SYMBOL_LOC_STATIC . . . . . . . . . . . . . . . . . . . . . . 315gdb.SYMBOL_LOC_TYPEDEF . . . . . . . . . . . . . . . . . . . . . 316gdb.SYMBOL_LOC_UNDEF . . . . . . . . . . . . . . . . . . . . . . . 315gdb.SYMBOL_LOC_UNRESOLVED . . . . . . . . . . . . . . . . . 316gdb.SYMBOL_STRUCT_DOMAIN . . . . . . . . . . . . . . . . . . 315gdb.SYMBOL_TYPES_DOMAIN . . . . . . . . . . . . . . . . . . . 315gdb.SYMBOL_UNDEF_DOMAIN . . . . . . . . . . . . . . . . . . . 315gdb.SYMBOL_VAR_DOMAIN . . . . . . . . . . . . . . . . . . . . . . 315gdb.SYMBOL_VARIABLES_DOMAIN . . . . . . . . . . . . . . . 315gdb.Symtab . . . . . . . . . . . . . . . . . . . . . . . . . . . . . . . . . . 316gdb.Symtab_and_line . . . . . . . . . . . . . . . . . . . . . . . . 316gdb.target_charset . . . . . . . . . . . . . . . . . . . . . . . . . 285gdb.target_wide_charset . . . . . . . . . . . . . . . . . . . 285gdb.Type . . . . . . . . . . . . . . . . . . . . . . . . . . . . . . . . . . . . . 290gdb.TYPE_CODE_ARRAY . . . . . . . . . . . . . . . . . . . . . . . . 292gdb.TYPE_CODE_BITSTRING . . . . . . . . . . . . . . . . . . . 293gdb.TYPE_CODE_BOOL . . . . . . . . . . . . . . . . . . . . . . . . . 293gdb.TYPE_CODE_CHAR . . . . . . . . . . . . . . . . . . . . . . . . . 293gdb.TYPE_CODE_COMPLEX . . . . . . . . . . . . . . . . . . . . . . 293gdb.TYPE_CODE_DECFLOAT . . . . . . . . . . . . . . . . . . . . . 293gdb.TYPE_CODE_ENUM . . . . . . . . . . . . . . . . . . . . . . . . . 292gdb.TYPE_CODE_ERROR . . . . . . . . . . . . . . . . . . . . . . . . 293gdb.TYPE_CODE_FLAGS . . . . . . . . . . . . . . . . . . . . . . . . 292gdb.TYPE_CODE_FLT . . . . . . . . . . . . . . . . . . . . . . . . . . 293gdb.TYPE_CODE_FUNC . . . . . . . . . . . . . . . . . . . . . . . . . 292gdb.TYPE_CODE_INT . . . . . . . . . . . . . . . . . . . . . . . . . . 292gdb.TYPE_CODE_INTERNAL_FUNCTION . . . . . . . . . . 293gdb.TYPE_CODE_MEMBERPTR . . . . . . . . . . . . . . . . . . . 293gdb.TYPE_CODE_METHOD . . . . . . . . . . . . . . . . . . . . . . . 293
580 Debugging with gdb
gdb.TYPE_CODE_METHODPTR . . . . . . . . . . . . . . . . . . . 293gdb.TYPE_CODE_NAMESPACE . . . . . . . . . . . . . . . . . . . 293gdb.TYPE_CODE_PTR . . . . . . . . . . . . . . . . . . . . . . . . . . 292gdb.TYPE_CODE_RANGE . . . . . . . . . . . . . . . . . . . . . . . . 293gdb.TYPE_CODE_REF . . . . . . . . . . . . . . . . . . . . . . . . . . 293gdb.TYPE_CODE_SET . . . . . . . . . . . . . . . . . . . . . . . . . . 293gdb.TYPE_CODE_STRING . . . . . . . . . . . . . . . . . . . . . . . 293gdb.TYPE_CODE_STRUCT . . . . . . . . . . . . . . . . . . . . . . . 292gdb.TYPE_CODE_TYPEDEF . . . . . . . . . . . . . . . . . . . . . . 293gdb.TYPE_CODE_UNION . . . . . . . . . . . . . . . . . . . . . . . . 292gdb.TYPE_CODE_VOID . . . . . . . . . . . . . . . . . . . . . . . . . 293gdb.types . . . . . . . . . . . . . . . . . . . . . . . . . . . . . . . . . . . . 324gdb.Value . . . . . . . . . . . . . . . . . . . . . . . . . . . . . . . . . . . . 286gdb.WP_ACCESS . . . . . . . . . . . . . . . . . . . . . . . . . . . . . . . 318gdb.WP_READ . . . . . . . . . . . . . . . . . . . . . . . . . . . . . . . . . 318gdb.WP_WRITE . . . . . . . . . . . . . . . . . . . . . . . . . . . . . . . . 318gdb.write . . . . . . . . . . . . . . . . . . . . . . . . . . . . . . . . . . . . 284gdb.write_memory . . . . . . . . . . . . . . . . . . . . . . . . . . . . 299gdb/mi development . . . . . . . . . . . . . . . . . . . . . . . . . 343GDB/MI General Design . . . . . . . . . . . . . . . . . . . . . 337gdb/mi, async records . . . . . . . . . . . . . . . . . . . . . . . . 344gdb/mi, breakpoint commands . . . . . . . . . . . . . . . 349gdb/mi, compatibility with CLI . . . . . . . . . . . . . . 342gdb/mi, data manipulation . . . . . . . . . . . . . . . . . . . 385gdb/mi, input syntax . . . . . . . . . . . . . . . . . . . . . . . . . 340gdb/mi, its purpose . . . . . . . . . . . . . . . . . . . . . . . . . . 337gdb/mi, output syntax . . . . . . . . . . . . . . . . . . . . . . . 341gdb/mi, result records . . . . . . . . . . . . . . . . . . . . . . . . 343gdb/mi, simple examples . . . . . . . . . . . . . . . . . . . . . 348gdb/mi, stream records . . . . . . . . . . . . . . . . . . . . . . . 344gdb_init_reader . . . . . . . . . . . . . . . . . . . . . . . . . . . . . 417gdbarch debugging info . . . . . . . . . . . . . . . . . . . . . . . 271GDBHISTFILE, environment variable . . . . . . . . . . . 266gdbserver . . . . . . . . . . . . . . . . . . . . . . . . . . . . . . . . . . . . 221gdbserver, command-line arguments . . . . . . . . . 221gdbserver, multiple processes . . . . . . . . . . . . . . . . 222gdbserver, search path for libthread_db . . . . . . 224GDT . . . . . . . . . . . . . . . . . . . . . . . . . . . . . . . . . . . . . . . . . 237generate-core-file . . . . . . . . . . . . . . . . . . . . . . . . . 125get thread information block address . . . . . . . . . . 482get thread-local storage address, remote request
. . . . . . . . . . . . . . . . . . . . . . . . . . . . . . . . . . . . . . . . . 481getDebugChar . . . . . . . . . . . . . . . . . . . . . . . . . . . . . . . . 232gettimeofday, file-i/o system call . . . . . . . . . . . . . . 515global debugging information directory . . . . . . . . 209gnu C++ . . . . . . . . . . . . . . . . . . . . . . . . . . . . . . . . . . . . . 165gnu Emacs . . . . . . . . . . . . . . . . . . . . . . . . . . . . . . . . . . . 335gnu Hurd debugging . . . . . . . . . . . . . . . . . . . . . . . . . 242gnu/Hurd debug messages . . . . . . . . . . . . . . . . . . . 272gnu/Linux LWP debug messages . . . . . . . . . . . . . 272gnu_debuglink_crc32 . . . . . . . . . . . . . . . . . . . . . . . . 211
Hh (help) . . . . . . . . . . . . . . . . . . . . . . . . . . . . . . . . . . . . . . . 21‘H’ packet . . . . . . . . . . . . . . . . . . . . . . . . . . . . . . . . . . . . 471handle . . . . . . . . . . . . . . . . . . . . . . . . . . . . . . . . . . . . . . . . 66handle_exception . . . . . . . . . . . . . . . . . . . . . . . . . . . . 231
handling signals . . . . . . . . . . . . . . . . . . . . . . . . . . . . . . . 66hardware breakpoints . . . . . . . . . . . . . . . . . . . . . . . . . . 45hardware debug registers . . . . . . . . . . . . . . . . . . . . . 464hardware watchpoints . . . . . . . . . . . . . . . . . . . . . . . . . 49hash mark while downloading . . . . . . . . . . . . . . . . . 217hbreak . . . . . . . . . . . . . . . . . . . . . . . . . . . . . . . . . . . . . . . . 45help . . . . . . . . . . . . . . . . . . . . . . . . . . . . . . . . . . . . . . . . . . 21help function . . . . . . . . . . . . . . . . . . . . . . . . . . . . . . . 119help target . . . . . . . . . . . . . . . . . . . . . . . . . . . . . . . . . . 216help user-defined . . . . . . . . . . . . . . . . . . . . . . . . . . . 276heuristic-fence-post (Alpha, MIPS) . . . . . . . 260history events . . . . . . . . . . . . . . . . . . . . . . . . . . . . . . . . 445history expansion . . . . . . . . . . . . . . . . . . . . . . . . . . . . . 445history expansion, turn on/off . . . . . . . . . . . . . . . . 266history file . . . . . . . . . . . . . . . . . . . . . . . . . . . . . . . . . . . 266history number . . . . . . . . . . . . . . . . . . . . . . . . . . . . . . . 116history of values printed by gdb . . . . . . . . . . . . . . 116history size . . . . . . . . . . . . . . . . . . . . . . . . . . . . . . . . . . . 266history substitution . . . . . . . . . . . . . . . . . . . . . . . . . . . 266history-preserve-point . . . . . . . . . . . . . . . . . . . . . 428history-search-backward () . . . . . . . . . . . . . . . . 437history-search-forward () . . . . . . . . . . . . . . . . . . 437history-size . . . . . . . . . . . . . . . . . . . . . . . . . . . . . . . . 428HISTSIZE, environment variable . . . . . . . . . . . . . . . 266hook . . . . . . . . . . . . . . . . . . . . . . . . . . . . . . . . . . . . . . . . . 277hookpost . . . . . . . . . . . . . . . . . . . . . . . . . . . . . . . . . . . . . 277hooks, for commands . . . . . . . . . . . . . . . . . . . . . . . . . 277hooks, post-command . . . . . . . . . . . . . . . . . . . . . . . . 277hooks, pre-command . . . . . . . . . . . . . . . . . . . . . . . . . . 277horizontal-scroll-mode . . . . . . . . . . . . . . . . . . . . . 428host character set . . . . . . . . . . . . . . . . . . . . . . . . . . . . 125Host I/O, remote protocol . . . . . . . . . . . . . . . . . . . . 503how many arguments (user-defined commands)
. . . . . . . . . . . . . . . . . . . . . . . . . . . . . . . . . . . . . . . . . 275HPPA support . . . . . . . . . . . . . . . . . . . . . . . . . . . . . . . 262htrace . . . . . . . . . . . . . . . . . . . . . . . . . . . . . . . . . . . . . . . 254hwatch . . . . . . . . . . . . . . . . . . . . . . . . . . . . . . . . . . . . . . . 254
Ii (info) . . . . . . . . . . . . . . . . . . . . . . . . . . . . . . . . . . . . . . . 23‘i’ packet . . . . . . . . . . . . . . . . . . . . . . . . . . . . . . . . . . . . 471‘I’ packet . . . . . . . . . . . . . . . . . . . . . . . . . . . . . . . . . . . . 471i/o . . . . . . . . . . . . . . . . . . . . . . . . . . . . . . . . . . . . . . . . . . . . 30I/O registers (Atmel AVR) . . . . . . . . . . . . . . . . . . . 259i386 . . . . . . . . . . . . . . . . . . . . . . . . . . . . . . . . . . . . . . . . . . 231‘i386-stub.c’ . . . . . . . . . . . . . . . . . . . . . . . . . . . . . . . . 231IDT . . . . . . . . . . . . . . . . . . . . . . . . . . . . . . . . . . . . . . . . . . 237if . . . . . . . . . . . . . . . . . . . . . . . . . . . . . . . . . . . . . . . . . . . . 279ignore . . . . . . . . . . . . . . . . . . . . . . . . . . . . . . . . . . . . . . . . 58ignore count (of breakpoint) . . . . . . . . . . . . . . . . . . . 58INCLUDE_RDB . . . . . . . . . . . . . . . . . . . . . . . . . . . . . . . . . 246incomplete type . . . . . . . . . . . . . . . . . . . . . . . . . . . . . . 191indentation in structure display . . . . . . . . . . . . . . . 111index files . . . . . . . . . . . . . . . . . . . . . . . . . . . . . . . . . . . . 212index section format . . . . . . . . . . . . . . . . . . . . . . . . . . 549inferior . . . . . . . . . . . . . . . . . . . . . . . . . . . . . . . . . . . . . . . . 32inferior debugging info . . . . . . . . . . . . . . . . . . . . . . . . 272
Index 581
inferior events in Python . . . . . . . . . . . . . . . . . . . . . 299inferior functions, calling . . . . . . . . . . . . . . . . . . . . . 198inferior infno . . . . . . . . . . . . . . . . . . . . . . . . . . . . . . . 33inferior tty . . . . . . . . . . . . . . . . . . . . . . . . . . . . . . . . . . . . 31Inferior.is_valid . . . . . . . . . . . . . . . . . . . . . . . . . . 298Inferior.num . . . . . . . . . . . . . . . . . . . . . . . . . . . . . . . . 298Inferior.pid . . . . . . . . . . . . . . . . . . . . . . . . . . . . . . . . 298Inferior.read_memory . . . . . . . . . . . . . . . . . . . . . . . 298Inferior.search_memory . . . . . . . . . . . . . . . . . . . . . 299Inferior.threads . . . . . . . . . . . . . . . . . . . . . . . . . . . . 298Inferior.was_attached . . . . . . . . . . . . . . . . . . . . . . 298Inferior.write_memory . . . . . . . . . . . . . . . . . . . . . . 299inferiors in Python . . . . . . . . . . . . . . . . . . . . . . . . . . . 298InferiorThread.is_exited . . . . . . . . . . . . . . . . . . 302InferiorThread.is_running . . . . . . . . . . . . . . . . . 302InferiorThread.is_stopped . . . . . . . . . . . . . . . . . 302InferiorThread.is_valid . . . . . . . . . . . . . . . . . . . 302InferiorThread.name . . . . . . . . . . . . . . . . . . . . . . . . 301InferiorThread.num . . . . . . . . . . . . . . . . . . . . . . . . . 301InferiorThread.ptid . . . . . . . . . . . . . . . . . . . . . . . . 301InferiorThread.switch . . . . . . . . . . . . . . . . . . . . . . 302infinite recursion in user-defined commands . . . 276info . . . . . . . . . . . . . . . . . . . . . . . . . . . . . . . . . . . . . . . . . . 23info address . . . . . . . . . . . . . . . . . . . . . . . . . . . . . . . . . 189info all-registers . . . . . . . . . . . . . . . . . . . . . . . . . . 119info args . . . . . . . . . . . . . . . . . . . . . . . . . . . . . . . . . . . . . 86info auto-load-scripts . . . . . . . . . . . . . . . . . . . . . 321info auxv . . . . . . . . . . . . . . . . . . . . . . . . . . . . . . . . . . . . 121info breakpoints . . . . . . . . . . . . . . . . . . . . . . . . . . . . . 46info catch . . . . . . . . . . . . . . . . . . . . . . . . . . . . . . . . . . . . 86info checkpoints . . . . . . . . . . . . . . . . . . . . . . . . . . . . . 41info classes . . . . . . . . . . . . . . . . . . . . . . . . . . . . . . . . . 192info common . . . . . . . . . . . . . . . . . . . . . . . . . . . . . . . . . . 173info copying . . . . . . . . . . . . . . . . . . . . . . . . . . . . . . . . . . 23info dcache . . . . . . . . . . . . . . . . . . . . . . . . . . . . . . . . . . 128info display . . . . . . . . . . . . . . . . . . . . . . . . . . . . . . . . . 106info dll . . . . . . . . . . . . . . . . . . . . . . . . . . . . . . . . . . . . . 239info dos . . . . . . . . . . . . . . . . . . . . . . . . . . . . . . . . . . . . . 237info extensions . . . . . . . . . . . . . . . . . . . . . . . . . . . . . 163info f (info frame) . . . . . . . . . . . . . . . . . . . . . . . . . . . 85info files . . . . . . . . . . . . . . . . . . . . . . . . . . . . . . . . . . . 204info float . . . . . . . . . . . . . . . . . . . . . . . . . . . . . . . . . . . 120info for known .debug gdb scripts-loaded scripts
. . . . . . . . . . . . . . . . . . . . . . . . . . . . . . . . . . . . . . . . . 462info for known object files . . . . . . . . . . . . . . . . . . . . 462info frame . . . . . . . . . . . . . . . . . . . . . . . . . . . . . . . . . . . . 85info frame, show the source language . . . . . . . . 163info functions . . . . . . . . . . . . . . . . . . . . . . . . . . . . . . 192info handle . . . . . . . . . . . . . . . . . . . . . . . . . . . . . . . . . . . 66info inferiors . . . . . . . . . . . . . . . . . . . . . . . . . . . . . . . 32info io_registers, AVR . . . . . . . . . . . . . . . . . . . . . 259info line . . . . . . . . . . . . . . . . . . . . . . . . . . . . . . . . . . . . . 93info line, and Objective-C . . . . . . . . . . . . . . . . . . 171info locals . . . . . . . . . . . . . . . . . . . . . . . . . . . . . . . . . . . 86info macro . . . . . . . . . . . . . . . . . . . . . . . . . . . . . . . . . . . 135info macros . . . . . . . . . . . . . . . . . . . . . . . . . . . . . . . . . . 135info mem . . . . . . . . . . . . . . . . . . . . . . . . . . . . . . . . . . . . . 122info meminfo . . . . . . . . . . . . . . . . . . . . . . . . . . . . . . . . . 237
info or1k spr . . . . . . . . . . . . . . . . . . . . . . . . . . . . . . . . 253info os . . . . . . . . . . . . . . . . . . . . . . . . . . . . . . . . . . . . . . 121info os processes . . . . . . . . . . . . . . . . . . . . . . . . . . . 121info pidlist . . . . . . . . . . . . . . . . . . . . . . . . . . . . . . . . . 236info pretty-printer . . . . . . . . . . . . . . . . . . . . . . . . 115info proc . . . . . . . . . . . . . . . . . . . . . . . . . . . . . . . . . . . . 235info program . . . . . . . . . . . . . . . . . . . . . . . . . . . . . . . . . . 43info record . . . . . . . . . . . . . . . . . . . . . . . . . . . . . . . . . . . 79info registers . . . . . . . . . . . . . . . . . . . . . . . . . . . . . . 119info scope . . . . . . . . . . . . . . . . . . . . . . . . . . . . . . . . . . . 191info selectors . . . . . . . . . . . . . . . . . . . . . . . . . . . . . . 192info serial . . . . . . . . . . . . . . . . . . . . . . . . . . . . . . . . . . 239info set . . . . . . . . . . . . . . . . . . . . . . . . . . . . . . . . . . . . . . 23info share . . . . . . . . . . . . . . . . . . . . . . . . . . . . . . . . . . . 206info sharedlibrary . . . . . . . . . . . . . . . . . . . . . . . . . . 206info signals . . . . . . . . . . . . . . . . . . . . . . . . . . . . . . . . . . 66info skip . . . . . . . . . . . . . . . . . . . . . . . . . . . . . . . . . . . . . 65info source . . . . . . . . . . . . . . . . . . . . . . . . . . . . . . . . . . 192info source, show the source language . . . . . . . 163info sources . . . . . . . . . . . . . . . . . . . . . . . . . . . . . . . . . 192info spu . . . . . . . . . . . . . . . . . . . . . . . . . . . . . . . . . . . . . 262info stack . . . . . . . . . . . . . . . . . . . . . . . . . . . . . . . . . . . . 82info static-tracepoint-markers . . . . . . . . . . . . 147info symbol . . . . . . . . . . . . . . . . . . . . . . . . . . . . . . . . . . 189info target . . . . . . . . . . . . . . . . . . . . . . . . . . . . . . . . . . 204info task taskno . . . . . . . . . . . . . . . . . . . . . . . . . . . . 185info tasks . . . . . . . . . . . . . . . . . . . . . . . . . . . . . . . . . . . 183info terminal . . . . . . . . . . . . . . . . . . . . . . . . . . . . . . . . . 30info threads . . . . . . . . . . . . . . . . . . . . . . . . . . . . . . . . . . 36info tp [n...] . . . . . . . . . . . . . . . . . . . . . . . . . . . . . . . 146info tracepoints [n...] . . . . . . . . . . . . . . . . . . . . . 146info tvariables . . . . . . . . . . . . . . . . . . . . . . . . . . . . . 144info types . . . . . . . . . . . . . . . . . . . . . . . . . . . . . . . . . . . 191info udot . . . . . . . . . . . . . . . . . . . . . . . . . . . . . . . . . . . . 121info variables . . . . . . . . . . . . . . . . . . . . . . . . . . . . . . 192info vector . . . . . . . . . . . . . . . . . . . . . . . . . . . . . . . . . . 121info w32 . . . . . . . . . . . . . . . . . . . . . . . . . . . . . . . . . . . . . 239info warranty . . . . . . . . . . . . . . . . . . . . . . . . . . . . . . . . . 23info watchpoints [n...] . . . . . . . . . . . . . . . . . . . . . . 50info win . . . . . . . . . . . . . . . . . . . . . . . . . . . . . . . . . . . . . 331information about static tracepoint markers . . . 147information about tracepoints . . . . . . . . . . . . . . . . 146inheritance . . . . . . . . . . . . . . . . . . . . . . . . . . . . . . . . . . . 170init file . . . . . . . . . . . . . . . . . . . . . . . . . . . . . . . . . . . . . . . . 15init file name . . . . . . . . . . . . . . . . . . . . . . . . . . . . . . . . . . 16init-if-undefined . . . . . . . . . . . . . . . . . . . . . . . . . . 118initial frame . . . . . . . . . . . . . . . . . . . . . . . . . . . . . . . . . . . 81initialization file, readline . . . . . . . . . . . . . . . . . . . . . 426inline functions, debugging . . . . . . . . . . . . . . . . . . . 131innermost frame . . . . . . . . . . . . . . . . . . . . . . . . . . . . . . . 81input syntax for gdb/mi . . . . . . . . . . . . . . . . . . . . . . 340input-meta . . . . . . . . . . . . . . . . . . . . . . . . . . . . . . . . . . 428insert-comment (M-#) . . . . . . . . . . . . . . . . . . . . . . . 442insert-completions (M-*) . . . . . . . . . . . . . . . . . . . 440inspect . . . . . . . . . . . . . . . . . . . . . . . . . . . . . . . . . . . . . . . 97installation . . . . . . . . . . . . . . . . . . . . . . . . . . . . . . . . . . . 453instructions, assembly . . . . . . . . . . . . . . . . . . . . . . . . . 93integral datatypes, in file-i/o protocol . . . . . . . . . 516
582 Debugging with gdb
Intel . . . . . . . . . . . . . . . . . . . . . . . . . . . . . . . . . . . . . . . . . 231Intel disassembly flavor . . . . . . . . . . . . . . . . . . . . . . . . 95interaction, readline . . . . . . . . . . . . . . . . . . . . . . . . . . 423internal commands . . . . . . . . . . . . . . . . . . . . . . . . . . . 459internal errors, control of gdb behavior . . . . . . . 461internal gdb breakpoints . . . . . . . . . . . . . . . . . . . . . . 49interpreter-exec . . . . . . . . . . . . . . . . . . . . . . . . . . . . 327interrupt . . . . . . . . . . . . . . . . . . . . . . . . . . . . . . . . . . . . . . 16interrupt . . . . . . . . . . . . . . . . . . . . . . . . . . . . . . . . . . . . . 72interrupt debuggee on MS-Windows . . . . . . . . . . 239interrupt remote programs . . . . . . . . . . . . . . . 226, 227interrupting remote programs . . . . . . . . . . . . . . . . . 220interrupting remote targets . . . . . . . . . . . . . . . . . . . 232interrupts (remote protocol) . . . . . . . . . . . . . . . . . . 504invalid input . . . . . . . . . . . . . . . . . . . . . . . . . . . . . . . . . 419invoke another interpreter . . . . . . . . . . . . . . . . . . . . 327isatty, file-i/o system call . . . . . . . . . . . . . . . . . . . . . 515isearch-terminators . . . . . . . . . . . . . . . . . . . . . . . . 428
JJIT compilation interface . . . . . . . . . . . . . . . . . . . . . 415JIT debug info reader . . . . . . . . . . . . . . . . . . . . . . . . 416jit-reader-load . . . . . . . . . . . . . . . . . . . . . . . . . . . . . 417jit-reader-unload . . . . . . . . . . . . . . . . . . . . . . . . . . 417jump . . . . . . . . . . . . . . . . . . . . . . . . . . . . . . . . . . . . . . . . . 196jump, and Objective-C . . . . . . . . . . . . . . . . . . . . . . . . 171just-in-time compilation . . . . . . . . . . . . . . . . . . . . . . 415just-in-time compilation, debugging messages
. . . . . . . . . . . . . . . . . . . . . . . . . . . . . . . . . . . . . . . . . 272
K‘k’ packet . . . . . . . . . . . . . . . . . . . . . . . . . . . . . . . . . . . . 471kernel crash dump . . . . . . . . . . . . . . . . . . . . . . . . . . . . 235kernel memory image . . . . . . . . . . . . . . . . . . . . . . . . . 235KeyboardInterrupt . . . . . . . . . . . . . . . . . . . . . . . . . . 286keymap . . . . . . . . . . . . . . . . . . . . . . . . . . . . . . . . . . . . . . . 429kill . . . . . . . . . . . . . . . . . . . . . . . . . . . . . . . . . . . . . . . . . . 32kill inferiors infno... . . . . . . . . . . . . . . . . . . . . . 34kill ring . . . . . . . . . . . . . . . . . . . . . . . . . . . . . . . . . . . . . . 424kill-line (C-k) . . . . . . . . . . . . . . . . . . . . . . . . . . . . . 439kill-region () . . . . . . . . . . . . . . . . . . . . . . . . . . . . . . 439kill-whole-line () . . . . . . . . . . . . . . . . . . . . . . . . . . 439kill-word (M-d) . . . . . . . . . . . . . . . . . . . . . . . . . . . . . 439killing text . . . . . . . . . . . . . . . . . . . . . . . . . . . . . . . . . . . 424kvm . . . . . . . . . . . . . . . . . . . . . . . . . . . . . . . . . . . . . . . . . . 235
Ll (list) . . . . . . . . . . . . . . . . . . . . . . . . . . . . . . . . . . . . . . . 87languages . . . . . . . . . . . . . . . . . . . . . . . . . . . . . . . . . . . . 161last tracepoint number . . . . . . . . . . . . . . . . . . . . . . . 142latest breakpoint . . . . . . . . . . . . . . . . . . . . . . . . . . . . . . 44layout . . . . . . . . . . . . . . . . . . . . . . . . . . . . . . . . . . . . . . . 332lazy strings in python . . . . . . . . . . . . . . . . . . . . . . . . 320LazyString.address . . . . . . . . . . . . . . . . . . . . . . . . . 321LazyString.encoding . . . . . . . . . . . . . . . . . . . . . . . . 321
LazyString.length . . . . . . . . . . . . . . . . . . . . . . . . . . 321LazyString.type . . . . . . . . . . . . . . . . . . . . . . . . . . . . . 321LazyString.value . . . . . . . . . . . . . . . . . . . . . . . . . . . . 321LDT . . . . . . . . . . . . . . . . . . . . . . . . . . . . . . . . . . . . . . . . . 237leaving gdb . . . . . . . . . . . . . . . . . . . . . . . . . . . . . . . . . . . 16Left . . . . . . . . . . . . . . . . . . . . . . . . . . . . . . . . . . . . . . . . . 331libkvm . . . . . . . . . . . . . . . . . . . . . . . . . . . . . . . . . . . . . . . 235library list format, remote protocol . . . . . . . 520, 521limit hardware breakpoints and watchpoints . . 227limit hardware watchpoints length . . . . . . . . . . . . 227limit on number of printed array elements . . . . . 108limits, in file-i/o protocol . . . . . . . . . . . . . . . . . . . . . 519linespec . . . . . . . . . . . . . . . . . . . . . . . . . . . . . . . . . . . . . . . 88Linux lightweight processes . . . . . . . . . . . . . . . . . . . 272list . . . . . . . . . . . . . . . . . . . . . . . . . . . . . . . . . . . . . . . . . . 87list active threads, remote request . . . . . . . . . . . . 481list of supported file-i/o calls . . . . . . . . . . . . . . . . . . 511list output in gdb/mi . . . . . . . . . . . . . . . . . . . . . . . . . 342list, and Objective-C . . . . . . . . . . . . . . . . . . . . . . . . 171list, how many lines to display . . . . . . . . . . . . . . . 87listing gdb’s internal symbol tables . . . . . . . . . . . 194listing machine instructions . . . . . . . . . . . . . . . . . . . . 93listing mapped overlays . . . . . . . . . . . . . . . . . . . . . . . 157load address, overlay’s . . . . . . . . . . . . . . . . . . . . . . . . 155load filename . . . . . . . . . . . . . . . . . . . . . . . . . . . . . . . 217load shared library . . . . . . . . . . . . . . . . . . . . . . . . . . . 206load symbols from memory . . . . . . . . . . . . . . . . . . . 203local variables . . . . . . . . . . . . . . . . . . . . . . . . . . . . . . . . 191locate address . . . . . . . . . . . . . . . . . . . . . . . . . . . . . . . . 102lock scheduler . . . . . . . . . . . . . . . . . . . . . . . . . . . . . . . . . 69log output in gdb/mi . . . . . . . . . . . . . . . . . . . . . . . . . 342logging file name . . . . . . . . . . . . . . . . . . . . . . . . . . . . . . 17logging gdb output . . . . . . . . . . . . . . . . . . . . . . . . . . . . 17loop_break . . . . . . . . . . . . . . . . . . . . . . . . . . . . . . . . . . 279loop_continue . . . . . . . . . . . . . . . . . . . . . . . . . . . . . . . 279lseek flags, in file-i/o protocol . . . . . . . . . . . . . . . . . 519lseek, file-i/o system call . . . . . . . . . . . . . . . . . . . . . . 513
M‘m’ packet . . . . . . . . . . . . . . . . . . . . . . . . . . . . . . . . . . . . 471‘M’ packet . . . . . . . . . . . . . . . . . . . . . . . . . . . . . . . . . . . . 472M32-EVA target board address . . . . . . . . . . . . . . . 250M32R/Chaos debugging . . . . . . . . . . . . . . . . . . . . . . 250m680x0 . . . . . . . . . . . . . . . . . . . . . . . . . . . . . . . . . . . . . . 231‘m68k-stub.c’ . . . . . . . . . . . . . . . . . . . . . . . . . . . . . . . . 231machine instructions . . . . . . . . . . . . . . . . . . . . . . . . . . . 93macro define . . . . . . . . . . . . . . . . . . . . . . . . . . . . . . . . . 135macro definition, showing . . . . . . . . . . . . . . . . . . . . . 135macro exp1 . . . . . . . . . . . . . . . . . . . . . . . . . . . . . . . . . . . 135macro expand . . . . . . . . . . . . . . . . . . . . . . . . . . . . . . . . . 135macro expansion, showing the results of
preprocessor . . . . . . . . . . . . . . . . . . . . . . . . . . . . . 135macro list . . . . . . . . . . . . . . . . . . . . . . . . . . . . . . . . . . . 136macro undef . . . . . . . . . . . . . . . . . . . . . . . . . . . . . . . . . . 136macros, example of debugging with . . . . . . . . . . . 136macros, from debug info . . . . . . . . . . . . . . . . . . . . . . 135macros, user-defined . . . . . . . . . . . . . . . . . . . . . . . . . . 135
Index 583
mailing lists . . . . . . . . . . . . . . . . . . . . . . . . . . . . . . . . . . 343maint agent . . . . . . . . . . . . . . . . . . . . . . . . . . . . . . . . . . 459maint agent-eval . . . . . . . . . . . . . . . . . . . . . . . . . . . . 459maint check-symtabs . . . . . . . . . . . . . . . . . . . . . . . . 460maint cplus first_component . . . . . . . . . . . . . . . . 460maint cplus namespace . . . . . . . . . . . . . . . . . . . . . . . 460maint demangle . . . . . . . . . . . . . . . . . . . . . . . . . . . . . . 460maint deprecate . . . . . . . . . . . . . . . . . . . . . . . . . . . . . 460maint dump-me . . . . . . . . . . . . . . . . . . . . . . . . . . . . . . . 460maint info breakpoints . . . . . . . . . . . . . . . . . . . . . 459maint info program-spaces . . . . . . . . . . . . . . . . . . . 34maint info psymtabs . . . . . . . . . . . . . . . . . . . . . . . . . 194maint info sections . . . . . . . . . . . . . . . . . . . . . . . . . 204maint info sol-threads . . . . . . . . . . . . . . . . . . . . . . . 36maint info symtabs . . . . . . . . . . . . . . . . . . . . . . . . . . 194maint internal-error . . . . . . . . . . . . . . . . . . . . . . . 460maint internal-warning . . . . . . . . . . . . . . . . . . . . . 460maint packet . . . . . . . . . . . . . . . . . . . . . . . . . . . . . . . . . 461maint print architecture . . . . . . . . . . . . . . . . . . . 461maint print c-tdesc . . . . . . . . . . . . . . . . . . . . . . . . . 461maint print cooked-registers . . . . . . . . . . . . . . . 461maint print dummy-frames . . . . . . . . . . . . . . . . . . . 461maint print objfiles . . . . . . . . . . . . . . . . . . . . . . . . 462maint print psymbols . . . . . . . . . . . . . . . . . . . . . . . . 193maint print raw-registers . . . . . . . . . . . . . . . . . . 461maint print reggroups . . . . . . . . . . . . . . . . . . . . . . . 462maint print register-groups . . . . . . . . . . . . . . . . 461maint print registers . . . . . . . . . . . . . . . . . . . . . . . 461maint print remote-registers . . . . . . . . . . . . . . . 461maint print section-scripts . . . . . . . . . . . . . . . . 462maint print statistics . . . . . . . . . . . . . . . . . . . . . 462maint print symbols . . . . . . . . . . . . . . . . . . . . . . . . . 193maint print target-stack . . . . . . . . . . . . . . . . . . . 463maint print type . . . . . . . . . . . . . . . . . . . . . . . . . . . . 463maint print unwind, HPPA . . . . . . . . . . . . . . . . . . 262maint set dwarf2 always-disassemble . . . . . . . 463maint set dwarf2 max-cache-age . . . . . . . . . . . . . 463maint set internal-error . . . . . . . . . . . . . . . . . . . 461maint set internal-warning . . . . . . . . . . . . . . . . . 461maint set profile . . . . . . . . . . . . . . . . . . . . . . . . . . . 463maint set show-all-tib . . . . . . . . . . . . . . . . . . . . . 464maint set show-debug-regs . . . . . . . . . . . . . . . . . . 464maint show dwarf2 always-disassemble . . . . . . 463maint show dwarf2 max-cache-age . . . . . . . . . . . 463maint show internal-error . . . . . . . . . . . . . . . . . . 461maint show internal-warning . . . . . . . . . . . . . . . . 461maint show profile . . . . . . . . . . . . . . . . . . . . . . . . . . 463maint show show-all-tib . . . . . . . . . . . . . . . . . . . . 464maint show show-debug-regs . . . . . . . . . . . . . . . . . 464maint space . . . . . . . . . . . . . . . . . . . . . . . . . . . . . . . . . . 464maint time . . . . . . . . . . . . . . . . . . . . . . . . . . . . . . . . . . . 464maint translate-address . . . . . . . . . . . . . . . . . . . . 464maint undeprecate . . . . . . . . . . . . . . . . . . . . . . . . . . . 460maintenance commands . . . . . . . . . . . . . . . . . . . . . . 459make . . . . . . . . . . . . . . . . . . . . . . . . . . . . . . . . . . . . . . . . . . 17manual overlay debugging . . . . . . . . . . . . . . . . . . . . 157map an overlay . . . . . . . . . . . . . . . . . . . . . . . . . . . . . . . 157mapinfo list, QNX Neutrino . . . . . . . . . . . . . . . . . . 237
mapped address . . . . . . . . . . . . . . . . . . . . . . . . . . . . . . 155mapped overlays . . . . . . . . . . . . . . . . . . . . . . . . . . . . . . 155mark-modified-lines . . . . . . . . . . . . . . . . . . . . . . . . 429mark-symlinked-directories . . . . . . . . . . . . . . . . 429markers, static tracepoints . . . . . . . . . . . . . . . . . . . . 139match-hidden-files . . . . . . . . . . . . . . . . . . . . . . . . . 429maximum value for offset of closest symbol . . . . 107may-insert-breakpoints . . . . . . . . . . . . . . . . . . . . . . 73may-insert-fast-tracepoints . . . . . . . . . . . . . . . . 74may-insert-tracepoints . . . . . . . . . . . . . . . . . . . . . . 74may-interrupt . . . . . . . . . . . . . . . . . . . . . . . . . . . . . . . . 74may-write-memory . . . . . . . . . . . . . . . . . . . . . . . . . . . . . 73may-write-registers . . . . . . . . . . . . . . . . . . . . . . . . . 73mem . . . . . . . . . . . . . . . . . . . . . . . . . . . . . . . . . . . . . . . . . . 122member functions . . . . . . . . . . . . . . . . . . . . . . . . . . . . 168memory address space mappings . . . . . . . . . . . . . . 236memory map format . . . . . . . . . . . . . . . . . . . . . . . . . . 521memory region attributes . . . . . . . . . . . . . . . . . . . . . 122memory tracing . . . . . . . . . . . . . . . . . . . . . . . . . . . . . . . 43memory transfer, in file-i/o protocol . . . . . . . . . . 517memory used by commands . . . . . . . . . . . . . . . . . . . 464memory used for symbol tables . . . . . . . . . . . . . . . 205memory, alignment and size of remote accesses
. . . . . . . . . . . . . . . . . . . . . . . . . . . . . . . . . . . . . . . . . 472memory, viewing as typed object . . . . . . . . . . . . . . . 98memset . . . . . . . . . . . . . . . . . . . . . . . . . . . . . . . . . . . . . . . 233menu-complete () . . . . . . . . . . . . . . . . . . . . . . . . . . . . 440menu-complete-backward () . . . . . . . . . . . . . . . . . . 441menu-complete-display-prefix . . . . . . . . . . . . . . 429meta-flag . . . . . . . . . . . . . . . . . . . . . . . . . . . . . . . . . . . . 428mi interpreter . . . . . . . . . . . . . . . . . . . . . . . . . . . . . . . . 327mi1 interpreter . . . . . . . . . . . . . . . . . . . . . . . . . . . . . . . 327mi2 interpreter . . . . . . . . . . . . . . . . . . . . . . . . . . . . . . . 327minimal language . . . . . . . . . . . . . . . . . . . . . . . . . . . . . 188Minimal symbols and DLLs . . . . . . . . . . . . . . . . . . . 240MIPS addresses, masking . . . . . . . . . . . . . . . . . . . . . 261MIPS boards . . . . . . . . . . . . . . . . . . . . . . . . . . . . . . . . . 251MIPS remote floating point . . . . . . . . . . . . . . . . . . . 252MIPS stack . . . . . . . . . . . . . . . . . . . . . . . . . . . . . . . . . . . 260miscellaneous settings . . . . . . . . . . . . . . . . . . . . . . . . 274MMX registers (x86) . . . . . . . . . . . . . . . . . . . . . . . . . 120mode t values, in file-i/o protocol . . . . . . . . . . . . . 518Modula-2 . . . . . . . . . . . . . . . . . . . . . . . . . . . . . . . . . . . . . . . 1Modula-2 built-ins . . . . . . . . . . . . . . . . . . . . . . . . . . . . 175Modula-2 checks . . . . . . . . . . . . . . . . . . . . . . . . . . . . . . 179Modula-2 constants . . . . . . . . . . . . . . . . . . . . . . . . . . . 176Modula-2 defaults . . . . . . . . . . . . . . . . . . . . . . . . . . . . 179Modula-2 operators . . . . . . . . . . . . . . . . . . . . . . . . . . . 174Modula-2 types . . . . . . . . . . . . . . . . . . . . . . . . . . . . . . . 177Modula-2, deviations from . . . . . . . . . . . . . . . . . . . . 179Modula-2, gdb support . . . . . . . . . . . . . . . . . . . . . . . 174monitor . . . . . . . . . . . . . . . . . . . . . . . . . . . . . . . . . . . . . . 220monitor commands, for gdbserver . . . . . . . . . . . . 224Motorola 680x0 . . . . . . . . . . . . . . . . . . . . . . . . . . . . . . . 231MS Windows debugging . . . . . . . . . . . . . . . . . . . . . . 239MS-DOS system info . . . . . . . . . . . . . . . . . . . . . . . . . 237MS-DOS-specific commands . . . . . . . . . . . . . . . . . . 237multiple locations, breakpoints . . . . . . . . . . . . . . . . . 47
584 Debugging with gdb
multiple processes . . . . . . . . . . . . . . . . . . . . . . . . . . . . . 38multiple processes with gdbserver . . . . . . . . . . . . 222multiple targets . . . . . . . . . . . . . . . . . . . . . . . . . . . . . . 215multiple threads . . . . . . . . . . . . . . . . . . . . . . . . . . . . . . . 35multiple threads, backtrace . . . . . . . . . . . . . . . . . . . . 82multiple-symbols menu . . . . . . . . . . . . . . . . . . . . . . . . 98multiprocess extensions, in remote protocol . . . 489
Nn (next) . . . . . . . . . . . . . . . . . . . . . . . . . . . . . . . . . . . . . . . 62n (SingleKey TUI key) . . . . . . . . . . . . . . . . . . . . . . . . 331name a thread . . . . . . . . . . . . . . . . . . . . . . . . . . . . . . . . . 37names of symbols . . . . . . . . . . . . . . . . . . . . . . . . . . . . . 189namespace in C++ . . . . . . . . . . . . . . . . . . . . . . . . . . . . 168native Cygwin debugging . . . . . . . . . . . . . . . . . . . . . 239native djgpp debugging . . . . . . . . . . . . . . . . . . . . . . 237negative breakpoint numbers . . . . . . . . . . . . . . . . . . . 49NetROM ROM emulator target . . . . . . . . . . . . . . . 217New systag message . . . . . . . . . . . . . . . . . . . . . . . . . . . . 35NewObjFileEvent.new_objfile . . . . . . . . . . . . . . . 301next . . . . . . . . . . . . . . . . . . . . . . . . . . . . . . . . . . . . . . . . . . 62next& . . . . . . . . . . . . . . . . . . . . . . . . . . . . . . . . . . . . . . . . . 71next-history (C-n) . . . . . . . . . . . . . . . . . . . . . . . . . . 437nexti . . . . . . . . . . . . . . . . . . . . . . . . . . . . . . . . . . . . . . . . . 64nexti& . . . . . . . . . . . . . . . . . . . . . . . . . . . . . . . . . . . . . . . . 71ni (nexti) . . . . . . . . . . . . . . . . . . . . . . . . . . . . . . . . . . . . . 64non-incremental-forward-search-history (M-n)
. . . . . . . . . . . . . . . . . . . . . . . . . . . . . . . . . . . . . . . . . 437non-incremental-reverse-search-history (M-p)
. . . . . . . . . . . . . . . . . . . . . . . . . . . . . . . . . . . . . . . . . 437non-member C++ functions, set breakpoint in . . 45non-stop mode . . . . . . . . . . . . . . . . . . . . . . . . . . . . . . . . 69non-stop mode, and breakpoint always-inserted
. . . . . . . . . . . . . . . . . . . . . . . . . . . . . . . . . . . . . . . . . . . 49non-stop mode, and process record and replay . . 77non-stop mode, and ‘set displaced-stepping’
. . . . . . . . . . . . . . . . . . . . . . . . . . . . . . . . . . . . . . . . . 460non-stop mode, remote request . . . . . . . . . . . . . . . 483noninvasive task options . . . . . . . . . . . . . . . . . . . . . . 243nosharedlibrary . . . . . . . . . . . . . . . . . . . . . . . . . . . . . 206notation, readline . . . . . . . . . . . . . . . . . . . . . . . . . . . . . 423notational conventions, for gdb/mi . . . . . . . . . . . 337notification packets . . . . . . . . . . . . . . . . . . . . . . . . . . . 505notify output in gdb/mi . . . . . . . . . . . . . . . . . . . . . . 342null elements in arrays . . . . . . . . . . . . . . . . . . . . . . 111number of array elements to print . . . . . . . . . . . . . 108number representation . . . . . . . . . . . . . . . . . . . . . . . . 268numbers for breakpoints . . . . . . . . . . . . . . . . . . . . . . . 43
Oobject files, relocatable, reading symbols from
. . . . . . . . . . . . . . . . . . . . . . . . . . . . . . . . . . . . . . . . . 203Objective-C . . . . . . . . . . . . . . . . . . . . . . . . . . . . . . . . . . 171Objective-C, classes and selectors . . . . . . . . . . . . . 192Objective-C, print objects . . . . . . . . . . . . . . . . . . . . 172Objfile . . . . . . . . . . . . . . . . . . . . . . . . . . . . . . . . . . . . . . 309
‘objfile-gdb.py’ . . . . . . . . . . . . . . . . . . . . . . . . . . . . . 322Objfile.filename . . . . . . . . . . . . . . . . . . . . . . . . . . . . 309Objfile.is_valid . . . . . . . . . . . . . . . . . . . . . . . . . . . . 309Objfile.pretty_printers . . . . . . . . . . . . . . . . . . . 309objfiles in python . . . . . . . . . . . . . . . . . . . . . . . . . . . . . 309observer . . . . . . . . . . . . . . . . . . . . . . . . . . . . . . . . . . . . . . 73observer debugging info . . . . . . . . . . . . . . . . . . . . . . . 273octal escapes in strings . . . . . . . . . . . . . . . . . . . . . . . 111online documentation . . . . . . . . . . . . . . . . . . . . . . . . . . 21opaque data types . . . . . . . . . . . . . . . . . . . . . . . . . . . . 193open flags, in file-i/o protocol . . . . . . . . . . . . . . . . . 518open, file-i/o system call . . . . . . . . . . . . . . . . . . . . . . 511OpenCL C . . . . . . . . . . . . . . . . . . . . . . . . . . . . . . . . . . . 172OpenCL C Datatypes . . . . . . . . . . . . . . . . . . . . . . . . 172OpenCL C Expressions . . . . . . . . . . . . . . . . . . . . . . . 173OpenCL C Operators . . . . . . . . . . . . . . . . . . . . . . . . . 173OpenRISC 1000 . . . . . . . . . . . . . . . . . . . . . . . . . . . . . . 253OpenRISC 1000 htrace . . . . . . . . . . . . . . . . . . . . . . . 254operating system information . . . . . . . . . . . . . . . . . 545operating system information, process list . . . . . 545optimized code, debugging . . . . . . . . . . . . . . . . . . . . 131optimized code, wrong values of variables . . . . . 100optimized out value in Python . . . . . . . . . . . . . . . . 287optimized out, in backtrace . . . . . . . . . . . . . . . . . . . . 83optional debugging messages . . . . . . . . . . . . . . . . . . 271optional warnings . . . . . . . . . . . . . . . . . . . . . . . . . . . . 270or1k boards . . . . . . . . . . . . . . . . . . . . . . . . . . . . . . . . . . 253or1ksim . . . . . . . . . . . . . . . . . . . . . . . . . . . . . . . . . . . . . . 253OS ABI . . . . . . . . . . . . . . . . . . . . . . . . . . . . . . . . . . . . . . 269OS information . . . . . . . . . . . . . . . . . . . . . . . . . . . . . . . 121out-of-line single-stepping . . . . . . . . . . . . . . . . . . . . . 459outermost frame . . . . . . . . . . . . . . . . . . . . . . . . . . . . . . . 81output . . . . . . . . . . . . . . . . . . . . . . . . . . . . . . . . . . . . . . . 280output formats . . . . . . . . . . . . . . . . . . . . . . . . . . . . . . . 102output syntax of gdb/mi . . . . . . . . . . . . . . . . . . . . . 341output-meta . . . . . . . . . . . . . . . . . . . . . . . . . . . . . . . . . 429overlay . . . . . . . . . . . . . . . . . . . . . . . . . . . . . . . . . . . . . . 157overlay area . . . . . . . . . . . . . . . . . . . . . . . . . . . . . . . . . . 155overlay example program . . . . . . . . . . . . . . . . . . . . . 159overlays . . . . . . . . . . . . . . . . . . . . . . . . . . . . . . . . . . . . . . 155overlays, setting breakpoints in . . . . . . . . . . . . . . . 158overload-choice annotation . . . . . . . . . . . . . . . . 412overloaded functions, calling . . . . . . . . . . . . . . . . . . 168overloaded functions, overload resolution . . . . . . 170overloading in C++ . . . . . . . . . . . . . . . . . . . . . . . . . . . 170overwrite-mode () . . . . . . . . . . . . . . . . . . . . . . . . . . . 439
P‘p’ packet . . . . . . . . . . . . . . . . . . . . . . . . . . . . . . . . . . . . 472‘P’ packet . . . . . . . . . . . . . . . . . . . . . . . . . . . . . . . . . . . . 472packet acknowledgment, for gdb remote . . . . . . 507packet size, remote protocol . . . . . . . . . . . . . . . . . . 488packets, notification . . . . . . . . . . . . . . . . . . . . . . . . . . 505packets, reporting on stdout . . . . . . . . . . . . . . . . . . 273packets, tracepoint . . . . . . . . . . . . . . . . . . . . . . . . . . . 496page tables display (MS-DOS) . . . . . . . . . . . . . . . . 237page-completions . . . . . . . . . . . . . . . . . . . . . . . . . . . . 429
Index 585
PARAM_AUTO_BOOLEAN . . . . . . . . . . . . . . . . . . . . . . . . . 307PARAM_BOOLEAN . . . . . . . . . . . . . . . . . . . . . . . . . . . . . . . 307PARAM_ENUM . . . . . . . . . . . . . . . . . . . . . . . . . . . . . . . . . . 307PARAM_FILENAME . . . . . . . . . . . . . . . . . . . . . . . . . . . . . . 307PARAM_INTEGER . . . . . . . . . . . . . . . . . . . . . . . . . . . . . . . 307PARAM_OPTIONAL_FILENAME . . . . . . . . . . . . . . . . . . . 307PARAM_STRING . . . . . . . . . . . . . . . . . . . . . . . . . . . . . . . . 307PARAM_STRING_NOESCAPE . . . . . . . . . . . . . . . . . . . . . . 307PARAM_UINTEGER . . . . . . . . . . . . . . . . . . . . . . . . . . . . . . 307PARAM_ZINTEGER . . . . . . . . . . . . . . . . . . . . . . . . . . . . . . 307Parameter . . . . . . . . . . . . . . . . . . . . . . . . . . . . . . . . . . . . 305Parameter.__init__ . . . . . . . . . . . . . . . . . . . . . . . . . 305Parameter.get_set_string . . . . . . . . . . . . . . . . . . 306Parameter.get_show_string . . . . . . . . . . . . . . . . . 306Parameter.set_doc . . . . . . . . . . . . . . . . . . . . . . . . . . 306Parameter.show_doc . . . . . . . . . . . . . . . . . . . . . . . . . 306Parameter.value . . . . . . . . . . . . . . . . . . . . . . . . . . . . . 306parameters in python . . . . . . . . . . . . . . . . . . . . . . . . . 305partial symbol dump . . . . . . . . . . . . . . . . . . . . . . . . . 193partial symbol tables, listing gdb’s internal . . . 194Pascal . . . . . . . . . . . . . . . . . . . . . . . . . . . . . . . . . . . . . . . . . . 1Pascal objects, static members display . . . . . . . . 113Pascal support in gdb, limitations . . . . . . . . . . . . 174pass signals to inferior, remote request . . . . . . . . 483passcount . . . . . . . . . . . . . . . . . . . . . . . . . . . . . . . . . . . . 143patching binaries . . . . . . . . . . . . . . . . . . . . . . . . . . . . . 199patching object files . . . . . . . . . . . . . . . . . . . . . . . . . . 201path . . . . . . . . . . . . . . . . . . . . . . . . . . . . . . . . . . . . . . . . . . 29pause current task (gnu Hurd) . . . . . . . . . . . . . . . 243pause current thread (gnu Hurd) . . . . . . . . . . . . . 243pauses in output . . . . . . . . . . . . . . . . . . . . . . . . . . . . . . 267pending breakpoints . . . . . . . . . . . . . . . . . . . . . . . . . . . 47PgDn . . . . . . . . . . . . . . . . . . . . . . . . . . . . . . . . . . . . . . . . . 330PgUp . . . . . . . . . . . . . . . . . . . . . . . . . . . . . . . . . . . . . . . . . 330physical address from linear address . . . . . . . . . . 238physname . . . . . . . . . . . . . . . . . . . . . . . . . . . . . . . . . . . . 271pipe, target remote to . . . . . . . . . . . . . . . . . . . . . . . 220pipes . . . . . . . . . . . . . . . . . . . . . . . . . . . . . . . . . . . . . . . . . . 26pmon, MIPS remote . . . . . . . . . . . . . . . . . . . . . . . . . . . 253po (print-object) . . . . . . . . . . . . . . . . . . . . . . . . . . . 172pointer values, in file-i/o protocol . . . . . . . . . . . . . 516pointer, finding referent . . . . . . . . . . . . . . . . . . . . . . . 107port rights, gnu Hurd . . . . . . . . . . . . . . . . . . . . . . . . 243port sets, gnu Hurd . . . . . . . . . . . . . . . . . . . . . . . . . . 243possible-completions (M-?) . . . . . . . . . . . . . . . . 440post-commands annotation . . . . . . . . . . . . . . . . . . . 412post-overload-choice annotation . . . . . . . . . . . 412post-prompt annotation . . . . . . . . . . . . . . . . . . . . . 412post-prompt-for-continue annotation . . . . . . 412post-query annotation . . . . . . . . . . . . . . . . . . . . . . 412PowerPC architecture . . . . . . . . . . . . . . . . . . . . . . . . 263pre-commands annotation . . . . . . . . . . . . . . . . . . . . 412pre-overload-choice annotation . . . . . . . . . . . . 412pre-prompt annotation . . . . . . . . . . . . . . . . . . . . . . 412pre-prompt-for-continue annotation . . . . . . . 412pre-query annotation . . . . . . . . . . . . . . . . . . . . . . . 412prefix for data files . . . . . . . . . . . . . . . . . . . . . . . . . . . 214prefix for shared library file names . . . . . . . . . . . . 207
prefix-meta (ESC) . . . . . . . . . . . . . . . . . . . . . . . . . . . 441premature return from system calls . . . . . . . . . . . . 72preprocessor macro expansion, showing the results
of . . . . . . . . . . . . . . . . . . . . . . . . . . . . . . . . . . . . . . . . 135pretty print arrays . . . . . . . . . . . . . . . . . . . . . . . . . . . . 108pretty print C++ virtual function tables . . . . . . . 114pretty-printer commands . . . . . . . . . . . . . . . . . . . . . 115pretty_printer.children . . . . . . . . . . . . . . . . . . . 294pretty_printer.display_hint . . . . . . . . . . . . . . . 294pretty_printer.to_string . . . . . . . . . . . . . . . . . . 294previous-history (C-p) . . . . . . . . . . . . . . . . . . . . . 436print . . . . . . . . . . . . . . . . . . . . . . . . . . . . . . . . . . . . . . . . . 97print all frame argument values . . . . . . . . . . . . . . . 108print an Objective-C object description . . . . . . . 172print array indexes . . . . . . . . . . . . . . . . . . . . . . . . . . . 108print frame argument values for scalars only . . 108print list of auto-loaded scripts . . . . . . . . . . . . . . . 321print messages on inferior start and exit . . . . . . . . 34print messages on thread start and exit . . . . . . . . 37print settings . . . . . . . . . . . . . . . . . . . . . . . . . . . . . . . . . 106print structures in indented form . . . . . . . . . . . . . 111print-object . . . . . . . . . . . . . . . . . . . . . . . . . . . . . . . . 172print/don’t print memory addresses . . . . . . . . . . . 106printf . . . . . . . . . . . . . . . . . . . . . . . . . . . . . . . . . . . . . . . 280printing byte arrays . . . . . . . . . . . . . . . . . . . . . . . . . . 102printing data . . . . . . . . . . . . . . . . . . . . . . . . . . . . . . . . . . 97printing frame argument values . . . . . . . . . . . . . . . 108printing strings . . . . . . . . . . . . . . . . . . . . . . . . . . . . . . . 102probe static tracepoint marker . . . . . . . . . . . . . . . . 141probing markers, static tracepoints . . . . . . . . . . . 139proc-trace-entry . . . . . . . . . . . . . . . . . . . . . . . . . . . . 236proc-trace-exit . . . . . . . . . . . . . . . . . . . . . . . . . . . . . 236proc-untrace-entry . . . . . . . . . . . . . . . . . . . . . . . . . 236proc-untrace-exit . . . . . . . . . . . . . . . . . . . . . . . . . . 236process detailed status information . . . . . . . . . . . 236process ID . . . . . . . . . . . . . . . . . . . . . . . . . . . . . . . . . . . . 235process info via ‘/proc’ . . . . . . . . . . . . . . . . . . . . . . . 235process list, QNX Neutrino . . . . . . . . . . . . . . . . . . . 236process record and replay . . . . . . . . . . . . . . . . . . . . . . 77process status register . . . . . . . . . . . . . . . . . . . . . . . . 119processes, multiple . . . . . . . . . . . . . . . . . . . . . . . . . . . . . 38procfs API calls . . . . . . . . . . . . . . . . . . . . . . . . . . . . . 236profiling GDB . . . . . . . . . . . . . . . . . . . . . . . . . . . . . . . . 463program counter register . . . . . . . . . . . . . . . . . . . . . . 119program entry point . . . . . . . . . . . . . . . . . . . . . . . . . . . 83programming in python . . . . . . . . . . . . . . . . . . . . . . . 282Progspace . . . . . . . . . . . . . . . . . . . . . . . . . . . . . . . . . . . . 308Progspace.filename . . . . . . . . . . . . . . . . . . . . . . . . . 308Progspace.pretty_printers . . . . . . . . . . . . . . . . . 309progspaces in python . . . . . . . . . . . . . . . . . . . . . . . . . 308prompt . . . . . . . . . . . . . . . . . . . . . . . . . . . . . . . . . . . . . . . 265prompt annotation . . . . . . . . . . . . . . . . . . . . . . . . . . . 412prompt-for-continue annotation . . . . . . . . . . . . 412protocol basics, file-i/o . . . . . . . . . . . . . . . . . . . . . . . 509protocol, gdb remote serial . . . . . . . . . . . . . . . . . . . 467protocol-specific representation of datatypes, in
file-i/o protocol . . . . . . . . . . . . . . . . . . . . . . . . . . 516ptrace system call . . . . . . . . . . . . . . . . . . . . . . . . . . . 121
586 Debugging with gdb
ptype . . . . . . . . . . . . . . . . . . . . . . . . . . . . . . . . . . . . . . . . 190putDebugChar . . . . . . . . . . . . . . . . . . . . . . . . . . . . . . . . 232pwd . . . . . . . . . . . . . . . . . . . . . . . . . . . . . . . . . . . . . . . . . . . . 30python . . . . . . . . . . . . . . . . . . . . . . . . . . . . . . . . . . . . . . . 281python api . . . . . . . . . . . . . . . . . . . . . . . . . . . . . . . . . . . 282python commands . . . . . . . . . . . . . . . . . . . . . . . 281, 302python convenience functions . . . . . . . . . . . . . . . . . 307python directory . . . . . . . . . . . . . . . . . . . . . . . . . . . . . 281python exceptions . . . . . . . . . . . . . . . . . . . . . . . . . . . . 285python finish breakpoints . . . . . . . . . . . . . . . . . . . . . 320python functions . . . . . . . . . . . . . . . . . . . . . . . . . . . . . 282python module . . . . . . . . . . . . . . . . . . . . . . . . . . . . . . . 282python modules . . . . . . . . . . . . . . . . . . . . . . . . . . . . . . 323python pagination . . . . . . . . . . . . . . . . . . . . . . . . . . . . 282python parameters . . . . . . . . . . . . . . . . . . . . . . . . . . . 305python scripting . . . . . . . . . . . . . . . . . . . . . . . . . . . . . . 281python stdout . . . . . . . . . . . . . . . . . . . . . . . . . . . . . . . . 282Python, working with types . . . . . . . . . . . . . . . . . . 290python, working with values from inferior . . . . . 286
Qq (quit) . . . . . . . . . . . . . . . . . . . . . . . . . . . . . . . . . . . . . . . 16q (SingleKey TUI key) . . . . . . . . . . . . . . . . . . . . . . . . 331‘q’ packet . . . . . . . . . . . . . . . . . . . . . . . . . . . . . . . . . . . . 472‘Q’ packet . . . . . . . . . . . . . . . . . . . . . . . . . . . . . . . . . . . . 472‘QAllow’ packet . . . . . . . . . . . . . . . . . . . . . . . . . . . . . . . 480‘qAttached’ packet . . . . . . . . . . . . . . . . . . . . . . . . . . . 495‘qC’ packet . . . . . . . . . . . . . . . . . . . . . . . . . . . . . . . . . . . 480‘qCRC’ packet . . . . . . . . . . . . . . . . . . . . . . . . . . . . . . . . . 480‘QDisableRandomization’ packet . . . . . . . . . . . . . 481‘qfThreadInfo’ packet . . . . . . . . . . . . . . . . . . . . . . . . 481‘qGetTIBAddr’ packet . . . . . . . . . . . . . . . . . . . . . . . . . 482‘qGetTLSAddr’ packet . . . . . . . . . . . . . . . . . . . . . . . . . 481‘QNonStop’ packet . . . . . . . . . . . . . . . . . . . . . . . . . . . . 483QNX Neutrino . . . . . . . . . . . . . . . . . . . . . . . . . . . . . . . 244‘qOffsets’ packet . . . . . . . . . . . . . . . . . . . . . . . . . . . . 482‘qP’ packet . . . . . . . . . . . . . . . . . . . . . . . . . . . . . . . . . . . 483‘QPassSignals’ packet . . . . . . . . . . . . . . . . . . . . . . . . 483‘qRcmd’ packet . . . . . . . . . . . . . . . . . . . . . . . . . . . . . . . . 484‘qSearch:memory’ packet . . . . . . . . . . . . . . . . . . . . . . 484‘QStartNoAckMode’ packet . . . . . . . . . . . . . . . . . . . . 484‘qsThreadInfo’ packet . . . . . . . . . . . . . . . . . . . . . . . . 481‘qSupported’ packet . . . . . . . . . . . . . . . . . . . . . . . . . . 485‘qSymbol’ packet . . . . . . . . . . . . . . . . . . . . . . . . . . . . . . 490‘QTDPsrc’ packet . . . . . . . . . . . . . . . . . . . . . . . . . . . . . . 497‘QTDV’ packet . . . . . . . . . . . . . . . . . . . . . . . . . . . . . . . . . 498‘qThreadExtraInfo’ packet . . . . . . . . . . . . . . . . . . . 491‘qTP’ packet . . . . . . . . . . . . . . . . . . . . . . . . . . . . . . . . . . 501‘qTV’ packet . . . . . . . . . . . . . . . . . . . . . . . . . . . . . . . . . . 501query annotation . . . . . . . . . . . . . . . . . . . . . . . . . . . . 412query attached, remote request . . . . . . . . . . . . . . . 495quit [expression ] . . . . . . . . . . . . . . . . . . . . . . . . . . . . . 16quit annotation . . . . . . . . . . . . . . . . . . . . . . . . . . . . . 413quoted-insert (C-q or C-v) . . . . . . . . . . . . . . . . . 438quotes in commands . . . . . . . . . . . . . . . . . . . . . . . . . . . 20quoting Ada internal identifiers . . . . . . . . . . . . . . . 183quoting names . . . . . . . . . . . . . . . . . . . . . . . . . . . . . . . . 189
‘qXfer’ packet . . . . . . . . . . . . . . . . . . . . . . . . . . . . . . . . 491
Rr (run) . . . . . . . . . . . . . . . . . . . . . . . . . . . . . . . . . . . . . . . . 26r (SingleKey TUI key) . . . . . . . . . . . . . . . . . . . . . . . . 331‘r’ packet . . . . . . . . . . . . . . . . . . . . . . . . . . . . . . . . . . . . 472‘R’ packet . . . . . . . . . . . . . . . . . . . . . . . . . . . . . . . . . . . . 472raise exceptions . . . . . . . . . . . . . . . . . . . . . . . . . . . . . . . . 55range checking . . . . . . . . . . . . . . . . . . . . . . . . . . . . . . . 164ranged breakpoint . . . . . . . . . . . . . . . . . . . . . . . . . . . . 255ranges of breakpoints . . . . . . . . . . . . . . . . . . . . . . . . . . 43Ravenscar Profile . . . . . . . . . . . . . . . . . . . . . . . . . . . . . 187raw printing . . . . . . . . . . . . . . . . . . . . . . . . . . . . . . . . . . 102rbreak . . . . . . . . . . . . . . . . . . . . . . . . . . . . . . . . . . . . . . . . 45rc (reverse-continue) . . . . . . . . . . . . . . . . . . . . . . . . 75RDI heartbeat . . . . . . . . . . . . . . . . . . . . . . . . . . . . . . . . 249rdilogenable . . . . . . . . . . . . . . . . . . . . . . . . . . . . . . . . 249rdilogfile . . . . . . . . . . . . . . . . . . . . . . . . . . . . . . . . . . 248re-read-init-file (C-x C-r) . . . . . . . . . . . . . . . . 441read special object, remote request . . . . . . . . . . . . 491read, file-i/o system call . . . . . . . . . . . . . . . . . . . . . . 512read-only sections . . . . . . . . . . . . . . . . . . . . . . . . . . . . 205reading symbols from relocatable object files . . 203reading symbols immediately . . . . . . . . . . . . . . . . . 202readline . . . . . . . . . . . . . . . . . . . . . . . . . . . . . . . . . . . . . . 265readnow . . . . . . . . . . . . . . . . . . . . . . . . . . . . . . . . . . . . . . 202rec . . . . . . . . . . . . . . . . . . . . . . . . . . . . . . . . . . . . . . . . . . . . 77rec del . . . . . . . . . . . . . . . . . . . . . . . . . . . . . . . . . . . . . . . 79rec s . . . . . . . . . . . . . . . . . . . . . . . . . . . . . . . . . . . . . . . . . . 77receive rights, gnu Hurd . . . . . . . . . . . . . . . . . . . . . . 243recent tracepoint number . . . . . . . . . . . . . . . . . . . . . 142record . . . . . . . . . . . . . . . . . . . . . . . . . . . . . . . . . . . . . . . . 77record aggregates (Ada) . . . . . . . . . . . . . . . . . . . . . . 181record delete . . . . . . . . . . . . . . . . . . . . . . . . . . . . . . . . . 79record mode . . . . . . . . . . . . . . . . . . . . . . . . . . . . . . . . . . . 77record restore . . . . . . . . . . . . . . . . . . . . . . . . . . . . . . . 78record save . . . . . . . . . . . . . . . . . . . . . . . . . . . . . . . . . . . 78record serial communications on file . . . . . . . . . . . 226record stop . . . . . . . . . . . . . . . . . . . . . . . . . . . . . . . . . . . 77recording a session script . . . . . . . . . . . . . . . . . . . . . 420recording inferior’s execution and replaying it . . 77redirection . . . . . . . . . . . . . . . . . . . . . . . . . . . . . . . . . . . . . 30redraw-current-line () . . . . . . . . . . . . . . . . . . . . . 436reference card . . . . . . . . . . . . . . . . . . . . . . . . . . . . . . . . 451reference declarations . . . . . . . . . . . . . . . . . . . . . . . . . 169refresh . . . . . . . . . . . . . . . . . . . . . . . . . . . . . . . . . . . . . . 332register stack, AMD29K . . . . . . . . . . . . . . . . . . . . . . 260registers . . . . . . . . . . . . . . . . . . . . . . . . . . . . . . . . . . . . . . 119regs, Super-H . . . . . . . . . . . . . . . . . . . . . . . . . . . . . . . . 259regular expression . . . . . . . . . . . . . . . . . . . . . . . . . . . . . 45reloading symbols . . . . . . . . . . . . . . . . . . . . . . . . . . . . 193reloading the overlay table . . . . . . . . . . . . . . . . . . . . 157relocatable object files, reading symbols from . . 203remote connection without stubs . . . . . . . . . . . . . . 221remote debugging . . . . . . . . . . . . . . . . . . . . . . . . . . . . 219remote delete . . . . . . . . . . . . . . . . . . . . . . . . . . . . . . . 221remote get . . . . . . . . . . . . . . . . . . . . . . . . . . . . . . . . . . . 221
Index 587
remote memory comparison . . . . . . . . . . . . . . . . . . . 104remote monitor prompt . . . . . . . . . . . . . . . . . . . . . . . 253remote packets, enabling and disabling . . . . . . . . 228remote programs, interrupting . . . . . . . . . . . . . . . . 220remote protocol debugging . . . . . . . . . . . . . . . . . . . . 273remote protocol, binary data . . . . . . . . . . . . . . . . . . 467remote protocol, field separator . . . . . . . . . . . . . . . 467remote put . . . . . . . . . . . . . . . . . . . . . . . . . . . . . . . . . . . 221remote query requests . . . . . . . . . . . . . . . . . . . . . . . . 479remote serial debugging summary . . . . . . . . . . . . . 233remote serial debugging, overview . . . . . . . . . . . . . 230remote serial protocol . . . . . . . . . . . . . . . . . . . . . . . . 467remote serial stub . . . . . . . . . . . . . . . . . . . . . . . . . . . . 231remote serial stub list . . . . . . . . . . . . . . . . . . . . . . . . 231remote serial stub, initialization . . . . . . . . . . . . . . . 231remote serial stub, main routine . . . . . . . . . . . . . . 231remote stub, example . . . . . . . . . . . . . . . . . . . . . . . . . 230remote stub, support routines . . . . . . . . . . . . . . . . . 232remote target . . . . . . . . . . . . . . . . . . . . . . . . . . . . . . . . . 216remote target, file transfer . . . . . . . . . . . . . . . . . . . . 221remote target, limit break- and watchpoints . . . 227remote target, limit watchpoints length . . . . . . . 227remote timeout . . . . . . . . . . . . . . . . . . . . . . . . . . . . . . . 227remotetimeout . . . . . . . . . . . . . . . . . . . . . . . . . . . . . . . 257remove actions from a tracepoint . . . . . . . . . . . . . 144remove-inferiors . . . . . . . . . . . . . . . . . . . . . . . . . . . . . 33rename, file-i/o system call . . . . . . . . . . . . . . . . . . . 513Renesas . . . . . . . . . . . . . . . . . . . . . . . . . . . . . . . . . . . . . . 231repeated array elements . . . . . . . . . . . . . . . . . . . . . . 111repeating command sequences . . . . . . . . . . . . . . . . . 19repeating commands . . . . . . . . . . . . . . . . . . . . . . . . . . . 19replay log events, remote reply . . . . . . . . . . . . . . . . 478replay mode . . . . . . . . . . . . . . . . . . . . . . . . . . . . . . . . . . . 77reporting bugs in gdb . . . . . . . . . . . . . . . . . . . . . . . . 419reprint the last value . . . . . . . . . . . . . . . . . . . . . . . . . . 97reset SDI connection, M32R . . . . . . . . . . . . . . . . . . 250response time, MIPS debugging . . . . . . . . . . . . . . . 260restart . . . . . . . . . . . . . . . . . . . . . . . . . . . . . . . . . . . . . . . . . 40restart checkpoint-id . . . . . . . . . . . . . . . . . . . . . . . 41restore . . . . . . . . . . . . . . . . . . . . . . . . . . . . . . . . . . . . . . 124restore data from a file . . . . . . . . . . . . . . . . . . . . . . . 124result records in gdb/mi . . . . . . . . . . . . . . . . . . . . . . 343resume threads of multiple processes
simultaneously . . . . . . . . . . . . . . . . . . . . . . . . . . . . 69resuming execution . . . . . . . . . . . . . . . . . . . . . . . . . . . . 61RET (repeat last command) . . . . . . . . . . . . . . . . . . . . 19retransmit-timeout, MIPS protocol . . . . . . . . . 252return . . . . . . . . . . . . . . . . . . . . . . . . . . . . . . . . . . . . . . . 197returning from a function . . . . . . . . . . . . . . . . . . . . . 197reverse execution . . . . . . . . . . . . . . . . . . . . . . . . . . . . . . 75reverse-continue . . . . . . . . . . . . . . . . . . . . . . . . . . . . . 75reverse-finish . . . . . . . . . . . . . . . . . . . . . . . . . . . . . . . 76reverse-next . . . . . . . . . . . . . . . . . . . . . . . . . . . . . . . . . 76reverse-nexti . . . . . . . . . . . . . . . . . . . . . . . . . . . . . . . . 76reverse-search . . . . . . . . . . . . . . . . . . . . . . . . . . . . . . . 90reverse-search-history (C-r) . . . . . . . . . . . . . . 437reverse-step . . . . . . . . . . . . . . . . . . . . . . . . . . . . . . . . . 75reverse-stepi . . . . . . . . . . . . . . . . . . . . . . . . . . . . . . . . 75
revert-all-at-newline . . . . . . . . . . . . . . . . . . . . . . 430revert-line (M-r) . . . . . . . . . . . . . . . . . . . . . . . . . . . 441rewind program state . . . . . . . . . . . . . . . . . . . . . . . . . . 40Right . . . . . . . . . . . . . . . . . . . . . . . . . . . . . . . . . . . . . . . . 331rn (reverse-next) . . . . . . . . . . . . . . . . . . . . . . . . . . . . 76rni (reverse-nexti) . . . . . . . . . . . . . . . . . . . . . . . . . . 76ROM at zero address, RDI . . . . . . . . . . . . . . . . . . . 249rs (step) . . . . . . . . . . . . . . . . . . . . . . . . . . . . . . . . . . . . . . 75rsi (reverse-stepi) . . . . . . . . . . . . . . . . . . . . . . . . . . 75run . . . . . . . . . . . . . . . . . . . . . . . . . . . . . . . . . . . . . . . . . . . . 26run to main procedure . . . . . . . . . . . . . . . . . . . . . . . . . 27run until specified location . . . . . . . . . . . . . . . . . . . . . 63run& . . . . . . . . . . . . . . . . . . . . . . . . . . . . . . . . . . . . . . . . . . 71running . . . . . . . . . . . . . . . . . . . . . . . . . . . . . . . . . . . . . . . 26running and debugging Sparclet programs . . . . . 258running programs backward . . . . . . . . . . . . . . . . . . . 75running VxWorks tasks . . . . . . . . . . . . . . . . . . . . . . . 247running, on Sparclet . . . . . . . . . . . . . . . . . . . . . . . . . . 257rwatch . . . . . . . . . . . . . . . . . . . . . . . . . . . . . . . . . . . . . . . . 50
Ss (SingleKey TUI key) . . . . . . . . . . . . . . . . . . . . . . . . 331s (step) . . . . . . . . . . . . . . . . . . . . . . . . . . . . . . . . . . . . . . . 62‘s’ packet . . . . . . . . . . . . . . . . . . . . . . . . . . . . . . . . . . . . 473‘S’ packet . . . . . . . . . . . . . . . . . . . . . . . . . . . . . . . . . . . . 473save breakpoints . . . . . . . . . . . . . . . . . . . . . . . . . . . . . 60save breakpoints to a file for future sessions . . . . 60save command history . . . . . . . . . . . . . . . . . . . . . . . . 266save gdb output to a file . . . . . . . . . . . . . . . . . . . . . . . 17save gdb-index . . . . . . . . . . . . . . . . . . . . . . . . . . . . . . 213save tracepoints . . . . . . . . . . . . . . . . . . . . . . . . . . . . 153save tracepoints for future sessions . . . . . . . . . . . . 153save-tracepoints . . . . . . . . . . . . . . . . . . . . . . . . . . . . 153scheduler locking mode . . . . . . . . . . . . . . . . . . . . . . . . 69scope . . . . . . . . . . . . . . . . . . . . . . . . . . . . . . . . . . . . . . . . . 179scripting commands . . . . . . . . . . . . . . . . . . . . . . . . . . 278scripting with python . . . . . . . . . . . . . . . . . . . . . . . . . 281sdireset . . . . . . . . . . . . . . . . . . . . . . . . . . . . . . . . . . . . . 250sdistatus . . . . . . . . . . . . . . . . . . . . . . . . . . . . . . . . . . . . 250SDS protocol . . . . . . . . . . . . . . . . . . . . . . . . . . . . . . . . . 256sds, a command . . . . . . . . . . . . . . . . . . . . . . . . . . . . . . 256search . . . . . . . . . . . . . . . . . . . . . . . . . . . . . . . . . . . . . . . . 90search for a thread . . . . . . . . . . . . . . . . . . . . . . . . . . . . . 37search path for libthread_db . . . . . . . . . . . . . . . . . . 37searching memory . . . . . . . . . . . . . . . . . . . . . . . . . . . . 128searching memory, in remote debugging . . . . . . . 484searching source files . . . . . . . . . . . . . . . . . . . . . . . . . . . 90section . . . . . . . . . . . . . . . . . . . . . . . . . . . . . . . . . . . . . . 203section offsets, remote request . . . . . . . . . . . . . . . . 482segment descriptor tables . . . . . . . . . . . . . . . . . . . . . 237select Ctrl-C, BREAK or BREAK-g . . . . . . . . . . 227select trace snapshot . . . . . . . . . . . . . . . . . . . . . . . . . . 150select-frame . . . . . . . . . . . . . . . . . . . . . . . . . . . . . . . . . 82selected frame . . . . . . . . . . . . . . . . . . . . . . . . . . . . . . . . . 81selecting frame silently . . . . . . . . . . . . . . . . . . . . . . . . . 82self-insert (a, b, A, 1, !, ...) . . . . . . . . . . . . 438send command to remote monitor . . . . . . . . . . . . . 220
588 Debugging with gdb
send command to simulator . . . . . . . . . . . . . . . . . . . 247send interrupt-sequence on start . . . . . . . . . . . . . . 227send PMON command . . . . . . . . . . . . . . . . . . . . . . . . 253send rights, gnu Hurd . . . . . . . . . . . . . . . . . . . . . . . . 243sending files to remote systems . . . . . . . . . . . . . . . 221separate debugging information files . . . . . . . . . . 209sequence-id, for gdb remote . . . . . . . . . . . . . . . . . . 467serial connections, debugging . . . . . . . . . . . . . . . . . 273serial line, target remote . . . . . . . . . . . . . . . . . . . . . 219serial protocol, gdb remote . . . . . . . . . . . . . . . . . . . 467server prefix . . . . . . . . . . . . . . . . . . . . . . . . . . . . . . . . . . 412server, command prefix . . . . . . . . . . . . . . . . . . . . . . 266set . . . . . . . . . . . . . . . . . . . . . . . . . . . . . . . . . . . . . . . . . . . . 23set ABI for MIPS . . . . . . . . . . . . . . . . . . . . . . . . . . . . 261set ada trust-PAD-over-XVS . . . . . . . . . . . . . . . . . 187set annotate . . . . . . . . . . . . . . . . . . . . . . . . . . . . . . . . . 411set architecture . . . . . . . . . . . . . . . . . . . . . . . . . . . . 215set args . . . . . . . . . . . . . . . . . . . . . . . . . . . . . . . . . . . . . . 29set arm . . . . . . . . . . . . . . . . . . . . . . . . . . . . . . . . . . . . . . 247set auto-load-scripts . . . . . . . . . . . . . . . . . . . . . . 321set auto-solib-add . . . . . . . . . . . . . . . . . . . . . . . . . . 205set backtrace . . . . . . . . . . . . . . . . . . . . . . . . . . . . . . . . . 83set basenames-may-differ . . . . . . . . . . . . . . . . . . . 209set board-address . . . . . . . . . . . . . . . . . . . . . . . . . . . 250set breakpoint always-inserted . . . . . . . . . . . . . 49set breakpoint auto-hw . . . . . . . . . . . . . . . . . . . . . . . 48set breakpoint pending . . . . . . . . . . . . . . . . . . . . . . . 48set breakpoints in many functions . . . . . . . . . . . . . . 45set breakpoints on all functions . . . . . . . . . . . . . . . . 45set can-use-hw-watchpoints . . . . . . . . . . . . . . . . . . 51set case-sensitive . . . . . . . . . . . . . . . . . . . . . . . . . . 189set charset . . . . . . . . . . . . . . . . . . . . . . . . . . . . . . . . . . 125set check range . . . . . . . . . . . . . . . . . . . . . . . . . . . . . 165set check type . . . . . . . . . . . . . . . . . . . . . . . . . . . . . . . 164set circular-trace-buffer . . . . . . . . . . . . . . . . . . 149set coerce-float-to-double . . . . . . . . . . . . . . . . 269set com1base . . . . . . . . . . . . . . . . . . . . . . . . . . . . . . . . . 238set com1irq . . . . . . . . . . . . . . . . . . . . . . . . . . . . . . . . . . 238set com2base . . . . . . . . . . . . . . . . . . . . . . . . . . . . . . . . . 238set com2irq . . . . . . . . . . . . . . . . . . . . . . . . . . . . . . . . . . 238set com3base . . . . . . . . . . . . . . . . . . . . . . . . . . . . . . . . . 238set com3irq . . . . . . . . . . . . . . . . . . . . . . . . . . . . . . . . . . 238set com4base . . . . . . . . . . . . . . . . . . . . . . . . . . . . . . . . . 238set com4irq . . . . . . . . . . . . . . . . . . . . . . . . . . . . . . . . . . 238set complaints . . . . . . . . . . . . . . . . . . . . . . . . . . . . . . 270set confirm . . . . . . . . . . . . . . . . . . . . . . . . . . . . . . . . . . 270set cp-abi . . . . . . . . . . . . . . . . . . . . . . . . . . . . . . . . . . . 269set cygwin-exceptions . . . . . . . . . . . . . . . . . . . . . . 239set data-directory . . . . . . . . . . . . . . . . . . . . . . . . . . 214set dcache line-size . . . . . . . . . . . . . . . . . . . . . . . . 128set dcache size . . . . . . . . . . . . . . . . . . . . . . . . . . . . . 128set debug . . . . . . . . . . . . . . . . . . . . . . . . . . . . . . . . . . . . 271set debug darwin . . . . . . . . . . . . . . . . . . . . . . . . . . . . 245set debug entry-values . . . . . . . . . . . . . . . . . . . . . 132set debug hppa . . . . . . . . . . . . . . . . . . . . . . . . . . . . . . . 262set debug libthread-db . . . . . . . . . . . . . . . . . . . . . . . 38set debug mach-o . . . . . . . . . . . . . . . . . . . . . . . . . . . . 245set debug mips . . . . . . . . . . . . . . . . . . . . . . . . . . . . . . . 261
set debug monitor . . . . . . . . . . . . . . . . . . . . . . . . . . . 217set debug nto-debug . . . . . . . . . . . . . . . . . . . . . . . . . 244set debug-file-directory . . . . . . . . . . . . . . . . . . . 210set debugevents . . . . . . . . . . . . . . . . . . . . . . . . . . . . . 240set debugexceptions . . . . . . . . . . . . . . . . . . . . . . . . 240set debugexec . . . . . . . . . . . . . . . . . . . . . . . . . . . . . . . 240set debugmemory . . . . . . . . . . . . . . . . . . . . . . . . . . . . . 240set default-collect . . . . . . . . . . . . . . . . . . . . . . . . 146set demangle-style . . . . . . . . . . . . . . . . . . . . . . . . . . 113set detach-on-fork . . . . . . . . . . . . . . . . . . . . . . . . . . . 39set directories . . . . . . . . . . . . . . . . . . . . . . . . . . . . . . 92set disable-randomization . . . . . . . . . . . . . . . . . . . 28set disassemble-next-line . . . . . . . . . . . . . . . . . . . 95set disassembly-flavor . . . . . . . . . . . . . . . . . . . . . . 95set disconnected-tracing . . . . . . . . . . . . . . . . . . . 148set displaced-stepping . . . . . . . . . . . . . . . . . . . . . 459set download-path . . . . . . . . . . . . . . . . . . . . . . . . . . . 249set editing . . . . . . . . . . . . . . . . . . . . . . . . . . . . . . . . . . 265set endian . . . . . . . . . . . . . . . . . . . . . . . . . . . . . . . . . . . 218set environment . . . . . . . . . . . . . . . . . . . . . . . . . . . . . . 29set exceptions, Hurd command . . . . . . . . . . . . . . 243set exec-direction . . . . . . . . . . . . . . . . . . . . . . . . . . . 76set exec-done-display . . . . . . . . . . . . . . . . . . . . . . 271set exec-wrapper . . . . . . . . . . . . . . . . . . . . . . . . . . . . . 27set extended-prompt . . . . . . . . . . . . . . . . . . . . . . . . 265set extension-language . . . . . . . . . . . . . . . . . . . . . 163set fast tracepoint . . . . . . . . . . . . . . . . . . . . . . . . . . . . 141set follow-exec-mode . . . . . . . . . . . . . . . . . . . . . . . . 40set follow-fork-mode . . . . . . . . . . . . . . . . . . . . . . . . 39set gnutarget . . . . . . . . . . . . . . . . . . . . . . . . . . . . . . . 216set hash, for remote monitors . . . . . . . . . . . . . . . . 217set height . . . . . . . . . . . . . . . . . . . . . . . . . . . . . . . . . . . 267set history expansion . . . . . . . . . . . . . . . . . . . . . . . 267set history filename . . . . . . . . . . . . . . . . . . . . . . . . 266set history save . . . . . . . . . . . . . . . . . . . . . . . . . . . . 266set history size . . . . . . . . . . . . . . . . . . . . . . . . . . . . 266set host-charset . . . . . . . . . . . . . . . . . . . . . . . . . . . . 125set inferior controlling terminal . . . . . . . . . . . . . . . . 31set inferior-tty . . . . . . . . . . . . . . . . . . . . . . . . . . . . . 31set input-radix . . . . . . . . . . . . . . . . . . . . . . . . . . . . . 268set interactive-mode . . . . . . . . . . . . . . . . . . . . . . . 274set language . . . . . . . . . . . . . . . . . . . . . . . . . . . . . . . . . 162set libthread-db-search-path . . . . . . . . . . . . . . . 37set listsize . . . . . . . . . . . . . . . . . . . . . . . . . . . . . . . . . . 87set logging . . . . . . . . . . . . . . . . . . . . . . . . . . . . . . . . . . . 17set mach-exceptions . . . . . . . . . . . . . . . . . . . . . . . . 245set max-user-call-depth . . . . . . . . . . . . . . . . . . . . 276set mem inaccessible-by-default . . . . . . . . . . . 123set mips abi . . . . . . . . . . . . . . . . . . . . . . . . . . . . . . . . . 261set mips mask-address . . . . . . . . . . . . . . . . . . . . . . . 261set mipsfpu . . . . . . . . . . . . . . . . . . . . . . . . . . . . . . . . . . 252set monitor-prompt, MIPS remote . . . . . . . . . . . 253set monitor-warnings, MIPS remote . . . . . . . . . 253set multiple-symbols . . . . . . . . . . . . . . . . . . . . . . . . 98set new-console . . . . . . . . . . . . . . . . . . . . . . . . . . . . . 240set new-group . . . . . . . . . . . . . . . . . . . . . . . . . . . . . . . 240set non-stop . . . . . . . . . . . . . . . . . . . . . . . . . . . . . . . . . . 70set opaque-type-resolution . . . . . . . . . . . . . . . . 193
Index 589
set osabi . . . . . . . . . . . . . . . . . . . . . . . . . . . . . . . . . . . . 269set output-radix . . . . . . . . . . . . . . . . . . . . . . . . . . . . 268set overload-resolution . . . . . . . . . . . . . . . . . . . . 170set pagination . . . . . . . . . . . . . . . . . . . . . . . . . . . . . . 268set powerpc . . . . . . . . . . . . . . . . . . . . . . . . . . . . . . . . . . 255set print . . . . . . . . . . . . . . . . . . . . . . . . . . . . . . . . . . . . 106set print entry-values . . . . . . . . . . . . . . . . . . . . . 109set print frame-arguments . . . . . . . . . . . . . . . . . . 108set print inferior-events . . . . . . . . . . . . . . . . . . . 34set print thread-events . . . . . . . . . . . . . . . . . . . . . 37set processor . . . . . . . . . . . . . . . . . . . . . . . . . . . . . . . 215set procfs-file . . . . . . . . . . . . . . . . . . . . . . . . . . . . . 236set procfs-trace . . . . . . . . . . . . . . . . . . . . . . . . . . . . 236set prompt . . . . . . . . . . . . . . . . . . . . . . . . . . . . . . . . . . . 265set python print-stack . . . . . . . . . . . . . . . . . . . . . 282set radix . . . . . . . . . . . . . . . . . . . . . . . . . . . . . . . . . . . . 268set ravenscar task-switching off . . . . . . . . . . 187set ravenscar task-switching on . . . . . . . . . . . 187set rdiheartbeat . . . . . . . . . . . . . . . . . . . . . . . . . . . . 249set rdiromatzero . . . . . . . . . . . . . . . . . . . . . . . . . . . . 249set record insn-number-max . . . . . . . . . . . . . . . . . . 78set record memory-query . . . . . . . . . . . . . . . . . . . . . 78set record stop-at-limit . . . . . . . . . . . . . . . . . . . . 78set remote . . . . . . . . . . . . . . . . . . . . . . . . . . . . . . . . . . . 226set remote system-call-allowed . . . . . . . . . . . . 516set remote-mips64-transfers-32bit-regs . . . 261set remotecache . . . . . . . . . . . . . . . . . . . . . . . . . . . . . 128set remoteflow . . . . . . . . . . . . . . . . . . . . . . . . . . . . . . 226set retransmit-timeout . . . . . . . . . . . . . . . . . . . . . 252set rstack_high_address . . . . . . . . . . . . . . . . . . . . 260set schedule-multiple . . . . . . . . . . . . . . . . . . . . . . . 69set script-extension . . . . . . . . . . . . . . . . . . . . . . . 275set sdstimeout . . . . . . . . . . . . . . . . . . . . . . . . . . . . . . 256set server-address . . . . . . . . . . . . . . . . . . . . . . . . . . 250set sh calling-convention . . . . . . . . . . . . . . . . . . 259set shell . . . . . . . . . . . . . . . . . . . . . . . . . . . . . . . . . . . . 240set signal-thread . . . . . . . . . . . . . . . . . . . . . . . . . . . 242set signals, Hurd command . . . . . . . . . . . . . . . . . 242set sigs, Hurd command . . . . . . . . . . . . . . . . . . . . 242set sigthread . . . . . . . . . . . . . . . . . . . . . . . . . . . . . . . 242set solib-absolute-prefix . . . . . . . . . . . . . . . . . . 207set solib-search-path . . . . . . . . . . . . . . . . . . . . . . 208set spu . . . . . . . . . . . . . . . . . . . . . . . . . . . . . . . . . . . . . . 262set stack-cache . . . . . . . . . . . . . . . . . . . . . . . . . . . . . 128set static tracepoint . . . . . . . . . . . . . . . . . . . . . . . . . . 141set step-mode . . . . . . . . . . . . . . . . . . . . . . . . . . . . . . . . . 62set stop-on-solib-events . . . . . . . . . . . . . . . . . . . 206set stopped, Hurd command . . . . . . . . . . . . . . . . . 242set struct-convention . . . . . . . . . . . . . . . . . . . . . . 260set substitute-path . . . . . . . . . . . . . . . . . . . . . . . . . . 92set symbol-reloading . . . . . . . . . . . . . . . . . . . . . . . 193set syn-garbage-limit, MIPS remote . . . . . . . . 252set sysroot . . . . . . . . . . . . . . . . . . . . . . . . . . . . . . . . . . 207set target-async . . . . . . . . . . . . . . . . . . . . . . . . . . . . . 71set target-charset . . . . . . . . . . . . . . . . . . . . . . . . . . 125set target-file-system-kind
(unix|dos-based|auto) . . . . . . . . . . . . . . . . . 208set target-wide-charset . . . . . . . . . . . . . . . . . . . . 126
set task, Hurd commands . . . . . . . . . . . . . . . . . . . . 243set tcp . . . . . . . . . . . . . . . . . . . . . . . . . . . . . . . . . . . . . . 227set tdesc filename . . . . . . . . . . . . . . . . . . . . . . . . . . . . . 537set thread, Hurd command . . . . . . . . . . . . . . . . . . 243set timeout . . . . . . . . . . . . . . . . . . . . . . . . . . . . . . . . . . 252set trace-commands . . . . . . . . . . . . . . . . . . . . . . . . . . 271set trace-notes . . . . . . . . . . . . . . . . . . . . . . . . . . . . . 149set trace-stop-notes . . . . . . . . . . . . . . . . . . . . . . . 149set trace-user . . . . . . . . . . . . . . . . . . . . . . . . . . . . . . 149set tracepoint . . . . . . . . . . . . . . . . . . . . . . . . . . . . . . . . 140set trust-readonly-sections . . . . . . . . . . . . . . . 205set tui active-border-mode . . . . . . . . . . . . . . . . . 333set tui border-kind . . . . . . . . . . . . . . . . . . . . . . . . . 333set tui border-mode . . . . . . . . . . . . . . . . . . . . . . . . . 333set unwind-on-terminating-exception . . . . . . 199set unwindonsignal . . . . . . . . . . . . . . . . . . . . . . . . . . 199set variable . . . . . . . . . . . . . . . . . . . . . . . . . . . . . . . . . 195set verbose . . . . . . . . . . . . . . . . . . . . . . . . . . . . . . . . . . 270set watchdog . . . . . . . . . . . . . . . . . . . . . . . . . . . . . . . . . 465set width . . . . . . . . . . . . . . . . . . . . . . . . . . . . . . . . . . . . 267set write . . . . . . . . . . . . . . . . . . . . . . . . . . . . . . . . . . . . 199set-mark (C-@) . . . . . . . . . . . . . . . . . . . . . . . . . . . . . . 441set_debug_traps . . . . . . . . . . . . . . . . . . . . . . . . . . . . . 231setting variables . . . . . . . . . . . . . . . . . . . . . . . . . . . . . . 195setting watchpoints . . . . . . . . . . . . . . . . . . . . . . . . . . . . 49SH . . . . . . . . . . . . . . . . . . . . . . . . . . . . . . . . . . . . . . . . . . . 231‘sh-stub.c’ . . . . . . . . . . . . . . . . . . . . . . . . . . . . . . . . . . 231share . . . . . . . . . . . . . . . . . . . . . . . . . . . . . . . . . . . . . . . . 206shared libraries . . . . . . . . . . . . . . . . . . . . . . . . . . . . . . . 205shared library events, remote reply . . . . . . . . . . . . 478sharedlibrary . . . . . . . . . . . . . . . . . . . . . . . . . . . . . . . 206shell . . . . . . . . . . . . . . . . . . . . . . . . . . . . . . . . . . . . . . . . . 17shell escape . . . . . . . . . . . . . . . . . . . . . . . . . . . . . . . . . . . . 17show . . . . . . . . . . . . . . . . . . . . . . . . . . . . . . . . . . . . . . . . . . 23show ada trust-PAD-over-XVS . . . . . . . . . . . . . . . . 187show all convenience functions . . . . . . . . . . . . . . . . 119show all user variables . . . . . . . . . . . . . . . . . . . . . . . . 118show annotate . . . . . . . . . . . . . . . . . . . . . . . . . . . . . . . 411show architecture . . . . . . . . . . . . . . . . . . . . . . . . . . . 215show args . . . . . . . . . . . . . . . . . . . . . . . . . . . . . . . . . . . . . 29show arm . . . . . . . . . . . . . . . . . . . . . . . . . . . . . . . . . . . . . 247show auto-load-scripts . . . . . . . . . . . . . . . . . . . . . 321show auto-solib-add . . . . . . . . . . . . . . . . . . . . . . . . 206show backtrace . . . . . . . . . . . . . . . . . . . . . . . . . . . . . . . 83show basenames-may-differ . . . . . . . . . . . . . . . . . . 209show board-address . . . . . . . . . . . . . . . . . . . . . . . . . . 250show breakpoint always-inserted . . . . . . . . . . . . 49show breakpoint auto-hw . . . . . . . . . . . . . . . . . . . . . 48show breakpoint pending . . . . . . . . . . . . . . . . . . . . . 48show can-use-hw-watchpoints . . . . . . . . . . . . . . . . 51show case-sensitive . . . . . . . . . . . . . . . . . . . . . . . . 189show charset . . . . . . . . . . . . . . . . . . . . . . . . . . . . . . . . . 125show check range . . . . . . . . . . . . . . . . . . . . . . . . . . . . 165show check type . . . . . . . . . . . . . . . . . . . . . . . . . . . . . 164show circular-trace-buffer . . . . . . . . . . . . . . . . 149show coerce-float-to-double . . . . . . . . . . . . . . . 269show com1base . . . . . . . . . . . . . . . . . . . . . . . . . . . . . . . 239show com1irq . . . . . . . . . . . . . . . . . . . . . . . . . . . . . . . . . 239

590 Debugging with gdb
show com2base . . . . . . . . . . . . . . . . . . . . . . . . . . . . . . . 239show com2irq . . . . . . . . . . . . . . . . . . . . . . . . . . . . . . . . . 239show com3base . . . . . . . . . . . . . . . . . . . . . . . . . . . . . . . 239show com3irq . . . . . . . . . . . . . . . . . . . . . . . . . . . . . . . . . 239show com4base . . . . . . . . . . . . . . . . . . . . . . . . . . . . . . . 239show com4irq . . . . . . . . . . . . . . . . . . . . . . . . . . . . . . . . . 239show commands . . . . . . . . . . . . . . . . . . . . . . . . . . . . . . . 267show complaints . . . . . . . . . . . . . . . . . . . . . . . . . . . . . 270show confirm . . . . . . . . . . . . . . . . . . . . . . . . . . . . . . . . . 270show convenience . . . . . . . . . . . . . . . . . . . . . . . . . . . . 118show copying . . . . . . . . . . . . . . . . . . . . . . . . . . . . . . . . . . 23show cp-abi . . . . . . . . . . . . . . . . . . . . . . . . . . . . . . . . . . 269show cygwin-exceptions . . . . . . . . . . . . . . . . . . . . . 239show data-directory . . . . . . . . . . . . . . . . . . . . . . . . 214show dcache line-size . . . . . . . . . . . . . . . . . . . . . . . 128show dcache size . . . . . . . . . . . . . . . . . . . . . . . . . . . . 128show debug . . . . . . . . . . . . . . . . . . . . . . . . . . . . . . . . . . . 271show debug darwin . . . . . . . . . . . . . . . . . . . . . . . . . . . 245show debug entry-values . . . . . . . . . . . . . . . . . . . . 133show debug libthread-db . . . . . . . . . . . . . . . . . . . . . 38show debug mach-o . . . . . . . . . . . . . . . . . . . . . . . . . . . 245show debug mips . . . . . . . . . . . . . . . . . . . . . . . . . . . . . 261show debug monitor . . . . . . . . . . . . . . . . . . . . . . . . . . 217show debug nto-debug . . . . . . . . . . . . . . . . . . . . . . . . 244show debug-file-directory . . . . . . . . . . . . . . . . . . 210show default-collect . . . . . . . . . . . . . . . . . . . . . . . 146show detach-on-fork . . . . . . . . . . . . . . . . . . . . . . . . . . 39show directories . . . . . . . . . . . . . . . . . . . . . . . . . . . . . 92show disassemble-next-line . . . . . . . . . . . . . . . . . . 95show disassembly-flavor . . . . . . . . . . . . . . . . . . . . . 95show disconnected-tracing . . . . . . . . . . . . . . . . . . 148show displaced-stepping . . . . . . . . . . . . . . . . . . . . 459show download-path . . . . . . . . . . . . . . . . . . . . . . . . . . 249show editing . . . . . . . . . . . . . . . . . . . . . . . . . . . . . . . . . 266show environment . . . . . . . . . . . . . . . . . . . . . . . . . . . . . 29show exceptions, Hurd command . . . . . . . . . . . . 243show exec-done-display . . . . . . . . . . . . . . . . . . . . . 271show extended-prompt . . . . . . . . . . . . . . . . . . . . . . . 265show follow-fork-mode . . . . . . . . . . . . . . . . . . . . . . . 39show gnutarget . . . . . . . . . . . . . . . . . . . . . . . . . . . . . . 216show hash, for remote monitors . . . . . . . . . . . . . . . 217show height . . . . . . . . . . . . . . . . . . . . . . . . . . . . . . . . . . 267show history . . . . . . . . . . . . . . . . . . . . . . . . . . . . . . . . . 267show host-charset . . . . . . . . . . . . . . . . . . . . . . . . . . . 126show inferior-tty . . . . . . . . . . . . . . . . . . . . . . . . . . . . 31show input-radix . . . . . . . . . . . . . . . . . . . . . . . . . . . . 268show interactive-mode . . . . . . . . . . . . . . . . . . . . . . 274show language . . . . . . . . . . . . . . . . . . . . . . . . . . . . . . . 163show last commands . . . . . . . . . . . . . . . . . . . . . . . . . . 267show libthread-db-search-path . . . . . . . . . . . . . . 38show listsize . . . . . . . . . . . . . . . . . . . . . . . . . . . . . . . . . 87show logging . . . . . . . . . . . . . . . . . . . . . . . . . . . . . . . . . . 17show mach-exceptions . . . . . . . . . . . . . . . . . . . . . . . 245show max-user-call-depth . . . . . . . . . . . . . . . . . . . 276show mem inaccessible-by-default . . . . . . . . . . 123show mips abi . . . . . . . . . . . . . . . . . . . . . . . . . . . . . . . . 261show mips mask-address . . . . . . . . . . . . . . . . . . . . . 261show mipsfpu . . . . . . . . . . . . . . . . . . . . . . . . . . . . . . . . . 252
show monitor-prompt, MIPS remote . . . . . . . . . . 253show monitor-warnings, MIPS remote . . . . . . . . 253show multiple-symbols . . . . . . . . . . . . . . . . . . . . . . . 99show new-console . . . . . . . . . . . . . . . . . . . . . . . . . . . . 240show new-group . . . . . . . . . . . . . . . . . . . . . . . . . . . . . . 240show non-stop . . . . . . . . . . . . . . . . . . . . . . . . . . . . . . . . . 70show opaque-type-resolution . . . . . . . . . . . . . . . 193show osabi . . . . . . . . . . . . . . . . . . . . . . . . . . . . . . . . . . . 269show output-radix . . . . . . . . . . . . . . . . . . . . . . . . . . . 268show overload-resolution . . . . . . . . . . . . . . . . . . . 171show pagination . . . . . . . . . . . . . . . . . . . . . . . . . . . . . 268show paths . . . . . . . . . . . . . . . . . . . . . . . . . . . . . . . . . . . . 29show print . . . . . . . . . . . . . . . . . . . . . . . . . . . . . . . . . . . 107show print inferior-events . . . . . . . . . . . . . . . . . . 34show print thread-events . . . . . . . . . . . . . . . . . . . . 37show processor . . . . . . . . . . . . . . . . . . . . . . . . . . . . . . 215show procfs-file . . . . . . . . . . . . . . . . . . . . . . . . . . . . 236show procfs-trace . . . . . . . . . . . . . . . . . . . . . . . . . . . 236show prompt . . . . . . . . . . . . . . . . . . . . . . . . . . . . . . . . . . 265show radix . . . . . . . . . . . . . . . . . . . . . . . . . . . . . . . . . . . 268show ravenscar task-switching . . . . . . . . . . . . . 187show rdiheartbeat . . . . . . . . . . . . . . . . . . . . . . . . . . . 249show rdiromatzero . . . . . . . . . . . . . . . . . . . . . . . . . . . 249show record insn-number-max . . . . . . . . . . . . . . . . . 78show record memory-query . . . . . . . . . . . . . . . . . . . . 79show record stop-at-limit . . . . . . . . . . . . . . . . . . . 78show remote . . . . . . . . . . . . . . . . . . . . . . . . . . . . . . . . . . 226show remote system-call-allowed . . . . . . . . . . . 516show remote-mips64-transfers-32bit-regs
. . . . . . . . . . . . . . . . . . . . . . . . . . . . . . . . . . . . . . . . . 261show remotecache . . . . . . . . . . . . . . . . . . . . . . . . . . . . 128show remoteflow . . . . . . . . . . . . . . . . . . . . . . . . . . . . . 226show retransmit-timeout . . . . . . . . . . . . . . . . . . . . 252show rstack_high_address . . . . . . . . . . . . . . . . . . . 260show script-extension . . . . . . . . . . . . . . . . . . . . . . 275show sdstimeout . . . . . . . . . . . . . . . . . . . . . . . . . . . . . 256show server-address . . . . . . . . . . . . . . . . . . . . . . . . 250show sh calling-convention . . . . . . . . . . . . . . . . . 259show shell . . . . . . . . . . . . . . . . . . . . . . . . . . . . . . . . . . . 240show signal-thread . . . . . . . . . . . . . . . . . . . . . . . . . . 242show signals, Hurd command . . . . . . . . . . . . . . . . 242show sigs, Hurd command . . . . . . . . . . . . . . . . . . . 242show sigthread . . . . . . . . . . . . . . . . . . . . . . . . . . . . . . 242show solib-search-path . . . . . . . . . . . . . . . . . . . . . 208show spu . . . . . . . . . . . . . . . . . . . . . . . . . . . . . . . . . . . . . 262show stack-cache . . . . . . . . . . . . . . . . . . . . . . . . . . . . 128show stop-on-solib-events . . . . . . . . . . . . . . . . . . 206show stopped, Hurd command . . . . . . . . . . . . . . . . 242show struct-convention . . . . . . . . . . . . . . . . . . . . . 260show substitute-path . . . . . . . . . . . . . . . . . . . . . . . . 93show symbol-reloading . . . . . . . . . . . . . . . . . . . . . . 193show syn-garbage-limit, MIPS remote . . . . . . 253show sysroot . . . . . . . . . . . . . . . . . . . . . . . . . . . . . . . . . 207show target-async . . . . . . . . . . . . . . . . . . . . . . . . . . . . 71show target-charset . . . . . . . . . . . . . . . . . . . . . . . . 126show target-file-system-kind . . . . . . . . . . . . . . 208show target-wide-charset . . . . . . . . . . . . . . . . . . . 126show task, Hurd commands . . . . . . . . . . . . . . . . . . 243
Index 591
show tcp . . . . . . . . . . . . . . . . . . . . . . . . . . . . . . . . . . . . . 227show tdesc filename . . . . . . . . . . . . . . . . . . . . . . . . . . 537show thread, Hurd command . . . . . . . . . . . . . . . . . 244show timeout . . . . . . . . . . . . . . . . . . . . . . . . . . . . . . . . . 252show trace-notes . . . . . . . . . . . . . . . . . . . . . . . . . . . . 149show trace-stop-notes . . . . . . . . . . . . . . . . . . . . . . 149show trace-user . . . . . . . . . . . . . . . . . . . . . . . . . . . . . 149show unwind-on-terminating-exception . . . . . 199show unwindonsignal . . . . . . . . . . . . . . . . . . . . . . . . 199show user . . . . . . . . . . . . . . . . . . . . . . . . . . . . . . . . . . . . 276show values . . . . . . . . . . . . . . . . . . . . . . . . . . . . . . . . . . 117show verbose . . . . . . . . . . . . . . . . . . . . . . . . . . . . . . . . . 270show version . . . . . . . . . . . . . . . . . . . . . . . . . . . . . . . . . . 23show warranty . . . . . . . . . . . . . . . . . . . . . . . . . . . . . . . . . 23show width . . . . . . . . . . . . . . . . . . . . . . . . . . . . . . . . . . . 267show write . . . . . . . . . . . . . . . . . . . . . . . . . . . . . . . . . . . 200show-all-if-ambiguous . . . . . . . . . . . . . . . . . . . . . . 430show-all-if-unmodified . . . . . . . . . . . . . . . . . . . . . 430si (stepi) . . . . . . . . . . . . . . . . . . . . . . . . . . . . . . . . . . . . . 64signal . . . . . . . . . . . . . . . . . . . . . . . . . . . . . . . . . . . . . . . 197signal annotation . . . . . . . . . . . . . . . . . . . . . . . . . . . 414signal-name annotation . . . . . . . . . . . . . . . . . . . . . 413signal-name-end annotation . . . . . . . . . . . . . . . . 413signal-string annotation . . . . . . . . . . . . . . . . . . . 413signal-string-end annotation . . . . . . . . . . . . . . 413SignalEvent.stop_signal . . . . . . . . . . . . . . . . . . . 300signalled annotation . . . . . . . . . . . . . . . . . . . . . . . 413signals . . . . . . . . . . . . . . . . . . . . . . . . . . . . . . . . . . . . . . . . . 66SIGQUIT signal, dump core of gdb . . . . . . . . . . . . 460silent . . . . . . . . . . . . . . . . . . . . . . . . . . . . . . . . . . . . . . . . 59sim . . . . . . . . . . . . . . . . . . . . . . . . . . . . . . . . . . . . . . . . . . 258sim, a command . . . . . . . . . . . . . . . . . . . . . . . . . . . . . . 247simulator, Z8000 . . . . . . . . . . . . . . . . . . . . . . . . . . . . . 258size of remote memory accesses . . . . . . . . . . . . . . . 472size of screen . . . . . . . . . . . . . . . . . . . . . . . . . . . . . . . . . 267skip delete . . . . . . . . . . . . . . . . . . . . . . . . . . . . . . . . . . . 65skip disable . . . . . . . . . . . . . . . . . . . . . . . . . . . . . . . . . . 65skip enable . . . . . . . . . . . . . . . . . . . . . . . . . . . . . . . . . . . 65skip file . . . . . . . . . . . . . . . . . . . . . . . . . . . . . . . . . . . . . 65skip function . . . . . . . . . . . . . . . . . . . . . . . . . . . . . . . . . 65skip-completed-text . . . . . . . . . . . . . . . . . . . . . . . . 430skip-csi-sequence () . . . . . . . . . . . . . . . . . . . . . . . 442skipping over functions and files . . . . . . . . . . . . . . . 64snapshot of a process . . . . . . . . . . . . . . . . . . . . . . . . . . 40software watchpoints . . . . . . . . . . . . . . . . . . . . . . . . . . 49source . . . . . . . . . . . . . . . . . . . . . . . . . . . . . . . . . . . . . . . 278source annotation . . . . . . . . . . . . . . . . . . . . . . . . . . . 414source file and line of a symbol . . . . . . . . . . . . . . . 107source line and its code address . . . . . . . . . . . . . . . . 93source path . . . . . . . . . . . . . . . . . . . . . . . . . . . . . . . . . . . . 90Sparc . . . . . . . . . . . . . . . . . . . . . . . . . . . . . . . . . . . . . . . . 231‘sparc-stub.c’ . . . . . . . . . . . . . . . . . . . . . . . . . . . . . . . 231‘sparcl-stub.c’ . . . . . . . . . . . . . . . . . . . . . . . . . . . . . . 231Sparclet . . . . . . . . . . . . . . . . . . . . . . . . . . . . . . . . . . . . . . 256SparcLite . . . . . . . . . . . . . . . . . . . . . . . . . . . . . . . . . . . . . 231Special Fortran commands . . . . . . . . . . . . . . . . . . . . 173specifying location . . . . . . . . . . . . . . . . . . . . . . . . . . . . . 88spr . . . . . . . . . . . . . . . . . . . . . . . . . . . . . . . . . . . . . . . . . . 253
SPU . . . . . . . . . . . . . . . . . . . . . . . . . . . . . . . . . . . . . . . . . 262SSE registers (x86) . . . . . . . . . . . . . . . . . . . . . . . . . . . 120stack frame . . . . . . . . . . . . . . . . . . . . . . . . . . . . . . . . . . . . 81stack on Alpha . . . . . . . . . . . . . . . . . . . . . . . . . . . . . . . 260stack on MIPS . . . . . . . . . . . . . . . . . . . . . . . . . . . . . . . 260stack pointer register . . . . . . . . . . . . . . . . . . . . . . . . . 119stacking targets . . . . . . . . . . . . . . . . . . . . . . . . . . . . . . 215standard registers . . . . . . . . . . . . . . . . . . . . . . . . . . . . 119start . . . . . . . . . . . . . . . . . . . . . . . . . . . . . . . . . . . . . . . . . 27start a new trace experiment . . . . . . . . . . . . . . . . . 147start-kbd-macro (C-x () . . . . . . . . . . . . . . . . . . . . 441starting . . . . . . . . . . . . . . . . . . . . . . . . . . . . . . . . . . . . . . . 26starting annotation . . . . . . . . . . . . . . . . . . . . . . . . 413startup code, and backtrace . . . . . . . . . . . . . . . . . . . . 83stat, file-i/o system call . . . . . . . . . . . . . . . . . . . . . . . 515static members of C++ objects . . . . . . . . . . . . . . . . 113static members of Pascal objects . . . . . . . . . . . . . . 113static tracepoints . . . . . . . . . . . . . . . . . . . . . . . . . . . . . 139static tracepoints, in remote protocol . . . . . . . . . 490static tracepoints, setting . . . . . . . . . . . . . . . . . . . . . 141status of trace data collection . . . . . . . . . . . . . . . . . 148status output in gdb/mi . . . . . . . . . . . . . . . . . . . . . . 342STDERR . . . . . . . . . . . . . . . . . . . . . . . . . . . . . . . . . . . . . . . 284STDLOG . . . . . . . . . . . . . . . . . . . . . . . . . . . . . . . . . . . . . . . 284STDOUT . . . . . . . . . . . . . . . . . . . . . . . . . . . . . . . . . . . . . . . 284step . . . . . . . . . . . . . . . . . . . . . . . . . . . . . . . . . . . . . . . . . . 62step& . . . . . . . . . . . . . . . . . . . . . . . . . . . . . . . . . . . . . . . . . 71stepi . . . . . . . . . . . . . . . . . . . . . . . . . . . . . . . . . . . . . . . . . 64stepi& . . . . . . . . . . . . . . . . . . . . . . . . . . . . . . . . . . . . . . . . 71stepping . . . . . . . . . . . . . . . . . . . . . . . . . . . . . . . . . . . . . . . 61stepping into functions with no line info . . . . . . . . 62stop a running trace experiment . . . . . . . . . . . . . . 147stop on C++ exceptions . . . . . . . . . . . . . . . . . . . . . . . . 52stop reply packets . . . . . . . . . . . . . . . . . . . . . . . . . . . . 478stop, a pseudo-command . . . . . . . . . . . . . . . . . . . . . 277stopped threads . . . . . . . . . . . . . . . . . . . . . . . . . . . . . . . 68stopping annotation . . . . . . . . . . . . . . . . . . . . . . . . 413strace . . . . . . . . . . . . . . . . . . . . . . . . . . . . . . . . . . . . . . . 141stream records in gdb/mi . . . . . . . . . . . . . . . . . . . . . 344string tracing, in remote protocol . . . . . . . . . . . . . 490struct gdb_reader_funcs . . . . . . . . . . . . . . . . . . . . 417struct gdb_symbol_callbacks . . . . . . . . . . . . . . . 417struct gdb_unwind_callbacks . . . . . . . . . . . . . . . 417struct return convention . . . . . . . . . . . . . . . . . . . . . . 260struct stat, in file-i/o protocol . . . . . . . . . . . . . . . . 517struct timeval, in file-i/o protocol . . . . . . . . . . . . . 518struct user contents . . . . . . . . . . . . . . . . . . . . . . . . . 121struct/union returned in registers . . . . . . . . . . . . . 260structure field name completion . . . . . . . . . . . . . . . . 21stub example, remote debugging . . . . . . . . . . . . . . 230stupid questions . . . . . . . . . . . . . . . . . . . . . . . . . . . . . . 270Super-H . . . . . . . . . . . . . . . . . . . . . . . . . . . . . . . . . . . . . . 259supported packets, remote query . . . . . . . . . . . . . . 485switching threads . . . . . . . . . . . . . . . . . . . . . . . . . . . . . . 35switching threads automatically . . . . . . . . . . . . . . . . 69symbol decoding style, C++ . . . . . . . . . . . . . . . . . . . 113symbol dump . . . . . . . . . . . . . . . . . . . . . . . . . . . . . . . . . 193symbol from address . . . . . . . . . . . . . . . . . . . . . . . . . . 189
592 Debugging with gdb
symbol lookup, remote request . . . . . . . . . . . . . . . . 490symbol names . . . . . . . . . . . . . . . . . . . . . . . . . . . . . . . . 189symbol table . . . . . . . . . . . . . . . . . . . . . . . . . . . . . . . . . 201symbol tables in python . . . . . . . . . . . . . . . . . . . . . . 316symbol tables, listing gdb’s internal . . . . . . . . . . 194symbol, source file and line . . . . . . . . . . . . . . . . . . . 107symbol-file . . . . . . . . . . . . . . . . . . . . . . . . . . . . . . . . . 201Symbol.addr_class . . . . . . . . . . . . . . . . . . . . . . . . . . 314Symbol.is_argument . . . . . . . . . . . . . . . . . . . . . . . . . 314Symbol.is_constant . . . . . . . . . . . . . . . . . . . . . . . . . 314Symbol.is_function . . . . . . . . . . . . . . . . . . . . . . . . . 314Symbol.is_valid . . . . . . . . . . . . . . . . . . . . . . . . . . . . . 314Symbol.is_variable . . . . . . . . . . . . . . . . . . . . . . . . . 314Symbol.linkage_name . . . . . . . . . . . . . . . . . . . . . . . . 314Symbol.name . . . . . . . . . . . . . . . . . . . . . . . . . . . . . . . . . 314Symbol.print_name . . . . . . . . . . . . . . . . . . . . . . . . . . 314Symbol.symtab . . . . . . . . . . . . . . . . . . . . . . . . . . . . . . . 314Symbol.type . . . . . . . . . . . . . . . . . . . . . . . . . . . . . . . . . 314SYMBOL_FUNCTIONS_DOMAIN . . . . . . . . . . . . . . . . . . . 315SYMBOL_LABEL_DOMAIN . . . . . . . . . . . . . . . . . . . . . . . . 315SYMBOL_LOC_ARG . . . . . . . . . . . . . . . . . . . . . . . . . . . . . . 315SYMBOL_LOC_BLOCK . . . . . . . . . . . . . . . . . . . . . . . . . . . . 316SYMBOL_LOC_COMPUTED . . . . . . . . . . . . . . . . . . . . . . . . 316SYMBOL_LOC_CONST . . . . . . . . . . . . . . . . . . . . . . . . . . . . 315SYMBOL_LOC_CONST_BYTES . . . . . . . . . . . . . . . . . . . . . 316SYMBOL_LOC_LOCAL . . . . . . . . . . . . . . . . . . . . . . . . . . . . 315SYMBOL_LOC_OPTIMIZED_OUT . . . . . . . . . . . . . . . . . . 316SYMBOL_LOC_REF_ARG . . . . . . . . . . . . . . . . . . . . . . . . . 315SYMBOL_LOC_REGISTER . . . . . . . . . . . . . . . . . . . . . . . . 315SYMBOL_LOC_REGPARM_ADDR . . . . . . . . . . . . . . . . . . . 315SYMBOL_LOC_STATIC . . . . . . . . . . . . . . . . . . . . . . . . . . 315SYMBOL_LOC_TYPEDEF . . . . . . . . . . . . . . . . . . . . . . . . . 316SYMBOL_LOC_UNDEF . . . . . . . . . . . . . . . . . . . . . . . . . . . . 315SYMBOL_LOC_UNRESOLVED . . . . . . . . . . . . . . . . . . . . . . 316SYMBOL_STRUCT_DOMAIN . . . . . . . . . . . . . . . . . . . . . . . 315SYMBOL_TYPES_DOMAIN . . . . . . . . . . . . . . . . . . . . . . . . 315SYMBOL_UNDEF_DOMAIN . . . . . . . . . . . . . . . . . . . . . . . . 315SYMBOL_VAR_DOMAIN . . . . . . . . . . . . . . . . . . . . . . . . . . 315SYMBOL_VARIABLES_DOMAIN . . . . . . . . . . . . . . . . . . . 315symbols in python . . . . . . . . . . . . . . . . . . . . . . . . . . . . 313symbols, reading from relocatable object files . . 203symbols, reading immediately . . . . . . . . . . . . . . . . . 202Symtab.filename . . . . . . . . . . . . . . . . . . . . . . . . . . . . . 317Symtab.fullname . . . . . . . . . . . . . . . . . . . . . . . . . . . . . 317Symtab.is_valid . . . . . . . . . . . . . . . . . . . . . . . . . . . . . 317Symtab.objfile . . . . . . . . . . . . . . . . . . . . . . . . . . . . . . 317Symtab_and_line.is_valid . . . . . . . . . . . . . . . . . . 316Symtab_and_line.line . . . . . . . . . . . . . . . . . . . . . . . 316Symtab_and_line.pc . . . . . . . . . . . . . . . . . . . . . . . . . 316Symtab_and_line.symtab . . . . . . . . . . . . . . . . . . . . . 316synchronize with remote MIPS target . . . . . . . . . 252syscall DSO . . . . . . . . . . . . . . . . . . . . . . . . . . . . . . . . . . 203sysinfo . . . . . . . . . . . . . . . . . . . . . . . . . . . . . . . . . . . . . . 237system calls and thread breakpoints . . . . . . . . . . . . 72system root, alternate . . . . . . . . . . . . . . . . . . . . . . . . 207system, file-i/o system call . . . . . . . . . . . . . . . . . . . . 516system-wide init file . . . . . . . . . . . . . . . . . . . . . . . . . . 458
T‘t’ packet . . . . . . . . . . . . . . . . . . . . . . . . . . . . . . . . . . . . 473‘T’ packet . . . . . . . . . . . . . . . . . . . . . . . . . . . . . . . . . . . . 473‘T’ packet reply . . . . . . . . . . . . . . . . . . . . . . . . . . . . . . . 478tab-insert (M-TAB) . . . . . . . . . . . . . . . . . . . . . . . . . . 438tabset . . . . . . . . . . . . . . . . . . . . . . . . . . . . . . . . . . . . . . . 332tail call frames, debugging . . . . . . . . . . . . . . . . . . . . 132target . . . . . . . . . . . . . . . . . . . . . . . . . . . . . . . . . . . . . . . 216target architecture . . . . . . . . . . . . . . . . . . . . . . . . . . . . 215target array . . . . . . . . . . . . . . . . . . . . . . . . . . . . . . . . . 252target byte order . . . . . . . . . . . . . . . . . . . . . . . . . . . . . 218target character set . . . . . . . . . . . . . . . . . . . . . . . . . . . 125target dbug . . . . . . . . . . . . . . . . . . . . . . . . . . . . . . . . . . 250target ddb port . . . . . . . . . . . . . . . . . . . . . . . . . . . . . 251target debugging info . . . . . . . . . . . . . . . . . . . . . . . . . 273target descriptions . . . . . . . . . . . . . . . . . . . . . . . . . . . . 537target descriptions, ARM features . . . . . . . . . . . . 542target descriptions, i386 features . . . . . . . . . . . . . . 543target descriptions, inclusion . . . . . . . . . . . . . . . . . . 538target descriptions, M68K features . . . . . . . . . . . . 543target descriptions, MIPS features . . . . . . . . . . . . 543target descriptions, PowerPC features . . . . . . . . . 544target descriptions, predefined types . . . . . . . . . . 541target descriptions, standard features . . . . . . . . . 542target descriptions, TIC6x features . . . . . . . . . . . 544target descriptions, TMS320C6x features . . . . . . 544target descriptions, XML format . . . . . . . . . . . . . . 537target dink32 . . . . . . . . . . . . . . . . . . . . . . . . . . . . . . . 256target jtag . . . . . . . . . . . . . . . . . . . . . . . . . . . . . . . . . . 253target lsi port . . . . . . . . . . . . . . . . . . . . . . . . . . . . . 252target m32r . . . . . . . . . . . . . . . . . . . . . . . . . . . . . . . . . . 249target m32rsdi . . . . . . . . . . . . . . . . . . . . . . . . . . . . . . 249target mips port . . . . . . . . . . . . . . . . . . . . . . . . . . . . 251target op50n . . . . . . . . . . . . . . . . . . . . . . . . . . . . . . . . . 256target output in gdb/mi . . . . . . . . . . . . . . . . . . . . . . 342target pmon port . . . . . . . . . . . . . . . . . . . . . . . . . . . . 251target ppcbug . . . . . . . . . . . . . . . . . . . . . . . . . . . . . . . 256target ppcbug1 . . . . . . . . . . . . . . . . . . . . . . . . . . . . . . 256target r3900 . . . . . . . . . . . . . . . . . . . . . . . . . . . . . . . . . 252target rdi . . . . . . . . . . . . . . . . . . . . . . . . . . . . . . . . . . . 247target rdp . . . . . . . . . . . . . . . . . . . . . . . . . . . . . . . . . . . 247target record . . . . . . . . . . . . . . . . . . . . . . . . . . . . . . . . . 77target remote . . . . . . . . . . . . . . . . . . . . . . . . . . . . . . . 219target sds . . . . . . . . . . . . . . . . . . . . . . . . . . . . . . . . . . . 256target sim, with Z8000 . . . . . . . . . . . . . . . . . . . . . . 258target sparclite . . . . . . . . . . . . . . . . . . . . . . . . . . . . 258target stack description . . . . . . . . . . . . . . . . . . . . . . . 463target tfile . . . . . . . . . . . . . . . . . . . . . . . . . . . . . . . . . 154target vxworks . . . . . . . . . . . . . . . . . . . . . . . . . . . . . . 245target w89k . . . . . . . . . . . . . . . . . . . . . . . . . . . . . . . . . . 256task (Ada) . . . . . . . . . . . . . . . . . . . . . . . . . . . . . . . . . . . 185task attributes (gnu Hurd) . . . . . . . . . . . . . . . . . . . 243task breakpoints, in Ada . . . . . . . . . . . . . . . . . . . . . . 186task exception port, gnu Hurd . . . . . . . . . . . . . . . . 243task suspend count . . . . . . . . . . . . . . . . . . . . . . . . . . . 243task switching with program using Ravenscar
Profile . . . . . . . . . . . . . . . . . . . . . . . . . . . . . . . . . . . 187tbreak . . . . . . . . . . . . . . . . . . . . . . . . . . . . . . . . . . . . . . . . 44
Index 593
TCP port, target remote . . . . . . . . . . . . . . . . . . . . . 219tdump . . . . . . . . . . . . . . . . . . . . . . . . . . . . . . . . . . . . . . . . 152terminal . . . . . . . . . . . . . . . . . . . . . . . . . . . . . . . . . . . . . . . 30teval (tracepoints) . . . . . . . . . . . . . . . . . . . . . . . . . . . 146Text User Interface . . . . . . . . . . . . . . . . . . . . . . . . . . . 329tfile . . . . . . . . . . . . . . . . . . . . . . . . . . . . . . . . . . . . . . . . 154tfind . . . . . . . . . . . . . . . . . . . . . . . . . . . . . . . . . . . . . . . . 150thbreak . . . . . . . . . . . . . . . . . . . . . . . . . . . . . . . . . . . . . . . 45this, inside C++ member functions . . . . . . . . . . . 168thread apply . . . . . . . . . . . . . . . . . . . . . . . . . . . . . . . . . . 36thread attributes info, remote request . . . . . . . . . 491thread breakpoints . . . . . . . . . . . . . . . . . . . . . . . . . . . . 72thread breakpoints and system calls . . . . . . . . . . . . 72thread default settings, gnu Hurd . . . . . . . . . . . . 244thread find . . . . . . . . . . . . . . . . . . . . . . . . . . . . . . . . . . . 37thread identifier (GDB) . . . . . . . . . . . . . . . . . . . . . . . . 36thread identifier (system) . . . . . . . . . . . . . . . . . . . . . . 35thread info (Solaris) . . . . . . . . . . . . . . . . . . . . . . . . . . . 36thread information, remote request . . . . . . . . . . . 483thread list format . . . . . . . . . . . . . . . . . . . . . . . . . . . . 522thread name . . . . . . . . . . . . . . . . . . . . . . . . . . . . . . . . . . . 37thread number . . . . . . . . . . . . . . . . . . . . . . . . . . . . . . . . 36thread properties, gnu Hurd . . . . . . . . . . . . . . . . . . 243thread suspend count, gnu Hurd . . . . . . . . . . . . . 244thread threadno . . . . . . . . . . . . . . . . . . . . . . . . . . . . . . 36thread-id, in remote protocol . . . . . . . . . . . . . . . . . 468ThreadEvent.inferior_thread . . . . . . . . . . . . . . . 300threads and watchpoints . . . . . . . . . . . . . . . . . . . . . . . 52threads in python . . . . . . . . . . . . . . . . . . . . . . . . . . . . 301threads of execution . . . . . . . . . . . . . . . . . . . . . . . . . . . 35threads, automatic switching . . . . . . . . . . . . . . . . . . . 69threads, continuing . . . . . . . . . . . . . . . . . . . . . . . . . . . . 68threads, stopped . . . . . . . . . . . . . . . . . . . . . . . . . . . . . . . 68tilde-expand (M-~) . . . . . . . . . . . . . . . . . . . . . . . . . . 441time of command execution . . . . . . . . . . . . . . . . . . . 464timeout for commands . . . . . . . . . . . . . . . . . . . . . . . . 465timeout for serial communications . . . . . . . . . . . . 227timeout, for remote target connection . . . . . . . . . 228timeout, MIPS protocol . . . . . . . . . . . . . . . . . . . . . . 252timestampping debugging info . . . . . . . . . . . . . . . . 273tload, M32R . . . . . . . . . . . . . . . . . . . . . . . . . . . . . . . . . 250trace . . . . . . . . . . . . . . . . . . . . . . . . . . . . . . . . . . . . . . . . 140trace experiment, status of . . . . . . . . . . . . . . . . . . . . 148trace file format . . . . . . . . . . . . . . . . . . . . . . . . . . . . . . 547trace files . . . . . . . . . . . . . . . . . . . . . . . . . . . . . . . . . . . . . 154trace state variable value, remote request . . . . . 501trace state variables . . . . . . . . . . . . . . . . . . . . . . . . . . 143traceback . . . . . . . . . . . . . . . . . . . . . . . . . . . . . . . . . . . . . . 82traceframe info format . . . . . . . . . . . . . . . . . . . . . . . . 523tracepoint actions . . . . . . . . . . . . . . . . . . . . . . . . . . . . 144tracepoint conditions . . . . . . . . . . . . . . . . . . . . . . . . . 143tracepoint data, display . . . . . . . . . . . . . . . . . . . . . . . 152tracepoint deletion . . . . . . . . . . . . . . . . . . . . . . . . . . . 142tracepoint number . . . . . . . . . . . . . . . . . . . . . . . . . . . . 142tracepoint packets . . . . . . . . . . . . . . . . . . . . . . . . . . . . 496tracepoint pass count . . . . . . . . . . . . . . . . . . . . . . . . . 143tracepoint restrictions . . . . . . . . . . . . . . . . . . . . . . . . 149tracepoint status, remote request . . . . . . . . . . . . . 501
tracepoint variables . . . . . . . . . . . . . . . . . . . . . . . . . . . 153tracepoints . . . . . . . . . . . . . . . . . . . . . . . . . . . . . . . . . . . 139tracepoints support in gdbserver . . . . . . . . . . . . . 224trailing underscore, in Fortran symbols . . . . . . . . 173translating between character sets . . . . . . . . . . . . 125transpose-chars (C-t) . . . . . . . . . . . . . . . . . . . . . . 438transpose-words (M-t) . . . . . . . . . . . . . . . . . . . . . . 438tsave . . . . . . . . . . . . . . . . . . . . . . . . . . . . . . . . . . . . . . . . 154tstart [ notes ] . . . . . . . . . . . . . . . . . . . . . . . . . . . . 147tstatus . . . . . . . . . . . . . . . . . . . . . . . . . . . . . . . . . . . . . . 148tstop [ notes ] . . . . . . . . . . . . . . . . . . . . . . . . . . . . . . 147tty . . . . . . . . . . . . . . . . . . . . . . . . . . . . . . . . . . . . . . . . . . . . 31TUI . . . . . . . . . . . . . . . . . . . . . . . . . . . . . . . . . . . . . . . . . . 329TUI commands . . . . . . . . . . . . . . . . . . . . . . . . . . . . . . . 331TUI configuration variables . . . . . . . . . . . . . . . . . . . 333TUI key bindings . . . . . . . . . . . . . . . . . . . . . . . . . . . . . 330tui reg . . . . . . . . . . . . . . . . . . . . . . . . . . . . . . . . . . . . . . 332TUI single key mode . . . . . . . . . . . . . . . . . . . . . . . . . 331tvariable . . . . . . . . . . . . . . . . . . . . . . . . . . . . . . . . . . . . 144type casting memory . . . . . . . . . . . . . . . . . . . . . . . . . . 98type chain of a data type . . . . . . . . . . . . . . . . . . . . . 463type checking . . . . . . . . . . . . . . . . . . . . . . . . . . . . . . . . . 163type conversions in C++ . . . . . . . . . . . . . . . . . . . . . . 168Type.array . . . . . . . . . . . . . . . . . . . . . . . . . . . . . . . . . . 291Type.code . . . . . . . . . . . . . . . . . . . . . . . . . . . . . . . . . . . . 290Type.const . . . . . . . . . . . . . . . . . . . . . . . . . . . . . . . . . . 291Type.fields . . . . . . . . . . . . . . . . . . . . . . . . . . . . . . . . . 290Type.pointer . . . . . . . . . . . . . . . . . . . . . . . . . . . . . . . . 292Type.range . . . . . . . . . . . . . . . . . . . . . . . . . . . . . . . . . . 291Type.reference . . . . . . . . . . . . . . . . . . . . . . . . . . . . . . 292Type.sizeof . . . . . . . . . . . . . . . . . . . . . . . . . . . . . . . . . 290Type.strip_typedefs . . . . . . . . . . . . . . . . . . . . . . . . 292Type.tag . . . . . . . . . . . . . . . . . . . . . . . . . . . . . . . . . . . . . 290Type.target . . . . . . . . . . . . . . . . . . . . . . . . . . . . . . . . . 292Type.template_argument . . . . . . . . . . . . . . . . . . . . . 292Type.unqualified . . . . . . . . . . . . . . . . . . . . . . . . . . . . 291Type.volatile . . . . . . . . . . . . . . . . . . . . . . . . . . . . . . . 291TYPE_CODE_ARRAY . . . . . . . . . . . . . . . . . . . . . . . . . . . . . 292TYPE_CODE_BITSTRING . . . . . . . . . . . . . . . . . . . . . . . . 293TYPE_CODE_BOOL . . . . . . . . . . . . . . . . . . . . . . . . . . . . . . 293TYPE_CODE_CHAR . . . . . . . . . . . . . . . . . . . . . . . . . . . . . . 293TYPE_CODE_COMPLEX . . . . . . . . . . . . . . . . . . . . . . . . . . 293TYPE_CODE_DECFLOAT . . . . . . . . . . . . . . . . . . . . . . . . . 293TYPE_CODE_ENUM . . . . . . . . . . . . . . . . . . . . . . . . . . . . . . 292TYPE_CODE_ERROR . . . . . . . . . . . . . . . . . . . . . . . . . . . . . 293TYPE_CODE_FLAGS . . . . . . . . . . . . . . . . . . . . . . . . . . . . . 292TYPE_CODE_FLT . . . . . . . . . . . . . . . . . . . . . . . . . . . . . . . 293TYPE_CODE_FUNC . . . . . . . . . . . . . . . . . . . . . . . . . . . . . . 292TYPE_CODE_INT . . . . . . . . . . . . . . . . . . . . . . . . . . . . . . . 292TYPE_CODE_INTERNAL_FUNCTION . . . . . . . . . . . . . . . 293TYPE_CODE_MEMBERPTR . . . . . . . . . . . . . . . . . . . . . . . . 293TYPE_CODE_METHOD . . . . . . . . . . . . . . . . . . . . . . . . . . . . 293TYPE_CODE_METHODPTR . . . . . . . . . . . . . . . . . . . . . . . . 293TYPE_CODE_NAMESPACE . . . . . . . . . . . . . . . . . . . . . . . . 293TYPE_CODE_PTR . . . . . . . . . . . . . . . . . . . . . . . . . . . . . . . 292TYPE_CODE_RANGE . . . . . . . . . . . . . . . . . . . . . . . . . . . . . 293TYPE_CODE_REF . . . . . . . . . . . . . . . . . . . . . . . . . . . . . . . 293TYPE_CODE_SET . . . . . . . . . . . . . . . . . . . . . . . . . . . . . . . 293
594 Debugging with gdb
TYPE_CODE_STRING . . . . . . . . . . . . . . . . . . . . . . . . . . . . 293TYPE_CODE_STRUCT . . . . . . . . . . . . . . . . . . . . . . . . . . . . 292TYPE_CODE_TYPEDEF . . . . . . . . . . . . . . . . . . . . . . . . . . 293TYPE_CODE_UNION . . . . . . . . . . . . . . . . . . . . . . . . . . . . . 292TYPE_CODE_VOID . . . . . . . . . . . . . . . . . . . . . . . . . . . . . . 293types in Python . . . . . . . . . . . . . . . . . . . . . . . . . . . . . . 290
Uu (SingleKey TUI key) . . . . . . . . . . . . . . . . . . . . . . . . 331u (until) . . . . . . . . . . . . . . . . . . . . . . . . . . . . . . . . . . . . . . 63UDP port, target remote . . . . . . . . . . . . . . . . . . . . . 220undisplay . . . . . . . . . . . . . . . . . . . . . . . . . . . . . . . . . . . . 105undo (C-_ or C-x C-u) . . . . . . . . . . . . . . . . . . . . . . . 441union field name completion . . . . . . . . . . . . . . . . . . . 21unions in structures, printing . . . . . . . . . . . . . . . . . 112universal-argument () . . . . . . . . . . . . . . . . . . . . . . 440unix-filename-rubout () . . . . . . . . . . . . . . . . . . . . 439unix-line-discard (C-u) . . . . . . . . . . . . . . . . . . . . 439unix-word-rubout (C-w) . . . . . . . . . . . . . . . . . . . . . 439unknown address, locating . . . . . . . . . . . . . . . . . . . . 102unlink, file-i/o system call . . . . . . . . . . . . . . . . . . . . 514unlinked object files . . . . . . . . . . . . . . . . . . . . . . . . . . 201unload symbols from shared libraries . . . . . . . . . . 206unmap an overlay . . . . . . . . . . . . . . . . . . . . . . . . . . . . 157unmapped overlays . . . . . . . . . . . . . . . . . . . . . . . . . . . 155unset environment . . . . . . . . . . . . . . . . . . . . . . . . . . . . 30unset substitute-path . . . . . . . . . . . . . . . . . . . . . . . 92unset tdesc filename . . . . . . . . . . . . . . . . . . . . . . . . . . 537unsupported languages . . . . . . . . . . . . . . . . . . . . . . . 188until . . . . . . . . . . . . . . . . . . . . . . . . . . . . . . . . . . . . . . . . . 63until& . . . . . . . . . . . . . . . . . . . . . . . . . . . . . . . . . . . . . . . . 71unwind stack in called functions . . . . . . . . . . . . . . 199unwind stack in called functions with unhandled
exceptions . . . . . . . . . . . . . . . . . . . . . . . . . . . . . . . 199up . . . . . . . . . . . . . . . . . . . . . . . . . . . . . . . . . . . . . . . . . . . . . 84Up . . . . . . . . . . . . . . . . . . . . . . . . . . . . . . . . . . . . . . . . . . . . 330up-silently . . . . . . . . . . . . . . . . . . . . . . . . . . . . . . . . . . 85upcase-word (M-u) . . . . . . . . . . . . . . . . . . . . . . . . . . . 438update . . . . . . . . . . . . . . . . . . . . . . . . . . . . . . . . . . . . . . . 332upload, M32R . . . . . . . . . . . . . . . . . . . . . . . . . . . . . . . . 250use only software watchpoints . . . . . . . . . . . . . . . . . . 51use_dbt_break . . . . . . . . . . . . . . . . . . . . . . . . . . . . . . . 250use_debug_dma . . . . . . . . . . . . . . . . . . . . . . . . . . . . . . . 250use_ib_break . . . . . . . . . . . . . . . . . . . . . . . . . . . . . . . . 250use_mon_code . . . . . . . . . . . . . . . . . . . . . . . . . . . . . . . . 250user-defined command . . . . . . . . . . . . . . . . . . . . . . . . 275user-defined macros . . . . . . . . . . . . . . . . . . . . . . . . . . . 135user-defined variables . . . . . . . . . . . . . . . . . . . . . . . . . 117
Vv (SingleKey TUI key) . . . . . . . . . . . . . . . . . . . . . . . . 331value history . . . . . . . . . . . . . . . . . . . . . . . . . . . . . . . . . 116Value.__init__ . . . . . . . . . . . . . . . . . . . . . . . . . . . . . . 287Value.address . . . . . . . . . . . . . . . . . . . . . . . . . . . . . . . 287Value.cast . . . . . . . . . . . . . . . . . . . . . . . . . . . . . . . . . . 288Value.dereference . . . . . . . . . . . . . . . . . . . . . . . . . . 288
Value.dynamic_cast . . . . . . . . . . . . . . . . . . . . . . . . . 288Value.dynamic_type . . . . . . . . . . . . . . . . . . . . . . . . . 287Value.fetch_lazy . . . . . . . . . . . . . . . . . . . . . . . . . . . . 289Value.is_lazy . . . . . . . . . . . . . . . . . . . . . . . . . . . . . . . 287Value.is_optimized_out . . . . . . . . . . . . . . . . . . . . . 287Value.lazy_string . . . . . . . . . . . . . . . . . . . . . . . . . . 289Value.reinterpret_cast . . . . . . . . . . . . . . . . . . . . . 288Value.string . . . . . . . . . . . . . . . . . . . . . . . . . . . . . . . . 289Value.type . . . . . . . . . . . . . . . . . . . . . . . . . . . . . . . . . . 287values from inferior, with Python . . . . . . . . . . . . . 286variable name conflict . . . . . . . . . . . . . . . . . . . . . . . . . 99variable object debugging info . . . . . . . . . . . . . . . . 274variable objects in gdb/mi . . . . . . . . . . . . . . . . . . . . 375variable values, wrong . . . . . . . . . . . . . . . . . . . . . . . . 100variables, readline . . . . . . . . . . . . . . . . . . . . . . . . . . . . 426variables, setting . . . . . . . . . . . . . . . . . . . . . . . . . . . . . 195‘vAttach’ packet . . . . . . . . . . . . . . . . . . . . . . . . . . . . . . 473‘vCont’ packet . . . . . . . . . . . . . . . . . . . . . . . . . . . . . . . . 473‘vCont?’ packet . . . . . . . . . . . . . . . . . . . . . . . . . . . . . . . 474vector unit . . . . . . . . . . . . . . . . . . . . . . . . . . . . . . . . . . . 121vector, auxiliary . . . . . . . . . . . . . . . . . . . . . . . . . . . . . . 121verbose operation . . . . . . . . . . . . . . . . . . . . . . . . . . . . . 270verify remote memory image . . . . . . . . . . . . . . . . . . 104‘vFile’ packet . . . . . . . . . . . . . . . . . . . . . . . . . . . . . . . . 474‘vFlashDone’ packet . . . . . . . . . . . . . . . . . . . . . . . . . . 475‘vFlashErase’ packet . . . . . . . . . . . . . . . . . . . . . . . . . 474‘vFlashWrite’ packet . . . . . . . . . . . . . . . . . . . . . . . . . 475vi-editing-mode (M-C-j) . . . . . . . . . . . . . . . . . . . . 442virtual functions (C++) display . . . . . . . . . . . . . . . . 114visible-stats . . . . . . . . . . . . . . . . . . . . . . . . . . . . . . . 430‘vKill’ packet . . . . . . . . . . . . . . . . . . . . . . . . . . . . . . . . 475‘vRun’ packet . . . . . . . . . . . . . . . . . . . . . . . . . . . . . . . . . 475‘vStopped’ packet . . . . . . . . . . . . . . . . . . . . . . . . . . . . 476VTBL display . . . . . . . . . . . . . . . . . . . . . . . . . . . . . . . . 114VxWorks . . . . . . . . . . . . . . . . . . . . . . . . . . . . . . . . . . . . . 245vxworks-timeout . . . . . . . . . . . . . . . . . . . . . . . . . . . . . 246
Ww (SingleKey TUI key) . . . . . . . . . . . . . . . . . . . . . . . . 331watch . . . . . . . . . . . . . . . . . . . . . . . . . . . . . . . . . . . . . . . . . 50watchdog timer . . . . . . . . . . . . . . . . . . . . . . . . . . . . . . . 465watchpoint annotation . . . . . . . . . . . . . . . . . . . . . . 414watchpoints . . . . . . . . . . . . . . . . . . . . . . . . . . . . . . . . . . . 43watchpoints and threads . . . . . . . . . . . . . . . . . . . . . . . 52weak alias functions . . . . . . . . . . . . . . . . . . . . . . . . . . 199whatis . . . . . . . . . . . . . . . . . . . . . . . . . . . . . . . . . . . . . . . 190where . . . . . . . . . . . . . . . . . . . . . . . . . . . . . . . . . . . . . . . . . 82where to look for shared libraries . . . . . . . . . . . . . 206while . . . . . . . . . . . . . . . . . . . . . . . . . . . . . . . . . . . . . . . . 279while-stepping (tracepoints) . . . . . . . . . . . . . . . . 146wild pointer, interpreting . . . . . . . . . . . . . . . . . . . . . 107winheight . . . . . . . . . . . . . . . . . . . . . . . . . . . . . . . . . . . . 332word completion . . . . . . . . . . . . . . . . . . . . . . . . . . . . . . . 19working directory . . . . . . . . . . . . . . . . . . . . . . . . . . . . . . 92working directory (of your program) . . . . . . . . . . . 30working language . . . . . . . . . . . . . . . . . . . . . . . . . . . . . 161WP_ACCESS . . . . . . . . . . . . . . . . . . . . . . . . . . . . . . . . . . . . 318
Index 595
WP_READ . . . . . . . . . . . . . . . . . . . . . . . . . . . . . . . . . . . . . . 318WP_WRITE . . . . . . . . . . . . . . . . . . . . . . . . . . . . . . . . . . . . . 318write data into object, remote request . . . . . . . . 494write, file-i/o system call . . . . . . . . . . . . . . . . . . . . . 513writing a pretty-printer . . . . . . . . . . . . . . . . . . . . . . . 296writing convenience functions . . . . . . . . . . . . . . . . . 307writing into corefiles . . . . . . . . . . . . . . . . . . . . . . . . . . 199writing into executables . . . . . . . . . . . . . . . . . . . . . . 199writing JIT debug info readers . . . . . . . . . . . . . . . . 417wrong values . . . . . . . . . . . . . . . . . . . . . . . . . . . . . . . . . 100
Xx (examine memory) . . . . . . . . . . . . . . . . . . . . . . . . . . 103x command, default address . . . . . . . . . . . . . . . . . . . 93‘X’ packet . . . . . . . . . . . . . . . . . . . . . . . . . . . . . . . . . . . . 476x(examine), and info line . . . . . . . . . . . . . . . . . . . . 93Xilinx MicroBlaze . . . . . . . . . . . . . . . . . . . . . . . . . . . . 250XInclude . . . . . . . . . . . . . . . . . . . . . . . . . . . . . . . . . . . . . 538XMD, Xilinx Microprocessor Debugger . . . . . . . 250XML parser debugging . . . . . . . . . . . . . . . . . . . . . . . 274
Yyank (C-y) . . . . . . . . . . . . . . . . . . . . . . . . . . . . . . . . . . . 440yank-last-arg (M-. or M-_) . . . . . . . . . . . . . . . . . 437yank-nth-arg (M-C-y) . . . . . . . . . . . . . . . . . . . . . . . 437yank-pop (M-y) . . . . . . . . . . . . . . . . . . . . . . . . . . . . . . 440yanking text . . . . . . . . . . . . . . . . . . . . . . . . . . . . . . . . . . 424
Z‘z’ packet . . . . . . . . . . . . . . . . . . . . . . . . . . . . . . . . . . . . 476‘Z’ packets . . . . . . . . . . . . . . . . . . . . . . . . . . . . . . . . . . . . 476‘z0’ packet . . . . . . . . . . . . . . . . . . . . . . . . . . . . . . . . . . . 476‘Z0’ packet . . . . . . . . . . . . . . . . . . . . . . . . . . . . . . . . . . . 476‘z1’ packet . . . . . . . . . . . . . . . . . . . . . . . . . . . . . . . . . . . 477‘Z1’ packet . . . . . . . . . . . . . . . . . . . . . . . . . . . . . . . . . . . 477‘z2’ packet . . . . . . . . . . . . . . . . . . . . . . . . . . . . . . . . . . . 477‘Z2’ packet . . . . . . . . . . . . . . . . . . . . . . . . . . . . . . . . . . . 477‘z3’ packet . . . . . . . . . . . . . . . . . . . . . . . . . . . . . . . . . . . 477‘Z3’ packet . . . . . . . . . . . . . . . . . . . . . . . . . . . . . . . . . . . 477‘z4’ packet . . . . . . . . . . . . . . . . . . . . . . . . . . . . . . . . . . . 477‘Z4’ packet . . . . . . . . . . . . . . . . . . . . . . . . . . . . . . . . . . . 477Z8000 . . . . . . . . . . . . . . . . . . . . . . . . . . . . . . . . . . . . . . . . 258Zilog Z8000 simulator . . . . . . . . . . . . . . . . . . . . . . . . 258

596 Debugging with gdb
The body of this manual is set incmr10 at 10.95pt,
with headings in cmb10 at 10.95ptand examples in cmtt10 at 10.95pt.
cmti10 at 10.95pt ,cmb10 at 10.95pt, and
cmsl10 at 10.95ptare used for emphasis.


![MIT OpenCourseWare 6.189 Multicore …...Running Processes Under GDB ppu-gdb ./hello-world (gdb) run [args] … (gdb) quit export SPU_INFO=1 for extra information about threads Phil](https://static.fdocuments.net/doc/165x107/5f19ba63a6b0b957e67c7a59/mit-opencourseware-6189-multicore-running-processes-under-gdb-ppu-gdb-hello-world.jpg)