DEBUGGING IN THE REAL WORLD 15-441: Recitation 4.
18
DEBUGGING IN THE REAL WORLD 15-441: Recitation 4
-
Upload
marvin-ball -
Category
Documents
-
view
217 -
download
0
Transcript of DEBUGGING IN THE REAL WORLD 15-441: Recitation 4.

DEBUGGING IN THE REAL WORLD15-441: Recitation 4

Outline
What can go wrong? How can we avoid errors? What tools are available to debug
errors? Valgrind GDB

What can go wrong?
Project 1: IRC server, what are our components? managing connections (e.g., sockets) handling clients (e.g., client pool) handling data (e.g., buffers and strings
manipulation) IRC protocol (e.g., RFC … JOIN, PART, MSG)
What kind of errors can we have? (2 major types) Logical error vs. fault (crashing)
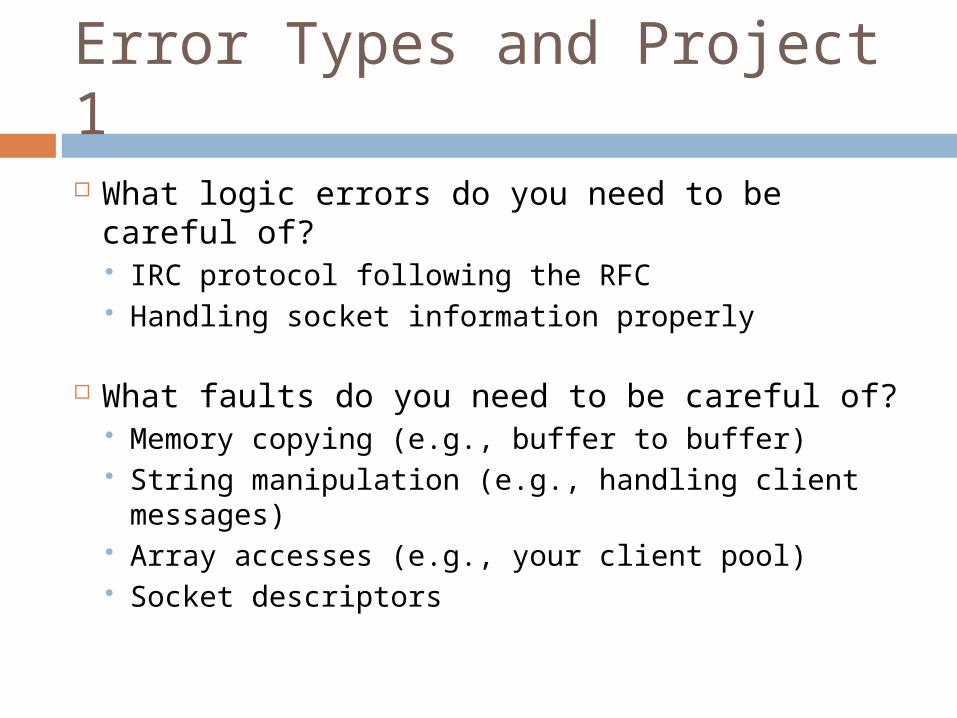
Error Types and Project 1
What logic errors do you need to be careful of? IRC protocol following the RFC Handling socket information properly
What faults do you need to be careful of? Memory copying (e.g., buffer to buffer) String manipulation (e.g., handling client
messages) Array accesses (e.g., your client pool) Socket descriptors

Save yourself a headache!
First and foremost: practice smart programming to avoid faults.
CHECK RETURN CODES! Bad: read(fd, &buffer, nbtr); Good: if((nbytes=read(fd, &buffer, nbtr))==-1)
Use safe functions: snprintf(good) vs. sprintf(bad)
Check pointers before use: if(clientfd!=NULL) { … }
Outline
What can go wrong? How can we avoid errors? What tools are available to debug
errors? valgrind strace GDB
Reality: errors will happen
We are all human (I think!), bugs will occur Goal: find and terminate them as fast as
possible
Don’t: toss printf()’s everywhere and hope for the best, this takes a long time
Do: use a great set of tools for debugging Saves time saves points! Saves headache saves sanity!

Outline
What can go wrong? How can we avoid errors? What tools are available to debug
errors? Valgrind GDB

Valgrind debugging tool
Goal: detect memory errors Accesses outside of memory bounds Memory leaks
Great for finding errors that would only show during harsh test cases Yes, we will use harsher test cases than
checkpoint 1 and checkpoint 2 for final grading!

Valgrind: Example Errors
Can you find two errors in this program?
#include <stdlib.h>
void f(void) { int* x = malloc(10 * sizeof(int)); x[10] = 0;}
int main(void) { f(); return 0; }
1. Invalid memory access
2. Memory never free()’d

Running Example in Valgrind Running valgrind with the program:
valgrind --leak-check=yes myprog arg1 arg2
Invalid access output (error 1):
Memory leak output (error 2):==19182== 40 bytes in 1 blocks are definitely lost in loss record 1 of 1 ==19182== at 0x1B8FF5CD: malloc (vg_replace_malloc.c:130) ==19182== by 0x8048385: f (a.c:5) ==19182== by 0x80483AB: main (a.c:11)
==19182== Invalid write of size 4 ==19182== at 0x804838F: f (example.c:6) ==19182== by 0x80483AB: main (example.c:11) Process ID
Where the error occurs
Size of the leak

Outline
What can go wrong? How can we avoid errors? What tools are available to debug
errors? Valgrind GDB
GDB: GNU Project Debugger
The best debugging tool for your projects! Segfaulting? No problem.
You can step through your program, line by line and monitor any memory!
Seriously, it doesn’t get any better than this

How to use GDB
Two major ways: Read a core dump step through a program
Getting a segfault and just want to determine where it happened? Get a core file, run: ulimit –c unlimited Cause the program to segfault
MUST MUST MUST: enable –g flag when compiling

GDB: reading a core file
Enable core dumping and run:
Open the core in GDB:
$ ulimit -c unlimited$ ./cache_sim config.example0 < trace.example0….Segmentation fault (core dumped)
$ gdb cache_sim core…#0 0x08049bae in memory::load (…, …) at cache_sim.cc:252252 if(!d_tag_store[i][index].valid) {(gdb) backtrace#0 0x08049bae in memory::load (…, …) at cache_sim.cc:252#1 0x0804a3e2 in handle_load_reference (…) at cache_sim.cc:366#2 0x0804b63e in main (…, …) at cache_sim.cc:562
Function where the segfault occurs (load)
Line where the segfault occurs
How we got there

GDB: Being interactive w/ EMACS You can step through your code with EMACS
You use VIM? No problem, so do I … use EMACS just to debug!
How to run in EMACS: emacs <source_file.c> ctrl+x+3 (splits screen) ctrl+x+o (moves cursor to right side of screen) esc+x (brings up line at bottom) gdb (type in bottom and hit enter) hit enter 1 more time! (fix executable file name
if needed)

GDB: useful commands
Useful commands for you to know: Start the program: run <arg1> <arg2> … Create breakpoint: break <line> OR break
<function> Goto next line: next Step into a function: step Check a variable value: print <variable
name> Display a variable value: display <variable
name>

Wrapup: Questions anyone?
Questions on debugging? Valgrind, GDB…
Questions on project 1? IRC protocol, sockets, client pool, buffers…
General course questions? Ethernet, wireless, physical layer,
application layer…