Debt Investor Update Full Year 2019 Strong performance in 2019 · Frequent benchmark issuer in EUR,...
22
Debt Investor Update Full Year 2019 Strong performance in 2019
Transcript of Debt Investor Update Full Year 2019 Strong performance in 2019 · Frequent benchmark issuer in EUR,...

Debt Investor Update Full Year 2019
Strong performance in 2019

2
Disclaimer
This presentation is not an offer or invitation to subscribe for or purchase any securities in any jurisdiction, including any jurisdiction of
the United States. Securities may not be offered or sold in the United States absent registration or pursuant to an available exemption
from registration under the U.S. Securities Act. Deutsche Pfandbriefbank AG (pbb) does not intend to conduct a public offering of
securities in the United States.
No warranty is given as to the accuracy or completeness of the information in this presentation. You must make your own
independent investigation and appraisal of the business and financial condition of pbb and its direct and indirect subsidiaries and their
securities. Nothing in this presentation shall form the basis of any contract or commitment whatsoever.
This presentation may only be made available, distributed or passed on to persons in the United Kingdom in circumstances in which
section 21(1) of the Financial Services and Markets Act 2000 does not apply.
This presentation may only be made available, distributed or passed on to persons in Australia who qualify as 'wholesale clients' as
defined in section 761G of the Australian Corporations Act.
This presentation is furnished to you solely for your information. You may not reproduce it or redistribute to any other person.
This presentation contains forward-looking statements based on calculations, estimates and assumptions made by the company’s top
management and external advisors and are believed warranted. These statements may be identified by such words as ‘may’, ‘plans’,
‘expects’, ‘believes’ and similar expressions, or by their context and are made on the basis of current knowledge and assumptions.
Various factors could cause actual future results, performance or events to differ materially from those described in these statements.
Such factors include general economic conditions, the conditions of the financial markets in Germany, in Europe, in the United States
and elsewhere, the performance of pbb’s core markets and changes in laws and regulations. No obligation is assumed to update any
forward-looking statements.
By participating in this presentation or by accepting any copy of the slides presented, you agree to be bound by the noted limitations.
Investor Update based on annual results 2019 (IFRS, pbb Group, audited), March 2020

Business model & strategy
pbb is a leading commercial real estate lender with a complementary
public investment finance business
LENDING FUNDING
Stable and well diversified
funding base
Pfandbrief (leading
issuer)
Senior unsecured bonds
(preferred/non-preferred)
Frequent benchmark issuer
in EUR, USD, GBP, SEK
and CHF plus private
placements
Retail deposits (online)
Specialised
on-balance sheet lender
European franchise,
complemented by the US
High risk standards and
focus on risk management
Key figures (IFRS) 31/12/19
Total assets € 56.8 bn
Total equity € 3.2 bn
RWA € 17.7 bn
CET1 ratio1 15.2%
Leverage ratio1 5.4%
RoE before taxes 6.9%
FTE 752
Pfandbrief-eligible
senior loans, REF portfolio:
avg. LTV 53%
Structuring expertise for
complex/large transactions
~150 deals p.a.
Avg. deal size € 50-60 mn
Long standing client
relationships
Real Estate Finance (REF)
Partner to professional national and international
real estate investors
One of the top commercial real estate finance
banks in Germany and Europe
Strategic portfolio – moderate growth targeted
Public Investment Finance (PIF)
Partner to public sector for project related
infrastructure investments2 and ECA guaranteed
export financing
Contribution business (earnings stabilisation,
cost/capital synergies)
Strategic portfolio in “hold” mode
50% 9% Germany USA
12%
Poland 4%
UK
11%
France
Sweden 3%
Austria 2%
8%
Czech Republic 1% Other Europe
46%
19%
16%
Mixed use 2%
Logistics/
storage
Office
Retail
Residential
Other 3% Hotel 5%
10%
Portfolio 31/12/19: € 29.8 bn (EaD)
52%
22%
14%
Nordics 2%
UK 2%
France Spain
Rest of World 1%
Germany
Austria 4%
Other Europe 4%
50%
27%
19%
PSE
Reg. Gov.
(incl. related)
Sov.
(incl. related)
Other 3%
Portfolio 31/12/19: € 7.1 bn (EaD)
1 Incl. full-year result, post proposed dividend 2019 2 incl. public housing, utilities and waste disposal, health care and nursing care properties, childcare and educational facilities
Debt Investors Considerable MREL buffer
Strong capital base
High quality cover pools
High portfolio quality and
risk standards
Strong operating
performance
Headquarter
Branches/Rep. Offices
USA
Regional presence (10 offices)
Investor Update based on annual results 2019 (IFRS, pbb Group, audited), March 2020 3

Pre-tax profit € mn (IFRS)
Highlights
Operating and financial overview
New business € bn (commitments, incl. extensions >1 y)
Net interest and commission income € mn (IFRS)
Note: Figures may not add up due to rounding 1 New definition: CIR = (GAE + net income from write-downs and write-ups on non-financial assets)/operating income 2 Taking into account AT1 coupon (pro-rata 2018: € 12 mn; 2019: € 17 mn)
General and admin. expenses € mn (IFRS)
Net income from risk provisioning € mn (IFRS)
Portfolio € bn (financing volumes)
1.8
4.2
2.6
2.4
2.4
2.6
4.7
2017
2.1
2.0
2018
2.1
2.6
2.0
2019
11.6 10.5
9.3
Q1
Q4
Q3
Q2
RoE b.t.
2017 2018 2019
7.3% 7.1%2 6.9%2
47 48 48
56 74 69
51 49 70
50 44
216
29
215
2017 2018 2019
204
Q2
Q3
Q4
Q1
73% 70% 72%
2018
12.1
24.9
13.8
2019
7.0
13.2
2017
26.8
6.4 6.3
27.1
45.7 46.4 45.5
VP PIF REF
Strategic
portfolio
Share of
strategic
portfolio
100 108 117
101 115 115
103 115 113
111 118 119
2017 2019
Q2
2018
Q3
Q4
415
Q1
456 464
43% 47% 44%
2018
45 44 46
47 44 47
49 48 48
58 57 61
199
Q4
2017 2018
Q2
2019
Q1
Q3
193 202
CIR1
-10 -14
-49
2017 2018 2019
Investor Update based on annual results 2019 (IFRS, pbb Group, audited), March 2020 4

Key drivers 2019:
New business volume stays on solid level while pbb remains highly
selective – in line with guidance of € 8.5-9.5 bn
REF – core portfolio with moderate growth strategy
Continued conservative approach
Avg. LTV 58%2
Cautious in UK and on Retail
Supplemented by USA, Office and Residential
Avg. REF gross interest margin stable at ~155 bp (2018: ~155 bp)
PIF – portfolio on hold with low new business volume
(2019: € 0.3 bn; 2018: € 1.0 bn)
New
bu
sin
es
s
(Com
mitm
ents
, in
cl.
exte
nsio
ns >
1ye
ar)
Note: Figures may not add up due to rounding 1 Legal maturities 2 New commitments; avg. LTV (extensions): 2019: 55%; 2018: 57% 3 Austria, Italy, Luxembourg, Netherlands, Switzerland
New business
REF new business volume of € 9.0 bn in line with guidance – avg. REF gross interest margin
stable at ~155 bp y-o-y
FY18 9M/19 FY19
Total volume (€ bn) 9.5 6.9 9.0
thereof:
Extensions >1 year 2.2 1.5 1.9
No. of deals 185 115 155
Avg. maturity (years)1 ~4.7 ~4.6 ~4.6
Avg. LTV (%)2 59 59 58
Avg. gross interest margin (bp) ~155 >150 ~155
FY19: € 9.0 bn FY19: € 9.0 bn
50%
22%
12%
7%
Office
Hotel/Leisure 2%
Retail
Logistics/
storage 7%
Mixed use/
other
Residential
Po
rtfo
lio
(E
aD
, B
asel III)
50%
12%
11%
9%
8%
Germany
UK
USA
France
Other
CEE 6%
Nordics 5%
46%
19%
16%
Residential
Office
Hotel 5%
Retail
Logistics/
storage 10%
Mixed use/other 4%
31/12/19: € 29.8 bn 31/12/19: € 29.8 bn
Regions Property types
47%
15%
12%
7%
8%
Germany
France
USA
Nordics 5%
CEE 6%
UK
Other 3
REF new business
24.9 26.8 27.1
4.0
1.9
3.8
2017
2.3
2.6
2.0
1.9
1.9 1.7
2018
2.1
2.5
2.5
2019
Q4
Q3
Q2
Q1
10.7 9.5 9.0
REF New business € bn (commitments, incl. extensions >1 yr)
Financing
volume
Investor Update based on annual results 2019 (IFRS, pbb Group, audited), March 2020 5

Portfolio
Continued high portfolio quality with an average LTV of 53%;
Non-performing loans up in 2019, but still on low level
REF Portfolio: Avg. weighted LTVs % (commitments)1
Non-performing loans € mn (EaD, Basel III)
0.6%
0.9%
0.6%
332 380 495
16
09/19 12/18
15
12/19
15 348 395
510
Workout2
Restructuring3
NPL
ratio4
Investor Update based on annual results 2019 (IFRS, pbb Group, audited), March 2020
Note: Figures may not add up due to rounding 1 Based on performing investment loans only 2 Internal PD class 30: No signs that the deal will recover soon, compulsory measures necessary 3 Internal PD class 28+29: Payments more than 90 days overdue or criteria acc. to respective policy apply 4 NPL ratio = NPL volume / total assets 5 prior to the Brexit referendum in 2016
53%
58%
12/155
54%
12/13 09/19 12/19
64%
Avg. LTV:
Retail properties
19%
UK
16%
12%
28% 29%
16%
12/13
12/19
12/155
REF Portfolio:
Share of UK and retail properties reduced
% (EaD, Basel III)
6
54%
Germany Rest of
Europe
UK France
50%
USA Sweden Poland
09/19: Ø 54%
12/19: Ø 53%
53% 53% 52% 54% 56% 53% 51%
55% 58% 56% 56% 55%
09/19
12/19

Capital
Capitalisation remains strong – as expected and already communicated RWA increase
in Q4 due to LGD parameter recalibration; EBA and Basel IV anticipated
Basel III: Equity and capital ratios
(IFRS)
Note: Figures may not add up due to rounding 1 Incl. full-year result, post dividend 2018 2 Excl. interim result 3 Incl. full-year result, post proposed dividend 2019
Basel III: RWA
€ bn (IFRS) Key drivers Q4/19:
Risk weights geared to expected requirements from EBA and Basel IV
Recalibration of LGD parameters as of 31/12/2019 towards expected
Basel IV levels
Transfer of parts of the portfolio into standard approach (KSA),
predominantly affecting public sector assets
RWA increase in line with expected and communicated range of € 4-5 bn
(vs. Q2/19: € +4.1 bn; vs. Q3/19: € +3.4 bn)
14.6
12/18 06/19 12/19 09/19
13.6 14.3
17.7
SREP requirements 2020:
Requirements for CET1 and Own funds unchanged:
CET 1 ratio: 9.5% (2019: 9.5%)
Own funds ratio: 13.0% (2019: 13.0%)
Anticipated countercyclical buffer increased from 35bp to 45bp Capital ratios in %
12/181 09/192 12/193
CET 1 18.5 18.3 15.2
Tier 1 20.5 20.4 16.9
Own funds 24.9 24.8 20.4
Leverage ratio 5.3 5.1 5.4
Capital in € bn 12/181 09/192 12/193
CET 1 2.7 2.6 2.7
AT 1 0.3 0.3 0.3
Tier 2 0.6 0.6 0.6
Total Equity 3.6 3.6 3.6
+4.1 +3.4
Investor Update based on annual results 2019 (IFRS, pbb Group, audited), March 2020 7

SP4
Funding
Ambition level for Own Funds and Eligible Liabilities of more than 8 % TLOF (in € as of 31/12/2019)
AT1
capital and
bail-in stack
SNP
remaining
after 3 years ...5 years ...10 years
Subord.3
CET15
€ ~ 4.0 bn 8 % TLOF
€ ~ 15 bn
€ ~ 9.6 bn
€ ~ 3.6 bn
Substantial buffer for Senior Preferred
(SP) investors due to high volume of
capital instruments and Senior Non-
Preferred (SNP) liabilities
Existing Senior Non-Preferred liabilities
have long remaining terms
SP is expected to be the prevailing
senior product in the near-term, but
SNP will remain an element of pbb´s
funding strategy
pbb has a MREL-ambition level
of > 8 % TLOF
Regulatory requirements (SREP,
MREL etc.) are comfortably met
Own Funds and
Eligible Liabilities
€ ~ 8.5 bn
SNP2
> 1 Y
AT1
CET1
T2
Composition of
Liabilities (31/12/2019)
Rundown MREL1
(31/12/2019)
Other
1 pbb has set its ambition level at > 8% TLOF. As of 31 Dec 2019, MREL eligible items amounted to ~17% TLOF / ~48% RWA 2 MREL-eligible Senior Non-Preferred Debt >1Y according to legal maturities 3 Nominal amount of Tier 2 instruments; the capital stack
includes € 300 mn AT1 issuance callable in 2023 and € 300 mn T2 issuance callable in 2022 4 Senior Preferred, structured unsecured and corporate deposits (excl. protected deposits) 5 CET1 assumed to be constant
Investor Update based on annual results 2019 (IFRS, pbb Group, audited), March 2020 8

Funding
Increased funding volumes in line with plan
High share of foreign currencies reducing derivative volume
9
0.5
0.8
1.1
0.3
0.7
Public
3.6
2.9
Mortgage Public Unsecured
2.1
Mortgage
1.9
<0.1
1.7
Unsecured
3.6
1.6
2.9
0.3
2019: € 6.7 bn
Tenor (av, yrs)3
6.7 16.1 5.9
15 21 74 Spread (av, bp)2
Note: Figures may not add up due to rounding 1 Excl. retail deposit business 2 vs. 3M Euribor 3 Initial weighted average maturity 4 Excl. AT1 issuance 5 Initial weighted average maturity of term deposits
New long-term funding1
€ bn
Pfandbrief Pfandbrief
2018: € 5.2 bn4
7.6 20 6.4
6 0 42
Private placements
Benchmark issuances
Senior Unsecured
€ 1.25 bn Senior Preferred raised with two €-Benchmarks (4y
and 5y)
CHF-Benchmark 125 mn Senior Preferred issued (4y)
GBP-Benchmark 250 mn issued (3y). pbb was the first
German bank issuing a Senior Preferred Benchmark in
Sterling.
Strong private placement activity including € 1.6 bn and
SEK 2.5 bn Senior Preferred as well as € 128 mn Senior Non-
Preferred
pbb direkt
Total volume reduced to € 2.8 bn (12/18: € 3.0 bn) to optimize
funding costs
Average maturity5 increased to 4.2 years (12/18: 4.0 yrs)
Funding structure and liquidity
ALM profile and liquidity position remain comfortable
(NSFR >100%; LCR >150%)
Pfandbriefe
Pfandbrief volume dominated by Benchmarks
€ 1.55 bn Mortgage Pfandbriefe issued, comprising two
€ 500 mn Benchmarks (5y and 6y) and several taps
$ 650 mn 3y Mortgage Pfandbrief issued as Benchmark
With SEK 3.7 bn (3y and 4y) pbb is the largest Pfandbrief
issuer in SEK
One existing Public Sector Pfandbrief Benchmark tapped with
€ 250 mn
Investor Update based on annual results 2019 (IFRS, pbb Group, audited), March 2020

10
Funding
Investment opportunities
Pfandbrief Investments
One of the largest Pfandbrief issuers with 16 € benchmarks outstanding and a strong presence in the GBP, SEK and USD market
Benchmarks issued with maturities up to 2035
Very low weighted average LTV of 34.28% in the Mortgage Cover Pool (based on market value)
Private Placements starting with € 1 mn and maturities up to 30 years
Available currencies: EUR, GBP, SEK, USD
Unsecured Investments
2 € senior preferred and 3 € senior non preferred benchmarks outstanding
Private Placements starting with € 1 mn and maturities up to 30 years
Available currencies (e.g. EUR, GBP, SEK, USD, CHF, NOK, YEN, CZK)
Senior “preferred” (rated A-) and “non preferred” (rated BBB-) products
Focus on the development of the funding franchise
New debt product “Senior Preferred” opens the access to a larger investor base.
Co-operation with Origin for the MTN placement and Deposit Solutions for our retail deposit brand pbb direkt in order to
stream line internal processes.
Investor Update based on annual results 2019 (IFRS, pbb Group, audited), March 2020

Outlook 2020
Note: Figures may not add up due to rounding 1 Incl. extensions > 1 year 2 Incl. full-year result, post (proposed) dividend
Operating trends 2018 2019 Guidance 2020
Real Estate Finance (REF)
New business volume1 (€ bn) 9.5 9.0 € 8.0-9.0 bn
Avg. gross margin (bp) ~155 ~155 Slightly lower
Financing volume (€ bn) 26.8 27.1 Moderate increase (strategic portfolio)
Public Investment Finance (PIF)
Avg. gross margin (bp) >60 >80 Stable (strategic portfolio in “hold” mode)
Financing volume (€ bn) 6.4 6.3
Value Portfolio (VP)
Financing volume (€ bn) 13.1 12.1 < € 11.5bn (non-strategic portfolio in run-down mode)
Income statement (IFRS, EUR mn) 2018 2019 Guidance 2020
Net interest and commission income 456 464 Largely stable
Loan-loss provisions -14 -49 Stable; 15-20bp EL on REF financing volume
General administrative expenses -193 -202 Stable
Pre-tax profit 215 216 € 180-200 mn
Key ratios (%) 2018 2019 Guidance 2020
RoE before taxes 7.1 6.9 5.5-6.5%
RoE after taxes 5.9 5.7 4.0-5.0%
CIR 44.2 43.5 Slightly higher
CET1 ratio2 18.5 15.2 Significantly above SREP requirement of 9.5% + countercyclical buffer of
0.45% (2019: 9.5% + 0.35%)
Investor Update based on annual results 2019 (IFRS, pbb Group, audited), March 2020 11

12 Investor Update based on annual results 2019 (IFRS, pbb Group, audited), March 2020
Funding / Debt Investor Relations
Götz Michl +49 (0)6196 9990 2931
Silvio Bardeschi + 49 (0)6196 9990 2934
Funding Desk [email protected]
Webpage: www.pfandbriefbank.com/investors/debt-investors.html
Contact details
© Deutsche Pfandbriefbank AG
Parkring 28
85748 Garching/Germany
+49 (0) 89 28 80-0
www.pfandbriefbank.com

Appendix
13 Investor Update based on annual results 2019 (IFRS, pbb Group, audited), March 2020

Key figures
pbb Group
Income statement (€ mn) 2017 Q1/18 Q2/18 Q3/18 Q4/18 2018 Q1/19 Q2/19 Q3/19 Q4/19 2019
Net interest income 407 107 113 114 116 450 116 113 112 117 458
Net fee and commission income 8 1 2 1 2 6 1 2 1 2 6
Net income from fair value measurement -5 - 4 -2 -11 -9 -2 -5 5 -5 -7
Net income from realisations 45 9 6 8 9 32 6 10 15 17 48
Net income from hedge accounting -1 -1 -1 1 - -1 -1 - -2 1 -2
Net other operating income -1 -4 -5 -3 5 -7 -1 -1 2 3 3
Operating Income 453 112 119 119 121 471 119 119 133 135 506
Net income from risk provisioning -10 4 4 -17 -5 -14 -1 1 -10 -39 -49
General and administrative expenses -199 -44 -44 -48 -57 -193 -46 -47 -48 -61 -202
Expenses from bank levies and similar dues -28 -21 -1 -1 -2 -25 -21 -1 -1 -1 -24
Net income from write-downs and write-ups on non-
financial assets -14 -3 -4 -4 -4 -15 -4 -4 -5 -5 -18
Net income from restructuring 2 - - - --9 -9 1 1 1 - 3
Pre-tax profit 204 48 74 49 44 215 48 69 70 29 216
Income taxes -22 -9 -14 -10 -3 -36 -8 -10 -14 -5 -37
Net income 182 39 60 39 41 179 40 59 56 24 179
Key ratios (%) 2017 Q1/18 Q2/18 Q3/18 Q4/18 2018 Q1/19 Q2/19 Q3/19 Q4/19 2019
CIR1 47.0 42.0 40.3 43.7 50.4 44.2 42.0 42.9 39.8 48.9 43.5
RoE before tax 7.3 6.7 9.5 6.3 5.5 7.1 6.0 9.0 9.2 3.4 6.9
RoE after tax 6.5 5.4 7.6 4.9 5.1 5.9 4.9 7.6 7.3 2.7 5.7
Balance sheet (€ bn) 12/17 03/18 06/18 09/18 12/18 12/18 03/19 06/19 09/19 12/19 12/19
Total assets 58.0 57.6 57.8 57.3 57.8 57.8 60.3 60.1 59.8 56.8 56.8
Equity 2.9 3.0 3.2 3.2 3.3 3.3 3.3 3.2 3.2 3.2 3.2
Financing volume 45.7 46.3 45.9 45.7 46.4 46.4 47.1 46.4 46.3 45.5 45.5
Regulatory capital ratios2 12/17 03/18 06/18 09/18 12/18 12/18 03/19 06/19 09/19 12/19 12/19
RWA (€ bn) 14.5 14.2 13.7 13.5 14.6 14.6 14.3 13.6 14.3 17.7 17.7
CET 1 ratio – phase in (%) 17.6 18.84 19.45 19.75 18.53 18.53 18.86 19.47 18.37 15.28 15.28
Personnel 12/17 03/18 06/18 09/18 12/18 12/18 03/19 06/19 09/19 12/19 12/19
Employees (FTE) 744 733 747 747 750 750 743 746 750 752 752
Note: annual results 2017, 2018 and 2019 audited, interim results unaudited (Q1/Q3 2018 and 2019), interim results Q2 2018 and 2019 reviewed 1 CIR = (GAE + net income from write-downs and write-ups on non-financial assets)/operating income 2 Basel III transition rules 3 Incl. full-year result, post dividend 2018 4 Post dividend for 2017, incl. interim result Q1/18, post max. calc. dividend acc. to ECB methodology 5 Incl. interim result Q1/18, post max. calc. dividend acc. to ECB methodology 6 Excl. interim result, post dividend 2018 7 Excl. interim result 8 Incl. full-year result, post proposed dividend 2019
Investor Update based on annual results 2019 (IFRS, pbb Group, audited), March 2020 14
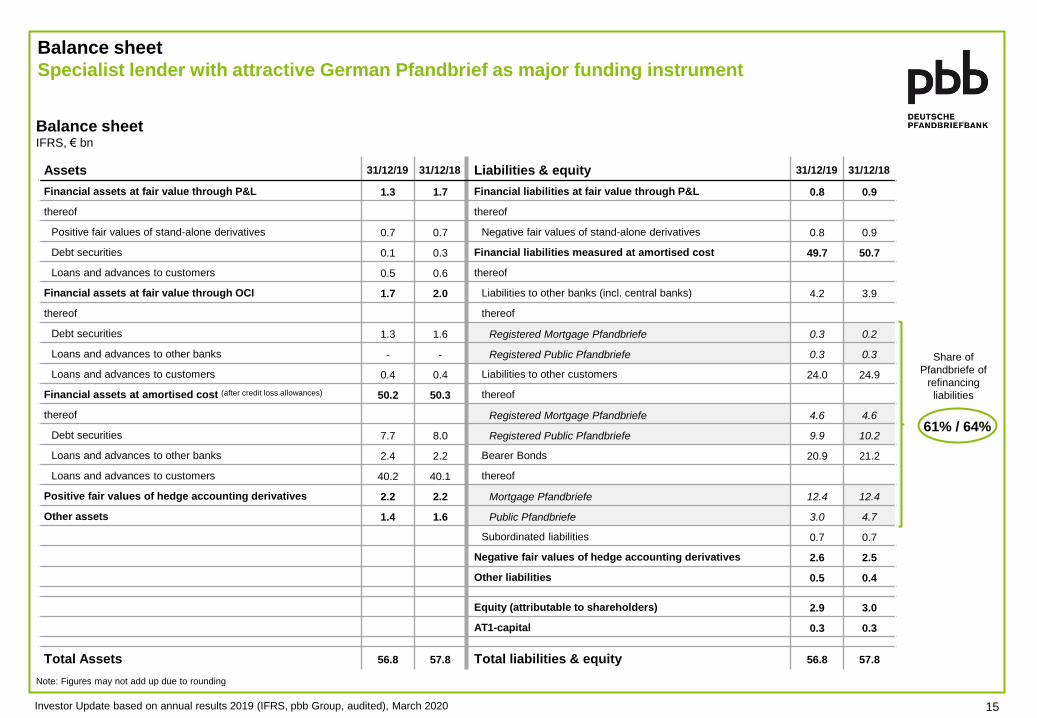
Balance sheet
Specialist lender with attractive German Pfandbrief as major funding instrument
Balance sheet IFRS, € bn
Note: Figures may not add up due to rounding
Assets 31/12/19 31/12/18 Liabilities & equity 31/12/19 31/12/18
Financial assets at fair value through P&L 1.3 1.7 Financial liabilities at fair value through P&L 0.8 0.9
thereof thereof
Positive fair values of stand-alone derivatives 0.7 0.7 Negative fair values of stand-alone derivatives 0.8 0.9
Debt securities 0.1 0.3 Financial liabilities measured at amortised cost 49.7 50.7
Loans and advances to customers 0.5 0.6 thereof
Financial assets at fair value through OCI 1.7 2.0 Liabilities to other banks (incl. central banks) 4.2 3.9
thereof thereof
Debt securities 1.3 1.6 Registered Mortgage Pfandbriefe 0.3 0.2
Loans and advances to other banks - - Registered Public Pfandbriefe 0.3 0.3
Loans and advances to customers 0.4 0.4 Liabilities to other customers 24.0 24.9
Financial assets at amortised cost (after credit loss allowances) 50.2 50.3 thereof
thereof Registered Mortgage Pfandbriefe 4.6 4.6
Debt securities 7.7 8.0 Registered Public Pfandbriefe 9.9 10.2
Loans and advances to other banks 2.4 2.2 Bearer Bonds 20.9 21.2
Loans and advances to customers 40.2 40.1 thereof
Positive fair values of hedge accounting derivatives 2.2 2.2 Mortgage Pfandbriefe 12.4 12.4
Other assets 1.4 1.6 Public Pfandbriefe 3.0 4.7
Subordinated liabilities 0.7 0.7
Negative fair values of hedge accounting derivatives 2.6 2.5
Other liabilities 0.5 0.4
Equity (attributable to shareholders) 2.9 3.0
AT1-capital 0.3 0.3
Total Assets 56.8 57.8 Total liabilities & equity 56.8 57.8
61% / 64%
Share of
Pfandbriefe of
refinancing
liabilities
Investor Update based on annual results 2019 (IFRS, pbb Group, audited), March 2020 15

Markets
Low interest rate environment continues to support and prolong CRE cycle – slowing
economic growth and individual market risks require even more cautious approach
1 Source: Property Market Analysis
European and US CRE investment volumes remain on
solid levels
Investment volumes recovered in Q2 and Q3 after a
weak Q1, which was driven by slowing economic
growth, high prices, challenges in sourcing suitable
properties, interest rate increases in the US and
(geo)political uncertainties
Commercial real estate investments in Europe
reached € 65 bn in Q3/19, 1.5% above Q3/18 and
above 10-year average
Solid take up levels, office vacancy remains on
low level
But: yields for prime office properties at historical
lows in most core markets which increases
valuation risks; yields on UK retail properties
already increasing with significant valuation
discounts to follow
US CRE transaction volume reached $ 157 bn in Q3,
slightly below y-o-y number – limited room for further
growth
Slowing economic growth and individual market risks
(e.g. Brexit, retail sector, co-working space, corona virus,
etc.) urge continued higher caution – pbb remains highly
selective, especially on
UK (in most property types)
Retail (structural change/online business)
temporarily also hotel
European CRE Investment volume
(€ bn)
Retail prime yields
in %
Development retail rents
2010 = 100
Office prime yields
in %
Office vacancy
in %
Development office rents
2010 = 100
0
50
100
150
200
250
300
0
30
60
90
2006Q1
2007Q1
2008Q1
2009Q1
2010Q1
2011Q1
2012Q1
2013Q1
2014Q1
2015Q1
2016Q1
2017Q1
2018Q1
2019Q1
Quarter total (LHS) 12 month rolling total (RHS)
2019
Q3
0
5
10
15
20
25
2002 2004 2006 2008 2010 2012 2014 2016 2018 2020
Paris: Central Frankfurt London: Central
2,5
3,5
4,5
5,5
6,5
7,5
2002 2004 2006 2008 2010 2012 2014 2016 2018 2020
Paris: Central Frankfurt London: Central
2,0
3,0
4,0
5,0
6,0
7,0
2002 2004 2006 2008 2010 2012 2014 2016 2018 2020
Paris Berlin London
70
80
90
100
110
120
130
140
2002 2004 2006 2008 2010 2012 2014 2016 2018 2020
Paris: Central Frankfurt London: Central
60
80
100
120
140
160
2002 2004 2006 2008 2010 2012 2014 2016 2018 2020
Paris Berlin London
Investor Update based on annual results 2019 (IFRS, pbb Group, audited), March 2020 16

REF Portfolio
Shift in composition
Regions
31/12/2019 / Total: € 29.8 bn1
Note: Figures may not add up due to rounding 1 EaD, Basel III 2 prior to the Brexit referendum in 2016
31/12/2013 / Total: € 22.2 bn1
54%
16%
9%
8%
6%
UK
Germany CEE
Nordics
France
Other 6%
Investor Update based on annual results 2019 (IFRS, pbb Group, audited), March 2020 17
31/12/20152 / Total: € 25.8 bn1
47%
19%
12%
9%
7%
Germany France
UK
CEE
Nordics Other 5%
33%
29%
16%
10%
Office
Residential
Retail
Logistics/
Storage 4%
4%
Hotel Other 4%
Mixed use
50%
12%
11%
9%
Nordics
Germany
Other 8%
UK
France
CEE
USA
3% 6%
46%
19%
16%
10% 2%
Office
Retail
Residential
5% Logistics/
Storage
Hotel
Mixed use Other 3%
31%
28%
22%
8% Office
Retail
2%
Mixed use
5%
Residential
Hotel
Logistics/
Storage
Other 5%
Property types

Po
rtfo
lio
(E
aD
, B
asel II
I)
13.8
12/17 12/18 12/19
13.2 12.1
-12%
Note: Figures may not add up due to rounding
New business & segment reporting
VP: Run-down of non-strategic Value Portfolio continued in line with strategy
31/12/19: € 15.6 bn 31/12/19: € 15.6 bn
Regions Borrower classification
38%
27%
12%
6%
France Austria
Poland 1%
Germany
5%
Italy
Spain
Hungary 1%
4%
Other
Europe
6%
Other Rest
of World
60%
28%
7%
FI
Sov.
(incl. related)
Reg. Gov.
(incl. related)
4%
Supra PSE <1%
€ bn
Fin
an
cin
g v
olu
me
Investor Update based on annual results 2019 (IFRS, pbb Group, audited), March 2020 18

Mortgage
Lending Value (Yield 6.2%)
€ 65 mn
Difference
e.g. 35%
19
Pfandbrief refinancing
ISCR and the effect of the Mortgage Lending Value – very simplified example!
Loan
Pfandbrief
issued
€ 33 mn
OC e.g. 15%
Pfandbrief
Collateral
(Coverpool)
€ 39 mn
Borrower’s
Equity
€ 45 mn
Loan (Yield 7.3%)
€ 55 mn
Refinancing
55%
LTV
max.
60%
MV € 100 mn
Valuation
19 Investor Update based on annual results 2019 (IFRS, pbb Group, audited), March 2020
minus
€ 1.1 mn interest payment p.a.
for a € 55 mn loan
at 2% interest rate
€ 2.9 mn excess cash
€ 4.0 mn rent
= ~ 360% ISCR
€ 1.1 mn interest
€ 4.0 mn rent p.a. at 4% property yield
results in a market
value of € 100 mn
Interest Service Cover Ratio Loan - to - Value Ratio

20 Investor Update based on annual results 2019 (IFRS, pbb Group, audited), March 2020
Cover Pools
Mortgage Cover Pool
Cover Funds by Region € bn (nominal)
Note: Figures may not add up due to rounding 1 Excl. additional cover assets (substitute collateral) 2 Incl. logistics, hotels, other commercially used buildings as well as building land
Cover Funds By Property Type as of 31/12/2019
Cover Funds By Region as of 31/12/2019
46%
13%
11%
10%
8%
6% 2%
Germany
Switzerland 1%
3% CEE
UK
USA
France
Nordic countries
Benelux
Austria Spain
42%
19%
19%
20%
Office
Retail/Shopping
Residential
Other2
Mortgage cover pool (Nominal) 31/12/2019
Pfandbriefe outstanding € 16.6 bn
Cover funds € 19.7 bn
Over-collateralisation (Nominal / NPV) 18.5% / 20.2%
No. of loans 2,030
No. of properties 3,518
Payments ≥90 days overdue € 0.2 mn
Weighted average LTV (based upon the market value) 34.28% 2.6
Spain France Benelux
Nordic
countries
Austria
0.2
UK Germany USA CEE
2.3
Switzerland
2.0
8.1 8.0
0.6
1.8 1.9 1.3
1.8 1.3 1.2 1.0
0.6 0.4 0.3 0.2 0.2 0.1
30/09/2019 Total: € 18.3 bn1
31/12/2019 Total: € 17.6 bn1

21
Cover Pools
Public Sector Cover Pool
Cover Funds by Region € bn (nominal)
Note: Figures may not add up due to rounding
Cover Funds by Counterparty Type as of 31/12/2019
Cover Funds by Region as of 31/12/2019
39%
26%
22%
Germany
Supra 1% Portugal 1%
Austria
2%
France
Canada 1%
4%
Italy
Spain
UK 1%
Benelux 1%
Japan 1%
Nordic countries 1%
CEE 1%
46%
35%
8%
11%
Central governments
Regional authorities
Local authorities
Other debtors
Public sector cover pool (Nominal) 31/12/2019
Pfandbriefe outstanding € 10.8 bn
Cover funds € 14.3 bn
Over-collateralisation (Nominal / NPV) 32.7% / 29.7%
No. of loans / bonds 586
Payments ≥90 days overdue -
Investor Update based on annual results 2019 (IFRS, pbb Group, audited), March 2020
0.1
Austria Germany France
0.2
5.1
Japan Benelux
0.1
Spain Italy
0.6
Portugal Nordic
countries
Supra UK CEE Canada
0.1
5.5
0.1
4.0
0.1
3.7
3.0 3.1
0.5 0.3 0.3 0.3
0.1 0.2 0.2 0.2 0.2 0.1 0.1 0.1 0.2
30/09/2019 / Total: € 14.2 bn
31/12/2019 / Total: € 14.3 bn

Mandated Ratings
Bank ratings S&P
Long-term A-
Outlook/Trend Negative
Short-term A-2
Stand-alone rating1 bbb
Long Term Debt Ratings
“Preferred” senior unsecured Debt2 A-
“Non-preferred” senior unsecured Debt3 BBB-
Subordinated Debt BB+
Pfandbrief ratings Moody’s
Public Sector Pfandbrief Aa1
Mortgage Pfandbrief Aa1
Disclaimer:
The rating information published in this presentation and on our web site are a service for our investors. The information does not necessarily represent the opinion of Deutsche Pfandbriefbank AG.
Ratings should not serve as a substitute for individual analysis. The information provided should not be seen as a recommendation to buy, hold or sell securities. Deutsche Pfandbriefbank AG does not
assume any liability, including for the completeness, timeliness, accuracy and selection of such information, or for any potential damages which may occur in connection with this information.
The rating agencies may alter or withdraw their ratings at any time. The rating of an individual security issued by Deutsche Pfandbriefbank AG may differ from the ratings shown above or an individual
security might not be rated at all. For the evaluation and usage of the rating information (including the rating reports), please refer to the respective rating agencies’ pertinent criteria and explanations,
terms of use, copyrights and disclaimers, which are to be considered.
Note: The above list does not include all ratings 1 Stand-alone credit profile 2 "Senior Unsecured Debt" 3 "Senior Subordinated Debt"
Investor Update based on annual results 2019 (IFRS, pbb Group, audited), March 2020 22