DEBT GOVERNANCE, BANK CAPTURE AND SOFT BUDGET...
63
CENTRE FOR NEW AND EMERGING MARKETS Discussion Paper Series Number 27 DEBT GOVERNANCE, BANK CAPTURE AND SOFT BUDGET CONSTRAINTS Lihui Tian, London Business School August 2002 Contact details: Anna M Malaczynska Tel: +44 (0)20 7706 6964 Fax: +44 (0)20 7724 8060 www.london.edu/cnem © London Business School, 2002 1
Transcript of DEBT GOVERNANCE, BANK CAPTURE AND SOFT BUDGET...
CENTRE FOR NEW AND EMERGING MARKETS
Discussion Paper Series Number 27
DEBT GOVERNANCE, BANK CAPTURE
AND SOFT BUDGET CONSTRAINTS
Lihui Tian, London Business School
August 2002
Contact details: Anna M Malaczynska Tel: +44 (0)20 7706 6964 Fax: +44 (0)20 7724 8060 www.london.edu/cnem © London Business School, 2002
1

Abstract
This paper examines the governance role of debt under soft budget constraints. Using a sample of modern firms listed on China’s burgeoning stock market, I find that in contrast to standard finance theories, debt facilitates managerial exploitation of corporate wealth. A 1% increase in bank loans increases the size of managerial perks by 0.9% and free cash flows by 0.2%, or it decreases corporate value by 0.9%. The failure of debt governance is attributable to the institutional setting of China, where the government owns large banks and firms.
JEL classification: G32, G34, P34 Key words: capital structure, agency cost, debt governance, soft budget constraint, China
2

Non-technical Summary
This paper questions the application of classical corporate finance theories on the
governance role of debt in an emerging market. When the budget constraints are soft,
debt cannot perform as an instrument of corporate governance, but as a facilitator of
managerial exploitation.
In the public listed companies in China where the political interests intervene with
commercial decisions and government ownership holds back the enforcement of
bankruptcy, a 1% increase in financial leverage increases the size of managerial
perquisites by 0.9% and free cash flows by 0.2%. The relation between debt levels and
board-member turnovers is not statistically significant. Bank loans expand the resources
under the control of the managers and so facilitate managerial exploitation.
The facilitator role of debt on managerial agency costs is more significant in the
government-controlled companies, but it becomes much less serious in the commercial-
entity-controlled companies. Given that the budget constraints are more lenient in
government-controlled companies, this finding indicates that a source of dysfunctional
debt governance is the soft budget constraints that arise from government ownership.
Soft budget constraints are intrinsic in the businesses of the state. When the
government plays a major role in the business, the budget constraints become soft and
consequently, debt governance stops functioning. Because the Chinese government has a
widespread business empire, the Chinese corporate governance problem is more
profound than that of East Asian firms before crisis, although the closed Chinese capital
market escaped the brunt of the 1997 Asia financial meltdown.
3

1. Introduction
Corporate capital structure is an instrument of corporate governance, and financial
disciplines are crucial to corporate performance. 1 Jensen and Meckling (1976) and
Dewatripont and Tirole (1994) argue that debt keeps a tight rein on managerial
exploitation. The governance role of debt comes from the threat of bankruptcy (Aghion
and Bolton 1992), the reduction of free cash flows (Jensen 1986), and due diligence
monitoring by creditors (Diamond 1984).
Finance theories are developed in the western economies. In the former
communist economies, Kornai (1980) observes the stylized fact of soft budget constraints,
under which the lack of bankruptcy enforcement brings about the problem of bad loans.
This phenomenon also exists in other new and emerging markets. However, so far, this
essential economic institution is largely ignored by the mainstream finance literature. It
remains a question what role debt serves in corporate governance under soft budget
constraints.
The public listed companies (PLCs) in China provide a laboratory in which to
study this question. Moving towards a mixed economy, the Chinese government
restructures state-owned enterprises into joint stock companies that have more than one
owner and lists the “star” companies on its emerging stock market. Meanwhile, the
government ownership of firms and banks is widespread. As political interests intervene
1 This view is accepted by practitioners. For instance, Financial Times quoted Jonathan Meggs, a partner of JP Morgan, “…leverage is a financial discipline” on June 14th, 2001.
4

with commercial decisions, government ownership holds back the enforcement of
bankruptcy and the budget constraints of China’s modern firms are soft.
There are some theoretically surprising but institutionally intuitional findings
within my Chinese PLCs’ panel data set. In the pooled robust OLS regressions, a 1%
increase in financial leverage increases the size of managerial perquisites by 0.9% and
free cash flows by 0.2%. The positive relation between the size of debt and managerial
agency costs remains significant in the maximum log-likelihood panel regression and the
Arellano-Bond GMM regressions. The relation between debt levels and board-member
turnovers is not statistically significant. These findings suggest that debt governance does
not function in China; on the contrary, debt encourages managerial exploitation. Bank
loans expand the resources under the control of the managers and so facilitate managerial
exploitation.
I further find that the facilitator role of debt on managerial agency costs is more
significant in the government-controlled companies, but it becomes much less serious in
the commercial-entity-controlled companies. Given that the budget constraints are more
lenient in government-controlled companies, this finding indicates that a source of
dysfunctional debt governance is the soft budget constraints that arise from government
ownership.
Soft budget constraints are intrinsic in the businesses of the state. When the
government acts as a heavyweight businessman in the market, the budget constraints
become soft and consequently, debt governance stops functioning. Because the Chinese
government has a widespread business empire, the Chinese corporate governance
problem is more profound than that of East Asian firms before crisis, although the closed
5

Chinese capital market escaped the brunt of the 1997 Asia financial meltdown. With
integration into the global market, the peculiar relation between debt and managerial
agency costs documented in this paper could eventually engulf China in a financial crisis.
There is a Sword of Damocles looming over the future of this emerging economy.
I organize this paper as follows. Section 2 describes the institutional background
of China's modern firms and reviews the literature on capital structure and soft budget
constraints. Section 3 develops the conceptual framework and presents the competing
hypotheses. Section 4 describes the data and presents the univariate analysis. Section 5
presents the empirical findings of the multivariate regressions. Section 6 discusses the
relation between debt and managerial exploitation. I conclude this paper in Section 7.
2. China’s Modern Firms and Financial Institutions
China has a bank-dominated financial system,2 but the stock market has been growing
very fast in the last decade. This section introduces China’s modern firms, its stock
market and its banking sector. The institution of soft budget constraints, which causes the
problem of bad loans, has not changed fundamentally.
2.1 China’s Modern Firms
Since 1978, China has gradually transformed from the centrally planned system to
a market oriented economy, as well as having undergone a massive corporate
restructuring. Starting from 1993, the government promoted the “modern enterprise 2 Total loans reached US$1.1 trillion and the ratio of loans to GDP exceeds 100% (Merrill Lynch, 2000).
6

system” to restructure the state-owned enterprises to be joint stock companies.3 The
financial structure of these modern firms is illustrated in the following chart.
Simplified Financial Structure of China’s Modern Firms
Assets Liabilities
Productive capital Debt owed to the government-controlled banks
Equity in the firms owned bythe government, institutionsand households
The ownership of these firms is clarified. They have more than one owner. The
government is a large block shareholder, but there are no golden shares.4 The government
asset management companies and other agents of the government hold the shares and
report to a special branch of the government—the Bureau of State Asset Administration.
The controlling rights of the government shareholder are dependent on the sizes of
government shareholding.
These companies also use debt financing. So far, there is no domestic market for
corporate bonds in China yet. Except for temporary financing from enterprise arrears or
trade credits, the major liabilities of these companies are bank loans. The banks are
forbidden to own shares of a company.5
3 According to China’s Communist Party Congress in 1993, the modern enterprises are defined as “clarified property rights, clearly defined responsibility and authority, separation of enterprises from the government administration and scientific internal management”. 4 Golden shares are shares with control restrictions, normally the veto right to major strategic decisions. 5 This rule came into effect in 1995, but it does not require a bank to sell out its shares in a firm purchased before 1995.
7

Table 1: Financial Leverages
The table reports the means, standard deviations, and medians of the proxies of capital structures for my sample of companies listed on either the Shanghai Securities Exchange or the Shenzhen Stock Exchange. The leverage ratios are based on the accounting reports. Panel 1 reports the annual numbers between 1994 and 1998. The table also reports the aggregated numbers compared with other countries. The figures for the United States, United Kingdom, Japan, and Germany are from Rajan and Zingales (1995). The figures for South Korea, India, Turkey, Brazil, and Mexico are from Booth et al. (2001).
Panel 1: Leverage Ratios in China’s PLCs from 1994 to 1998 1994 1995 1996 1997 1998 Total
Liability to Total Assetsmean 0.413 0.461 0.445 0.417 0.422 0.429std deviation 0.264 0.166 0.167 0.174 0.185 0.187median 0.412 0.458 0.455 0.415 0.416 0.424
Bank Loans to Total Assetsmean 0.205 0.225 0.224 0.212 0.215 0.216std deviation 0.133 0.133 0.133 0.128 0.135 0.132median 0.193 0.212 0.216 0.201 0.206 0.206
Bank Loans to Capitalmean 0.457 0.481 0.475 0.454 0.453 0.461std deviation 0.227 0.215 0.211 0.204 0.205 0.210median 0.471 0.499 0.498 0.475 0.467 0.479
Observations 287 311 517 719 826 2660
Panel 2: International Comparison
No. of Firms Time Period Nonequity Liabilities
to Total Assets
Debt to Total Assets
Debt to Capital
China 287~826 1994~1998 0.43 0.22 0.46 United States 2580 1991 0.58 0.27 0.37 United Kingdom 608 1991 0.56 0.24 0.34 Germany 191 1991 0.76 0.16 0.39 Japan 514 1991 0.75 0.42 0.63 South Korea 49 1985~1991 0.30 India 99 1980~1990 0.67 Turkey 45 1983~1990 0.59 Brazil 49 1985~1991 0.30 Mexico 99 1984~1990 0.34
8

Table 1 reports that the financial structure of these Chinese firms is similar to that
of the firms in western economies, but the question remains whether the standard
corporate governance theories can be applied to China’s modern firms.
2.2 Emerging Stock Market
These joint stock companies are encouraged to list on stock markets.6 As a result,
the stock market has grown very rapidly. Between 1992 and 1998, the market
capitalization increased at the average rate of 84.7% per year. At the end of 1998, the
total market capitalization was about a quarter of China's GDP. The number of listed
companies grew 62.0% annually, from 53 PLCs in 1992 to 851 PLCs in 1998.
The rule of one-share-one-vote is widely used in these modern firms. Large
shareholders control the management team. The voting rights of the large shareholders
can decide the fate of top manages. For instance, the controlling shareholder of Founder
Tech dismissed the CEO, Zhu Jianqiu, when Mr Zhu attempted to control the board of
directors.
There are frequent mergers and acquisitions in SSE and SZSE. The Boston
Consultancy Group ranked China the third largest merger and acquisition market in Asia7,
although the hostile takeovers are relatively rare. The transfer of state shares and legal
person shares is undertaken as block transfers over the counter. After a merger or an
acquisition, the shareholders often reshuffle the directors and top managers.
6 In practice, only the star joint stock companies can be listed. 7 The Southern Metropolitan Newspaper quoted Jim Hemerling, a Vice President of Boston Consultancy Group, on September 7th, 2001.
9

The internal governance of the board of directors and the external governance of
the market for corporate control function in China. However, there is still no formal code
of bankruptcy. There is only reluctant enforcement of the trial code of Bankruptcy Law.8
This incomplete legal infrastructure is due to the social pressures of unemployment and
the ideology of communisms. Very few large firms have been liquidated and no PLCs
have gone into bankruptcy until very recently.9 The budget constraints on these modern
firms are soft.
2.3 Banking Sector and Non-Performing Loans
Debt finance for China’s modern firms comes from 40,000 financial institutions
in China. However, the banking industry is dominated by the four fully state-owned
commercial banks (the “Big Four”), which provide more than 80% of all corporate loans.
Under the Commercial Banking Law of 1995, these banks should manage credit risks and
pursue profits, but Lardy (1998) argues that reform in China has so far done little to
improve the allocation and use of bank capital.
Because the government is the sole owner of these four banks, it still exerts great
influence over the commercial banking sector through its ownership rights. Under the
administration of the government, the central bank also attempts to compel commercial
8 The Enterprises Bankruptcy Law was legislated in 1986, which is only a trial version and the formal version is still under discussion. It entitles the government owner to the right of a two-year restructuring period for enterprises that are in default before liquidation. It assigns top priority to pension and other welfare obligations. Employees’ claims on their salaries and other welfares receive priority over debt creditors during liquidation. 9 In 2001, the Huarong Asset Management Company and other two creditors requested the Huabei Supreme Court to liquidate the Monkey King PLC. It is expected to be the first bankruptcy case of a public listed company.
10

banks to issue the policy loans.10 For example, in 1998 the central bank issued a guideline
to commercial banks indicating that they should guarantee reasonable funds to state-
owned enterprises (Hanli Consultancy Ltd, 1998). Because of the career concerns of
bankers, the government-owned commercial banks closely follow the direction of the
central bank and the government. And because of unemployment pressure, the
government has few incentives to see its loss-making firms liquidated. However, the
government can ensure that its firms have a steady source of capital through the banks
owned by the government. It thus reduces the incentives for the banks to monitor the
firms. On the other hand, firm managers can hold up the government’s political interests
to force the banks to lend as much as the banks can afford. When a loan is due, the firms
make new loans, thus rolling over the old loans. Soft budget constraints inevitably induce
bad loans.
Table 2 of this paper in the following page provides an overview of the severity of
the bad-loan problem in China. In an interview with the Financial Times, the governor of
China’s central bank admits that nonperforming loans at the Big Four come to about 25%
of total loans. Some academic papers estimate the rate at about 40% and Standard & Poor
provides a figure of 50%. Some banks are technically insolvent, since the nonperforming
loans are even larger than net assets, but with the ultimate backing of the government, the
trust of depositors remains.
10 Compared with central banks in western economies, PBC is assigned a larger power in regulating financial institutions. For example, it sets the lending rate. Commercial banks are allowed to vary the centrally governed rates by only 10% for lending to large-sized enterprises, and up to 30% for other enterprises.
11

These bad loans are not a legacy of the former planned economy, but they started
to accumulate during the reform period. That is, there is a momentum to increase the size
of bad loans, which could eventually lead to a collapse of China’s economy.11
Table 2: Bad Loans
This table describes the severity of problem loans in China. Part A summarizes some studies to estimate the size of bad loans among total loans, and the cost to clean up the bad loans. Part B cites a research report by UBS Warburg and presents the table of total bad loans (in billions of Chinese RMB). Part C cites a research report from Merrill Lynch and compares the problem of China with the rest of the Asian countries.
Part A: Summary of Studies on Problem Loans in China
Study Period EstimateProblem loans (as percentage of outstanding loans)Li (1998) End of 1996 24.4%
Mid-1997 29.2%CCER (1998) 1997 24.0%Fan (1999) 1997 26.1%
1998 28.3%Dai Xianglong (2001, interview with FT) 2001 28.0%
Clean up costs (as percentage of GDP)Moody 1999 18.8%Dornbusch and Givazzi (1999) 1999 25.0%Standard and Poor 2001 50.0%
Part B: UBS Warburg Estimation of Non-Performing Loans of Individual Banks (2001)
11 In fact, the Chinese economy suffers from many of the same debilitating structural problems that long plagued to Korea, Thailand, Malaysia, and Indonesia, including the fragile bank-dominated financial systems, poor prudential surveillance, weak central bank regulation, and a largely state-owned financial sector that is almost insolvent. China emerged unscathed from the Asian financial crisis because of its control of foreign exchanges on capital accounts. However, this Pandora’s Box has to open with the deepening reform and as China integrates into the world economy. This study of debt governance sheds lights on whether China is sliding into a financial crisis (Lardy 1998) and on how China can avoid a potential crisis.
12

Part C: Merrill Lynch Estimation of the Cleaning Up Cost (2001)
3. Capital Structure and Soft Budget Constraints
Surveying classical corporate finance literature, I define the term managerial exploitation,
present the three dimensions of debt governance, clarify the concept of soft budget
constraints, and develop theoretical hypotheses for empirical testing. My framework of
the role of debt in managerial exploitation is presented in the chart of the following page.
3.1 Managerial Agency Cost
In a joint stock company where ownership and control are separate, agency costs
arise. The agents behave so as to maximize their own interests rather than the interests of
their principals. Agency costs induced by the managers include managerial slackness,
risk aversion, and exploitation of the firm. I define managerial exploitation to include
perks, empire building, and entrenchment.
13

3.2 Debt Governance
Corporate governance is a set of mechanisms designed to control managerial
agency costs. Debt is an instrument of corporate governance. Debt governance functions
by acting as a threat to sack incumbent managers under financial distress. As for going
concerns, debt forces out free cash flows and encourages due diligence monitoring
activities.
14

Theoretical Framework and Development of Contradicting Hypotheses
This chart presents the conceptual frameworks of this paper and the contrasting hypotheses. It summarizes the research question of this paper: what is the role of debt in corporate governance under soft budget constraints?
Bank Loans
ManagerialExploitation
Threat ofManagerialDismissal
ReducingFree Cash
Flows
Debt Governance
BankMonitoring
Political Benefits &Government Interference Business of The State
GovernmentOwnership
of Firms
GovernmentOwnershipof Banks
Soft Budget Constraints
Excessive Perks Entrenchment Empire-building
Reduce Facilitate?
15

First, a high financial leverage is associated with a high probability of financial
distress which causes managerial replacement. Aghion and Bolton (1992) model the shift
of control to debt holders when profits are low. Gilson (1990) shows that creditors take
over the dominant role in disciplining the managers when firms are in financial distress.
The empowered creditors tend to replace incumbent managers that were assigned by the
shareholders.12 On the other hand, debt plays a role in pre-committing the shareholders to
penalize the managers for their value destroying exploitation, because the shift of control
to creditors drives out the private benefits of the controlling shareholder. Debt also has an
incentive effect on shareholders’ monitoring efforts. With a sample of British firms,
Franks et al. (2002) find that the turnovers of board-members is higher when the financial
leverages are higher.13
Secondly, Jensen (1986) argues that debt carves out free cash flows and reduces
managerial agency costs. Free cash flow is cash flow that remains after the firm has
completed its positive net present value (NPV) projects. Under the separation of
ownership and control, the managers are reluctant to pay out cash flows to shareholders,
but prone to overexpanding corporate operations and to “empire-building”. Debt
functions to force out cash flows to repay interest and loan principal. Moreover, debt
holders can impose rules and restrictions on management through an indenture and the
availability of remedies for breach thereunder. The debenture caveats of loans restrict the
12 If laid off due to exploiting corporate wealth, the managers are punished with the reputation effect in the managerial labor market (Fama and Jensen 1983a, b). 13 Harris and Raviv (1988) and Stulz (1988) argue that with an increase of leverages, the voting rights of outsiders are reduced and the voting rights of the insiders increase. The managers are therefore prone to entrenchment. However, the average voting rights of the management teams in China’s PLCs were as small as 0.005% of the total shares. The Stulz leverage impact is not expected to be influential in the Chinese context. Therefore, the classical corporate finance theory should follow the governance hypothesis. Friend and Lang (1988) and Berger et al. (1997) provide empirical evidence that financial leverages are negatively correlated to managerial entrenchment in developed economies.
16

over expansion of corporate operation. By containing the propensity for overinvestment,
debt improves corporate value. McConnell and Servaes (1995) find that firm leverage is
positively correlated with firm value when a firm’s growth opportunities are scarce.
Thirdly, the theory of financial intermediation argues that banks have incentives
to collect information and monitor firms to ensure the returns to the depositors (e.g.,
Diamond 1984). Bankers’ specialized knowledge helps to reduce asymmetric information.
Moreover, typical bank loans are short term. When bank loans are renewed, the bank
actively investigates corporate quality and evaluates the investment risk (Shleifer and
Vishny 1997). If there are excessive managerial perks, banks tend to reject additional
funding. Consequently, it signals to the market the quality of firm management and may
trigger a disciplinary action from equity holders on the managers. Harris and Raviv (1990)
model the informational role of debt. Debt financing therefore improves corporate
performance by inducing due diligence monitoring by creditors.
In summary, classical corporate finance theories argue that high leverages reduce
managerial exploitation and strengthen corporate governance, ceteris paribus (e.g.,
Jensen and Meckling 1976, and Harris and Raviv 1991).
3.3 Soft Budget Constraints
The classical corporate finance theories on debt governance take hard budget
constraints as granted. However, Kornai (1980) observes that the firms in former planned
economies face the soft budget constraints.14 I define the soft budget constraints as the
14 Dewatripont and Maskin (1995) show that when creditors have limited information on the future return of an investment and cannot commit to terminating ex post unprofitable projects, there is a soft-budget-
17

perceived re-negotiability of debts under political interference. This concept of soft
budget constraints is a strong form of the Dewatripont-Maskin concept (1995). Political
benefits are also a rationale for refinancing loss-makers. Under soft budget constraints,
the firms in default expect refinancing instead of bankruptcy. Contract fulfillment is
therefore dependent on bargaining. Political pressures from the government also soften
the budget constraints imposed by banks.
Under soft budget constraints, debt governance becomes weak. The shift of
control from shareholders to creditors is blocked by political interference. If the
government is the controlling shareholder, it tends to retain its control by exerting
pressure on creditors. Without the threat of the shift of control de jure, the managers in de
facto control are not concerned with the dissatisfaction of the creditors. The agent who
represents the government has little concern for the loss of private benefits, since there is
no shift of control from shareholders to creditors. Bankers’ disapproval does not trigger
the disciplinary action from shareholders in this setting.
A going concern normally pays back its interest and loan principal, but it does not
necessarily lead to the conclusion that debt forces out the cash flows. On the flip side,
bank lending injects capital into firms. If the credit is soft, the firm keeps making new
loans to pay back old loans. Meanwhile, the managers can use bank capital to expand
corporate operations. Empire building is thus promoted by debt under soft budget
constraints. Bankers actually hand out cash to the managers without the governance
implication.
constraint problem. The sunk costs of initial financing provide creditors the incentive to continue their finance, even when the firm cannot pay back some interest and loans. This holdup problem is universal.
18

The creditors pressured by the government have no incentive to monitor debtors
and how the credit is used. It is the pressure of the government that imposes the soft
budget constraints on creditors. The bankers’ incentive to undertake due diligence
monitoring on corporate business operations is diminished under bureaucratic
coordination of economic activities.
The theory of soft budget constraints therefore predicts that debt cannot reduce
managerial agency costs. On the contrary, it may facilitate managerial exploitation. When
banks renegotiate with firms and allow the rollover under political pressure, managerial
exploitation is exacerbated. This argument is consistent with the theory of politicians and
the firm (Shleifer and Vishny 1994). In fact, World Bank (2000) argues that the East
Asian financial crisis in 1997 partly comes from dysfunctional debt governance.
3.4 Hypotheses
Based on the framework presented in Chart 2 and the above discussion, the
following contradictory hypotheses are developed:
Hypothesis CF: Higher leverage constrains managerial exploitation.
This corporate finance hypothesis of debt governance can be stated as being that
there is a negative relation between financial leverage and the scale of managerial perks,
a positive relation between financial leverage and the possibility of an over-investment
problem, and a negative relation between financial leverage and the magnitude of a
managerial entrenchment problem. All else equal, managerial exploitation results in low
19

efficiency and drives down the value of the firm.15 Then, it should be projected that
higher leverage is associated with higher efficiency and higher corporate value.
Hypothesis SBC: Higher leverage facilitates managerial exploitation.
In contrast to classical corporate finance theories, the theory of soft budget
constraints suggests that bank loans do not constrain managerial exploitation, which is
the alternative hypothesis to Hypothesis CF. A higher leverage is associated with larger
managerial perks and a more serious problem of over-investment. Since the soft budget
constraints come from political pressures, Hypothesis SBC further suggests that the
facilitator role of debt is stronger if the firms are more closely affiliated with the
government.
4. Data Samples, Proxies and Univariate Analysis
Based on the 1994-1998 annual reports and share performance of all Chinese PLCs, a
new data set is assembled (Appendix 1). This section describes the data and provides the
univariate analysis of the governance role of debt.
15 Managerial exploitation damages corporate value. That is, in a large sample of firms in a semi-strong efficient stock market, corporate value carries information on the magnitude of managerial exploitation. If debt provides governance, a highly leveraged firm should be valued high, ceteris paribus, as a higher financial leverage reduces further the magnitude of managerial exploitation. In addition, Ang et al. (2000) suggest that corporate efficiency also reflects the scale of agency costs within a firm.
20

4.1 Ownership Cluster
Tian (2000) argues that state shareholding is a main feature of China’s public
listed companies. Kornai (1992) argues that the softness of budget constraints depends on
ownership, and state ownership is a fundamental cause of soft budget constraints.
Relatively speaking, state owned enterprises face the softest budget constraints; the
collective enterprises face less soft budget constraints and the private enterprises face
hard budget constraints. Therefore clustering samples by ownership is a way to examine
the relation between soft budget constraints and debt governance.
In descriptive statistics, I group the firms into four clusters: 1) the dispersed
shareholding structure in which the largest shareholder holds less than 30% of total
shares; 2) the state-controlled shareholding structure in which the government
shareholder holds more than 30%; 3) the institutional-shareholder-controlled
shareholding structure in which the non-government institutional shareholder holds more
than 30%; and 4) the entrepreneur-led shareholding structure in which an entrepreneur
founds and leads the firm. The 30% cut-off threshold is based on a CSRC regulation that
names 30% as the relative control threshold. Whilst this threshold is arbitrary, my results
do not change when I try other cut-off points.
In the regression analysis of Section 5, I further group the firms into two clusters
to compare the coefficients of the independent variable: 1) the state-controlled
shareholding structure where the government shareholder holds more than 30%; and 2)
the one-commercial-shareholder-controlled shareholding structure that comprises both
the institutional-shareholder-controlled shareholding structure and entrepreneur-led
shareholding structure described above. This classification simplifies the regression
21

analysis by highlighting the government ownership, which facilitates the comparison of
coefficients of independent variables in two clusters. I recognize that the government is
behind some commercial shareholders, but the indirect shareholding reduces the
influence of politicians on corporate operation, because a commercial shareholder has its
own financial interest. That is, even if there may not be a distinctly qualitative difference
between cluster 1 and cluster 2, there is a quantitative one. The softness of budget
constraints is therefore different in government-controlled firms from commerce-
controlled firms.
4.2 Financial Leverages
Since there is not an active domestic corporate bond market in China and trade
credits for transaction purposes do not contribute significantly to corporate governance,
debt governance is the governance based on bank loans. My main measure of financial
leverage is therefore the ratio of the amount of bank loans to total assets. This ratio shows
the liability of the firm, suggests the probability of financial distress, and approximates
the influence of bankers in corporate management. A high gearing ratio in the firm
should trigger a prudent lending policy by its banks and a stronger governance effect of
bank monitoring. I also examined other forms of gearing ratios, but my basic conclusion
does not vary with different forms of gearing ratios.
To examine whether there is a distribution pattern of managerial agency costs on
financial leverage, I group the firms into three clusters: low-debt firms whose financial
leverage is below 10%; middle-debt firms with the leverage between 10% and 30%; and
high-debt firms with leverage above 30%.
22

4.3 Managerial Perks
Managerial perks are the hidden income for management teams. In fact, such
perks represent the main income for Chinese managers, since the average nominal annual
salary of the general managers is only $4,667.16 It is a normal practice for a firm to pay
for the phone, taxi and dinner bills of the senior managers’ family members.
Most perquisites for managers are not explicitly reported in the annual reports
formulated by the CSRC, but they inflate the accounting item of administration cost.
Administration cost records the administration expenditure in organizing and managing
corporate operation. It includes the expenses of the top management team and the
administrative staff and the cost that should be born by the company as a whole, such as
corporate cars, traveling expenses, entertainment expenses and other service bills. Among
the data reported in the annual report, the item of administration cost serves as the best
indicator of managerial perks. I normalize the administration costs by sales, which
controls for both size and operation effects. The quantitative difference among the
administration cost ratios in different firms approximates the degree of perks taken by the
managers.
16 Wang (1998) shows the annual income of the general managers of 146 PLCs on the Shanghai Stock Exchange was only RMB 38,650 in 1997, although there are some cases of high bonuses for management teams.
23

Table 3: Administration Cost
The table presents median and mean of administration cost ratios using the dimensions of ownership types and debt clusters. The first number in each cell is the median and the second the mean. The ratio of administration costs is measured by the administration expenses normalized by total sales. The ownership types are classified to four groups: “Dispersed” is the dispersed shareholding structure in which no shareholder holds more than 30% of total shares. “State” is the government-shareholder dominated shareholding structure in which the government holds more than 30% of total shares. “Institution” is the institutional-shareholder-dominated shareholding structure in which an institutional shareholder holds more than 30% of total shares. “Entrepreneur” is the entrepreneur-dominated shareholding structure in which an entrepreneur controls the firm through his own shares and the shares owned by the agents under his control. A regulation of CSRC takes 30% as the relative control threshold and my results do not vary by changing the threshold. The financial leverage is measured by the total bank loans normalized by total assets. Based on the distribution of the data, this financial leverage is grouped to three clusters: “Low Debt”, where the debt-to-total assets ratio is below 10%; “Middle Debt”, where the debt-to-total assets ratio is between 10% and 30%; “High Debt”, where the debt-to-total assets ratio is above 30%. Different symbols are used to represent each group. If there is a symbol of another group behind or below the number, there is a significant difference between this group and the group represented by the symbol. Using the Student T test for the mean difference and the Mann-Whitney U test for the median difference, 5% is taken as the significance threshold.
Dispersed ♣ State ♠ Institution ♦ Entrepreneur ♥ Total Observ.Low Debt ∆ 0.111 ♠♦ ♥ 0.082 ♣♥ 0.083 ♣♠ ♥ 0.059 ♣♠ ♦ 0.087 530 ◊ ∇ ◊ ∇ ∇ ◊ ∇ ◊ ∇
♠♦ ♥ ♣♥ ♣♠ ♥ ♣♠ ♦ ∇ 0.066 ◊ ∇ 0.058 ∇ 0.057 ◊ ∇ 0.058 ◊ ∇ 0.060 Middle Debt ◊ 0.091 ♦♥ 0.089 ♦♥ 0.082 ♣♠ 0.082 ♣♠ 0.088 1402 ∆∇ ∆ ∇ ∇ ∆ ∇ ∆ ∇
♥ ♣♦♥ ♣♠ ♥ ♣♠ ♥ ∇ 0.066 ∆ ∇ 0.073 ∇ 0.066 ∆ 0.075 ∆ ∇ 0.071 High Debt ∇ 0.114 ♠♦ ♥ 0.098 ♣♦♥ 0.093 ♣♠ ♥ 0.107 ♣♠ ♦ 0.102 724 ∆ ◊ ∆ ◊ ∆ ◊ ∆ ◊ ∆ ◊
♠♦ ♥ ♣♦♥ ♣♠ ♥ ♣♠ ♦ ∆ ◊ 0.079 ∆ ◊ 0.078 ∆ ◊ 0.067 ∆ 0.073 ∆ ◊ 0.077 Total 0.101 ♠♦ ♥ 0.090 ♣♦♥ 0.086 ♣♠ ♥ 0.081 ♣♠ ♦ 0.091 2656
♦♥ ♦♥ ♣♠ ♥ ♣♠ ♦ 0.068 0.072 0.066 0.072 0.071
Observations 532 1430 609 85 2656
24

Table 3 presents the distribution of perks by ownership and leverage clusters. The
average ratio of administration cost to total sales is 9.1%. The firms with a dispersed
shareholding structure spend $0.111 on administration for each dollar of the sales; state-
controlled firms $0.090; institutional-shareholder-controlled firms $0.086; and
entrepreneur-led firms $0.081. Perks vary among firms with different ownership types
and ownership affects corporate governance. With increasing financial leverage, it is
striking to find that the ratio of administration expense to sales increases. When the firms
have a low debt burden, the average administration ratio is 8.7%; a debt burden in the
middle range, 8.8%; above 30%, 10.2%. In the cluster of state-controlled firms, the
increasing pattern of administration ratio with the debt levels is most significant.
4.4 Free Cash Flows
Free cash flow is cash flow left over after the firm has exhausted its projects of
positive NPV. It has a significant positive correlation with the cash retention ratio, which
is also called the plowback ratio. The retention ratio is calculated as one minus the payout
ratio, which is the dividends per share over the earnings per share. This ratio measures
the proportion of earnings retained after paying out dividends to shareholders, and it
serves as a proxy of free cash flow. It is the fraction of distributable cash flows that a
company invests in new projects.
25

Table 4: Cash Retention
The table presents median and mean of cash retention ratios under the dimensions of ownership types and debt clusters. The first number in each cell is the median and the second the mean. The ratio of cash retention is measured by one minus the dividend ratio. The dividend ratio is calculated by the distributed dividends of common stock over distributable earnings. The ownership types are classified into four groups: “Dispersed” is the dispersed shareholding structure in which no shareholder holds more than 30% of total shares. “State” is the government-shareholder dominated shareholding structure in which the government holds more than 30% of total shares. “Institution” is the institutional-shareholder-dominated shareholding structure in which an institutional shareholder holds more than 30% of total shares. “Entrepreneur” is the entrepreneur-dominated shareholding structure in which an entrepreneur controls the firm through his own shares and the shares owned by the agents under his control. A regulation of CSRC takes 30% as the relative control threshold and my results do not vary by changing the threshold. The financial leverage is measured by the total bank loans normalized by total assets. Based on the distribution of the data, this financial leverage is grouped to three clusters: “Low Debt”, where the debt-to-total assets ratio is below 10%; “Middle Debt”, where the debt-to-total assets ratio is between 10% and 30%; “High Debt”, where the debt-to-total assets ratio is above 30%. Different symbols are used to represent each group. If there is a symbol of another group behind or below the number, there is a significant difference between this group and the group represented by the symbol. Using the Student T test for the mean difference and the Mann-Whitney U test for the median difference, 5% is taken as the significance threshold.
Dispersed ♣ State ♠ Institution ♦ Entrepreneur ♥ Total Observ.Low Debt ∆ 0.905 ♠♦ ♥ 0.706 ♣♦♥ 0.730 ♣♠ ♥ 0.747 ♣♠ ♦ 0.750 530 ◊ ∇ ◊ ∇ ◊ ∇ ◊ ∇
♠♦ ♥ ♣♦♥ ♣♠ ♥ ♣♠ ♦ 1.000 ◊ ∇ 0.840 ◊ ∇ 0.765 ◊ ∇ 0.730 ◊ ∇ 0.804
Middle Debt ◊ 0.790 ♠♦ ♥ 0.778 ♣♥ 0.796 ♣♦♥ 0.833 ♣♠ ♦ 0.786 1402 ∇ ∆ ∇ ◊ ∇ ∆ ∇ ∆ ◊
♠♦ ♥ ♣♦♥ ♣♦♥ ♣♠ ♦ ∇ 1.000 1.000 ◊ ∇ 0.950 ∆ ◊ 1.000 ∆ ◊ 1.000 High Debt ∇ 0.818 ♦♥ 0.815 ♦♥ 0.783 ♠♦ ♥ 0.898 ♣♠ ♦ 0.810 724 ◊ ∆ ◊ ∆ ∆ ◊ ∆ ◊
♦♥ ♦♥ ♠♦ ♥ ♣♠ ♦ ◊ 1.000 ∆ ◊ 1.000 ∆ ◊ 1.000 ∆ ◊ 1.000 ∆ ◊ 1.000 Total 0.819 ♠♦ 0.774 ♣♦♥ 0.776 ♣♥ 0.827 ♠♦ 0.785 2656
♠♦ ♥ ♣♦♥ ♣♠ ♥ ♣♠ ♦ 1.000 1.000 0.871 1.000 1.000
Observations 532 1430 609 85 2656
26

Table 4 shows that, by increasing bank loans, the firms have a higher retention
ratio. On average, firms with a high financial leverage retain distributable earnings 6%
higher than those with a low financial leverage. This increasing pattern of plowback
ratios is significant in the government-controlled and the entrepreneur-led firms. Table 4
also shows that a low-leveraged firm with a dispersed shareholding structure has the
highest retention ratio, 90.5%. A dispersed shareholding structure has the worst equity
governance.
Due to the inaccuracy of the plowback ratios as an approximation of free cash
flows, I also used the ratio of capital expenditure17 normalized by sales to examine the
magnitude of investment. I find a similar pattern of distribution to that in table 4.
4.5 Managerial Entrenchment
Board member turnovers are a measure that approximates the problem of
managerial entrenchment. Taiwan Economic Journal data set annually reports the names
of directors every year. Board member turnover is calculated as the number of exits from
the board over the total number of corporate directors.
17 Capital expenditure is the sum of China’s GAAP items of short-term investment, long-term investment and construction in place.
27

Table 5: Board-member Turnover
The table report the median and mean of board-member turnover ratios under the dimensions of ownership types and debt clusters. The first number in each cell is the median and the second the mean. The ratio of board-member turnover is measured by the annual number of resigning directors in the board over the total number of directors. The ownership types are classified to four groups: “Dispersed” is the dispersed shareholding structure in which no shareholder holds more than 30% of total shares. “State” is the government-shareholder dominated shareholding structure in which the government holds more than 30% of total shares. “Institution” is the institutional-shareholder-dominated shareholding structure in which an institutional shareholder holds more than 30% of total shares. “Entrepreneur” is the entrepreneur-dominated shareholding structure in which an entrepreneur controls the firm through his own shares and the shares owned by the agents under his control. A regulation of CSRC takes 30% as the relative control threshold and my results do not vary by changing the threshold. The financial leverage is measured by the total bank loans normalized by total assets. Based on the distribution of the data, this financial leverage is grouped to three clusters: “Low Debt”, where the debt-to-total assets ratio is below 10%; “Middle Debt”, where the debt-to-total assets ratio is between 10% and 30%; “High Debt”, where the debt-to-total assets ratio is above 30%. Different symbols are used to represent each group. If there is a symbol of another group behind or below the number, there is a significant difference between this group and the group represented by the symbol. Using the Student T test for the mean difference and the Mann-Whitney U test for the median difference, 5% is taken as the significance threshold.
Dispersed ♣ State ♠ Institution ♦ Entrepreneur ♥ Total Observ.Low Debt ∆ 0.401 ♠♦ ♥ 0.527 ♣♥ 0.489 0.556 0.493 530 ◊ ∇ ◊ ∇ ∇ ◊ ∇ ◊ ∇
♠♦ ♥ ♣♥ ♣♠ ♥ ♣♠ ♦ ◊ ∇ 0.312 ◊ ∇ 0.375 ◊ 0.350 ∇ 0.400 0.353 Middle Debt ◊ 0.474 ♠♦ ♥ 0.442 0.483 0.484 0.459 1402 ∆ ∆ ∇ ∇ ∆ ∇ ∆
♥ ♣♦♥ ♣♠ ♥ ♣♠ ♥ ∆ 0.412 ∆ 0.363 ◊ 0.392 ∇ 0.429 0.389 High Debt ∇ 0.460 ♠♦ ♥ 0.463 0.445 0.584 0.461 724 ∆ ∆ ◊ ∆ ◊ ∆ ◊ ∆
♠♦ ♥ ♣♦♥ ♣♠ ♥ ♣♠ ♦ ∆ 0.400 ∆ 0.375 0.355 ∆ ◊ 0.547 0.381 Total 0.457 0.463 0.475 0.515 0.466 2656
♦♥ ♦♥ ♣♠ ♥ ♣♠ ♦ 0.393 0.372 0.375 0.426 0.375
Observations 532 1430 609 85 2656
28

Table 5 does not show that there is a significant distribution pattern when there is
a change in debt levels. However, the firms with dispersed shareholding structures have
the lowest annual turnover of board members, 45.7%. Board member turnovers increase
in the sequence: the government-controlled firms, institutional-shareholder-controlled
firms, and entrepreneur-led firms. This finding is consistent with the governance
hierarchy of ownership: private ownership, state ownership and dispersed shareholding
structure. Table 5 also shows that the firms with a low leverage and with a dispersed
shareholding structure have the lowest turnover ratio, 40.1%. The firms with a high
leverage and with the entrepreneur-led shareholding structure have the highest frequency
of board-member turnovers at 54.7%. However, in contrast to Franks et al. (2002), the
frequency of management turnovers is not significantly higher when the debt is higher in
Chinese PLCs, except for the firms under the control of an entrepreneur.
4.6 Comprehensive Proxies
Based on my conceptual framework, I propose proxies for each subcategory of
managerial exploitation. Using these proxies, I carry out factor analysis and generate the
proxy of managerial exploitation (Appendix 3). Factor analysis tests whether my three
proxies have a common underlying factor, provides a support for the goodness of my
proxies and for the empirical robustness of my conceptual framework of managerial
exploitation. In addition, it generates a parsimony index of managerial exploitation and
assists in the articulation of the relation between managerial exploitation and debt.
29

However, the artificial variable with factor loading is less intuitive. I therefore
also follow Ang et al. (2000) in using the expense ratio to approximate agency costs in
the firm. This ratio is operating expense scaled by annual sales. It is essentially a measure
of efficiency. It also indicates how effectively or ineffectively the managers operate the
firm. Ang et al. (2000) compare the expense ratios in firms with many shareholders and
then in owner-manager firms that theoretically have no managerial agency costs. Using
American data, they find that there is an insignificant negative relation between financial
leverage and expense ratio. From their argument, I can conclude that a firm with a high
expense ratio has a relatively high agency cost. Even without the control sample of the
owner-manager firm, the variance of expense ratios shows the variance of the magnitude
of agency costs in different firms. This efficiency ratio provides an auxiliary measure of
managerial exploitation.
Managerial exploitation damages the intrinsic value of the firm. The most often
used value measure is Tobin’s Q. Following Perfect and Wiles (1994) and Chung and
Pruitt (1994), I use the simplified Tobin’s Q, which is measured as the sum of market
value of equity plus book value of debt all over book value of total assets. This simplified
Tobin’s Q is widely adopted in the literature to avoid arbitrary assumptions about
depreciation and inflation rates (e.g., Shin and Stulz, 1998). Tobin’s Q is driven by
market valuation of the firm.18 A firm that has excessive managerial exploitation should
be valued low. Solely based on the governance arguments, Hypothesis CF argues that
there is a positive correlation between debt and Q. However, besides the effect of
managerial exploitation, the cost of financial distress, tax shield and the market
18 Share prices in China are a highly controversial measure. Some journalists regard this stock market as the castle in the air. However, except for some notorious stories of share price manipulations, I find that there is a strong correlation between share price and ROA among 826 firms.
30

perception of debt affect the relation between financial leverage and corporate value. In
an economy with hard budget constraints, debt makes multiple contributions to corporate
value (e.g., McConnell and Servaes, 1995). Soft budget constraints further complicate the
relation between corporate value and debt. By excluding the cost of financial distress, the
market still attempts to assess the quality of the firms by their financial leverage. Both of
my hypotheses do not clearly predict the relation between corporate value and debt in the
real world, since debt is not just an instrument of corporate governance. However, the
relation between Tobin’s Q and leverage is itself an interesting empirical question and I
provide a test in following sessions, with some caveats.
Table 6 presents the distribution of my managerial exploitation indicators on the
10% quantiles of the bank loans to total assets. Some patterns of the data distribution are
visible, but it demands rigorous econometric investigation.
31
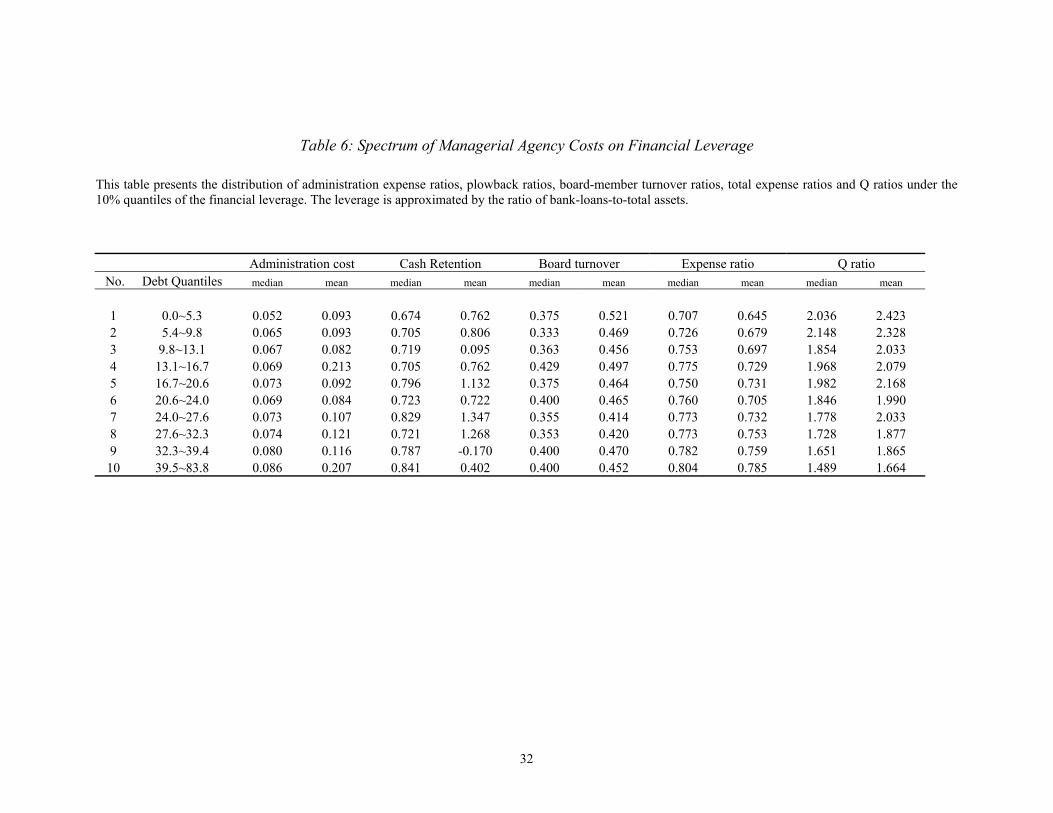
Table 6: Spectrum of Managerial Agency Costs on Financial Leverage
This table presents the distribution of administration expense ratios, plowback ratios, board-member turnover ratios, total expense ratios and Q ratios under the 10% quantiles of the financial leverage. The leverage is approximated by the ratio of bank-loans-to-total assets.
Administration cost Cash Retention Board turnover Expense ratio Q ratio No. Debt Quantiles median mean median mean median mean median mean median mean
1
0.0~5.3 0.052 0.093 0.674 0.762 0.375 0.521 0.707 0.645 2.036 2.4232 5.4~9.8 0.065 0.093 0.705 0.806 0.333 0.469 0.726 0.679 2.148 2.3283 9.8~13.1 0.067 0.082 0.719 0.095 0.363 0.456 0.753 0.697 1.854 2.0334 13.1~16.7 0.069 0.213 0.705 0.762 0.429 0.497 0.775 0.729 1.968 2.0795 16.7~20.6 0.073 0.092 0.796 1.132 0.375 0.464 0.750 0.731 1.982 2.1686 20.6~24.0 0.069 0.084 0.723 0.722 0.400 0.465 0.760 0.705 1.846 1.9907 24.0~27.6 0.073 0.107 0.829 1.347 0.355 0.414 0.773 0.732 1.778 2.0338 27.6~32.3 0.074 0.121 0.721 1.268 0.353 0.420 0.773 0.753 1.728 1.8779 32.3~39.4 0.080 0.116 0.787 -0.170 0.400 0.470 0.782 0.759 1.651 1.865
10 39.5~83.8 0.086 0.207 0.841 0.402 0.400 0.452 0.804 0.785 1.489 1.664
32
5. Multivariate Regressions
In this section, I present the empirical findings of multivariate regressions. A positive
relation is found between debt levels and the magnitude of managerial exploitation. I
further find that the government-owned firms drive this positive relation. The
methodology is described in Appendix 3. The results of the Robust OLS regressions are
not very different from the maximum log-likelihood panel or from the Arellano-Bond
GMM method. The following discussions are mainly based on the findings of the Robust
OLS regressions.
5.1 Administration Cost and Debt
Table 7 shows that the administration cost ratio rises by about 90% when the
financial leverage increases by 100%. This increase indicates that managers in a highly
leveraged firm enjoy large expense accounts. Debt does not prevent managers from
squandering corporate wealth, which contradicts Hypothesis CF. On the contrary, bank
lending increases the resources under the managers’ control and promotes a large expense
account of administration. This finding supports Hypothesis SBC.
33

Table 7: Regressions of Administration Cost
The table reports the regression results of administration cost ratios on debt. The dependent variable, the ratio of administration costs is measured by the administration expense normalized by total sales, adjusted by industries and years. Column 1 reports the robust ordinary-least-square regressions (OLS), Column 2 reports the efficient maximum-log-likelihood panel regressions (MLP), and Column3 reports the Arellano-Bond GMM regressions (DPD). The firms are clustered into two groups: If a firm is under government control, it is within the sub-sample of State. If a firm is under the control of a commerce entity, it is within the sub-sample of Commerce. Columns 4 and 5 are the results of the OLS regressions (OLS), which are consistent with MLP and DPD. The coefficients of debt ratio are compared with running complementary regressions and I report the significance in Column 6. The control variables are introduced in Appendix 3. The Hadi method is followed to remove the outliers. The standard deviations are reported in parentheses. *** indicates being highly significant with p-value smaller than 0.01, ** indicates being significant with p-value smaller than 0.05 and * indicates being marginally significant with p-value smaller than 0.10. (1) (2) (3) (4) (5) (6) OLS MLP DPD State Commerce Differ Debt 0.935*** 0.781*** 1.153*** 0.584*** -0.082 -2.770***
(0.142) (0.119) (0.253) (0.136) (0.387)
Size -0.178*** -0.186*** -0.485*** -0.175*** -0.082 (0.020) (0.022) (0.084) (0.021) (0.053)
Tangible 0.299** 0.194* 0.156 0.280** 0.525 (0.117) (0.099) (0.221) (0.132) (0.329)
Herfindhal -2.410** -3.445*** -2.866 0.742 2.915 (1.039) (1.295) (3.557) (1.089) (3.867)
Age 0.001** 0.002** 0.001** -0.002 (0.001) (0.001) (0.001) (0.003)
Lagged Debt 0.461*** (0.123)
Constant 3.818*** 3.967*** 0.112*** 3.379*** 1.542
(0.399) (0.441) (0.024) (0.438) (1.044)
Observations 2214 2214 944 684 264 F / Chi^2 test 58.17 555.7 7.63 46.46 4.72 Significance 0.000 0.000 0.000 0.000 0.000 R-squared 0.227 0.220 0.094
34

I use the log form of total assets in this regression, in order to approximate the
size to reduce the multi-collinearity with this ratio of administration cost to sales. I find
that large firms have a low administration ratio. This finding implies that they benefit
from economies of scale. A large firm reduces the relative administration ratio.
Furthermore, it also implies that a large firm draws the attention of the media and faces
better monitoring. The monitoring helps to reduce the managerial perks. I further find
that the firms whose assets are more specific and more tangible have a higher
administration cost ratio. These firms involve more administration staff to manage these
assets, which inflates the administration costs, although this impact is not significant in
the DPD regressions. Consistent with the governance effect of large shareholders, I find
that ownership concentration helps to reduce administration cost.
In Column 4 of table 7, I report that managerial perks rise with debt levels in the
government-controlled firms, but Column 5 shows that there is an insignificant relation
between administration cost and debt levels in institution-controlled firms. As reported in
Column 6, the T-statistics of the difference of coefficients between Column 4 and
Column 5 are highly significant. If a firm has a non-governmental institution as a
majority shareholder, the distribution of administration cost does not correspond with the
distribution of debt. That is, debt does not facilitate managerial perks in those firms that
are under the control of a commercial entity.
35

Table 8: Regressions of Cash Retention
The table reports the regression results of cash retention ratios on debt. The dependent variable, the ratio of cash retention, is measured by one minus the dividend ratio, adjusted by industries and years. Column 1 reports the robust ordinary-least-square regressions (OLS), Column 2 reports the efficient maximum-log-likelihood panel regressions (MLP), and Column 3 reports the Arellano-Bond GMM regressions (DPD). The firms are clustered into two groups: If a firm is under government control, it is within the sub-sample of State. If a firm is under the control of a commerce entity, it is within the sub-sample of Commerce. Columns 4 and 5 are the results of the OLS regressions (OLS), which are consistent with MLP and DPD. The coefficients of debt ratio are compared with running complementary regressions and I report the significance in Column 6. The control variables are introduced in Appendix 3. The Hadi method is followed to remove the outliers. The standard deviations are reported in the parenthesis. *** indicates being highly significant with p-value smaller than 0.01, ** indicates being significant with p-value smaller than 0.05 and * indicates being marginally significant with p-value smaller than 0.10.
(1) (2) (3) (4) (5) (6) OLS MLP DPD State Commerce Differ Debt 0.210*** 0.207*** 0.214*** 0.300*** 0.105 2.010***
(0.070) (0.065) (0.071) (0.071) (0.177)
Size -0.008 -0.009 -0.019 -0.005 -0.020 (0.011) (0.010) (0.374) (0.010) 0.020
Tangible -0.087** -0.083 0.331 -0.232*** -0.192* (0.038) (0.055) (0.258) (0.069) (0.105)
Herfindhal -0.510 -0.512 2.006 -0.178 -2.305 (0.470) (0.550) (2.112) (0.775) (1.690)
Age 0.001 0.001 -0.0001 0.002 (0.001) (0.001) (0.0006) (0.001)
Lagged Debt -0.023* (0.014)
Constant 0.063 0.088 -0.018 0.032 0.381
(0.234) (0.202) (0.013) (0.208) (0.407)
Observations 2176 2176 977 741 273 F / Chi^2 test 6.00 14.88 5.16 5.95 1.96 Significance 0.000 0.000 0.000 0.000 0.085 R-squared 0.007 0.040 0.039
36

5.2 Cash Retention and Debt
Column 1 in table 8 shows there is a strongly positive relation between the ratio
of cash retention and leverage. A 1% increase in financial leverage increases the retention
of distributable earnings by 0.2%. Other things being equal, a firm that has a higher ratio
of earnings retention has a larger proportion of free cash flow and a larger propensity
towards over-investment. Debt encourages the managers to retain more cash to squander.
My finding supports Hypothesis SBC.
I find that the tangible ratio—fixed assets to total assets—has a negative impact
on the investment ratio. The firms with a large proportion of intangible assets tend to
invest more. For instance, the IT sector requires intensive investment. I do not find a
significant impact of ownership concentration on the investment ratio. A large
shareholder does not seem to influence the management team for paying out larger
dividends. However, this finding does not necessarily invalidate the governance argument
of large shareholders, supported in table 7 and 9. In addition to the governance effect on
the management team, a large shareholder also tends to take advantage of small
shareholders. Instead of paying out the dividends to all shareholders, a large shareholder
may cash out with transfer pricing at the expense of small shareholders. The anecdotes on
China’s stock market support this interpretation on the insignificant Herfindhal
coefficient on cash retention.
Column 4 in table 8 shows that there is a highly significant positive relation
between financial leverage and investment ratios in the government-controlled companies.
However, I do not find a significant relation in the companies under the control of a
commercial entity. The investment of the government-controlled firms tends to be
37

financed by bank loans, since the budget constraints are relatively soft. However, firms
under control of a commercial entity have a higher propensity to use their internal cash
flows or equity to finance their investments. This finding suggests that the firm under the
control of the government shareholder uses debt financing to expand corporate operations
and build up a managerial empire.
5.3 Board-member Turnover and Debt
Table 9 investigates whether debt has an impact on managerial entrenchment.
Board member turnover is the converse of managerial entrenchment. In the regressions
presented in table 9, there is no significant relation between board member turnover and
debt level.
I further decompose my sampled firms into the going concerns and loss makers.
The coefficient of bank loans remains insignificant.19 Therefore, there is no evidence to
support the view that debt affects managerial entrenchment, even in the firm in financial
distress where the Aghion-Bolton shift of corporate control (1992) from shareholders to
creditors is expected. Hypothesis CF is rejected by the Chinese data, but this finding fits
the broad framework of Hypothesis SBC. In fact, there are very few cases where bankers
have succeeded in removing incumbent management teams.
Whether the firms are under the control of the government or a commercial entity
does not change the ineffectiveness of financial leverage on managerial entrenchment, as
reported in Column 4 and 5. Bankers generally have no significant impact on managerial
19 To be concise, I do not present the regression tables in the decomposition format.
38

replacement, since the Aghion-Bolton shift of corporate control seldom happens in
Chinese PLCs under the weak enforcement of the trial code of bankruptcy.
Table 9: Regressions of Board-member Turnover
The table reports the regression results of board-member turnover frequency on debt. The dependent variable, the ratio of board-member turnover is by the annual number of resigning directors in the board over the total number of directors, adjusted by industries and years. Column 1 reports the robust ordinary-least-square regressions (OLS), Column 2 reports the efficient maximum-log-likelihood panel regressions (MLP), and Column 3 reports the Arellano-Bond GMM regressions (DPD). The firms are clustered into two groups: If a firm is under government control, it is within the sub-sample of State. If a firm is under the control of a commerce entity, it is within the sub-sample of Commerce. Columns 4 and 5 are the results of the OLS regressions (OLS), which are consistent with MLP and DPD. The coefficients of debt ratio are compared with running complementary regressions and I report the significance in Column 6. The control variables are introduced in Appendix 3. The Hadi method is followed to remove the outliers. The standard deviations are reported in the parenthesis. *** indicates being highly significant with p-value smaller than 0.01, ** indicates being significant with p-value smaller than 0.05 and * indicates being marginally significant with p-value smaller than 0.10.
(1) (2) (3) (4) (5) (6) OLS MLP DPD State Commerce Differ Debt 0.096 0.096 -0.251 -0.098 0.154 -0.390
(0.064) (0.067) (0.167) (0.183) (0.160)
Size -0.047*** -0.047*** -0.053 -0.055*** -0.007 (0.009) (0.010) (0.044) (0.010) (0.030)
Tangible -0.048 -0.048 -0.120 -0.101* 0.124 (0.052) (0.055) (0.121) (0.057) (0.160)
Herfindhal 1.785*** 1.783*** 1.703 2.023*** 2.841 (0.533) (0.522) (1.884) (0.597) (2.515)
Age -0.001*** -0.001*** -0.001** -0.002 (0.000) (0.000) (0.000) (0.002)
Lagged Debt -0.009 (0.027)
Constant 1.019*** 1.019*** 0.126*** 1.077*** 0.148
(0.192) (0.198) (0.011) (0.201) (0.600)
Observations 1590 1590 601 507 204 F / Chi^2 test 7.42 40.55 6.06 8.28 0.69 Significance 0.000 0.000 0.000 0.000 0.657 R-squared 0.025 0.031 0.226
39

Table 9, however, shows that a concentrated shareholding structure increases the
frequency of board member turnovers and reduces managerial entrenchment. The change
of managers depends on the controlling shareholder. A sufficiently large shareholding
stake is necessary for the success in removing a manager, which suggests that equity
governance functions in China. The size variable is negatively associated with board
member turnovers. Merger and acquisition happens in small sized companies more
frequently than in large sized companies. I further find that firm age has a positive impact
on managerial entrenchment. The reshuffling of a board of directors is a selection process.
Having selected the right people, the firms with a longer history tend to have a more
stable board of directors.
5.4 General Effects of Financial Leverage
Table 10 in the following pages further examines the general effect of financial
leverage on managerial exploitation, corporate efficiency and corporate value.
40

Table 10: Regressions of Managerial Exploitations
The table reports regression results of three comprehensive proxies of managerial exploitations on debt are reported. Panel 1 reports the results taking the managerial exploitation ratio as dependent variable that is loaded by the factors of administration cost, cash retention, board-member turnover. Panel 2 reports the results taking the corporate efficiency ratio as dependent variable that is measured as operating expense scaled by annual sales. Panel 3 reports the results taking the corporate efficiency ratio as dependent variable that is measured as the sum of market value of equity plus book value of debt over book value of total assets. Three independent variables are adjusted by industries and years. Column 1 reports the robust ordinary-least-square regressions (OLS), Column 2 reports the efficient maximum-log-likelihood panel regressions (MLP), and Column 3 reports the Arellano-Bond GMM regressions (DPD). The firms are clustered into two groups: If a firm is under government control, it is within the sub-sample of State. If a firm is under the control of a commerce entity, it is within the sub-sample of Commerce. Columns 4 and 5 are the results of the OLS regressions (OLS), which are consistent with MLP and DPD. The coefficients of debt ratio are compared with running complementary regressions and I report the significance in Column 6. The control variables are introduced in Appendix 3. The Hadi method is followed to remove the outliers. The standard deviations are reported in the parenthesis. *** indicates being highly significant with p-value smaller than 0.01, ** indicates being significant with p-value smaller than 0.05 and * indicates being marginally significant with p-value smaller than 0.10.
Panel 1: Factor-loaded Managerial Exploitation Ratio
(1) (2) (3) (4) (5) (6) OLS MLP DPD State Commerce Differ Debt 1.400** 1.066** 4.005*** 2.466** 1.677 1.980**
(0.679) (0.494) (1.047) (1.041) (1.158)
Size -0.114* -0.171** -0.638** 0.117* 0.111 (0.067) (0.084) (0.312) (0.069) (0.190)
Tangible -0.857* -0.541 -0.212 -0.579 -2.670** (0.446) (0.447) (0.839) (0.436) (0.949)
Herfindhal -8.017*** -9.262** -3.674 0.001 0.003 (2.976) (4.595) (13.848) (0.002) (0.006)
Age 0.002 0.003 -5.756 9.881 (0.002) (0.005) (3.923) (21.082)
Lagged Debt -0.114** (0.052)
Constant -2.658* -3.608** -0.054 -2.634* -3.807
(1.435) (1.712) (0.076) (1.413) (5.259)
Observations 1497 1497 523 489 186 F / Chi^2 test 10.78 78.14 25.74 9.35 2.71 Significance 0.000 0.000 0.000 0.000 0.015 R-squared 0.044 0.082 0.052
41

Panel 2: Corporate Efficiency
(1) (2) (3) (4) (5) (6) OLS MLP DPD State Commerce Differ Debt 0.082** 1.102*** 0.058** 0.104*** -0.075 2.960***
(0.037) (0.034) (0.032) (0.036) (0.087)
Size 0.004 0.009 0.038 0.002 0.022** (0.005) (0.006) (0.027) (0.005) (0.009)
Tangible -0.070** -0.049* 0.050 -0.062* -0.025 (0.030) (0.028) (0.045) (0.033) (0.059)
Herfindhal -0.047 -0.110 -0.115 0.000 0.001** (0.239) (0.738) (0.000) (0.000)
Age 0.000 0.000 -0.280 -1.949** (0.000) (0.000) (0.281) (0.800)
Lagged Debt 0.036* -0.920*** -1.002*** (0.022) (0.102) (0.149)
Constant -0.052 -0.207* 0.014*** 0.064 -0.291*
(0.100) (0.115) (0.004) (0.106) (0.174)
Observations 2286 2286 1021 711 269 F / Chi^2 test 17.74 214.31 10.87 16.23 12.77 Significance 0.000 0.000 0.000 0.000 0.000 R-squared 0.095 803 0.095 0.221
(0.303)
42

Panel 3: Corporate Value
(1) (2) (3) (4) (5) (6) OLS MLP DPD State Commerce Differ Debt -0.942*** -0.947*** -0.579* -0.918*** -1.303*** -0.385
(0.133) (0.159) (0.317) (0.108) (0.249) **
Size -0.080*** -0.037*** -0.627*** -0.256*** -0.333*** (0.011) (0.014) (0.103) (0.024) (0.056)
Tangible 0.242*** 0.317*** 0.001 0.181 -0.294 (0.063) (0.066) (0.276) (0.141) (0.307)
Herfindhal 2.466*** 1.923** 2.673* -0.003*** 0.003 (0.561) (0.718) (1.499) (0.001) (0.003)
Age -0.002*** -0.002*** 2.894** 10.312** (0.000) (0.001) (1.188) (4.281)
Lagged Debt 0.128*** 1.696*** 7.092*** (0.045) (0.433) (1.456)
Constant 1.570*** 0.741*** 0.076*** 5.293*** 6.009***
(0.225) (0.281) (0.023) (0.493) (1.103)
Observations 2288 2288 1026 711 269 F / Chi^2 test 22.71 43.68 47.34 26.72 12.24 Significance 0.000 0.000 0.000 0.000 0.000 R-squared 0.057 0.099 0.290
43

5.4.1 Managerial Exploitation
In table 10, Panel 1 presents the proxy for managerial exploitation, which is based
on factor loading with the administration cost ratio, board member-turnover ratio and
investment ratio. The regression on these three sub-categories of managerial exploitation
explains about 90% of this principal factor as the index of managerial exploitation. In
robust OLS regression, every 1% increase of financial leverage increases managerial
exploitation by 1.4%.20 I conclude that debt promotes managerial exploitation.
Size is negatively related to the managerial exploitation ratio. The large sized
companies are in the spotlight of analysts’ monitoring and media coverage. It further
implies that problems of managerial exploitation can be serious in small-sized firms that
are not listed on the stock market. The negative Herfindhal ratio in Columns 1 and 2
shows the controlling effect of ownership concentration on managerial exploitation. This
ratio is not significant in Columns 3 and 4, since all the firms in the two sub-samples are
highly concentrated. Generally speaking, the significant coefficients of this ratio suggest
that equity governance in China does work, although it may not be as effective as in
modern western firms.
Columns 3, 4 and 5 show that government ownership is a main determinant of the
facilitator role of debt on managerial exploitation. In the firms with relatively hard budget
constraints, debt does not have a significant impact on managerial exploitation. Debt
facilitates managerial exploitation only in the firms with serious soft budget constraints.
20 Financial leverage increases 1.1% managerial exploitation in the MLP regressions and 2.0% in DPD regressions, similar to OLS results.
44

Debt does not provide corporate governance in both clusters. These findings support
Hypothesis SBC, but not Hypothesis CF.
5.4.2 Corporate Efficiency
The ratio of operating expense to total assets is a proxy for both managerial
exploitation (Ang et al. 2000) and corporate inefficiency. A firm with high managerial
exploitation should have low corporate efficiency.
Panel 2 shows a positive relation between the expense ratio and debt ratio. If the
ratio of bank loans to total assets increases by 1%, the ratio of operating expense to total
assets rises by 0.1%. When the firm is highly leveraged, corporate efficiency is low. Debt
does not motivate the firm’s managers to reduce costs or improve efficiency. It
contradicts the governance hypothesis of CF. Hypothesis SBC argues that the debt
enables managers to control more cash. If managers can access the low-risk bank credit
and have more free money, the firm is under less pressure to survive and has less
incentive to be efficient.
There is a significantly positive impact of leverage on expense ratios in the firms
under the control of the government, but I do not find a significant relation in the firms
controlled by a commercial entity. Debt reduces efficiency when the government
shareholder stays in control, which is consistent with the interpretations of debt
exploitation under soft budget constraints.
45

5.4.3 Corporate Value
In table 10, Panel 3 presents the significant negative relation between Tobin’s Q
and debt ratio. The increase of leverage decreases market value of the firms. My finding
is again aligned with Hypothesis SBC.21 When bank loans are large, the market perceives
the problem of managerial exploitation and devalues these firms, since large loans are
associated with a high probability of tunneling and empire building.
In my set of control variables, I find that corporate value is high when the firm
has a concentrated shareholding structure, supporting the arguments of Shleifer and
Vishny (1986) that large shareholders increase the valuation of the firms. In a late study,
Shleifer and Vishny (1997) articulate that large shareholders help to improve corporate
governance and therefore increase corporate value. Panel 3 also shows the older firms
have a lower value.
In Columns 4 and 5, I find that the financial leverage reduce the value of
government-controlled firms by the magnitude of 92% and reduce the value of
commerce-controlled firm by 103%. The quantitative difference is statistically significant.
If I take corporate value as a proxy for managerial exploitation, it would imply that the
failure of debt governance in commerce-controlled firms is more severe. This finding is
contrary to my findings with the previous tables. However, as noted, Q is based on
market pricing of the firms, and the market valuation of the firms is based on the
magnitude of the expected cash flows and the associated probability of receiving the cash
21 As suggested in Section 3, there is no clear predication of Hypothesis CF on the relation between financial leverage and corporate value. Titman and Wessels (1988) and Rajan and Zingales (1995) find that there is a negative relation between the market-to-book value and debt ratios in developed markets. Their findings may be driven by the risk of financial distress (Fama and French 1992) and by the tendency for firms to issue SEOs when P/E ratios are high, which decreases the leverage ratios (Rajan and Zingales 1995).
46

flows. The government-controlled firms have softer budget constraints, which means that
the cost of financial distress is relatively lower and the probability of receiving expected
cash flows is higher than it is for the commerce-controlled firms. The market therefore
downgrades the government-controlled firms less than it does the commerce-controlled
firms when they raise new loans.
Soft budget constraints mean a low risk of bankruptcy. Without the risk of
bankruptcy, the market should have welcomed a new infusion of capital, since
shareholders can exploit bankers under such an institutional setting. However, the
magnitude of expected cash flows for shareholders is reduced by managerial exploitation
of corporate wealth. A higher financial leverage indicates a higher managerial
exploitation. The shareholders reduce their valuation of a firm with a higher managerial
exploitation. Debt therefore has a negative impact on corporate value. Hypothesis SBC is
still supported by the findings in Panel 3 of table 10.
6. Further Discussions
Regardless of the issue of causality, my findings reject Hypothesis CF and support
Hypothesis SBC. This section further discusses whether these two hypotheses are
contradictory. I argue that banks are not only snared by the firm managers but also
trapped by the government owners.
47

6.1 Which Comes First, Bank Loans or Managerial Exploitations?
I find that debt is a driver of managerial exploitation. If there is single direction of
causality, there should be a timely order. That is, bank loans should happen before
managerial exploitation if bank loans cause managerial exploitation. Although the
causality problem is not the concern of this paper, as argued below, the regression
found that α is
significant. It implies that debt causes managerial exploitation. Consistent with
Hypothesis SBC, bank loans enlarge the resources under the control of the managers.
With more resources, the problems of tunneling and over-investment worsen.
1* B*Managerial Exploitation C Debt FirmCharactersα ε−= + + +
However, the regression
1* B*Debt C Managerial Exploitation Firm Charactersφ ε−= + + + found that φ is
also significant. Managerial exploitations also cause the accumulation of debts. If the
managers have a stronger inclination to exploit corporate wealth, they go to banks for
new loans that allow them to continue to tunnel and squander money.
I show that there is a dual causality between financial leverage and managerial
exploitation, but either direction of causality is consistent with Hypothesis SBC. My
findings with Chinese data reject the application of Hypothesis CF to China, which is the
null hypothesis. My conclusion that debt facilitates managerial exploitation under soft
budget constraints is essentially independent of the issue of causality.
48

6.2 Are Hypothesis CF and Hypothesis SBC Contradictory?
I set up the two competing hypotheses to highlight an implicit assumption of
classical finance theory that firms operate under hard budget constraints. When soft
budget constraints are the institutional reality in an emerging market economy, such as
China, debt governance fails to function. Debt then plays a facilitator role for managerial
exploitation. Under soft budget constraints, the theory of debt governance collapses. That
is, soft budget constraints are a blind spot in corporate finance theories so far. The debt
governance theory is correct in its implicit assumptions for well-established markets, but
it should not be applied to emerging markets. Put another way, these two hypotheses are
contradictory with their predictions, but the logic is intrinsically consistent.
6.3 Whose Fault, Firm Managers or Bankers?
Managerial exploitation of bank loans requires at least two cooperative players:
firm managers and bankers. Under the principal-agent theory, effective corporate
governance is necessary to control managerial exploitation. Managers in government-
controlled firms are subject to the government-based corporate governance, which is
better than the corporate governance with dispersed shareholding structures, but the
distortion exists. The government shareholder not only pursues cash flows from the firm,
but also promotes social welfare. The private interests of bureaucrats further complicate
the role of the government shareholder. Within the government’s business “empire”, the
career promotion of a firm manager not only depends on corporate performance, but also
on how well the managers follow the wills of the government and bureaucrats.
49

On the other hand, firm managers can hold up the political concerns of the
government on social problems from shutting down a government-controlled firm and
keep borrowing from the banks to expand the resources under their control and exploit
corporate wealth for personal benefits. The magnitude of managerial exploitation
increases with the size of bank loans.
This moral hazard also exists for the bankers of government-owned banks. La
Porta et al. (2000) argues that the banks under the control of the government are
politicized. Because of government ownership, typical Chinese bankers perceive
themselves as the financial agents of the government. The bankers follow the orders of
the government to providing the government-controlled firms capital rather than take care
of the profitability of their own banks. The blame for a low profitability in the banking
sector is often shifted to the policy loans that take place under the direction of the
government. Because of the ultimate backing of the government, these banks have no
fear of bankruptcy. The classical incentive problem of SOEs also exists in these
government-owned banks. Relying on the government owner, the banks are not strongly
motivated to provide due-diligence monitoring. On the contrary, such bankers may tend
to lend to a firm with a high managerial exploitation, since a corrupted firm manager will
share the private benefits with some individual bankers.
In the process to shifting capital from government-owned banks to government-
controlled firms, the firm managers put some money into their own pockets and squander
other money for personal purposes. It is not unusual for a Chinese manager with a
nominal annual salary of $4,667 to buy real estate in London or lose millions in a Las
50

Vegas casino. This corruption problem is so extensive that the cleaning-up cost of bad
loans may reach half the Chinese GDP.
The moral blame of managerial exploitation of bank loans should be attributed to
both firm managers and bankers, but the fundamental cause is the institutional
arrangement of government ownership. When the government becomes a businessman,
its own complex interests provide the opportunity for some individuals to capture
personal benefits. Dual government ownership of banks and firms inevitably causes soft
budget constraints and the failure of debt governance.
7. Conclusion
The traditional corporate finance theory argues that creditor corporate governance and
debt governance is “harder” than equity governance (Williamson 1988). Debt governance
functions by threatening to sack incumbent managers whose firms are under financial
distress, forcing out free cash flows in going concerns and encouraging due diligence
monitoring activities. Using the data of the companies on China's stock market, I find that
financial leverages are associated with decreasing Tobin's Q, increasing expense ratios
and increasing administration expenditures. There is a failure of debt governance.
Furthermore, I find that firms under the control of a government shareholder have a
higher integration of debts and managerial exploitation. The softness of budget
constraints influences the magnitude of the correlation between bank loans and
managerial exploitation.
51

I argue that soft budget constraints fundamentally change the governance role of
debt. Under soft budget constraints, debt is a catalyst for managerial exploitation. That is,
debt gives the managers a free hand over a larger pool of capital. Over-investment and
tunneling destroy shareholder value. The problem of debt governance in China is even
more profound and deep-rooted than that of pre-crisis East Asian countries, because of
the widespread business of the Chinese government. The facilitator role of debt in
managerial exploitation could one day bring down the Chinese economic giant.
Soft budget constraints result from the widespread businesses of the government.
The dual government ownership of the banks and enterprises inevitably results in
bureaucratic coordination of economic activities.22 Due to the political benefits of social
stability, this coordination rationally obstructs bankruptcies. Firm managers can snare the
financial institutions of banks. Surveying competition and corporate governance literature
on central and eastern European economy, Estrin (2002) argues that privatization alone is
not enough, enterprise reform also requires effective corporate governance and hard
budget constraints. However, this paper suggests that privatization is a pre-condition for
hard budget constraints. The fundamental correction of the failure of debt governance
requires the government to desist from owning and conducting business.
22 My findings concerning the governance vacuum in government-control firms, with the major creditors as the government-owned banks, provides new evidence to support the inefficiency of government ownership of banks (La Porta, Lopez-de-Silanes and Shleifer 2000). The argument of governance failure enriches their “political” theories.
52

Appendix 1: Data Sample: Sources and Data Selection There are three main electronic databases of annual reports. Internationally, the
leading data vendor is the Taiwan Economic Journal (TEJ), but the TEJ database has a
large number of missing values. The domestic investment bankers and securities analysts
tend to use the Genius database. The Hairong database provides information on the large
shareholders’ holding stakes. My data set also combines some information from other
sources.
In 1994, the Company Law that formally legislates the organizational form of the
joint stock companies with the Anglo-American featured corporate governance structures
took effect. In the same year, the China Securities Regulatory Commission introduced a
series of six rules called the Contents and Forms of the Information Release by PLCs,
which formatted the annual reports. My data sample therefore starts from 1994.
Describing corporate features and mapping of the ownership structures are based on the
most recent data of 1998.
This paper imposed two restrictions on my sample. It excluded fund management
companies, as their operations are distinctly different from industrial firms23. It also
excluded the firms that do not issue shares for domestic investors24; otherwise, I would
have had to use the share prices from the markets of foreign investors, but such market
values are not comparable. After these restrictions, the sample used to examine the
relation between state shareholding and corporate value includes 287 companies in 1994,
311 in 1995, 517 in 1996, 719 in 1997 and 826 in 1998. Altogether, the main data set
used in this paper has 2660 firm-year observations.
The following table reports the sources of my database. The main data source is
the Genius database, but I complement it using a number of other databases. With regards
to accountancy and ownership data, the validity of the data sets is crosschecked, and
missing points were made up, based on annual reports from a website of the Shenzhen
Stock Exchange http://www.cninfo.com.cn/.
23 Furthermore, due to regulations, fund management companies are excluded the government shareholder. 24 A-shares are the shares denominated in Chinese currency and traded on either the SSE or the SZSE. There are also so-called B-shares, H-shares and N-shares, which are mainly for foreign investors.
53
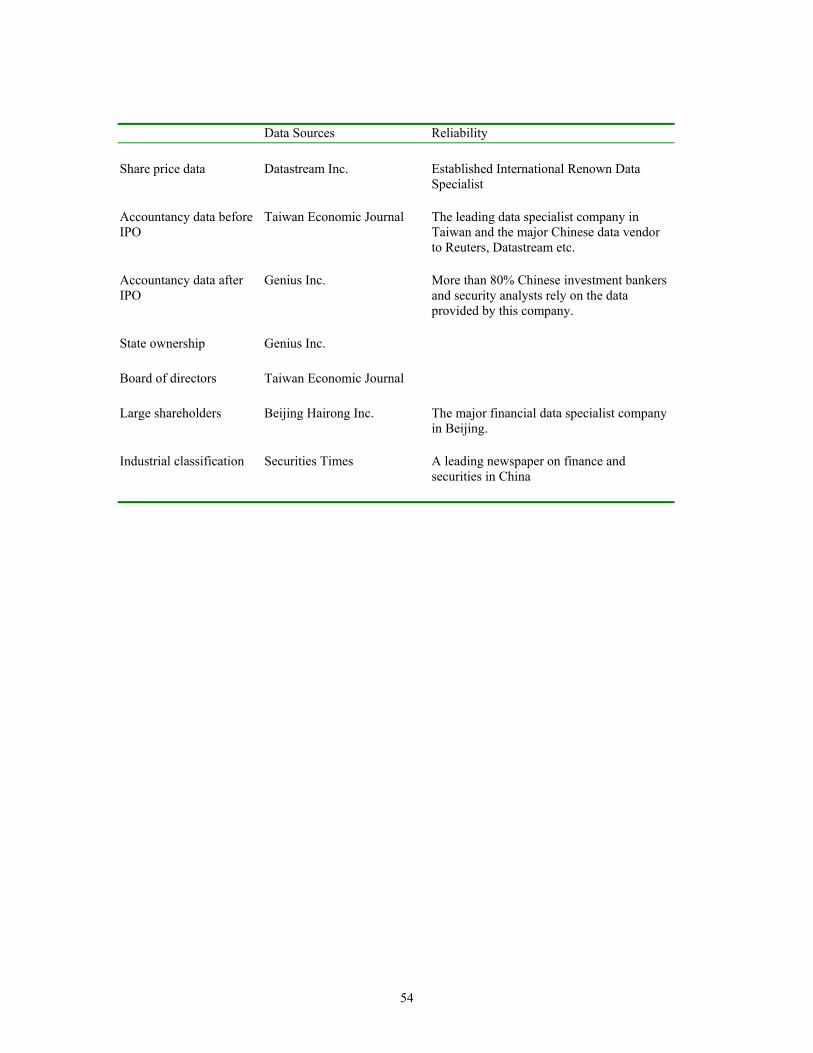
Data Sources Reliability
Share price data Datastream Inc. Established International Renown Data Specialist
Accountancy data before IPO
Taiwan Economic Journal The leading data specialist company in Taiwan and the major Chinese data vendor to Reuters, Datastream etc.
Accountancy data after IPO
Genius Inc. More than 80% Chinese investment bankers and security analysts rely on the data provided by this company.
State ownership Genius Inc. Board of directors Taiwan Economic Journal Large shareholders Beijing Hairong Inc. The major financial data specialist company
in Beijing. Industrial classification Securities Times A leading newspaper on finance and
securities in China
54

Appendix 2: Multivariate Regressions: Models, Control Variables and Methods
Here, I introduce the basic setting of my econometric model and its variations. The
definitions of variables are presented. I then discuss briefly the regression methods.
Model Set-up
Examining the relation between financial leverage and managerial exploitation,
the basic model to estimate is:
εα +++= tersFirmCharacDebtConExploitatiManagerial *B*
Following the conceptual framework in Section 2, the dependent variables of
managerial exploitation are perks, entrenchment and empire building. I use factor
analysis to load the principal components and construct the variable of managerial
exploitation. The independent variable of debt is mainly reported with the ratios of total
bank loans to total capital, but other gearing ratios are also tested. Based on the available
data, I control for a range of firm-specific shocks. It includes shareholding structure,
managerial shareholding, firm size, firm age, asset specificity and profitability.
Following Berger and Ofek (1995), I control for the industry-specific shocks by
normalizing dependent variables on their medians for the same industry.25 I also control
for the time-specific shocks by normalizing dependent variables on the five-year medians
of the same firm, since the macro environment keeps changing with time in China.
Discussing the influence of soft budget constraints, I not only test the interaction
term of debt and budget constraints, but also examine the impact of debt on managerial
exploitation within different groups that face different budget constraints. I then compare
the regression coefficients in different groups to show the differences in the impact of
debt on managerial exploitation.
25 There are two kinds of industrial classifications for Chinese PLCs. One is the five-industry code: manufacturing, trade, utility, real estate and conglomerates. It is used by most studies on Chinese PLCs (for example, Xu and Wang 1999), but the industry effects cannot be well captured by this over-simplified industry classification (Chen and Jiang 2000). The other is a two digit standard industrial classification as 21-industry-code, which is used in this paper. Adopting this two-digit industrial classification is a significant technical feature of this study.
55

Factor Loading Analysis of Managerial Exploitation
This table shows our construction of the artificial managerial exploitation ratios.
Based on eigenvalues, Panel 1 shows that the three principal components of
administration-cost ratio, board-member-turnover ratio and investment ratio demand a
main common factor as Factor 1, which is the index of managerial exploitation. Panel 2
reports the influences of these three components on the index of managerial exploitation.
Panel 1: Principal Factors of Admin.Cost, Board Turnover and Investment Ratio Factor Eigenvalue Difference Proportion Cumulative
1 0.320 0.321 2.473 2.4732 -0.001 0.188 -0.011 2.4613 -0.189 . -1.461 1.000
Panel 2: Factor Loading for Managerial Exploitation Variable Exploitation Uniqueness Bartlett Score
Admin Cost 0.399 0.841 1.187Board Turnover -0.047 0.998 -1.139Investment Ratio 0.398 0.842 1.187
Control Variables
The factors of size, tangibility, age, ownership and profitability can induce
spurious correlations between proxies of managerial exploitation and financial leverages.
Size With regard to economic fundamentals, large-sized firms have scale
economies and better access to bank credits (Chhibber and Majumdar 1999). On the other
hand, corporate size affects governance. For instance, a large-sized firm draws the
attentions of the media and therefore closer monitoring. I control for size effect in my
multivariate analysis.
Tangibility The asset structure or the assets’ tangibility influences firms’
growth and corporate valuation (Vilasuso and Minkler, 2001). The scales of managerial
exploitation probably systematically vary with the structure of corporate assets. Mortgage
56

borrowing depends on the tangibility of assets and so asset structure influences capital
structure. A spurious correlation between managerial exploitation and financial leverage
is therefore induced by tangibility. In addition, the tangibility ratio also helps to identify
the growth potential of a company.
Age A firm with a long history can establish its reputation in the debt market
and so firm age influences debt ratios. On the other hand, managerial exploitations, such
as the entrenchment problem, is expected to vary with firm age. Firm age needs to be
controlled for.
Shareholding structure Corporate governance literature (Shleifer and
Vishny 1997) argues that a concentrated shareholding structure improves corporate
governance and therefore reduces managerial exploitation. The creditors decide their
lending policies and scales with reference to the shareholding structures. Herfindhal
index is a proxy of the shareholding concentration by calculating the weight of the ten
largest shareholders’ holding stakes.
Regression Methods
I performed pooled ordinary linear regressions adjusted by White robust
estimators (OLS), the maximum log-likelihood panel data estimation (MLP) and the
Arellano-Bond GMM method (dynamic-panel-data, DPD).
The robust OLS regressions are widely used in corporate finance literature. OLS
estimation, associated with robust standard errors, produces consistent standard errors
even if the data is weighted or the residuals are not independently distributed.
MLP models estimate the cross-sectional time series data. The MLP model
assumes the random effect of panel data, which counts for both the individual specific
effects and time specific effects. The merits of panel data models comprise resolving or
reducing the magnitude of a potential normal econometric problem that omitted variables
might be correlated with explanatory variables. More importantly, the cross sectional
OLS regression as the between-estimator is less efficient because it discards the overtime
information in the data, in favor of simple means. The MLP model uses both the within
and the between information. In comparison with fixed effects models, Mundlak (1978)
argues that one should always treat the individual effects as random. Moreover, covering
57

from 287 firms in 1994 to 826 firms in 1998, my unbalanced panel data set is wide and
longitudinal. In addition, the results of Baltagi-Li LM tests also support the assumption of
random effects. The maximum log-likelihood estimation of the MLP model is consistent
and asymptotically efficient for my data.26
Some people argue that the current managerial exploitation depends on previous
managerial exploitations. Corporate history may influence the distribution of managerial
exploitation proxies. Although I cast doubt on this claim, it is good to test the impact of
debt on the dynamic managerial exploitation. I report the regression result in the
Arellano-Bond (1991) framework here.27 Using the Sargon test, my choice of control
variables and the inclusion of the first lag of the independent variables are justified. In
addition, the presentation of this GMM method shows the robustness of my OLS
regressions.
26 Moulton (1986) shows that the standard errors of the OLS estimation for the one-way error component model with the unbalanced panel data set are biased. The GEE population-averaged panel data models are used to check the robustness of the MLP models. The results are very similar and the tables of the GEE models are not presented here. 27 Comparing with the Anderson and Hsiao (1981, 1982) instrumental methods, Arellano and Bond (1991) argue that a more efficient estimator results from the use of additional instruments whose validity is based on orthogonality between lagged values of the dependent variable and the errors . The Arellano-Bond estimator is now widely used in short dynamic panels.
58

Appendix 3: Scatterplot Matrices of Debt and Managerial Exploitation The following two figures show the two-way scatterplots of debt ratio and the proxies of managerial exploitation, based on the data adjusted by industries. Matrix 1: Debt Ratio and Direct Proxies of Managerial Exploitations
Debt Ratio
Investm ent R atio
Investment Ratio
Board-m em ber Turnover R atio
Board-Member Turnover
Ratio
Adm in istra tion C ost Ratio
Administration Cost Ratio
59

Matrix 2: Debt Ratio and Comprehensive Proxies of Managerial Exploitation
Debt Ratio
Exploitation Ratio
Expense Ratio
Q Ratio
60

Bibliography Aghion, Philippe and Patrick Bolton, 1992. An Incomplete Contracts Approach to Financial Contracting. Review of Economic Studies 59(3): 473-494. Anderson, Theodore W. and Cheng Hsiao, 1981. Estimation of Dynamic Models with Error Components. Journal of the American Statistical Association 76: 598-606. Anderson, Theodore W. and Cheng Hsiao, 1982. Formulation and Estimation of Dynamic Models Using Panel Data. Journal of Econometrics 18: 47-82. Ang, James S, Rebel A. Cole and James Wuh Lin, 2000. Agency Costs and Ownership Structure. Journal of Finance 55(1): 81-106. Arellano, Manuel and Stephen Bond. 1991. Some tests of specification for panel data: Monte Carlo evidence and an application to employment equations. Review of Economic Studies 58: 277-297. Berger, Philip G. and Eli Ofek, 1995. Diversification’s Effect on Firm Value. Journal of Financial Economics 37: 39-65. Berger, Philip G., Eli Ofek and David L. Yermack, 1997. Managerial Entrenchment and Capital Structure Decisions. Journal of Finance 52(4): 1411-1438. Booth Laurence, Varouj Aivazian, Asli Demirguc-Kunt and Vojislav Maksimovic, 2001. Capital Structures in Developing Countries. Journal of Finance 56(1): 87-130. Chen, Xiao and Jiang Dong, 2000. Ownership Pluralization, Firm Performance and Intra-industry Competition. Economic Research Journal (Chinese) 2: 28-35. Chhibber, Pradeep and Sumit Majumdar, 1999. Foreign Ownership and Profitability: Property Rights, Control and the Performance of Firms in Indian Industry. Journal of Law and Economics 42(1): 209-238. Chung, Kee H. and Stephen Pruitt, 1994. A Simple Approximation of Tobin’s Q. Financial Management 23(3): 70-74. Dewatripont Mathias and Eric Maskin, 1995. Credit and Efficiency in Centralized and Decentralized Economies. Review of Economic Studies 62: 541-555. Dewatripont, Mathias and Jean Tirole, 1994. A Theory of Debt and Equity: Diversity of Securities and Manager-Shareholder Congruence. Quarterly Journal of Economics 109(4): 1027-1054. Diamond, Douglas W., 1984. Financial Intermediation and Delegated Monitoring. Review of Economic Studies 51: 393-414. Estrin, Saul, 2002. Competition and Corporate Governance in Transition. Journal of Economic Perspectives 16(1): 101-124.
61

Faccio Mara, Larry H. P. Lang and Leslie Young, 2002. Debt and Corporate Governance. Social Science Research Network, working paper. Fama, Eugene F, and Kenneth R. French, 1992. The Cross-Section of Expected Stock Returns. Journal of Finance 47(2): 427-465. Franks, Julian R., Colin Mayer and Luc Renneboog 2002. Who Disciplines Management in Poorly Performing Companies? Journal of Financial Intermediation 10(3-4): 209-248. Friend, Irwin, and Larry H. P. Lang, 1988. An Empirical Test of the Impact of Managerial Self-interest on Corporate Capital Structure. Journal of Finance 45: 617-627. Gilson, Sturt C., 1990. Bankruptcy, Boards, Banks and Block Holders. Journal of Financial Economics 27: 355-387. Hanli Consultancy Limited, 1998. Banking Reform & Central Bank’s Policies. China Economy Digest, 1998 (3). Harris, Milton and Artur Raviv, 1988. Corporate Governance: Voting Rights and Majority Rules. Journal of Financial Economics 20(1-2): 203-35. Harris, Milton and Artur Raviv, 1990. Capital Structure and the Informational Role of Debt. Journal of Finance 45(2): 321-349. Harris, Milton and Artur Raviv, 1991. The Theory of Capital Structure. Journal of Finance 46(1): 297-355. Jensen, Michael C., 1986. The Agency Costs of Free Cash Flow: Corporate Finance and Takeovers. American Economic Review 76(2): 323-329. Jensen, Michael C. and William H. Meckling, 1976. Theory of the Firm: Managerial Behavior, Agency Costs, and Ownership Structure. Journal of Financial Economics 3(4): 305-360. Kornai, Janos, 1980. Economics of Shortage. Amsterdam: North-Holland. Kornai, Janos, 1992. The Socialist System. Princeton, NJ: Princeton University Press. La Porta, Rafael, Florencio Lopez-de-Silanes and Andrei Shleifer, 2000. Government Ownership of Banks. Journal of Finance 57(1): 265-301. Lardy, Nicholas R., 1998. China's Unfinished Economic Revolution. Brookings Institution Press: Washington, DC. McConnell, John J. and Henri Servaes, 1990. Additional Evidence on Equity Ownership and Corporate Value. Journal of Financial Economics 27: 595-612. McConnell, John J. and Henri Servaes, 1995. Equity Ownership and the Two Faces of Debt. Journal of Financial Economics 39: 131-157. Moulton, Brent R., 1986. Random Group Effects and the Precision of Regression Estimates. Journal of Econometrics 32(3): 385-397. Mundlak,Yair, 1978. On the Pooling of Time Series and Cross Section Data. Econometrica 46(1): 69-85.
62

Perfect, Steven B. and Kenneth W. Wiles 1994. Alternative Constructions of Tobin's Q: An Empirical Comparison. Journal of Empirical Finance 1(3-4): 313-341. Rajan, Raghuram, and Luigi Zingales, 1995. What Do We Know about Capital Structure? Some Evidence from International Data. Journal of Finance 50: 1421-1460. Shin, Hyun-Han and Rene R. Stulz, 1998. Are Internal Capital Markets Efficient? The Quarterly Journal of Economics 113(2): 531-552. Shleifer, Andrei and Robert W. Vishny, 1986. Large Shareholders and Corporate Control. Journal of Political Economy 94(3): 461-488. Shleifer, Andrei and Robert W. Vishny, 1994. Politicians and Firms. Quarterly Journal of Economics 109(4):995-1025. Shleifer, Andrei and Robert W. Vishny, 1997. A Survey of Corporate Governance. Journal of Finance 52(2): 737-783. Tian, Lihui, 2000. Government Shareholding and the Value of China’s Modern Firms. Institute of Finance and Accounting at the London Business School, Working Paper No. 319. Titman, Sheridan and Roberto Wessels, 1988. The Determinants of Capital Structure Choice. Journal of Finance 43(1): 1-19. Vilasuso, Jon and Alanson Minkler, 2001. Agency Costs, Asset Specificity and the Capital Structure of the Firm. Journal of Economic Behavior and Organization 44: 55-69. Wang, Yianying, 1988. How Much Do General Managers of Public Listed Companies Receive Annually? Public Listed Companies (Chinese) 88: 8-15. Williamson, Oliver E, 1988. Corporate Finance and Corporate Governance. Journal of Finance 43(3): 567-591. World Bank, 2000. Corporate Governance in East Asia. Washington DC: World Bank Publications. Xu, Xiaonian and Yan Wang, 1999. Ownership Structure and Corporate Governance in Chinese Stock Companies. China Economic Review 10: 75-98.
63