Debt and Dividends in Pyramidal Structures: Evidence from France
46
Debt and Dividends in Pyramidal Structures: Evidence from France Abe de Jong Department of Finance Rotterdam School of Management, Erasmus University PO Box 1738, 3000 DR Rotterdam, Netherlands [email protected] Phone: 31-10-408-1022 Douglas V. DeJong * Tippie College of Business, University of Iowa Iowa City, IA 52242, USA [email protected] Phone: 319-335-0919 Fax: 319-335-1956 Ulrich Hege Department of Finance, HEC Paris 78351 Jouy-en-Josas Cedex, France [email protected] Phone: 33-1 39 67 72 99 Gerard Mertens Department of Accounting and Control Rotterdam School of Management, Erasmus University PO Box 1738, 3000 DR Rotterdam, Netherlands [email protected] Phone: 31-10-408-2556 Draft: 19 April 2009 * Corresponding author. The authors appreciate the helpful comments from Daniel Wolfenzon and T.J. Wong, as well as from seminar participants at Chinese University of Hong Kong, Tilburg University, University of Cologne, HEC Paris, Helsinki School of Economics, Swedish School of Economics and the 2008 European Accounting Association. The authors acknowledge the excellent and extensive research assistance provided by Sereeparp Anantavrasilp.
-
Upload
marichel-verly -
Category
Documents
-
view
214 -
download
0
description
Economic
Transcript of Debt and Dividends in Pyramidal Structures: Evidence from France

Debt and Dividends in Pyramidal Structures:
Evidence from France
Abe de Jong
Department of Finance
Rotterdam School of Management, Erasmus University
PO Box 1738, 3000 DR Rotterdam, Netherlands
Phone: 31-10-408-1022
Douglas V. DeJong*
Tippie College of Business, University of Iowa
Iowa City, IA 52242, USA
Phone: 319-335-0919
Fax: 319-335-1956
Ulrich Hege
Department of Finance, HEC Paris
78351 Jouy-en-Josas Cedex, France
Phone: 33-1 39 67 72 99
Gerard Mertens
Department of Accounting and Control
Rotterdam School of Management, Erasmus University
PO Box 1738, 3000 DR Rotterdam, Netherlands
Phone: 31-10-408-2556
Draft: 19 April 2009
* Corresponding author.
The authors appreciate the helpful comments from Daniel Wolfenzon and T.J. Wong, as
well as from seminar participants at Chinese University of Hong Kong, Tilburg
University, University of Cologne, HEC Paris, Helsinki School of Economics, Swedish
School of Economics and the 2008 European Accounting Association. The authors
acknowledge the excellent and extensive research assistance provided by Sereeparp
Anantavrasilp.

Debt and Dividends in Pyramidal Structures:
Evidence from France
Abstract
Analyzing pyramids in France, this paper explores the use of leverage in the pyramidal
control chain as a control-enhancing mechanism and its relationship to payout policy. In
contrast to previous work, we consider not only the control-enhancing effect of equity but
explicitly include debt contracted along the control chain. We document that debt in
holding companies constitutes a dominant part of the overall discrepancy between control
rights and cash flow rights (the control wedge). We closely scrutinize the interaction
between leveraged pyramids and payout policy. We find that the dividend payout
decreases in the equity portion of the control wedge. At the same time, our evidence
shows that the debt portion of the control wedge leads to larger dividend payouts. We
suggest that the use of leverage in holding companies commits the dominant owner to
more generous payouts since the dividends are needed to service debt in the pyramidal
structure. We argue that this debt service hypothesis helps resolve contradictory results
among earlier empirical studies. Only a fraction of the cash made available to controlling
owners is actually paid out to them, consistent with the view that in leveraged pyramids,
servicing debt along the control chain is a primary motive for dividend payouts.
Keywords: pyramids, payout policy, leverage, ownership structure, control wedge,
disproportionality of control and cash flow rights.
JEL classification: G32, G34, G35.
1
Dividend payouts are an important focus of attention in studies that investigate the conflict
of interests between dominant and minority shareholders in listed companies. The prevalent
view, the Expropriation Hypothesis introduced by La Porta, Lopez-de-Silanes, Shleifer and
Vishny (2000), maintains that dominant owners prefer to keep cash resources within the
firm rather than share them with minority shareholders. The weaker the investor protection
and the larger the distance between the dominant owner’s voting rights and cash flow
rights, the smaller should be the payout. Empirical support, however, is mixed. On the one
hand, the findings of La Porta et al. (2000) are consistent with the Expropriation
Hypothesis. On the other hand, Faccio, Lang and Young (2001) present evidence that
dominant owners in business groups pay larger dividends. They refer to an alternative
view, the Substitution Hypothesis, that stipulates shareholders care about the stock market
value since they want to issue additional equity in the future and thus build a reputation by
paying higher dividends. It is an open question how to reconcile these views and the
seemingly contradictory evidence in these large-scale cross-country studies.
Studies of ownership structure typically do not consider that owners, even dominant ones,
may use borrowed money to finance their shareholdings. In pyramidal ownership structures
in particular, the presence of holding companies under control of an ultimate owner
provides ample opportunity for levering with debt. Leveraged financing of dominant
owners affects the incentives concerning the use of holding companies as well as dividend
payouts. This paper analyzes pyramidal structures in France and presents findings that help
our understanding of these issues. France is an ideal laboratory for this study due to its
specific institutions.1 We find that companies characterized by a large equity-based
discrepancy between control rights and cash flow rights (the equity wedge) pay out less
cash, in accordance with the Expropriation Hypothesis. However, we also find that the use
of leverage in pyramidal structures increases dividend payouts. The latter finding, taken in
isolation, favors the Substitution Hypothesis. We suggest an alternative view to reconcile
both findings, the Debt Service Hypothesis. According to this hypothesis the use of
leverage in pyramidal control chains commits the dominant owner to larger dividend
payouts. The Debt Service Hypothesis emphasizes the need to pay higher dividends in
1As fully detailed in Section 3.1, France’s regulatory structure implies that the use of pyramids is the only
way to reliably engineer a control wedge. Pyramids in France are tax neutral and pyramidal capital
structures are highly transparent.
order to service the debt contracted in leveraged pyramids. It offers a middle ground that
helps our understanding of the seemingly contradictory findings in earlier studies and in
our own: the discrepancy between cash flow and control rights increases expropriation, but
at the same time the debt portion of the control wedge commits the large shareholder to a
more generous payout.
To appreciate the importance of leverage in pyramidal structures, consider the example of
Fimalac, the owner of the credit ratings agency Fitch IBCA drawn from our sample. There
is a holding vehicle, Groupe Marc de Lacharrière, with a 53.7% interest in Fimalac in
2003. The ultimate owner, Marc de Lacharrière, has a 100% interest in Groupe Marc de
Lacharrière. Fimalac’s other shareholders include direct ownership of 1.94% by Marc de
Lacharrière, Fidelity’s two funds with ownership stakes of 2.9% and 2.34%, and widely
held shares. Groupe Marc de Lacharrière, the holding, has debt in its capital structure with
a leverage ratio of 40.6% (100% – equity/total assets = 100% – 59.4%). Throughout, we
refer to the disproportionality between control rights and cash flow rights as the control
wedge. The conventional equity-based control wedge, or equity wedge for short, is
calculated as control rights/cash flow rights, where cash flow rights are obtained by
multiplying equity stakes along the control chain. Throughout this paper, we call the
additional control wedge that is created by leverage in holding entities the debt wedge.
Since Marc de Lacharrière has complete control of Fimalac, we calculate the equity wedge
as: control rights/cash flow rights = 1.0/(1.00x0.537) = 1.86. Adjusting for the debt in
Groupe Marc de Lacharrière, the effective control wedge is: control rights/(debt-adjusted
cash flow rights) = 1.0/[1.00x(0.537x(1.0–0.406)] = 3.15. Thus, debt in the holding
company (Groupe Marc de Lacharrière) increases the control wedge of the ultimate owner.
We calculate the debt wedge as the difference between the effective control wedge and the
equity wedge, 3.15–1.86 = 1.29.
To service its debt, the holding company needs dividend payouts from Fimalac. Such
payouts also increase the payout to the minority shareholders. Fimalac paid out 50.7% of
its cash flows as dividends. With a 53.7% stake, Groupe Marc de Lacharrièere is entitled to
€17.7 million in dividends. The holding company has other assets and the 53.7% stake in
the market value of Fimalac represents 72.6% of its book value. The interest payment of
2
the holding company is €6.2 million. The holding vehicle pays a dividend of €1.73 million
to Marc de Lacharrière. Without the pyramidal layer, Marc de Lacharrière would have
received €17.7 million, but now only receives €1.73 million, which implies a dividend
received-payout ratio = 1.73/17.7 = 0.098. Thus, our example illustrates that pyramidal
debt has three effects: it increases the control wedge; it leads to a potential increase in the
dividend payout by Fimalac; and to a decrease in the dividends received by the controlling
owner relative to the dividends paid by Fimalac. The combined impact of these three
effects on the value of the minority shareholders in Fimalac is an open question that we
investigate.
The first contribution of our paper is the study of the role of debt in holding companies as a
vehicle to enhance control of dominant owners. We find that, in France, debt in holding
companies constitutes a significant part of the total control wedge. Moreover, taking into
account debt financing helps resolve the puzzling observation noted in Almeida and
Wolfenzon (2006) that owners often hold overwhelming majority stakes, or even 100%
stakes, in an entity along their control chain. We find that in many cases, control is actually
enhanced by the use of outside debt rather than equity; in these cases, the puzzle only exists
because past literature failed to consider debt’s ability to magnify the control wedge.
Our second contribution shows that the equity wedge and the debt wedge have opposite
effects on dividend payout behavior. If the equity wedge increases, dividends decrease. If
the debt wedge increases, dividends increase. These two findings are consistent with our
Debt Service Hypothesis that views the dominant owner’s need for cash flow to service
debt obligations in holding vehicles as determining dividend payout decisions. In contrast
to our study, earlier studies only consider the equity wedge and therefore ignore debt
service payments along pyramidal control chains. Neither La Porta et al. (2000), Faccio et
al. (2001) or any of the other studies on pyramids consider the implications debt and
pyramids might have on a firm’s dividend payout policy. Though in fairness, Faccio et al.’s
(2001) sample selection criteria suggests that pyramidal firms are a significant part of their
sample. We argue that the Debt Service Hypothesis helps explain the seemingly
contradictory findings in earlier studies.
3
The third contribution of our paper is our analysis of the actual dividend payouts to
controlling owners along the entire pyramidal chain. Bertrand, Mehta and Mullainathan
(2002) note that actual dividend payouts are the best way to assess the impact of
shareholder control on expropriation in pyramids, but they are unable to observe payouts in
their data of Indian business groups.2 In contrast, our balance sheet data of holding
companies allow us to reconstruct the actual dividends that are paid by all entities along the
control chain. Earlier pyramid studies only considered potential dividend payouts to
controlling owners, defined as the maximum payout that they would obtain if each entity
along a control chain paid out all of the cash flows received from entities below. Holding
companies may retain cash for purposes of investing in other business ventures, Almeida
and Wolfenzon (2006), or to cater to different dividend preferences among shareholders.
We find that only a fraction of the cash made available to controlling owners is actually
paid out to them, with a substantial part being retained within the control chain. Our
findings are consistent with the Debt Service Hypothesis, an important motive for dividend
payout decisions is the debt service contracted in the control chain.
Our fourth contribution concerns the valuation implications of leverage and dividend
payouts in pyramids for minority shareholders in the listed bottom company. We find that
dividends in general have a positive effect on firm value, consistent with the prevalent
theories on dividend payouts and earlier studies. However, based on the reasoning used to
develop the Debt Service Hypothesis, we argue that a leveraged dominant owner could be
forced to payout higher-than-optimal dividends to service debt. Consistent with Bertrand,
Mehta and Mullainathan (2002), such dividends paid to service the debt in pyramidal
structures is another form of expropriation and has a negative effect on the value of
minority equity. Thus, the generally positive value effects of dividend payouts could be
offset by the dividends associated with the debt wedge. Our empirical findings support this
hypothesis.
2 In describing their design, Bertrand, Mehta and Mullainathan state “More specifically, we lack dividend
data for many observations, which is especially troublesome since dividend payments would be the most
direct way for a controlling shareholder to affect final returns.”
4
We verify the robustness of our analysis along various dimensions. First, we consider two
additional explanations for payout behavior, notably the idea that pyramids serve to finance
other investment interests of controlling shareholders or to cater to different dividend
preferences among shareholders.3 In our study, we provide evidence that both motivations
exist but show that the Debt Service Hypothesis is the dominant motivation for dividend
payouts. Debt along the dominant owner’s pyramidal chain is an important motivation for
the payout policy of the bottom company. In addition, we consider alternative control-
enhancing mechanisms and consider various straightforward robustness tests.
The paper is organized as follows. Section 1 reviews the relevant literature on pyramids.
Section 2 presents the theoretical arguments. Section 3 describes the study’s design and
data. Section 4 presents our results. Section 5 including potential additional explanations
and robustness tests. Section 6 concludes.
1. Related Literature on Pyramids
Pyramids are a significant organizational form worldwide. According to La Porta, Lopez-
de-Silanes, Shleifer and Vishny (1999), 26% of the listed firms worldwide are constituted
by pyramids and we argue that the proportion is probably higher due to the omission of
privately held, unobservable holding companies.4 Despite their importance, pyramids are
neither widely studied nor well understood; only selected aspects of their purpose and
effects have been investigated.
Our paper is directly linked to prior work on dividends and the relationship between
dominant shareholders and minority shareholders that includes the use of pyramids. La
Porta et al (2000) were one of the first to articulate the relevant implications of dominant
3 If some owners, including minority shareholders, prefer payouts whereas a controlling owner or other
blockholder prefers to retain cash, say for tax reasons, then a pyramidal structure positioned between the
operating company and the dividend-averse owner is an effective structure to separate dividend
preferences.
4 There is probably a substantial undercount because the fraction of listed companies classified as pyramid-
controlled by La Porta et al., (2000) and in other studies such as Faccio and Lang (2002) normally only
include companies for which at least one of the holding companies in the pyramid is a publicly listed entity.
By contrast, we classify all companies with holding companies as pyramids, even if all holding structures
are private.
5
and minority ownership on dividend payouts, Expropriation Hypothesis and Substitution
Hypothesis, and to present large cross-country evidence in favor of the Expropriation
Hypothesis. Faccio et al. (2001) find evidence in favor of substitution. Neither study
considers the role of debt and its implications for dividend payouts. Faccio et al.’s (2001)
findings for Europe indicate that affiliation to business groups increases dividend rates.
Their first of four either/or criteria that define “group affiliation,” is whether the company
is controlled by a pyramid. Effectively, their variable “group affiliation” is correlated
with pyramids and it is plausible that our study supplies a partial explanation for their
finding.5
The discussion over expropriation and substitution effects in general, and hence our
paper, is closely linked to studies relating firm valuation to pyramidal ownership and the
discrepancy between voting and cash flow rights. These studies present broad evidence
showing a negative relationship between valuation and the control wedge which is
generally viewed as supporting expropriation or tunneling (even though important
methodological problems remain, see Adams and Ferreira, 2008). The negative valuation
effect is documented by Claessens et al. (2002) for East Asia and by Lins (2003) for a
multi-regional sample of emerging markets. Bennedsen and Nielsen (2006) find similar
evidence for Continental Europe. While these studies do not specifically consider
pyramids, pyramiding is likely to be the primary reason for the divergence of cash flow
rights from control rights in these samples, Morck et al. (2005). A few papers link firm
valuation more specifically to pyramidal ownership; in particular, Claessens et al. (2002),
Volpin (2002) and Cronqvist and Nilsson (2003) provide evidence that firms with
pyramidal ownership have lower Tobin’s Q �than other firms. Holmen and Hogfeldt
(2005) study agency costs associated with pyramids in Sweden when the holding
company as well as the companies it controls are publicly listed. They suggest that this
undervaluation increases in the control wedge. These papers do not consider pyramidal
5 Faccio et al (2001) only consider publicly traded firms when defining group affiliations and pyramids. Our
sample consists of pyramids with both private and public holding companies which substantially increases the
proportion of pyramids in our sample. Faccio et al (2001) observe a positive relation between “group
affiliation” and dividends and while their finding is consistent with the Substitution Hypothesis, they cannot
explain its source. They do not observe leverage in pyramids and therefore cannot measure the full control-
enhancing impact of the pyramidal structures in their sample.
6
debt or payout policy in their sample nor their valuation effects, variables that we find are
important determinants in our sample.6
There is a literature focusing on the use of pyramids within business groups.7 Almeida
and Wolfenzon (2006) recently made important strides by proposing the only formal
theory on the purpose of pyramids. They suggest that pyramids are used to create new
businesses from retained earnings of existing companies in the presence of imperfect
capital markets, thereby taking minority investors in existing companies hostage and
expropriating them in the interest of capital accumulation. Along similar lines, Bertrand,
Mehta and Mullainathan (2002) document the importance of pyramids in India and their
wide-spread use for tunneling or the expropriation of resources from current minority
owners. Additional evidence documenting tunneling in the context of Korean chaebols is
provided by Baek, Kang and Lee (2007) who find that intra-group equity issues are
priced to transfer wealth to controlling shareholders, and by Bae, Kang and Kim (2002)
who argue that intra-chaebol acquisitions transfer wealth from firms in which the family
has low cash flow rights (typically the acquirer) to those in which the family has higher
cash flow rights. None of these papers investigate debt or dividend policy in their
analysis.
Related to research on tunneling in business groups, there is a literature examining the
relationship between pyramidal ownership and the growth of business groups and related
variables of some interest for our investigation. Almeida, Park, Subrahmanyam and
Wolfenzon (2008) use data from Korean chaebols and investigate the role of pyramids in
the financing of business groups. Consistent with the predictions of Almeida and
Wolfenzon (2006), Almeida et al. (2008) provide evidence that affiliated firms owned
through pyramids (those in the bottom layer of the group) have lower profitability and are
more capital intensive than firms controlled without pyramids. Addressing concerns
about the conventional “weakest link” measure, they introduce a “critical control
threshold” to measure control rights of which our measure is a special case. There is also
6 A more distant literature has examined the relationship between valuation and firm membership in
business groups, without taking the group’s ownership structure into account (e.g., Khanna and Palepu,
2000). 7 For more extended surveys, see Morck et al. (2005) and Khanna and Yafeh (2007).
7
some evidence that affiliated firms owned through pyramids are smaller and younger than
firms at the top of the group (those that own shares in other firms). For example,
Claessens, Fan and Lang (2002) find that firms with the highest separation of voting
rights from ownership (i.e., those most likely to be owned through pyramids) are younger
than those with less separation. Pyramidal firms also tend to be larger than unaffiliated
firms and appear to be associated with larger capital investments. Attig, Fischer, and
Gadhoum (2004) find evidence consistent with this implication using Canadian data.
None of these papers link firm characteristics within business groups to the capital
structure in pyramids or to dividend decisions.
Finally, there are a few papers that consider explicitly the capital structure in pyramidal
firms, and they focus entirely on the internal capital market within business groups. Bianco
and Nicodano (2006) study debt within business groups in Italy; however, their emphasis is
on the internal capital allocation problem from the perspective of the external lender, taking
into account that bankruptcy risk is a function of the conglomerate structure of business
groups. Luciano and Nicodano (2008) present a model that links pyramidal debt to the
optimal distribution of default risk within a business group, showing that debt held in
affiliates provides diversification benefits. Neither paper investigates payout policy or the
role of debt in facilitating the span of control exercised by the controlling shareholder. In
fact, pyramidal debt is absent from recent lists of control-enhancing mechanisms that create
a disproportionality between voting and cash flow rights (Adams and Ferreira, 2008;
Shearman and Sterling, 2007).
2. Dividend payouts and control wedge: Theoretical considerations and hypotheses
The starting point for our theoretical explanation is dividends limit insider expropriation
because they remove wealth from the control of managers and dominant shareholders, a
view pioneered by the free cash flow hypothesis of Jensen (1986). A substantial body of
theory work argues that owners choose a higher level of expropriation if the control wedge
increases e.g., Burkart and Panunzi (2006), and empirical studies of performance provide
supportive evidence (see our literature review). Thus, with pyramids, theory suggests that,
for a given level of voting rights, a higher control wedge provides larger incentives for the
8
controlling shareholder to engage in expropriation or costly rent extraction. For dividends,
a controlling shareholder with a control wedge who pays dividends gets only a fraction of
the cash benefit compared to a controlling shareholder without a control wedge (the latter
has a larger cash flow stake), but loses the same amount in control benefits. Therefore,
there should be a negative relationship between dividends and the equity control wedge, for
a given block size:
H1: The control wedge has a negative effect on dividends (Expropriation Hypothesis).
The alternative view can be traced to the notion that dividend payouts are favorably
received by stock markets. According to the free cash flow hypothesis, resources paid out
are resources not diverted. Also, dividends are sticky and thus, imply a long-term
commitment to relatively stable payouts. This idea is the basis for the numerous dividend
signaling models (e.g., Bhattacharya, 1979), the other dominant strand of non-tax dividend
models.
Based on this common idea and the empirical observation that dominant owners pay
dividends, La Porta et al. (2000) and Faccio et al. (2001) formulate an alternative view for a
payout policy adopted by dominant shareholders, the Substitution Hypothesis. This view
holds that from the large shareholder’s perspective, the positive stock market value effect
dominates the potential gains from expropriation. Dominant owners can and do commit to
a stable dividend level and have to commit to higher dividends in order to offset the market
doubts about expropriation risk. The larger the control wedge, the more skeptical the stock
market concerning the role and the incentives of large owners, and the more important the
dividend payout:
H2: The control wedge has a positive effect on dividends (Substitution Hypothesis).
The Expropriation and the Substitution Hypotheses both consider and agree on the two
factors that form the basis for the block holder’s dividend decision. The large shareholder
benefits from higher dividend payouts because dividends generate a higher stock market
value (value effect). On the other hand, a dominant owner dislikes dividends because
dividends reduce her discretionary control over company resources and the option to
9
appropriate them (control effect). The difference between the two hypotheses is a
disagreement about which of these effects dominates.
The Substitution Hypothesis, however, has not been subject to a formal theoretical analysis.
Its theoretical underpinnings are challenging for the following reason. It is not obvious that
a pyramidal owner wants to commit to generous dividend payouts, even if this commitment
could generate strong positive value effects. According to the standard argument in the
corporate governance literature, only the level of control, i.e. her voting rights, will
determine her control benefits and hence the control effect. On the other hand, the larger
the control wedge for a given level of voting rights, the smaller the consequences of the
stock market reaction for the controlling owner’s wealth: if a given level of control is
exercised with a relatively small economic stake in the company, the controlling owner has
a reduced exposure to the value effect of the dividend policy. According to this argument,
the value effect fades relative to the control effect as the control wedge increases. A
theoretical foundation for the Substitution Hypothesis in the context of pyramids needs to
justify the opposite, i.e. that the value effect becomes relatively more important compared
with the control effect. It is not clear how this part of the argument holds.
We suggest an alternative mechanism that explains why a control wedge may lead to
higher dividend payouts. This hypothesis explains why the benefits of a dividend payout
can be larger, for a given level of control, if the owner exercises dominance with a control
wedge. This benefit does not stem, however, from valuation effects. Rather it arises if the
ownership stake of the controlling owner is leveraged, because the owner directly benefits
from an increased dividend payout as a source of funding to service her debt. Our
alternative hypothesis, therefore, leads to a more nuanced prediction: it does not imply that
a control wedge per se leads to a higher dividend payout, only a leveraged control wedge
will.
Leveraged ownership creates a distance between voting rights and the ultimate cash flow
benefits of the controlling owner, i.e. a control wedge. Just as blockholders can use
minority equity in holding companies to engineer a significant distance between voting
rights and cash flow right, they can also leverage their equity holding to engineer a similar
10
effect. Both debt and equity provide the opportunity for the controlling blockholder to
reduce her investment in a controlling equity stake, as well as the residual cash flow rights
that she derives from it. However, the use of debt instead of equity in a pyramid leads to an
important difference; debt financing in holding companies imposes explicit constraints on
the controlling shareholder who, via payouts from the bottom company or cash injections
in the holdings, must assure the solvency of the holdings.8 Otherwise, bankruptcy occurs
which breaks the control chain and deprives the owner of future control benefits. We
postulate, therefore, that in a leveraged holding company, the controlling shareholder
effectively committed to a dividend stream sufficient to service the debt in the holding.
This generates our alternative hypothesis for dividend payments, servicing the debt in the
additional layers in the pyramid that allows the blockholder to leverage the ownership-
control ratio even further:
H3: The equity wedge has a negative effect on dividends, but the debt wedge has a
positive effect on dividends (Debt Service Hypothesis).
From this argument, we derive a number of hypotheses on the value effects of payout
policy and the control wedge. First, the literature generally agrees that, starting from very
low dividend payouts, an increase in dividends should have a positive value effect. The free
cash flow theory and the signaling theory, the two most influential dividend theories, agree
on this prediction. Both the Substitution Hypothesis and the Expropriation Hypothesis
make the same prediction, because both are ultimately grounded in the free cash flow
hypothesis. Based on this consensus, if a company pays out larger dividends, the value
impact from the point of view of minority shareholders should be positive.
H4: Higher dividend payouts have a positive effect on firm value (Free Cash
Flow/Signaling Hypothesis).
While corporate governance theories generally conclude that companies pay smaller
dividends than the optimal level, corporate finance theory does not predict that dividend
increases create value at all payout levels. Mainstream capital structure models emphasize
the value of internal financing, based on asymmetric information (pecking order) and other
8 Our focus is the capital structure of the pyramidal structure. We discuss the relationship between the
capital structure in the pyramid and that in the bottom company in Section 5.
11
frictions like transaction costs, and highlight the financial distress cost of companies that
deplete their cash reserves and their capacity to raise financing (debt overhang). If a
company persistently pays out its entire cash flow or more, then clearly there will be
external financing costs or debt overhang costs, and the benefits emphasized by the
signaling and free cash flow theories will be negligible. Therefore, when combining the
corporate governance and the capital structure arguments, it is useful to consider an internal
optimum for dividend payouts. The dominant view expressed in Hypothesis 4 is that the
typical incentives for large blockholders are to keep dividends below the internal optimum.
In the context of our analysis, it is therefore useful to introduce a distinction between
voluntary payouts and debt-constrained payouts. Voluntary payouts are those that are at the
full discretion of managers or, in blockowner-controlled firms, the controlling owner. Debt-
constrained payouts are those that are explained by debt service obligations, as argued in
our Debt Service Hypothesis. According to the dominant view, the stock market reaction
to the first type of dividend decision is positive because payout ratios are below the value
optimum:
H5: The larger the equity control wedge, the larger the positive effect of dividend
payouts on firm value.
The same expectation is not true if dividend payouts are debt-induced, even if we assume a
valuation reaction to dividend policy. The prediction must be more nuanced. It depends
whether the dividends induced by the debt service are smaller or larger than the efficient
payout level, in terms of firm value. Both cases may occur. While the dividend policy that
maximizes total welfare is hard to determine, one can postulate that financially constrained
dominant owners would be most likely to adopt a payout policy that is too high.
Effectively, by paying out dividends for the purpose of serving the dominant shareholder’s
financial obligations but in excess of what is optimal from the viewpoint of the bottom
company’s financial structure, the dividend payout may become a (highly dissipative) form
of tunneling, akin to the discussion in Bertrand, Mehta and Mullainathan (2002). Thus:
H6: Dividend payouts generate a negative value effect if dividend payouts are debt-
constrained and stretched beyond the efficient payout level.
12
We suggest that the efficient or optimal dividend payout level is determined according to
the standard arguments from capital structure theory, trading off signaling and commitment
advantages of dividends against aspects of internal financing and financial flexibility that
favor retentions.
3. Design Issues and Methodology
3.1 Pyramids in France
France is an ideal laboratory to investigate the role of pyramids in the relationship
between large and small shareholders. France is a developed market, with the largest
percentage of foreign stock ownership among the large European economies, and a high
degree of ownership concentration in listed firms. For all practical purposes, dual class
shares are not allowed and double voting rights are constrained, see Section 5 for
robustness results for double voting rights. Thus, in France, the use of pyramids is the
only way to reliably engineer a control wedge. Pyramids in France are also tax neutral.
The tax neutrality of pyramids explains why pyramidal holding companies can
conveniently be used for a leveraged financing of a controlling ownership stake. A major
blockholder can fully deduct the corporate income taxes that the bottom company paid
from the tax liability of the holding company on dividends received from the bottom
company. As a result, there is no real cost to establishing elaborate pyramidal structures
in France, where pyramids are widespread and deeply embedded. Further, French
regulations, which by and large are respected, require all companies, public and private,
to file their unconsolidated financial statements on an annual basis. Thus, the financial
structure and payout policy of privately-owned as well as publicly listed companies
including holding companies are accessible.
French regulations also require all companies, public and private, to register their list of
important shareholders and shareholdings. The disclosure of important changes in
shareholdings of listed firms is strictly enforced. Per French corporate laws, the following
key thresholds give rise to discontinuous changes in control rights: 1) 33%: This level of
13
control grants veto rights. It also triggers the mandatory bid rule, i.e. any owner passing
through the 33% threshold is required to launch a full and unrestricted takeover offer; 2)
40%: Control is presumed if one shareholder has at least 40% of voting rights, directly or
indirectly, and is the largest shareholder (according to article 355-1 of French securities
law per Bloch & Kremp, 2001); 3) 50%: This constitutes majority voting rights (or legal
control) and triggers notification to the French authorities; 4) 67%: Reverse of the 33%
rule, by blocking any veto rights by other shareholders. This is also the highest
conditional takeover offer allowed under French law since the law stipulates that 67% is
absolute control and no bidder should be allowed to prevent a minority of less than 33%
from tendering their shares (restricted offers are not allowed in France). All of these
factors make France well-suited for our purposes.
3.2 Data and Methodology
Our starting point is the set of all publicly listed companies on Euronext Paris as of January
31, 2003. Our initial sample includes firms from all three tiers of the Paris market: 393
listed firms on the Premier Marché (market), 324 listed firms on the Second Marché, and
152 listed on the Nouveau Marché. We then impose one filtering criterion, which is
inclusion in the WorldScope and Datastream databases over the period 1996-2005. The
final sample consisting of 355 firms (i.e. 206 Premier, 138 Second and 11 Nouveau Marché
firms). We refer to these publicly listed companies as the bottom company. Next, we
collect the complete ownership information for 1997, 1999, 2001 and 2003 for all
companies, public and private. This information is available from the database Dafsaliens
which also documents validation dates. Starting from the bottom company, we use
Dafsaliens to trace the ownership of the owners of the bottom company and continue this
process until we have traced the entire ownership structure to the ultimate owners. We trace
ownership across all ownership classes, individual/family, public company, unlisted private
company and state.
From the Diane database (Diane is the French component of the Amadeus database
provided by Bureau van Dijk), we collect the unconsolidated financial statements for the
private unlisted companies and for publicly listed companies in the ownership chain for
14
1996 to 2004. The unconsolidated financial data provided by Diane eliminates the effect of
group debt and focuses the analysis on the capital structure of the firm itself. We refer to
these companies as owning companies.9 The richness of the Dafsaliens and Diane
information offers an important advantage over annual report-based data and company
handbooks used in most previous works such as La Porta et al (1999) and Faccio and Lang
(2002), which cover only ownership information of public companies. The ownership
structures are stable over time, see Section 5 for robustness results. For this reason we also
use the ownership structures information collected for a specific year in the subsequent
year. With our ownership data in 1997, 1999, 2001 and 2003 we measure ownership
structures in 1997-2004. In our payout and valuation regressions, we use the ownership and
control variables in year t to explain payout and valuation variables in year t+1.
In accordance with the oft-cited papers of La Porta et al (1999), Claessens, Djankov, Lang
(2000), Faccio and Lang (2002) and others, we require that a shareholder possess a
substantial level of control (i.e. voting rights) in order to qualify as an ultimate owner. The
typical threshold used in the literature, called the inclusion threshold, is 20%. Control rights
are inherently discontinuous and as referenced earlier, France is no exception. To capture
the discontinuous character of control rights, and using concepts developed in Almeida,
Park, Subrahmanyam and Wolfenzon (2008) and Chappelle and Szafarz (2005), we
introduce a second threshold that indicates the level of control above which the shareholder
is said to assume absolute control over the bottom company. We call this threshold the
conversion threshold and fix its value at 50%. Adopting this majority rule, we transform
effective control rights (i.e. the sum of direct and indirect voting rights in a pyramid) of
greater than 50% into full control of 100%. The other stakes are then allocated zero control.
We combine a 20% inclusion threshold and 50% conversion threshold in our baseline
analysis and perform robustness analyses for 33% and 40% inclusion thresholds. Our
inclusion threshold is consistent with the literature and allows comparisons with prior
findings; whereas, the conversion threshold reflects appropriate conversion of legal control
over the bottom company.
9 For the sample of 355 bottom companies, we use their consolidated financial statement information,
WorldScope and Datastream. If there are holdings below for any of the 355 companies, the net financial
position of the holdings and the bottom company is reflected in the bottom company’s consolidated
financial information.
15
Based on these assumptions, we analyze pyramids using standard procedures. More
precisely, our procedure for the analysis of pyramids consists of three main steps. First,
we identify all shareholders or entities with direct ownership in excess of 5%. We then
determine whether they are entities directly or indirectly controlled by other shareholders.
This process is iterated until no more directly controlling shareholders can be found. The
number of iterations needed to reach the final shareholder(s) corresponds to the number
of layers of a control chain. Similarly, we use a consistent and conventional procedure to
resolve cross-holdings.10
In the second step, we determine the level of cash flow rights
and control rights of all identified ultimate owners. We obtain the integrated ownership of
each ultimate owner in the bottom company by multiplying the stakes within each
particular control chain and using the conversion threshold (50%) where applicable. In
the case of multiple control chains, i.e. if a single ultimate owner controls the bottom
company through more than one control chain, we sum up the individual stakes of the
ultimate owner. In the third step, we apply the inclusion threshold in order to leave out
the small shareholders who do not meet the specified level of control.
4. Results
Our main objective is to investigate the Expropriation and the Substitution Hypotheses
using our detailed data on pyramidal structures in France. We then ask whether the Debt
Service Hypothesis and its nuanced value predictions can help to understand and reconcile
the conflicting evidence of earlier cross-country studies.
Section 4.1 and Table 1 present the summary statistics for the full sample of firms. For the
full sample, Section 4.2 and Table 2 focus on the firm’s dividend payout policy in light of
its ownership structure and the valuation implications of the dividend payout policy and
ownership structure. For pyramidal firms, Section 4.3 and Table 3 present the summary
statistics for the bottom companies of the pyramids with particular emphasis on dividend
policy and leverage. Table 4 presents the determinants of the dividend payout policy and
10 Following accepted procedures, we check whether a particular stake occurs twice and stop tracing.
Otherwise, the programmed routine would have an infinite loop when checking cross-holdings. Details are
available from the authors upon request.
16
the valuation implications of the dividend policy and leverage for the bottom companies.
Section 4.4 focuses on how dividends pass through the pyramidal chain. Table 5 considers
the dividends passed through the chain of control and their relationship to the debt
financing in the pyramidal structures. Finally, for each entity in a pyramid, Table 6
investigates the dividends received for each entity in relationship to the debt service of that
entity.
4.1 Summary Statistics
Table 1 describes the ownership structure and firm characteristics of the 355 French
companies, yielding 2597 observations in our 1997-2004 window. We find that 85.6% of
listed companies have a blockholder who satisfies the inclusion threshold of 20%, and only
14.4% of the firms are widely-held. Moreover, in 55.3% of our sample controlling
shareholders use pyramids to control the listed company. Note that the frequency of
pyramid controlled firms is about double the frequency found in La Porta et al (1999) and
Faccio and Lang (2002). The reason for this dramatic increase in the frequency of
pyramidal structures is the inclusion of private holding companies in our analysis. By
contrast, all earlier studies on pyramids in France only classify firms as pyramidal if at least
one of the holding companies along the controlling owner’s control chain is a publicly
listed entity.11
We find that only 20.1% of pyramidal structures contain a listed vehicle in
the control chain (not reported in tables). While perhaps an inevitable restriction for cross-
country studies, restricting the pyramid definition to only structures with publicly listed
vehicles of control leads to a substantial undercount of the use of pyramids in at least the
case of France.
Table 1 also classifies the controlling ultimate owners by type (individual/family, firm, and
state). 47.1% of firms are controlled by either a family or an individual, roughly in line
with earlier studies. Firms comprise 30.2% of ultimate owners followed by state ownership
of 3.6%. Again, 14.4% of the firms do not have an ultimate owner with a stake equal to or
greater than 20%.
11 Besides La Porta et al (1999) and Faccio and Lang (2002), this includes Ginglinger and Hamon (2008).
17

The table next provides an overview of key financial characteristics with definitions for the
companies in our sample, both in the aggregate as well as broken down according to
control structure. We measure dividends relative to cash flow, net earnings and market
value. We follow common practice and set payout ratios to unity when dividends are paid
but cash flow or earnings are negative or less than the dividend (e.g. Megginson and Von
Eije, 2008). Our measure for market valuations is Tobin’s Q, defined as the book value of
total assets minus book value of equity plus market value of equity, over book value of
total assets. Leverage is defined as total debt obligations, scaled by book value of total
assets. Sales growth is the two-year growth rate of sales.
Measured in terms of total assets, widely-held firms are substantially larger than firms with
controlling owners, and they have a higher Tobin’s Q and a lower sales growth rate than
pyramidal firms. Widely-held firms have valuations and dividend measures comparable to
the full sample means. Relative to the full sample, pyramidal companies generally pay
higher dividends, but appear to have a lower valuation and grow faster. Relative to
pyramidal controlled firms, block-owner controlled firms have lower dividend payouts,
higher dividend yields and higher valuation. The frequency of loss firms is comparable
across the subsamples. We also tabulate an industry breakdown. A wide mix of industries
is represented in the full sample as well as the subsamples of block owner-controlled and
pyramidal firms.
4.2 Determinants of Dividend Payout and Firm Valuation for Full Sample
For the full sample, Table 2 presents regression results that analyze the impact of financial
characteristics and ownership structure on dividend policy and firm valuation. All
regressions include industry and year fixed effects and report Newey-West based robust t-
values. We measure explanatory variables in year t and explained variables in year t+1.
In Panel A, we consider determinants of payout policy. The dependent variables are the
three conventional measures used for dividend payout, dividend/cash flow,
dividend/earnings, and dividend/market capitalization (dividend yield). Dividends increase
in firm size and decrease with leverage. Sales growth does not have a significant influence.
18
Companies in loss years tend to cut back on dividends. The dividend payout is also
influenced by industry, with services having a lower payout and financials having a higher
payout (industry effects not reported in the table).
The results for ownership structure are mixed when compared to widely-held firms. For the
dividend/earnings ratio, block owner-controlled firms have lower payouts, regression (2).
Pyramidal firms have a higher dividend yield, regression (3); however, as we show in Panel
B this reflects a mechanical relationship based on lower market value for pyramidal
controlled firms. The surprising result is ownership structure does not appear to matter for
dividend payout measured by cash flows. These results differ from the French findings of
Faccio et al (2001); based on their group affiliation criteria, only the cash flow payout ratio
(measured relative to the global industrial average) was significant and its coefficient was
negative. Given our hypotheses, the implications of the Expropriation Hypothesis, lower
dividends, could be offset by the implications of the Debt Service Hypothesis, higher
dividends. The Substitution Hypothesis generates an analogous prediction but the basis for
the prediction is the dominant shareholder’s preference for value over control. Faccio et
al’s results could be explained by the limited sample size, 250 observations, and the cash
flow based payout ratio measured relative to the global industrial average. At this stage of
the analysis, we cannot distinguish between the three hypotheses for France, Substitution,
Expropriation and Debt Service.
In Panel B, we consider the determinants of firm valuation (Tobin’s Q) using the
dividend/cash flow payout ratio. Size has a negative impact on firm valuation and there is
also a weak negative impact for sales growth. We find a significant negative coefficient for
pyramidal controlled companies. This finding is consistent with theories emphasizing the
discretionary power of controlling owners to the detriment of minority shareholders (e.g.,
Shleifer and Vishny, 1986, Bolton and von Thadden, 1998, Burkart, Gromb, and Panunzi,
1997). Further, this lends support to the notion that these conflicts are reinforced by the use
of pyramidal structures. Confirming many earlier studies on payout policy and consistent
with H4, our free cash flow hypothesis, in regression (2) we find a positive effect for
dividend payouts on firm value. However, as regression (3) shows, the valuation effect of
dividends is fully attributed to dividend payouts by block owner-controlled companies who
19
do not use pyramids. There is no comparable effect for pyramidal firms. The dividend
payout itself becomes insignificant once these interaction terms are included, but the
coefficient for block owner-controlled firms becomes strongly and significantly negative if
they do not pay dividends. These results are again consistent with our free cash flow
hypothesis, H4, which predicts a positive coefficient for dividend payouts. Regardless of
organizational form, a controlling owner enjoys considerable discretion in choosing the
dividend policy. Since dividends are voluntary, they have a positive effect on firm value.
On the other hand, these findings are consistent with the following interpretation from the
perspective of the Debt Service Hypothesis: dividend decisions are constrained by the debt
service obligations embedded in the holding structure. In this case, the valuation effect is
fully captured by the fact that the controlling owner uses a pyramid and the payment of
dividends has no incremental impact.
Thus, our results show that the dividend policy and valuation effects of pyramidal firms
differ from the widely-held and block owner-controlled firms. Our findings suggest that the
behavior of pyramidal firms could be explained by the Debt Service Hypothesis, where
dividend payouts are driven by debt service obligations in the levered pyramids. We
continue our investigation by focusing on pyramidal firms.
4.3 Analysis of Pyramidal Controlled Firms
In this section, we focus on pyramidal firms, bottom firms with a controlling blockholder
who exceeds the 20% ownership threshold and uses pyramidal structures in the control
chain. In Table 3, we present summary statistics for pyramidal firms. Although we have
information in Tables 1 and 2 about 1435 firm-years of pyramid-owned firms, we continue
our analysis with a sample of 1253 firm-years, a sample with sufficient information to
calculate equity and debt wedges for the pyramidal structure. To be included in the refined
sample, we require (1) at least 50% of the entities in the pyramidal structure are traceable in
Diane and (2) the wedge variables are not outliers.12
For the refined sample, 19.2% of
entities on average have missing data and the median entity has no missing data. It is
12 In particular, we impose a maximum debt wedge of 80. We run robustness analysis with alternative
maximum debt wedges, e.g., 90, 70 and 50. The results do not materially change (results are available upon
request from the authors).
20
interesting to note that on average only 8% of the entities are exchange-listed firms, which
underscores the importance of including private firms in our analysis.
In Table 3, we present summary statistics for pyramidal controlled firms, starting with an
expansion of the financial characteristics shown in Table 1 broken down by the average,
25th
percentile, median, 75th
percentile and standard deviation. Table 3 shows that the
controlling owner holds on average 40.391% of the voting rights in the bottom company
(median: 34.170%). If we use the more demanding inclusion threshold of 33% (40%) for
the largest blockholder, rather than the 20% threshold that is standard in the literature, the
vast majority of these firms are still classified as pyramidal controlled firms rather than
widely-held firms, 83.5% (73.3%). Control chains contain 2.555 layers on average with a
25th
percentile and median of 2, and a 75th
percentile of 3.
The equity wedge with a mean of 1.840 (25th
:1.085, median:1.563, and 75th
:1.996)
measures the control-enhancing effect of pyramids as follows: considering only equity
stakes in the pyramidal control chain, controlling owners own 1.840 times more voting
rights on average than they hold cash flow rights. The debt wedge is our proposed measure
to aggregate the effect of leverage throughout the pyramidal control chain. In determining
the debt wedge we assume the absence of debt when an entity in the pyramid is not
included in the Diane data; thereby presenting conservative estimates of the debt wedge.
The mean debt wedge has a value of 4.149 (25th
:0.449, median:1.059, and 75th
:3.021). The
debt wedge says that for every one percent of cash flow rights to which the controlling
owner is exposed, the use of debt in the pyramidal structure enhances the voting rights by
4.149 on average. Considering the effective control wedge (equity wedge plus debt wedge),
pyramidal controlled firms in our sample have on average 4.149+1.840 = 5.989 times more
voting rights than cash flow rights. On average 69.3% of the effective control wedge is
attributed to the use of leverage whereas only 30.7% is attributed to the participation of
minority shareholders in the holding companies along the control chain. As the distribution
shows, the magnitude of the debt wedge motivates our conclusion that minority equity
alone in the analysis of pyramidal control chains, as in all previous studies on pyramids,
substantially underestimates the extent to which pyramids are used as a control-enhancing
mechanism. The use of leverage in pyramids is highly important for France.
21
Table 4, Panel A presents the regression analysis for the dividend policy for the pyramidal
controlled firms. We consider in particular the use of minority equity and debt as the two
alternative financial tools to enhance the control wedge in pyramids. We document the
opposing effects of the equity wedge and the debt wedge on the dividend policy of the
bottom company. This is the key finding of our paper. The coefficients for the equity
wedge are negative and significant when analyzed separately and together with the debt
wedge. On the other hand, the coefficients for the debt wedge are positive and significant
when analyzed separately and together with the equity wedge. Taken together, the positive
sign for the debt wedge coefficient and the negative sign for the equity wedge coefficient
are consistent with the Debt Service Hypothesis. These signed results are inconsistent with
the other dividend hypotheses: the Expropriation Hypothesis predicts a negative sign for
the equity wedge but has no direct prediction for the debt wedge. The Substitution
Hypothesis predicts a positive sign for the equity wedge but has no direct prediction for the
debt wedge.
To complete the discussion, the regressions confirm that dividend policy depends on other
variables. Similarly to the results in Table 2, dividend payout decreases in the leverage of
the bottom company and with losses in the bottom company. Though not shown, the
regressions in the two tables load the same for industry categories. Overall, our results
corroborate the Debt Service Hypothesis and suggest that leverage is an important
determinant of bottom companies’ dividend payouts.
Table 4, Panel B investigates the valuation (Tobin’s Q) implications of the pyramidal
controlled firm, its dividend payout and the debt and equity wedges in the pyramid.
Supporting our Free Cash Flow Hypothesis, the regression results show that the coefficient
for dividend payout is always positive and significant. Inconsistent with the Expropriation
Hypothesis, the coefficient for the equity wedge is always insignificant. The debt wedge
has a significant and negative effect on valuation, regressions (3) and (4), but regression (5)
shows that it is the interaction of the dividend payout with the debt wedge that drives this
initial result. The positive valuation effects of dividend payouts are offset by the dividend
payouts associated with the debt wedge. A financially constrained ultimate owner could be
22
forced to payout higher dividends to service the debt. Though statistically significant, the
economic effect measured as the difference between the 25th
and 75th
percentiles for the
dividend payout and debt wedge times the regression coefficient is about 1.1% of the
pyramidal controlled firm’s value. This suggests that at a minimum a certain proportion of
the dividend payout associated with the debt wedge is a form of tunneling, as discussed in
our hypothesis section. This result supports H6, a negative value effect if debt-constrained
dividend payouts induce dividend payouts beyond the efficient payout level. The results
also support H5, after controlling for the equity wedge by interacting the dividend payout
with the debt wedge (Table 4, panel B, model 5), dividend payouts have a positive effect on
firm value.
Our analysis uses the debt wedge as a measure of leverage in pyramids. As an alternative
we calculate the equivalent bottom company leverage metric, which is defined as the
leverage in the bottom company that, if only the bottom company was indebted and all
holdings were all-equity financed, would expose the cash flow rights of the largest ultimate
owner to the same level of risk as the combined debt in the pyramid. For example, consider
a bottom company with leverage of 0.1 and two layers in the pyramid with leverage ratios
of 0.2 and 0.3, respectively. The calculation of the equivalent bottom company leverage is
0.1 + (1 - 0.1)*(0.2) + (1 - 0.1)*(1 - 0.2)*(0.3). We define the net equivalent leverage as
equivalent bottom company leverage minus bottom company leverage. In case information
about leverage of an entity is missing we assume zero leverage. This metric is clearly
distinct from the debt wedge as it does not use equity stakes. We find that the average
equivalent bottom company leverage in our sample is 0.315 and average net equivalent
leverage is 0.082. The correlation with the debt wedge is, respectively, 0.471 and 0.387.
Next we replicate all regressions in Table 4, replacing the debt wedge by our alternative
measures. The results (not reported) demonstrate that our key conclusions are robust to this
alternative metric. In all regressions the sign of the coefficients remains unaltered. In
particular, in Panel A all results remain significant at the 1% level or less. In Panel B some
results become insignificant; however, the key result – the interaction between dividends
and equivalent leverage in model 5 – is still significant at the 5% level.
23
4.4 Anatomy of Dividends Passed Through the Pyramidal Chain
We expect pyramidal ownership and leverage structures to influence not only the dividend
policy of bottom companies but also dividend policy in the pyramidal control chain.
Continuing our assessment of the Debt Service Hypothesis, we next address how dividends
and debt policies interact in the other entities along a pyramidal control chain. We do this
by looking directly into the structure of holding vehicles, in particular debt and dividends.
We consider in particular two payout metrics; (1) the proportion of these dividends that are
actually received by the ultimate owner, the pass-through decision, and (2) the amount of
the dividends received by each entity in the pyramidal chain in relationship to the debt
service obligations of that entity. Our hypothesis for both is dividends in pyramidal
structures are paid to service debt.
We determine the ratio of the dividends ultimately received by the controlling shareholder
at the top of the pyramid to the bottom company’s dividend payout available to the
controlling shareholder. We call this ratio the received-payout ratio. The Debt Service
Hypothesis implies that the received-payout ratio should be negatively associated with
leverage in the holding companies. The Debt Service Hypothesis entails no direct
predictions on the complexity of layers since a substantial debt control wedge can be
created by aggressively levering up in a very short control chain.
For these tests, we need the dividend payout for the bottom company and each entity in the
pyramidal chain. For both public and private companies, we again use the unconsolidated
financial statements from Diane. While the financial statements do not directly disclose the
dividend payments made by an entity, French regulations and the structure of the owners’
equity section of the financial statements allow us to back out the dividend payments.13
13
Net income is used to either pay dividends or is allocated among the specific owners’ equity accounts.
The English version of Diane’s Complete Account format details the net income and allocations. We
calculate dividends paid in year t from the owners’ equity accounts by subtracting the change in allocations
between year t and year t-1 from the net income in year t. This is the dividends paid if there are no other
substantive changes. To insure the veracity of the dividend number, we did the following: to obtain a
measure of potential substantive changes in capitalizations for year t, as a separate calculation, we
compared capitalization for year t to year t-1. The only other event we need to consider is the potential
impact on reserves that are set up or altered directly via the balance sheet (rather than the income
statement). To insure the veracity of the formula and verification checks, we compared the dividend payout
24
Due to data availability from Diane, we use the entities in the pyramidal structures for
1999, 2001 and 2003.
For each ultimate owner, we calculate the received-payout ratio. The number of layers is
the maximum number of layers from the bottom company to ultimate owner. The average
leverage is the average of the total debt/total assets ratios for the entities in the pyramid.
We include observations with a dividend payout by the bottom company; a received-payout
ratio equal or less than 2; an average leverage ratio equal or less than 1; and data
availability for 50% or more of the entities in the chain of control.14
For the missing
entities in the chain of control, we set leverage equal to zero and the dividend received-
payout ratio equal to 1, which biases against our tests.
Table 5, Panel A presents summary statistics for how dividends paid out by the bottom
company are used and passed through pyramidal chains. The summary statistics for the
received-payout ratio show an average of 0.655 with a 25th
percentile: 0.299, median: 0.827
and 75th
percentile: 1.00. The average leverage is .141 with a 25th
percentile: 0.000, median:
0.052 and 75th
percentile: 0.236. For the number of layers, the average is 2.441 with a 25th
percentile and median: 2.00 and 75th
percentile: 3.00. The data show a wide range in
received-payout ratios and leverage. Using the Diane database, we have sufficient balance
sheet information for 72.9% of the entities along the pyramidal control structures. To
provide an additional perspective on the implications of the missing entity data, we provide
summary statistics for pyramidal chains with complete data. There are 128 observations
with an average received-payout ratio of 0.471 with a 25th
percentile: 0.114, median: 0.465
and 75th
percentile of 0.755. Average leverage is 0.211 with a 25th
percentile: 0.049,
median: 0.161 and 75th
percentile: 0.310. For the number of layers the average is 2.156 and
the 25th
, median and 75th
percentile is 2. Using averages, the received-payout ratio is lower
for the pyramidal chains with complete data. The leverage is also higher.
per the formula to the dividend payout per the annual report for a sample of public companies. Since the
private companies typically have simpler capital structures, we are confident in our number. Details are
available from the authors upon request.
14 The received-payout ratio may reach values greater than one, e.g. because the assets of entities in the
pyramid are comprised of the shareholding and additional assets, leading to dividend outflows exceeding
the inflow. Leverage ratios exceed one when book value of equity is negative. Our results are not sensitive
to excluding these observations.
25
Table 5, Panel B presents the regression results. We find that dividends received by the
ultimate owner, received-payout ratio, is negatively associated with leverage in the
pyramid. The coefficient for leverage is negative and significant. The coefficient is also
negative and significant for the number of layers in the pyramid. Both results are clearly
consistent with the Debt Service Hypothesis.
We next turn to our second payout metric for pyramidal entities, the dividend received by
each entity. At each level of a pyramidal control chain, a dividend and leverage decision is
made. Our hypothesis is that dividends are set to enable the entities higher up to meet their
service interest obligations. In other words, the dividend received by an owning company
should be sufficient to: (1) pay interest and (2) pass dividends to the next level if needed.
We expect a positive sign for funds needed to service debt. If the next layer is the ultimate
owner, we expect a negative sign. According to the Debt Service Hypothesis, if the next
layer is the ultimate owner, the remaining control chain is shorter (consisting only of one
level) and thus, on average less dividends are needed to meet debt service obligations.
Table 6, Panel A presents the summary statistics for the determinants of the dividends
received by entities in the pyramidal structures for 1999, 2001 and 2003. For each entity,
we calculate the dividend received denominated in € millions (dividends paid in the lower
layer times the ownership stake in the lower layer). The average (median) for the dividends
received by the entity is 28.752 (1.038). Interest expense is the interest payments for the
entity in € millions, average (median) of 33.240 (0.907). We next determine the importance
of the entity’s investment in the lower layer by calculating the investment ratio as the ratio
of the lower layer’s equity times the entity’s ownership stake, divided by the entity’s total
assets. Total assets are the book value of the entity’s total assets. We include observations
with an investment ratio greater than zero and less than four. The variable “ultimate owner”
is an indicator variable with a value of one if the next layer is the ultimate owner, and zero
otherwise. Ownership stake is the shareholder stake in the lower layer. Cash is the amount
of cash and securities for the entity in € millions. We control for cash because an entity can
accumulate cash for other investments and/or due to differences in dividend preferences.
26
For each variable, Panel A provides the average, 25th
percentile, median, 75th
percentile and
standard deviation.
Table 6, Panel B presents the regression results. The findings suggest that dividends
received by the entity are increasing in the interest expense of the entity, lending support to
our main hypothesis, the Debt Service Hypothesis, which implies a positive sign for funds
needed to service debt. Crucially, we normalize interest expense by the investment ratio,
the importance of the entity’s investment in the lower layer. Moreover, the dividends
received increase in the importance of the lower layer to the entity, both relative to the
entity’s assets, investment ratio, and in absolute terms, the ownership stake itself. By
regression standards, with adjusted R2 between 43.3% and 46.1%, we are able to explain a
substantial portion of the dividends received by the individual entities in the pyramid. The
results for dividends received and its clear dependence on debt service obligations in every
holding vehicle along the control chain provides strong additional support for the Debt
Service Hypothesis. The results are insignificant for the second variable, the next layer
above being the ultimate owner. This is consistent with the idea of two countervailing
effects as discussed above: the debt service effect that leads to a negative sign, and the
control wedge effect that would predict a positive sign.
5. Additional Explanations and Robustness Issues
5.1. Additional Explanations: Investment and Dividend Preferences
We provide evidence that an important motivation for dividend payouts in pyramids is the
debt service obligations along the control chain. There are two additional explanations how
the level of dividends received and the dividends passed-through in pyramidal entities are
determined. The first corresponds to a prominent explanation for the rationale behind the
use of pyramids. In this theory, dividends received in a layer and not passed through to the
ultimate owner can be used to fund investments in other entrepreneurial activities. Almeida
and Wolfenzon’s (2006) theory postulates that pyramids are used to accumulate funds
across conglomerate business groups in the presence of imperfect external capital markets.
Almeida and Wolfenzon emphasize that the ultimate owner values cash more than growth
27
opportunities in the bottom firm. The payoff and financing motives indirectly motivate the
rationale for dividend payouts: dividends flow up the pyramid to where they are valued
more than in the bottom company. Our argument uses the same rational except debt service
is the driver.
According to the second explanation, dividends are not passed through because the
dividend preferences of the ultimate owner differ from those of other shareholders in the
bottom company. Given the tax neutrality of dividend payouts, a characteristic of
pyramidal structures is their ability to accommodate divergent dividend preferences when
the dominant shareholder prefers smaller dividend payouts than other shareholders. The
bottom company pays out dividends that correspond to the needs of owners with high
dividend preferences, including owners that only appear as minority shareholders in the
layers above the bottom company. A controlling owner with lower dividend preferences
retains part or all of her dividend allocation in intermediate pyramid layers. Such retention
of bottom-company payouts in intermediate layers can be used for deferred payouts,
investments, or as a cash cushion should equity injections into the bottom company become
desirable. While this second motivation is not unrelated to the first one, there is a
difference in emphasis and timing. The investment motivation predicts immediate
investment of the dividends with very little eventually paid out; dividend preferences
predict initial retention of dividends with on average a larger portion of them paid out.
A raw but insightful observation concerning the investment hypothesis is the following.
Following Almeida and Wolfenzon (2006), we expect holding companies to accumulate
cash received from the bottom company and use it for investment purposes in other
operating companies besides the listed bottom company. A consequence of this behavior is
that the holding company encompasses diverse interests in a variety of operating
companies. However, for a given entity in the pyramidal chain, on average the investment
in the single entity one layer below comprises 77% of the total assets of these pyramidal
entities, which is part of the control chain we study. Thus, while pyramidal entities in our
sample do have additional investments in operating assets, over three quarters of the
entities’ asset base is motivated by holding considerations, not diversification. In our
sample, investment motives while important appear secondary to debt service obligations.
28
Crucial evidence emerges when we analyze, looking at individual pyramidal entities as the
unit of observation, the relationship between dividends received and the various alternative
uses of those dividends. In general, dividends received by a holding entity have one of four
uses: (1) to pay debt service; (2) to pay dividends to the next entity above; (3) to make
investments; and (4) to save by increasing cash or paying down debt. Performing
correlation analyses with these four variables, we find that the correlation between
dividends received and interest rate obligations (i.e., normalized for the size of the stake in
the entity below in the entity’s total assets) is very high, at 0.65 (0.91 if we exclude
outliers). By contrast, there is no correlation between dividends received and any
subsequent increase in reserves or investments: the correlation between dividends received
in year t and the increase in cash or the increase in total assets between year t and year t+1
is smaller than 1%.15
A similar pattern emerges from our regression analysis. One test assessing the importance
of the Debt Service Hypothesis relative to the additional two motivations is contained in
Table 6, Panel B. The coefficient for the interest expense normalized by the investment
ratio is positive and significant in all the regressions. Further, the coefficient is always
substantially larger than one. A coefficient greater than one implies for every dollar needed
to cover the entity’s interest expense (in proportion to the investment ratio) more than one
dollar in dividends is received. The free dividends received can be saved, passed through,
or used for investments elsewhere. In other words, a coefficient greater than one indicates
the interest expense is not the only determinant of payout decisions in pyramid. The fact
that the coefficient is less than two is consistent with the notion that the debt service motive
can account for more than half of the dividends received by each entity. Again, while our
analysis does not eliminate the possibility that the two additional explanations matter for
the dividend decisions within pyramidal structures, our findings suggest that the Debt
Service Hypothesis plays an important role.
15 Details of the analysis are available from the authors. A similar approach is used when presenting our
results throughout Section 5.
29
Finally, we provide evidence on the relative importance between the investment and
dividend preference motivations by looking at the change in cash in reaction to dividend
payouts. Dividend preferences predict free dividends not needed for debt service are
initially retained in pyramidal layers. Under the investment story, free dividends are
invested elsewhere, in which case the investment constitutes the true motive for the
retention. Table 6 presents evidence on dividend preferences. We consider the impact of an
entity’s cash holdings on dividends received. In Table 6, Equation (4), we find no
significant effect for cash holdings, as we would expect for the dividend preference motive.
For entities receiving a lot of dividends there is no measurable impact on the level of cash.
This finding suggests dividend preferences play a weak role in explaining the use of free
dividends.
5.2. Double Voting Rights
Apart from pyramids, double voting rights are the only alternative control-enhancing
mechanism that is widely used in France.16
According to French law, the company’s
charter can convey a double voting right to each share if the share is held for more than l
years, where l must be between 2 and 4 years. Double voting rights are distinct from dual-
class shares since they are a premium for loyalty that is non-exclusive (every share acquires
the right after satisfying the holding requirement) and is lost when the share is sold. About
two thirds of listed French companies adopt double voting rights, and they are most popular
among smaller and family companies (Ginglinger and Hamon, 2008).
We assess the robustness of our results to double voting rights. We trace the actual voting
rights (including double voting rights) of the dominant owner in our 2003 sample from
annual reports and disclosure statements obtained from the AMF, the French stock market
regulator. We find only 1.4% of the companies in our overall sample initially classified as
widely held change status to blockowner-controlled when we include double voting rights
(with the largest owner now controlling more than 20% of the votes). By contrast, for
58.9% of all firms in our sample, we find that double voting rights make no difference to
16 Two other control-enhancing devices are in principle available, but rarely used: non-voting shares are
used by less than 2% of blockowner-controlled firms; voting caps are used by only about 1% (Ginglinger
and Hamon, 2008).
30
the control rights allocation – either because the controlling owner already holds more than
50% of the votes and hence is attributed 100% of control rights with our methodology, or
because the firm remains widely held after accounting for double voting rights. We find
double voting rights change the control rights of the dominant owner for 73.9% of the
companies in the remaining sample.17
But this amounts to only 30.4% of the overall sample
[.739 x (1 - .589)]. Moreover, for the companies where we actually observe a change in
control rights, double voting rights increase the mean (median) voting rights of the
dominant owner only by 17% (16%). Thus, double voting rights increase the equity wedge
on average by only about 5% [30.4% x 17%]. This control-enhancing effect is small
relative to the role played by pyramidal structures, as measured by our original equity
wedge and debt wedge.
We calculate modified measures for the equity wedge and the debt wedge taking into
account double voting rights. We then ran our main regressions of Table 2 and Table 4 with
these modified measures. Unsurprisingly, given the small impact of double voting rights on
the modified control wedge measures, our results are unchanged by this modification. We
conclude that double voting rights play a minor role in determining the relationship
between the control wedge and dividend policy.
5.3. Debt and Operating Risk
For a given control wedge, the use of debt in pyramids versus minority equity generates a
different risk profile for the controlling owner’s residual cash flow. Pyramidal debt
increases the owner’s risk. In principle, for a given risk profile for the ultimate owner’s
residual cash flow, it does not matter whether the debt is located in the bottom company or
any of the pyramidal layers.18
Debt securities at different layers within a single control
chain appear to be perfect substitutes.
In unreported tests, we explore the relationship between bottom company debt and
pyramidal debt. We find that there is no correlation, even when controlling for other
17 We can identify the actual voting rights for 82.2% of the companies in the remaining sample. 18 Though Luciano and Nicodano (2008) for example provide a stylized model where such is not always the
case.
31
variables that typically explain leverage, such as size, age, tangible asset or past
profitability.
Next, we explore the relationship between different variables measuring the cash flow risk
of the bottom company and pyramidal debt. We use the 5-year average of ROA variance,
the ratio of intangible assets to total assets, R&D expenditure, and the log of assets since
size correlates with lower business risk. In unreported tests, we analyze the correlation
between these measures of risk, the debt wedge, and the bottom company leverage. We
find that almost all correlations are low, generally below 5%, and not significant. The only
exception is a weak negative correlation between R&D expenditure and bottom company
leverage. However, the correlation between R&D expenditure and the debt wedge is not
significant. Based on these tests, we conclude that differences in operating risk profiles
appear not to be an important driver of the decision to use pyramidal debt.
5.4 Tests for Endogeneity
In the OLS regression tests in Tables 2 and 4 that explain dividend payouts and Tobin’s Q,
we assume the estimations are not biased due to the endogeneity of explanatory variables.
In this section, we investigate the robustness of our results to two endogeneity concerns.
The first is endogeneity of the firm’s dividend policy in the value regressions (Tobin’s Q).
The second is ownership structure (Demsetz and Lehn, 1985; Agrawal and Knoeber, 1996),
which may be endogenously determined with dividend policy and Tobin’s Q.
In order to measure the impact of endogeneity of dividend policy in the Tobin’s Q
regressions we performed Heckman (1979) tests on the regressions in Table 2 and 4, Panel
B. We use the regression specification (1) in Table 2 Panel A to obtain an estimate of the
Inverse Mills Ratio of the dependent variable, which we introduce as the dependent
variable in Panel B of Table 2. We find that the regression coefficient for the Inverse Mills
Ratio is insignificant and the other results are unaffected in all specifications. We apply a
similar procedure to the analysis of Table 4, where we use specification (4) from Panel A in
the first stage to obtain the Inverse Mills Ratio estimate. Again, the coefficient is
insignificant and the other results are unaltered.
32
Endogeneity of ownership structures requires that ownership is dynamic and adjusts when
conditions change. We have measures for ownership with two-year intervals. Thus, we can
investigate for three two-year changes (1997 to 1999, 1999 to 2001, and 2001 to 2003)
whether the classification (widely held, block-non pyramid, block-pyramid) has changed
and, for pyramids what the changes in the equity wedge are. In our sample [3 x 350 = 1,050
pairs], we find 960 pairs where we can investigate a change over two years. In 817 cases
(85.10%) we find no change in classification. In this set of 960, 477 pairs are pyramids in
both years. In this set the average absolute change in the wedge is 0.339, which is relatively
small in comparison with an average wedge of 1.840. The stability of the ownership
structure implies that endogeneity of this variable is not very likely to induce biased
estimates. Although all regressions in Tables 2 and 4 use one-year lagged ownership
measures, this lag may not be sufficient to account for reverse causality. As an additional
robustness check we repeat all regressions in these tables with three-year lagged ownership
measures. Obviously, we lose some power in our tests because we cannot use the first two
years of our panel. The results (not reported) in Table 2 and Table 4 are robust to this three-
year lag.19
In a few instances the results become insignificant; however, the signs of the
coefficients remain unaltered.
6. Conclusions
The natural explanation for dividend payout policy in the presence of large shareholders
and control-enhancing mechanisms is the Expropriation Hypothesis, dominant owners pay
smaller dividends if their cash flow rights are small relative to their control rights.
However, earlier evidence shows that companies organized in business groups and
pyramids pay higher dividends, suggesting a substitution effect that makes dominant
owners prefer higher dividend payouts because of the positive valuation effect. However, it
is unclear how such a substitution effect can work since control-enhancing mechanisms
also reduce the controlling owner’s exposure to the valuation effects.
19 Table 2, Panel A, models 1 and 2 have 1961 observations, model 3 has 1874 observations and Panel B
has 1943 observations. Table 4, Panel A has 941 and Panel B has 927 observations.
33
We suggest an alternative explanation for these puzzling observations based on debt placed
in pyramidal holding companies. Debt in pyramidal holdings allows the acquisition and
maintenance of a controlling ownership stake based on leverage; debt constitutes a control-
enhancing mechanism for the dominant owner. We show that debt in holding companies in
France has an impact on the overall discrepancy between control rights and cash flow
rights that rivals the use of minority equity in pyramidal holdings. Our alternative view, the
Debt Service Hypothesis, leads to a nuanced prediction. It surmises that as the equity
wedge becomes wider, the dividend payout decreases. However, as the debt wedge
increases, dividend payouts should increase because dividends are needed to service the
debt in the pyramidal entities. These predictions are borne out in our empirical
investigation. We find that the use of debt in holdings commits the controlling block owner
to larger dividend payouts, whereas a non-leveraged control wedge has the opposite effect.
We analyze the actual dividend payouts to controlling owners along the pyramidal chain, in
contrast to earlier pyramid studies that only considered potential payouts. We find that
only a fraction of the cash made available to controlling owners is actually paid out to
them. Our valuation results suggest that bottom company dividends not only support debt
service obligations in the pyramid, but also have an adverse valuation effect. This is
consistent with our hypothesis that debt-induced dividend payouts may exceed the efficient
payout level for the bottom company. We also provide evidence on the presence of two
additional motivations for dividend payouts in the literature, alternative investments and
dividend preferences.
The ultimate shareholder’s decision to use leverage in the holding company instead of
minority equity in order to enhance his control is not neutral. The residual cash flow left
for the dominant owner has a different risk profile. Dividends received from the bottom
company in addition to being shared with minority equityholders must also service debt in
the pyramidal structure. This decision alters the risk profile of the dominant owner’s cash
flows and her incentives for risk-taking. It alters the options of the ultimate shareholder
when reacting to financial distress and raising equity in distress-like situations. There is
also the question of the relationship between the debt level of the bottom company and that
of holding companies. These questions we leave to future research.
34
References
Adams, R. and Ferreira, D., 2008, “One Share, One Vote: The Empirical Evidence,”
Review of Finance (12), 51-91
Agrawal, A. and Knoeber, C.R. (1996) “Firm Performance and Mechanisms to Control
Agency Problems between Managers and Shareholders,” Journal of Financial and
Quantitative Analysis (31), 377 – 397.
Almeida, H. and D. Wolfenzon, 2006, “A theory of pyramidal ownership and family
business groups,” Journal of Finance (61), 2637-2680.
Almeida, H., S. Park, M. Subramaniam and D. Wolfenzon, 2008, “Beyond Cash Flow and
Voting rights: Valuation and Performance of Firms in Complex Ownership
Structures’”, Working paper, UIUC and NYU Stern.
Attig, N., K. Fischer, and Y. Gadhoum, 2004, “On the determinants of pyramidal
ownership: Evidence on expropriation of minority interests,” Working paper, Laval
University, http://ssrn.com/ abstract=434201
Bae, K., J. Kang, and J. Kim, 2002, “Tunneling or value added? Evidence from mergers by
Korean business groups,” Journal of Finance (5), 2695-2740.
Baek, J.-S., J. Kang, and I. Lee, 2006, “Business Groups and Tunneling: Evidence from
Private Securities Offerings by Korean Chaebols,” Journal of Finance (61) 2415 -
2449.
Bennedsen, M. and K. Nielsen, 2007, “The Principle of Proportional Ownership, Investor
Protection and Firm Value in Western Europe,” working paper, Copenhagen Business
School and CEBR.
Bertrand, M., P. Mehta and S. Mullainathan, 2002, “Ferreting out tunnelling: an application
to Indian business groups,” Quarterly Journal of Economics (117), 121-148.
Bhattacharya, S., 1997, “Imperfect Information, Dividend Policy, and ‘The Bird in the
Hand Fallacy,” Bell Journal of Economics (10), 259-270.
Bianco, M. and G. Nicodano, 2006, “Pyramidal groups and debt,” European Economic
Review (50), 937-61.
Bloch, L. and E. Kremp, 2001, “Ownership and voting power in France,” The Control of
Corporate Europe, editors F. Barca and M. Becht, Oxford Press, UK.
Bolton, P. and E. Von Thadden, 1998, “Blocks, liquidity and corporate control,” Journal of
Finance (53), 1-25.
Burkart, M. and F. Panunzi, 2006, “Agency conflicts, ownership concentration, and legal
shareholder protection,” Journal of Financial Intermediation (15), 1-31.
35
Burkart, M., Gromb, D. and F. Panunzi, 1997, “Large Shareholders, Monitoring, and the
Value of the Firm,” Quarterly Journal of Economics (112), 693-728.
Chappelle, A. and A. Szafarz, 2005, “Controlling firms through majority rule,” Physica
(355), 509-529.
Claessens, S. S. Djankow and L. Lang, 2000, “The Separation of Ownership and Control in
East Asian Corporations.” Journal of Financial Economics (58), 81-112.
Claessens, S., S. Djankov, J. Fan, and L. Lang, 2002, “Disentangling the incentive and
entrenchment effects of large shareholdings”, Journal of Finance (57), 2741-2771.
Claessens, Stijn, Joseph P.H. Fan, and Larry H.P. Lang, 2002, “The benefits of group
affiliation: Evidence from East Asia,” Working paper, University of Amsterdam.
Corstjens, M., U. Peyer and L. van der Heyden, 2006, “Performance of family firms:
evidence from the US and European firms and investors,” working paper, INSEAD.
Cronqvist, H. and Nilsson, M., 2003, “Agency Costs of Controlling Minority Share-
holders,” Journal of Financial and Quantitative Analysis (38), 695-719.
Demsetz, H. and Lehn, K. (1985) The Structure of Corporate Ownership: Causes and
Consequences, Journal of Political Economy, 93, 1155 – 1177.
Faccio, M. and L. Lang, 2002, “The ultimate ownership of Western European
corporations,” Journal of Financial Economics (65), 365-395.
Faccio, M., L. Lang and L. Young, 2001, “Dividends and Expropriation,” American
Economic Review (91), 54-78.
Fan, J., T.J. Wong and T. Zhang, 2005, “The emergence of corporate pyramids in China,”
Center for Institutions and Governance working paper, Chinese University of Hong
Kong.
Ginglinger, E. and J. Hamon, 2008, “Ownership, control and market liquidity,” Working
paper, University Paris-Dauphine, http:// ssrn.com/ abstract =1071624
Heckman, J., 1979, Sample Selection Bias as a Specification Error, Econometrica, 47, 153–
561.
Holmen, M. and P. Hogfeldt, 2005, “Pyramidal discounts: tunnelling or agency costs?”
working paper, Stockholm School of Economics, http:// ssrn.com/ abstract =667743.
Jensen, M., 1986, “Agency Costs of Free Cash Flows, Corporate Finance and Takeovers,”
American Economic Review (76), 323-329.
36
Khanna, T. and Y. Yafeh, 2007, “Business Groups in Emerging Markets: Paragons or
Parasites?” Journal of Economic Literature (45), 331-72.
La Porta, R., F. Lopez-de-Silanes and A. Shleifer, 1999, “Corporate ownership around the
world,” Journal of Finance (54), 471-517.
La Porta, R. , F. Lopez-de-Silanes, A. Shleifer, R.W. Vishny, 2000, “Agency Problems and
Dividend Policies around the World,” Journal of Finance (55), 1-33.
Lins, K. V., 2003, “Equity ownership and firm value in emerging markets,” Journal of
Financial and Quantitative Analysis (38), 159-184.
Luciano, E. and G. Nicodano, 2008, “Ownership links, leverage and credit risk”, Working
paper, http:// http:// ssrn.com/ abstract=1107806.
Megginson, W. and H. von Eije, 2008, “Dividends and share repurchases in the European
Union,” Journal of Financial Economics (91), 347-374.
Morck, R., D. Wolfenzon, and B. Yeung, 2005, “Corporate governance, economic
entrenchment and growth,” Journal of Economic Literature (43), 657-722.
Shearman and Sterling, 2007, “Proportionality between ownership and control in EU listed
companies: comparative legal study, External study commissioned by the European
Commission,” Brussels, May 2007, http://www.ecgi.org/osov/final_report.php.
Volpin, P., 2002, “Governance with poor investor protection: Evidence from top executive
turnover in Italy,” Journal of Financial Economics (64), 61-90.
37
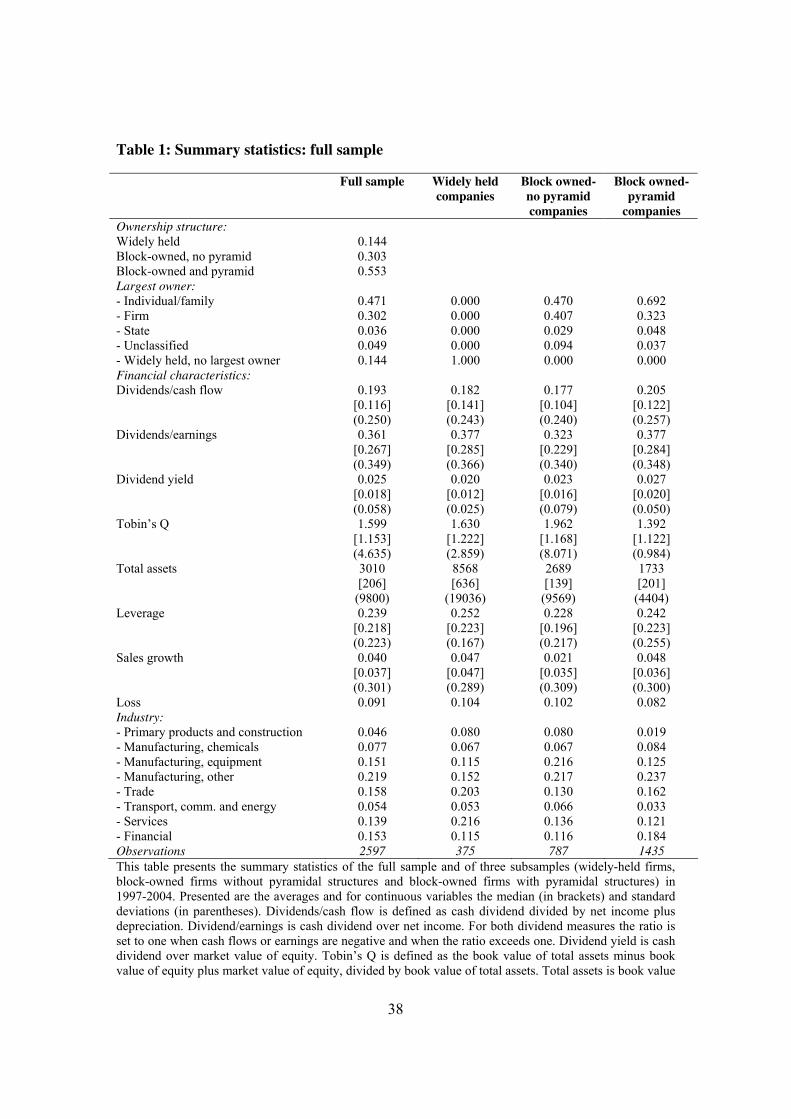
Table 1: Summary statistics: full sample
Full sample Widely held
companies
Block owned-
no pyramid
companies
Block owned-
pyramid
companies
Ownership structure:
Widely held 0.144
Block-owned, no pyramid 0.303
Block-owned and pyramid 0.553
Largest owner:
- Individual/family 0.471 0.000 0.470 0.692
- Firm 0.302 0.000 0.407 0.323
- State 0.036 0.000 0.029 0.048
- Unclassified 0.049 0.000 0.094 0.037
- Widely held, no largest owner 0.144 1.000 0.000 0.000
Financial characteristics:
Dividends/cash flow 0.193
[0.116]
(0.250)
0.182
[0.141]
(0.243)
0.177
[0.104]
(0.240)
0.205
[0.122]
(0.257)
Dividends/earnings 0.361
[0.267]
(0.349)
0.377
[0.285]
(0.366)
0.323
[0.229]
(0.340)
0.377
[0.284]
(0.348)
Dividend yield 0.025
[0.018]
(0.058)
0.020
[0.012]
(0.025)
0.023
[0.016]
(0.079)
0.027
[0.020]
(0.050)
Tobin’s Q 1.599
[1.153]
(4.635)
1.630
[1.222]
(2.859)
1.962
[1.168]
(8.071)
1.392
[1.122]
(0.984)
Total assets 3010
[206]
(9800)
8568
[636]
(19036)
2689
[139]
(9569)
1733
[201]
(4404)
Leverage 0.239
[0.218]
(0.223)
0.252
[0.223]
(0.167)
0.228
[0.196]
(0.217)
0.242
[0.223]
(0.255)
Sales growth 0.040
[0.037]
(0.301)
0.047
[0.047]
(0.289)
0.021
[0.035]
(0.309)
0.048
[0.036]
(0.300)
Loss 0.091 0.104 0.102 0.082
Industry:
- Primary products and construction 0.046 0.080 0.080 0.019
- Manufacturing, chemicals 0.077 0.067 0.067 0.084
- Manufacturing, equipment 0.151 0.115 0.216 0.125
- Manufacturing, other 0.219 0.152 0.217 0.237
- Trade 0.158 0.203 0.130 0.162
- Transport, comm. and energy 0.054 0.053 0.066 0.033
- Services 0.139 0.216 0.136 0.121
- Financial 0.153 0.115 0.116 0.184
Observations 2597 375 787 1435
This table presents the summary statistics of the full sample and of three subsamples (widely-held firms,
block-owned firms without pyramidal structures and block-owned firms with pyramidal structures) in
1997-2004. Presented are the averages and for continuous variables the median (in brackets) and standard
deviations (in parentheses). Dividends/cash flow is defined as cash dividend divided by net income plus
depreciation. Dividend/earnings is cash dividend over net income. For both dividend measures the ratio is
set to one when cash flows or earnings are negative and when the ratio exceeds one. Dividend yield is cash
dividend over market value of equity. Tobin’s Q is defined as the book value of total assets minus book
value of equity plus market value of equity, divided by book value of total assets. Total assets is book value
38
of total assets. Leverage is total debt over total assets. Sales growth is the two-year growth rate of sales.
The dummy variable loss equals one when net income is negative and zero otherwise. The dummy
variables for largest owner equals one if the largest controlling owner is respectively, an individual or
family, another firm or the state. Eight dummy variables describe the industry of the firm’s main activities.
The number of observations are included in the bottom row (for dividend yield and Tobin’s Q the number
of observations is 2528 in the full sample, 370 for widely held firms, 765 for block held firms and 1393 for
the pyramids). The dividend variables and Tobin’s Q are measured at t+1.
39

Table 2: Determinants of dividend payout and firm value for the full sample
Panel A: Determinants of dividend payout and yield
(1)
Dividend/
cash flow
(2)
Dividend/
earnings
(3)
Dividend
Yield
Ln(Assets) 0.007**
(-2.32)
0.018***
(5.24)
0.0001
(0.02)
Leverage -0.170***
(-2.95)
-0.112**
(-2.35)
-0.001**
(-2.25)
Sales growth -0.008
(-0.41)
0.007
(0.32)
0.003
(0.47)
Loss -0.070***
(-3.34)
-0.200***
(8.43)
-0.020***
(-8.47)
Block owned-no pyramid -0.006
(-0.43)
-0.041**
(-1.97)
0.002
(0.82)
Block owned-pyramid 0.009
(0.65)
-0.004
(-0.19)
0.006***
(3.14)
Industry fixed effects Yes Yes Yes
Year fixed effects Yes Yes Yes
Observations 2597 2597 2528
Adjusted R2
0.125 0.096 0.029
Panel B: Determinants of Tobin’s Q
(1) (2) (3)
Ln(Assets) -0.264**
(-2.40)
-0.270**
(-2.41)
-0.267**
(-2.47)
Leverage -0.629
(-1.65)*
-0.230
(-0.79)
-0.150
(-0.51)
Sales growth -1.453*
(-1.81)
-1.474*
(-1.82)
-1.465*
(-1.89)
Block owned-no pyramid -0.064
(-0.30)
-0.074
(-0.34)
-1.381**
(-2.37)
Block owner-pyramid -0.363*
(-1.89)
-0.420**
(-2.12)
-0.472*
(-1.83)
Dividend payout 2.360**
(2.06)
-0.026
(-0.05)
Dividend payout * Block owned-
no pyramid
7.325**
(2.09)
Dividend payout * Block owned-
Pyramid
0.594
(1.07)
Industry fixed effects Yes Yes Yes
Year fixed effects Yes Yes Yes
Observations 2528 2528 2528
Adjusted R2
0.047 0.062 0.089
This table presents regression results for the full sample of firms. In Panel A the explained variables are the
measures for dividends. In Panel B the explained variable is Tobin’s Q. All variables are defined in Table
1. The regressions include an intercept, seven industry dummies and seven year dummies (not reported).
Reported are coefficients and t-values, with a Newey-West correction for heteroscadasticity and
autocorrelation. Significance is indicated as follows: ‘*’ is 10% significance, ‘**’ is 5%, and ‘***’ is 1%.
40
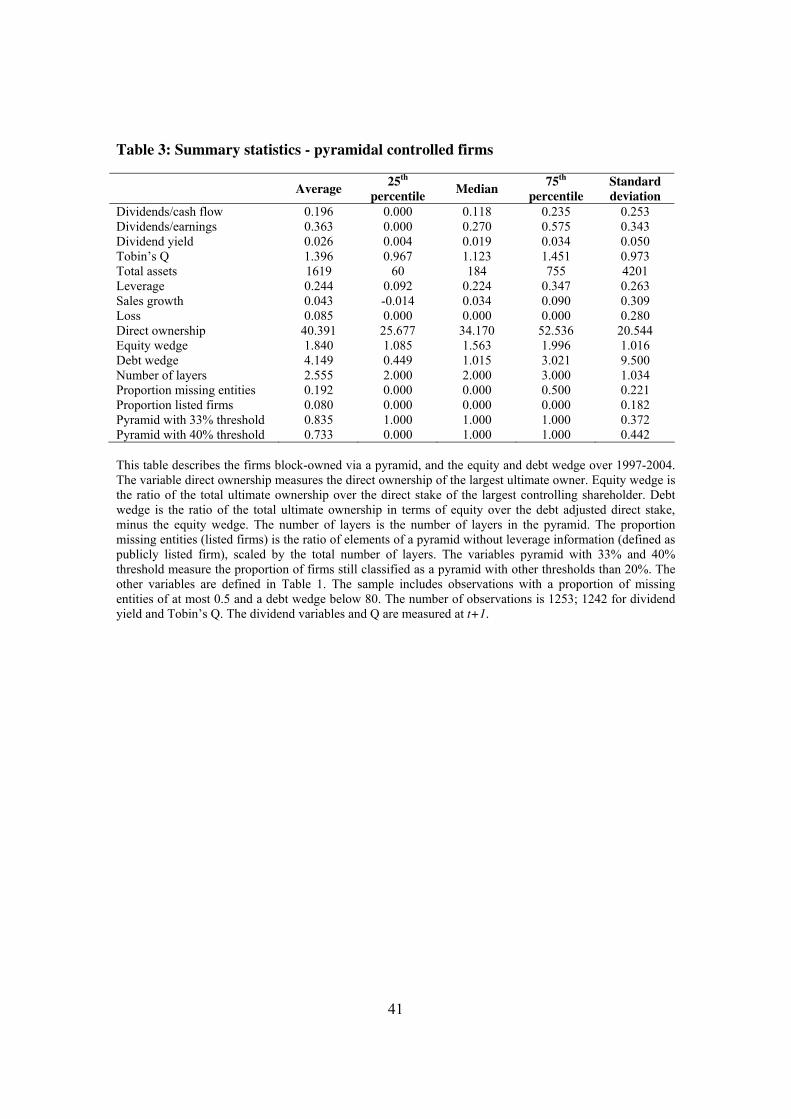
Table 3: Summary statistics - pyramidal controlled firms
Average 25th
percentile Median
75th
percentile
Standard
deviation
Dividends/cash flow 0.196 0.000 0.118 0.235 0.253
Dividends/earnings 0.363 0.000 0.270 0.575 0.343
Dividend yield 0.026 0.004 0.019 0.034 0.050
Tobin’s Q 1.396 0.967 1.123 1.451 0.973
Total assets 1619 60 184 755 4201
Leverage 0.244 0.092 0.224 0.347 0.263
Sales growth 0.043 -0.014 0.034 0.090 0.309
Loss 0.085 0.000 0.000 0.000 0.280
Direct ownership 40.391 25.677 34.170 52.536 20.544
Equity wedge 1.840 1.085 1.563 1.996 1.016
Debt wedge 4.149 0.449 1.015 3.021 9.500
Number of layers 2.555 2.000 2.000 3.000 1.034
Proportion missing entities 0.192 0.000 0.000 0.500 0.221
Proportion listed firms 0.080 0.000 0.000 0.000 0.182
Pyramid with 33% threshold 0.835 1.000 1.000 1.000 0.372
Pyramid with 40% threshold 0.733 0.000 1.000 1.000 0.442
This table describes the firms block-owned via a pyramid, and the equity and debt wedge over 1997-2004.
The variable direct ownership measures the direct ownership of the largest ultimate owner. Equity wedge is
the ratio of the total ultimate ownership over the direct stake of the largest controlling shareholder. Debt
wedge is the ratio of the total ultimate ownership in terms of equity over the debt adjusted direct stake,
minus the equity wedge. The number of layers is the number of layers in the pyramid. The proportion
missing entities (listed firms) is the ratio of elements of a pyramid without leverage information (defined as
publicly listed firm), scaled by the total number of layers. The variables pyramid with 33% and 40%
threshold measure the proportion of firms still classified as a pyramid with other thresholds than 20%. The
other variables are defined in Table 1. The sample includes observations with a proportion of missing
entities of at most 0.5 and a debt wedge below 80. The number of observations is 1253; 1242 for dividend
yield and Tobin’s Q. The dividend variables and Q are measured at t+1.
41
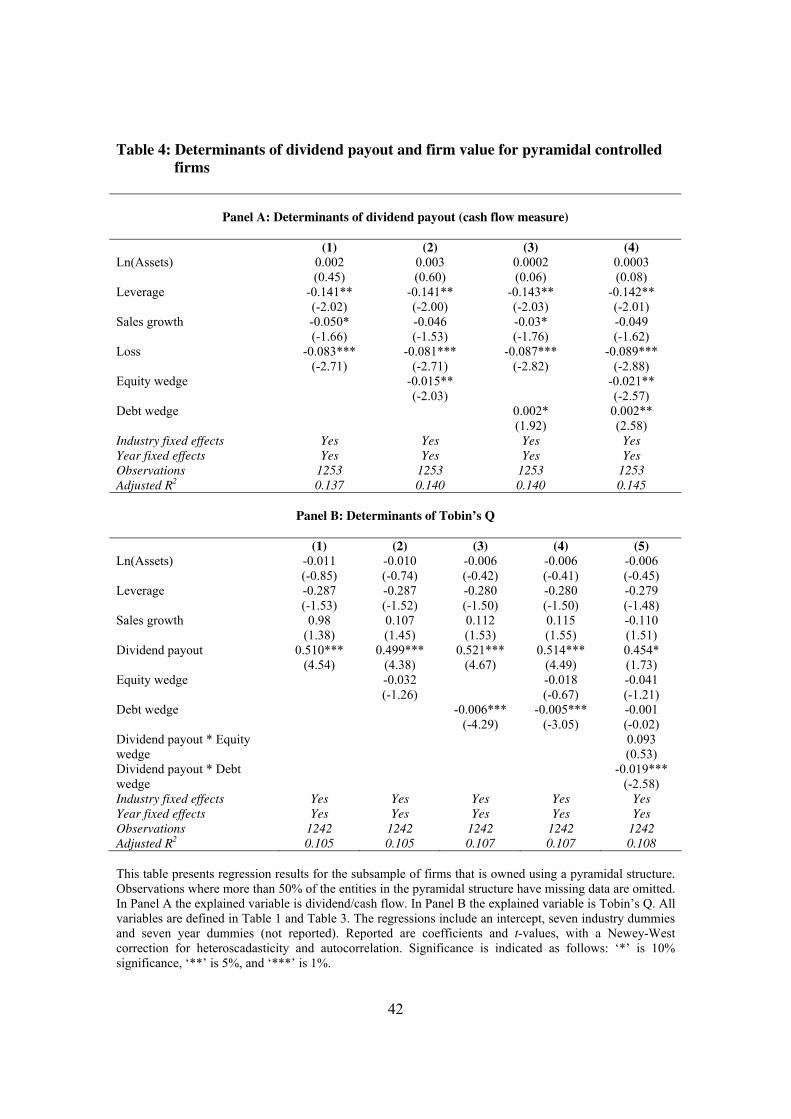
Table 4: Determinants of dividend payout and firm value for pyramidal controlled
firms
Panel A: Determinants of dividend payout (cash flow measure)
(1) (2) (3) (4)
Ln(Assets) 0.002
(0.45)
0.003
(0.60)
0.0002
(0.06)
0.0003
(0.08)
Leverage -0.141**
(-2.02)
-0.141**
(-2.00)
-0.143**
(-2.03)
-0.142**
(-2.01)
Sales growth -0.050*
(-1.66)
-0.046
(-1.53)
-0.03*
(-1.76)
-0.049
(-1.62)
Loss -0.083***
(-2.71)
-0.081***
(-2.71)
-0.087***
(-2.82)
-0.089***
(-2.88)
Equity wedge -0.015**
(-2.03)
-0.021**
(-2.57)
Debt wedge 0.002*
(1.92)
0.002**
(2.58)
Industry fixed effects Yes Yes Yes Yes
Year fixed effects Yes Yes Yes Yes
Observations 1253 1253 1253 1253
Adjusted R2
0.137 0.140 0.140 0.145
Panel B: Determinants of Tobin’s Q
(1) (2) (3) (4) (5)
Ln(Assets) -0.011
(-0.85)
-0.010
(-0.74)
-0.006
(-0.42)
-0.006
(-0.41)
-0.006
(-0.45)
Leverage -0.287
(-1.53)
-0.287
(-1.52)
-0.280
(-1.50)
-0.280
(-1.50)
-0.279
(-1.48)
Sales growth 0.98
(1.38)
0.107
(1.45)
0.112
(1.53)
0.115
(1.55)
-0.110
(1.51)
Dividend payout 0.510***
(4.54)
0.499***
(4.38)
0.521***
(4.67)
0.514***
(4.49)
0.454*
(1.73)
Equity wedge -0.032
(-1.26)
-0.018
(-0.67)
-0.041
(-1.21)
Debt wedge -0.006***
(-4.29)
-0.005***
(-3.05)
-0.001
(-0.02)
Dividend payout * Equity
wedge
0.093
(0.53)
Dividend payout * Debt
wedge
-0.019***
(-2.58)
Industry fixed effects Yes Yes Yes Yes Yes
Year fixed effects Yes Yes Yes Yes Yes
Observations 1242 1242 1242 1242 1242
Adjusted R2
0.105 0.105 0.107 0.107 0.108
This table presents regression results for the subsample of firms that is owned using a pyramidal structure.
Observations where more than 50% of the entities in the pyramidal structure have missing data are omitted.
In Panel A the explained variable is dividend/cash flow. In Panel B the explained variable is Tobin’s Q. All
variables are defined in Table 1 and Table 3. The regressions include an intercept, seven industry dummies
and seven year dummies (not reported). Reported are coefficients and t-values, with a Newey-West
correction for heteroscadasticity and autocorrelation. Significance is indicated as follows: ‘*’ is 10%
significance, ‘**’ is 5%, and ‘***’ is 1%.
42
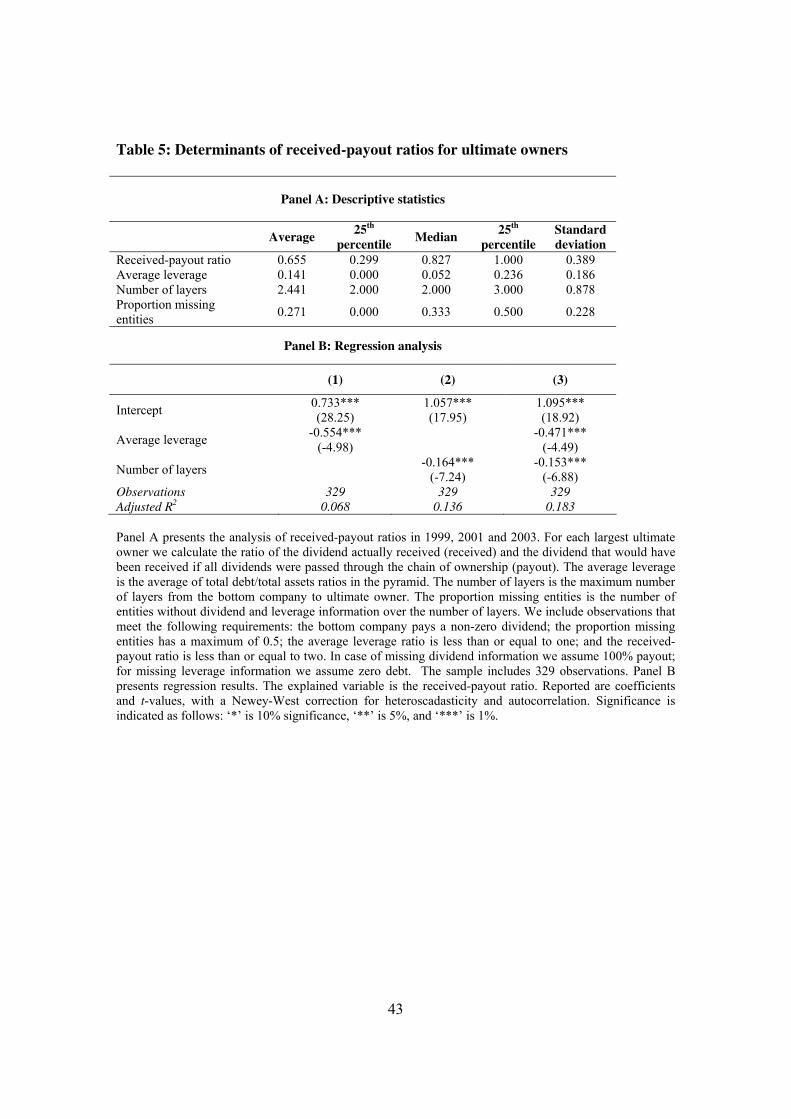
Table 5: Determinants of received-payout ratios for ultimate owners
Panel A: Descriptive statistics
Average 25th
percentile Median
25th
percentile
Standard
deviation
Received-payout ratio 0.655 0.299 0.827 1.000 0.389
Average leverage 0.141 0.000 0.052 0.236 0.186
Number of layers 2.441 2.000 2.000 3.000 0.878
Proportion missing
entities 0.271 0.000 0.333 0.500 0.228
Panel B: Regression analysis
(1) (2) (3)
Intercept 0.733***
(28.25)
1.057***
(17.95)
1.095***
(18.92)
Average leverage -0.554***
(-4.98)
-0.471***
(-4.49)
Number of layers
-0.164***
(-7.24)
-0.153***
(-6.88)
Observations 329 329 329
Adjusted R2
0.068 0.136 0.183
Panel A presents the analysis of received-payout ratios in 1999, 2001 and 2003. For each largest ultimate
owner we calculate the ratio of the dividend actually received (received) and the dividend that would have
been received if all dividends were passed through the chain of ownership (payout). The average leverage
is the average of total debt/total assets ratios in the pyramid. The number of layers is the maximum number
of layers from the bottom company to ultimate owner. The proportion missing entities is the number of
entities without dividend and leverage information over the number of layers. We include observations that
meet the following requirements: the bottom company pays a non-zero dividend; the proportion missing
entities has a maximum of 0.5; the average leverage ratio is less than or equal to one; and the received-
payout ratio is less than or equal to two. In case of missing dividend information we assume 100% payout;
for missing leverage information we assume zero debt. The sample includes 329 observations. Panel B
presents regression results. The explained variable is the received-payout ratio. Reported are coefficients
and t-values, with a Newey-West correction for heteroscadasticity and autocorrelation. Significance is
indicated as follows: ‘*’ is 10% significance, ‘**’ is 5%, and ‘***’ is 1%.
43
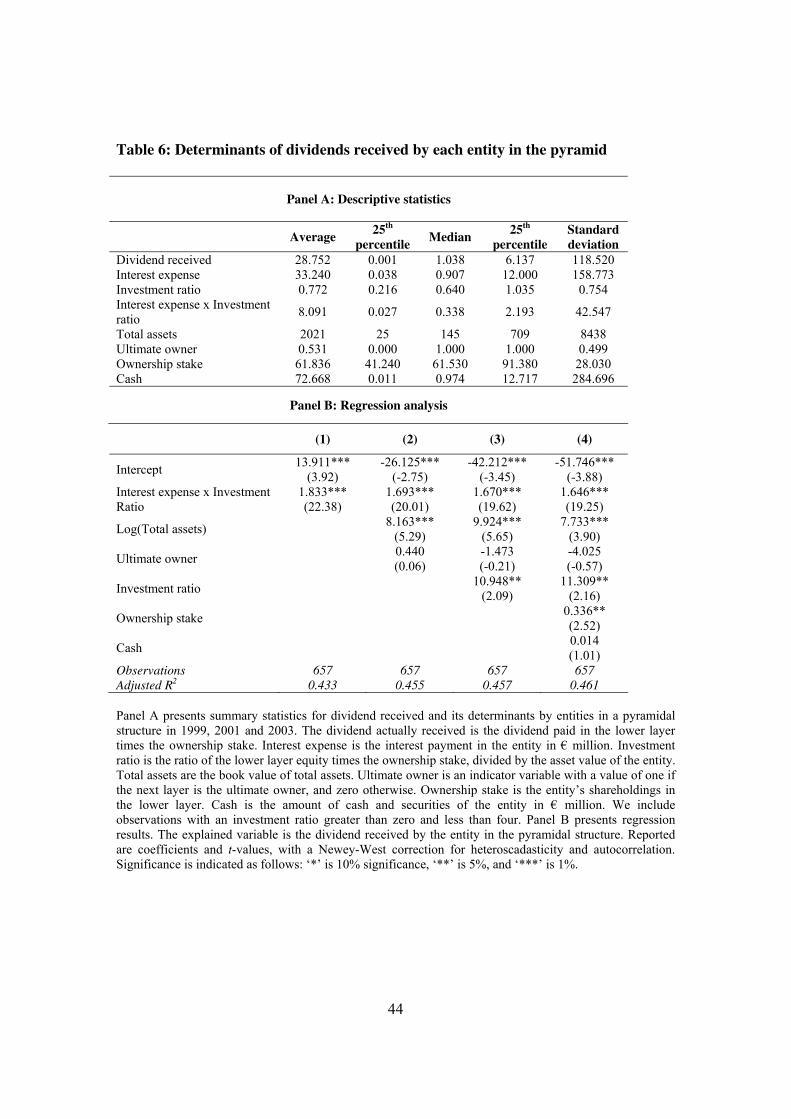
Table 6: Determinants of dividends received by each entity in the pyramid
Panel A: Descriptive statistics
Average 25th
percentile Median
25th
percentile
Standard
deviation
Dividend received 28.752 0.001 1.038 6.137 118.520
Interest expense 33.240 0.038 0.907 12.000 158.773
Investment ratio 0.772 0.216 0.640 1.035 0.754
Interest expense x Investment
ratio 8.091 0.027 0.338 2.193 42.547
Total assets 2021 25 145 709 8438
Ultimate owner 0.531 0.000 1.000 1.000 0.499
Ownership stake 61.836 41.240 61.530 91.380 28.030
Cash 72.668 0.011 0.974 12.717 284.696
Panel B: Regression analysis
(1) (2) (3) (4)
Intercept 13.911***
(3.92)
-26.125***
(-2.75)
-42.212***
(-3.45)
-51.746***
(-3.88)
Interest expense x Investment
Ratio
1.833***
(22.38)
1.693***
(20.01)
1.670***
(19.62)
1.646***
(19.25)
Log(Total assets)
8.163***
(5.29)
9.924***
(5.65)
7.733***
(3.90)
Ultimate owner
0.440
(0.06)
-1.473
(-0.21)
-4.025
(-0.57)
Investment ratio
10.948**
(2.09)
11.309**
(2.16)
Ownership stake
0.336**
(2.52)
Cash
0.014
(1.01)
Observations 657 657 657 657
Adjusted R2
0.433 0.455 0.457 0.461
Panel A presents summary statistics for dividend received and its determinants by entities in a pyramidal
structure in 1999, 2001 and 2003. The dividend actually received is the dividend paid in the lower layer
times the ownership stake. Interest expense is the interest payment in the entity in € million. Investment
ratio is the ratio of the lower layer equity times the ownership stake, divided by the asset value of the entity.
Total assets are the book value of total assets. Ultimate owner is an indicator variable with a value of one if
the next layer is the ultimate owner, and zero otherwise. Ownership stake is the entity’s shareholdings in
the lower layer. Cash is the amount of cash and securities of the entity in € million. We include
observations with an investment ratio greater than zero and less than four. Panel B presents regression
results. The explained variable is the dividend received by the entity in the pyramidal structure. Reported
are coefficients and t-values, with a Newey-West correction for heteroscadasticity and autocorrelation.
Significance is indicated as follows: ‘*’ is 10% significance, ‘**’ is 5%, and ‘***’ is 1%.
44