Debt Advice in the UK - Free, Unbiased, Independent advice
87
Debt Advice in the UK Final Report for The Money Advice Service Prepared by February 2012
Transcript of Debt Advice in the UK - Free, Unbiased, Independent advice

Debt Advice in the UK
Final Report for
The Money Advice Service
Prepared by
February 2012

Wherever possible London Economics uses paper sourced from sustainably managed forests using production processes that meet the EU eco-label requirements. Copyright © 2011 Money Advice Service. Except for the quotation of short passages for the purposes of criticism or review, no part of this document may be reproduced without permission.
The present study was commissioned by the Money Advice Service and funding was provided by the Department for Business, Innovation and Skills.
Authors: Patrice Muller, Mette Trier-Damgaard, Shaan Devnani and Rachel Stonehouse
About London Economics
London Economics is one of Europe's leading specialist economics and policy consultancies and has its head office in London. We also have offices in Brussels, Dublin, Cardiff and Budapest, and associated offices in Paris and Valletta.
We advise clients in both the public and private sectors on economic and financial analysis, policy development and evaluation, business strategy, and regulatory and competition policy. Our consultants are highly-qualified economists with experience in applying a wide variety of analytical techniques to assist our work, including cost-benefit analysis, multi-criteria analysis, policy simulation, scenario building, statistical analysis and mathematical modelling. We are also experienced in using a wide range of data collection techniques including literature reviews, survey questionnaires, interviews and focus groups.
Head Office: 11-15 Betterton Street, London, WC2H 9BP, United Kingdom.
w: www.londecon.co.uk e: [email protected]
t: +44 (0)20 7866 8185 f: +44 (0)20 7866 8186
Acknowledgements
We would like to thank the many stakeholders from the free-to-client and fee-charging debt advice sectors and other organisations that provided very useful information and advice to the project team over the course of the project. Responsibility for the contents of this report remains with London Economics.

Contents Page
London Economics
Debt Advice in the UK i
Glossary iii
Executive summary v
1 Introduction 1
1.1 Objectives and scope of project 1
2 The demand for debt advice services 2
2.1 The level of demand for debt advice services 2 2.2 Causes of debt 8 2.3 The characteristics of debt advice users 9 2.4 Debt advice services sought by debt advice clients 23 2.5 Customer journey 25
3 Debt advice providers in the UK 28
3.1 Informal debt advice 29 3.2 Formal debt advice 30
4 Delivery of debt advice 41
4.1 Awareness of debt advice services and referrals 41 4.2 Delivery channels used by service providers 42 4.3 Effectiveness of debt advice 50
5 Services offered by debt advisers 52
5.1 Complexity of debt handled 53 5.2 Debt handling tools 56 5.3 Debt solutions 57
6 Customer satisfaction with debt advice 66
7 Conclusions 68
References 70
Annex 1 List of debt advice providers 75
Tables, Figures & boxes Page
ii
London Economics
Debt Advice in the UK
Table 1: Agencies contacted for debt advice 6
Table 2: Number of housheolds having sought debt advice from more than one service provider and total number of households having sought advice from service provider 7
Table 3: Debt advice providers 75
Figure 1: Demand for debt service advice in BIS/YouGov Debt Tracker 2009-2010 survey 2
Figure 2: Percentage of survey participants indicating that they have sought debt advice of the 6-months period preceding their survey participation 4
Figure 3: Monthly calls to free-to-client debt advice provider 5
Figure 4: CAB Debt Advice Clients by Age (2009) 11
Figure 5: Percentage point difference between age groups of population and those who sought advice (CAB) 12
Figure 6: Debt Advice Clients by Income Groups (NDL) 15
Figure 7: Percentage of BME group seeking debt advice 16
Figure 8: Percentage point difference between CAB clients and whole population - Ethnicity 17
Figure 9: Importance of various aspects of debt service advice 24
Figure 10: Average of percentage of respondents agreeing with 10 different statements expressing need for emotional support 25
Figure 11: Percentage of individuals seeking debt advice who have other problems as well 26
Figure 12: Informal and formal debt advice providers 29
Figure 13: Main organisations providng free-to-client debt advices 31
Figure 14: Fee-charging debt advice providers 35
Figure 15: Most commonly contact debt advice providers (2009/10) 38
Figure 16: Whole debt advice market (2011) 39
Figure 17: Market Share (Fee-charging sector): DMPs 40
Figure 18: CCCS Referral Sources 42
Figure 19: -Debt advice delivery channels 43
Figure 20: Pyramid showing structure of debt advice 52
Figure 21: Types of debt (2010) 54
Figure 22: Success rate of IVAs (%) 59
Figure 23: Sequestrations awarded and PTDs Registered 2006-2011 61
Figure 24: Most commonly used debt tools and solutions (6 months after advice sought) 63

Glossary
London Economics
Debt Advice in the UK iii
Glossary
AIB Accountant in Bankruptcy
APR Annual Percentage Rate
AO Administration Order
BIS Department for Business, Innovation and Skills
BME Black and Minority Ethnic
CAB Citizens Advice Bureau
CAS Citizens Advice Scotland
CCAB Camden Citizens Advice Bureau
CCCS Consumer Credit Counselling Service
DETI Department of Enterprise, Trade and Investment (Northern Ireland)
DTI Department for Trade and Industry
DMP Debt Management Plan
DRO Debt Relief Order
FLA Financing and Leasing Association
IVA Individual Voluntary Arrangement
LILA Low Income Low Assets
LSC Legal Services Commission
MAT Money Advice Trust
OFT Office of Fair Trading
NDL National Debtline
PTD Protected Trust Deeds

Glossary
iv
London Economics
Debt Advice in the UK
Over-indebtedness definition:
Over-indebtedness was defined throughout the literature both quantitatively and qualitatively. The widely used qualitative measure was whether households found their debt a “heavy burden”. The quantitative measures were when individuals were spending more than 25% or 50% of their gross monthly income on unsecured repayments.1
Socio-economic Group definitions:
A/B: Professionals, directors, self-employed people employing more than 25 staff, employees in senior positions with professional qualifications and/or a degree;
C1: Office workers without a degree, employees in junior positions with professional qualifications and/or a degree, self-employed people employing 1–24 staff, students in full-time education;
C2: qualified skilled manual workers;
D/E: semi-skilled and unskilled manual workers, shop assistants, cleaners, unemployed, retired on state pension only2.
1 As identified by Disney, Bridges and Gathergood (2008), ‘Drivers of over indebtedness’ 2 Tudela and Young (2003), ‘The distribution of unsecured debt in the United Kingdom: survey evidence’
Executive summary
London Economics
Debt Advice in the UK v
Executive summary
This report provides an overview of the debt advice sector, free-to-client and fee-charging, in the UK at the present time.
It is based on desk research and consultations with a wide range of debt advice providers and focuses on:
the demand for debt advice services
the structure of the UK debt advice sector
the delivery of debt advice and its effectiveness
the services offered by debt advice providers
the satisfaction of customers with the services received
The quantification of the demand for debt advice faces two challenges.
First is the issue whether only the active demand, i.e. those actively seeking debt advice, or the total demand, i.e. the active demand and the latent demand, should be considered. The latent demand emanates from individuals or households who are having debt problems but, for one reason or another, are not actively seeking debt advice.
Second is the issue of how to measure the demand for debt advice.
While an estimate of the actual demand can be derived from information on the actual number of clients served by the various debt advice providers, a similar estimate of the total demand can only be derived from surveys asking respondents to indicate whether they experience debt problems and they are seeking debt advice.
While both approaches are being used in the UK, none is free of problems.
The bottom-up approach, based on the number of clients served, requires either obtaining information from all the debt advice providers in the UK or, at least, from the major debt advice providers (i.e., those which account for the bulk of the clients served) and gross up the client numbers from this latter group on the basis of information from surveys of debt advice seekers. At issue is the size of the gross-up factor and its potential evolution over time.
The top down, survey-based approach suffers, at the present time, from the problem that, in the surveys undertaken so far, it is not clear whether the survey respondent is responding on behalf of herself/himself or the household unit.
Moreover, as the top-down approach is used to derive estimates of the total demand (active and latent) for debt advice, it is also necessary to make assumptions about how to identify, among the survey participants, the set of individuals or households who would benefit from debt advice but are not actively seeking such advice.
As a result of these methodological issues, the estimates of the actual and total demand vary markedly. For example, with regards to:

Executive summary
vi
London Economics
Debt Advice in the UK
the actual demand for debt advice, estimates range from 2.3 to 2.6 million individuals in 2009/10 and slightly more than 1 million households in 2009/10
the total demand, estimates range 1.9 to 4.9 million individuals in 2008 and 5.5 million households in 2009/10.
In terms of the socio-economic characteristics of the individuals seeking debt advice, the results of the desk research show that:
typically they are in the 35-49 age bracket
are broadly balanced in terms of gender with possibly a small over-representation of women
in majority, they have very low incomes (mostly an income less than half of the UK national average)
are often single parents
are mostly not in employment
are in majority renting their accommodation
When facing debt problems, individuals/households consult a wide range of advice providers such as:
friends and family
financial services providers (for example, banks, building societies, credit unions)
housing associations
free-to-client providers (for example, Citizens Advice Bureau, Consumer Credit Counselling Service, Payplan, National Debtline)
fee-charging providers (e.g., debt management companies, etc).
The focus of the report is on the free-to-client and the fee-charging debt advice providers. Typically, debt advice is provided by these organisations in one or a combination of the following three forms and delivery channels:
self-help, which is typically provided through the on-line channel
assisted self-help, which is typically provided by telephone
full assistance, which is typically provided in a face-to-face setting
Anecdotal evidence suggests that many debt advice seekers tend to move from one type of debt advice form and/or delivery channel to another.
Unfortunately, at the present time, there exists no comprehensive sector-wide data on the prevalence of the different debt advice forms and delivery channels, and, more importantly, the needs of debt-advice seekers.
Thus, it is impossible to determine at the present time whether the current organisation and structure of the debt advice sector meets the needs of the actual and potential debt advice seekers.
Evidence about the effects of debt advice is also patchy.

Executive summary
London Economics
Debt Advice in the UK vii
While the services of a number of free-to-client debt advice providers have been evaluated, these evaluations focused mainly on the short-term impact of the debt advice on the client served.
This limited evidence suggests that 50-60% of those having received debt advice have reduced their debt or eliminate their debt after having received advice.
However, there exists almost no information on the longer-term effect of the debt advice on the client benefitting from such debt advice.
In particular, information on the debt situation of the client 2 or 3 years after having received the debt advice is practically non-existent, reflecting in a very large part the significant difficulties of tracking these clients over time.
Moreover, because the various evaluations are undertaken by or on behalf of individual debt service providers, there exists little information about the relative effectiveness of the different debt advice modes and delivery channels.
While such sector-wide effect information is scarce, the review of the existing literature suggests that debt advice seekers are typically satisfied with the service received.
Overall, the desk review of the existing literature and information on the debt advice sector and the consultations with stakeholders show that, while there exists a fair body of material on individual debt advice providers or programs, very few analyses take a more holistic approach, covering the debt advice sector as a whole or, at least, large segments of it. Notable information gaps relate to:
estimates of the actual and total demand for debt advice
the volume of debt advice provision by form and channel for the sector as a whole
the needs of actual and potential debt advice seekers
the comparative effectiveness in the short and longer run of the different forms and channels of debt advice provision


1 │ Introduction
London Economics
Debt Advice in the UK 1
1 Introduction
1.1 Objectives and scope of project
The main objective of this study for the Money Advice Service is to provide an overview of the current debt advice sector in the UK in order to fully understand how the sector works and whether the delivery channels, tools and solutions currently meet the needs of service users and creditors.
In terms of scope, this landscaping of debt advice services considers the entire UK, maps demand in different areas and compares and highlights similarities and differences where appropriate.
Ultimately, the study forms a view on the extent to which current tools and delivery mechanisms deliver the services sought by those seeking and in need of debt advice services.
In summary, the study:
is based on secondary research;
landscapes the current debt advice sector;
provides information on current tools, solutions and delivery channels;
identifies information gaps;
identifies product, tool and solution gaps; and
provides recommendations for further research to fill the identified gaps.
The effectiveness of debt advice is also discussed within this report, and it is important to note that there exist numerous different definitions of the “effectiveness” of debt advice.
For the purpose of our research, we define effectiveness narrowly in terms of whether the debt of a client of a debt advice provider has been reduced in the short/long-term and whether the clients of debt advice providers remain free of debt problems over a period of 2 to 3 years after having their debt issue being addressed or experience renewed debt problems.

2 │ The demand for debt advice services
2
London Economics
Debt Advice in the UK
2 The demand for debt advice services
2.1 The level of demand for debt advice services
Determining the total level of demand for debt advice services is challenging, especially as many of those experiencing debt problems do not actively seek formal advice.
For example, the BIS/YouGov Debt Tracker survey shows that in 2009-2010, among the survey respondents reporting having real financial problems and having fallen behind with many bills or credit commitments, only 37% sought debt advice. Among the respondents constantly struggling to keep up with their bills and credit commitments, only 8% sought debt advice (Figure 1)3.
Figure 1: Demand for debt service advice in BIS/YouGov Debt Tracker 2009-2010 survey
Source: BIS/YouGov Debt Tracker 2009-2010 survey
2.1.1 The actual or observed demand for debt advice
The estimates of the level of active demand for debt advice vary markedly; one estimate of the target market is 3 million individuals.4 More conservative estimates put the level of active demand
3 Dayson (2004) found that just 14% of those interviewed in another survey had sought advice at all about financial matters in the previous couple of years (Dayson (2004), ‘Financial exclusion: its impact on individuals, disadvantaged communities and the city economy’)
4 Mintel (2010), ‘Debt Management, Financial Intelligence’
0%
3%
8%
16%
37%
0%0%
5%
10%
15%
20%
25%
30%
35%
40%
Are keeping up with all bills and
commitments
without any difficulties (36.4% of
households)
Are keeping up with all bills and
commitments but is
a struggle from time to time (34.5% of
households)
Are keeping up with all bills and
commitments but it
is a constant struggle (17.1% of
households)
Are falling behind with some bills or
credit commitments
(4.3% of households)
Are having real financial problems
and have fallen
behind with many bills or credit
commitments (3.7% of households)
Do not have any bills or credit
commitments (2.4%
of households)

2 │ The demand for debt advice services
London Economics
Debt Advice in the UK 3
between 2.3 million5 to 2.6 million individuals6 for 2010/11. Our own analysis, based on the BIS/YouGov survey, suggests that, overall, slightly more than 1 million households sought debt advice in 2010/11.
2.1.2 The latent demand for debt advice
The estimates above refer only to those who have actively sought advice. However there are many people that have experienced or are experiencing debt problems without seeking advice.
We note that these people may have a need for debt advice without actively demanding it and refer to this market segment as the latent demand for debt advice.
For 2008, the estimated total demand for debt advice ranged from 1.9-4.9m individuals7 implying the latent demand could be as high as 2.6 million8.
Our own analysis of the BIS/YouGov latest Debt Tracker survey (2009/2010) suggests that a) up to 4.4 million households could have a latent demand for debt advice and b) the total demand (actual + latent) could be about 5.5 million households.
Another indication of the fact that the latent demand for debt advice may be important is provided in the study by Buck, Tam and Fisher (2007) who found that the supply of free face-to-face advice fell far short of demand9.Their evaluation of money advice outreach pilots aimed at areas or groups facing high levels of deprivation and financial exclusion shows that “75% of interviewees reached in non-prison outreach locations would consider seeking professional advice about serious future money problems or current problems they had not sought about”. Information from a ‘free-to-client’ debt advice provider supported this point of view – the amount of telephone calls they received increased by over 100% in period 2003 to 2010, however the percentage of calls answered steadily fell, indicating perhaps that their capacity is relatively rigid10.
However, views on whether the level of active demand for debt advice services has increased greatly in recent years vary.
On one hand, Citizen’s Advice Bureau (CAB) - a charity that provides free-to-client advice including debt advice, estimates that demand for their free debt advice services increased by 100% in the past decade11.
On the other hand, the various BIS/YouGov Debt Tracker surveys show that from July 2008 (the first data point available for the first survey) to October 2010 (the last data
5 Actual figure 2.268m: CAB (2011), ‘Advice Trends, quarterly statistics of the Citizens Advice service (England and Wales)’ 6 Gathergood (2011), ‘Demand, capacity and need for debt advice in the UK’ 7 Estimates of the number of over-indebted individuals range from 3-8%. Multiplying these estimates by UK adult population yields the
range cited above range. [3% is from Blake and de Jong (2008) ‘Short Changed - Financial Exclusion: A guide for donors and funders’, 8% from Disney, Bridges and Gathergood (2008), ‘Drivers of over indebtedness’]. N.B the 8% figure refers to individuals who were over-indebted ‘at some point in the year’ and may not reflect those suffering from constant debt problems
8 This figure is achieved by subtracting active demand from total demand, leaving us with latent demand 9 Buck, Tam and Fisher (2007), ‘Putting Money Advice Where the Need is: Evaluating the Potential for Advice Provision in Different
Outreach Locations’ 10 NDL client data 2003-11 11 CAB (2009), ‘A life in debt’

2 │ The demand for debt advice services
4
London Economics
Debt Advice in the UK
point from the latest survey) show that the percentage of respondents having sought debt advice fluctuated between 3% and 5% over the period July 2008 – October 2010 and shows no upward trend.
Figure 2: Percentage of survey participants indicating that they have sought debt advice of the 6-months period preceding their survey participation
Source: London Economics analysis of BIS/YouGov surveys
2.1.3 Seasonality of the demand for debt advice
A report by Citizens Advice Scotland (CAS) and the study by Gathergood for MAT show that demand for debt advice is highly seasonal during the year with a significant increase in the number of debt advice enquiries concerning consumer debt in the first quarter of the year compared to other months12.
This seasonality of the demand for debt advice is also reflected in data received from a free-to-client debt advice provider, illustrated in Figure 3 below.
12 CAS (2011), ‘Debt Advice in Scotland - The role of the Scottish CAB Service in the debt advice landscape’
3 3
5
4
5
4
3 3
0
1
2
3
4
5
6
Jul-0
8
Aug
-08
Sep-
08
Oct
-08
Nov
-08
Dec
-08
Jan-
09
Feb-
09
Mar
-09
Apr
-09
May
-09
Jun-
09
Jul-0
9
Aug
-09
Sep-
09
Oct
-09
Nov
-09
Dec
-09
Jan-
10
Feb-
10
Mar
-10
Apr
-10
May
-10
Jun-
10
Jul-1
0
Aug
-10
Sep-
10
Oct
-10
%

2 │ The demand for debt advice services
London Economics
Debt Advice in the UK 5
Figure 3: Monthly calls to free-to-client debt advice provider
Source: NDL client data 2003-11
2.1.4 Debt advice providers used by debt advice seekers
The 2011 Gathergood study for the Money Advice Trust (MAT) estimates that of all debt advice seekers, 55% sought free advice and 16% went to fee-charging companies13. The remainder of those who sought debt advice did so via professionals (accountants, banks and financial advisers).
The BIS/YouGov survey provides a slightly different picture (see Table 1). However, as multiple responses are possible in the BIS/YouGov survey, as a number of debt advice seekers contact more than one debt advice provider, the figures overleaf do not provide precise market shares of the different debt service providers. In the 2009-2010 BIS/YouGov survey, the total number of advices sought by households is 44% higher than the number of households indicating that they had sought debt advice (see data in Table 28).
For example, of the 33 respondents having indicated that they sought debt advice from the Money Advice Service, 5 also sought advice from the National Debtline,3 from Citizens Advice, 2 from the Insolvency Service, 3 from the Consumer Credit Counselling Service, 4 from mortgage providers, 4 from PayPlan, 3 from other creditors, 6 from their bank, and 1 from another advice centre.
Overall, on average, a survey respondent reporting having sought debt advice in the BIS/YouGov 2009-2010 survey did so from 1.4 advice providers (Table 2).
13Gathergood (2011), ‘Demand, capacity and need for debt advice in the UK’
0
5,000
10,000
15,000
20,000
25,000
30,000
35,000
40,000
45,000
Jan Feb Mar Apr May Jun Jul Aug Sep Oct Nov Dec
Nu
mb
er
of c
alls
to
Nat
ion
al D
eb
tlin
e
2010
2009
2007

2 │ The demand for debt advice services
6
London Economics
Debt Advice in the UK
Table 1: Agencies contacted for debt advice
Agency Percentage of all households seeking professional advice on debt (%)
2008-09 survey 2009-2010 survey
Citizen’s Advice Bureau (CAB) 29 31
Consumer Credit Counselling Service (CCCS)
21 24
National Debtline (NDL) 14 12
Money Advice Service (MAS) 12 8
Professional adviser (accountant, lawyer, bank)
10 19
Payplan 9
Insolvency Service 4 6
Other advice centre 8 7
Other 19 Source: London Economics analysis of BIS/YouGov surveys

2 │ The demand for debt advice services
London Economics
Debt Advice in the UK 7
Table 2: Number of housheolds having sought debt advice from more than one service provider and total number of households having sought advice from service provider
Money Advice Service
National Debtline
Professional insolvency
practitioners (e.g.
Accountants or lawyers)
Citizens Advice Bureau
Insolvency Service
Consumer Credit
Counselling Service
Mortgage provider
Payplan Other
creditors Bank
Other advice centre
Other
Total number
of households having
sought advice
from debt advice
provider Money Advice Service -- 5 0 3 2 3 4 4 3 6 1 0 33
National Debtline -- 1 24 2 15 4 4 4 10 5 0 58
Professional insolvency practitioners (e.g. Accountants or lawyers)
-- 4 5 3 1 0 1 2 0 0 18
Citizens Advice Bureau -- 8 20 8 12 7 16 4 7 140
Insolvency Service -- 6 1 3 3 3 0 2 25
Consumer Credit Counselling Service
-- 5 10 5 15 2 3 111
Mortgage provider -- 3 2 9 2 0 26
Payplan -- 4 7 2 0 42
Other creditors -- 9 1 0 19
My bank -- 9 0 72
Other advice centre --0 2 26
Other -- 38
Don’t know 4
Prefer not to answer 20
Total 632
For memo: number of households having indicated that they sought debt advice 439
Source: London Economics analysis of BIS/YouGov 2009-2010 Debt Tracker survey

2 │ The demand for debt advice services
8
London Economics
Debt Advice in the UK
2.1.5 Why is debt advice sought?
Many different causes may result in over-indebtedness and a need for debt advice. These causes are discussed in the next section. At this stage, however, it is useful to note that an important issue stakeholders mentioned was that there is a high proportion of debt advice demand that can be classified as “failure demand”, meaning users demand debt advice as a result of failings elsewhere. For example, a study of advice providers for AdviceUK found that a high proportion of enquiries addressed to advice providers related to service failings on the part of the authorities or an institution. According to the study “the vast majority were caused by the failings of public services, particularly the Department for Work and Pensions (DWP). In one advice agency that serves mainly social housing clients fully 95% of all failure demand observed in the study was caused by the DWP.” The same study also found that, “overall, a very high proportion of presented demand (50-60%) was from users with some form of debt problem(s). Of these, 30-40% had problems with welfare benefit claims. Advice services commonly took up these benefit problems with the DWP, Her Majesty’s Revenue and Customs (HMRC) or local Housing Benefit (HB) offices and in 90% of cases in the study ‘won’ the case on procedural grounds”.14
2.2 Causes of debt
The reasons why people experience problems with debt are complex15; often it is not a single issue that leads to debt problems but a variety of factors that contribute to clients' situations16. Vulnerability is an issue to be considered, however it is not a cause per se. All the causes of over-indebtedness cited in the literature can be grouped into three categories.
Persistent low-income17. Those who live on low income often find themselves in debt18 simply because living at such a low-level of income is unsustainable.
Negative shocks. This could be due to several ‘significant life events’19 such as job loss or redundancy, relationship breakdown, bereavement and illness/disability all of which result in a sudden lower level of income and/or increased expenditure20. An unanticipated increase in expenditure can be due to other factors, e.g. new kitchen appliance, newborn baby, etc. However, Kempson (2002) found that job loss was the largest factor contributing to debt problems21.
14 AdviceUK, It’s the System Stupid! Radically Rethinking Advice (2008) 15 CAS (2009), ‘Drowning in Debt’ 16 Social Market Research (2010), ‘Research on Helping Customers to Avoid/Manage Debt’ 17 Directorate-General for Employment, Social Affairs and Equal Opportunities Unit (2008), ‘Towards a common operational European
definition of overindebtedness’ 18 Deputy Minister for Social Justice and Regeneration (2005), ‘Deputy Minister’s Review of Over-indebtedness in Wales’ 19 Kober, Claire (2005), ‘In the Balance: Disabled people's experiences of debt’ 20 Williams (2007), Ministry of Justice Research unit, ‘Twelve months later: does advice help? The impact of debt advice – advice agency
clients study’; Turley and White (2007), ‘Assessing the Impact of Advice for People with Debt Problems’ 21 Kempson (2002), Over indebtedness in Britain: A report to the Department of Trade and Industry’

2 │ The demand for debt advice services
London Economics
Debt Advice in the UK 9
Poor money management/lack of financial understanding/over-commitment of credit – some debt advice seekers cited the ‘build up of credit over time’ as a cause of debt22, others lacked the skills to manage their money or were financially excluded.
In terms of the relative importance of these various factors, a recent study on over-indebtedness in Wales23 reports that the most common ‘triggers’ cited by those in arrears and/or financial difficulties in Wales were:
Loss of income - due to redundancy, relationship breakdown, illness, or other loss of income (33%);
Living on a low income (20%);
Increased/unexpected expenses (9%);
Over-commitment (5%).
The same report also cites the findings from a Citizens Advice national survey of debt clients. The survey asked people to list up to three reasons why they believed they had got into debt problems. The most commonly quoted were:
Loss of income – due to job loss, illness, relationship breakdown or other drop in income (43%);
Over-commitment (17%);
Living on a low income (13%);
Major necessary expenses/unexpected expenses – e.g. death in family (8%).
Of particular interest is that in both the Welsh survey and the Citizen Advice survey, over-commitment is not perceived by survey respondents to be the main direct cause of their debt problems. Obviously, high levels of debt make individuals and households more vulnerable to shocks to their income or expenses.
Kempson, McKay and Willitts (2004) found that a small proportion of people were left debts by their former partner24. More recently, the CAB noted that 63% of their clients gave a reason for their debt that related to the recession.25 However, this may be overstated as a result of client’s perceptions and the ‘self-fulfilling prophecy’ associated with recessions.
2.3 The characteristics of debt advice users
This section provides information on the demographic and socio-economic characteristics of debt advice users. It focuses on the followings characteristics:
Age
Gender
22 Day, Collard and Hay (2008), ‘Money Advice Outreach Evaluation: Qualitative Outcomes for Clients’ 23 Deputy Minister's Review of Over-indebtedness in Wales (2005) 24 Kempson, McKay and Willitts (2004), ‘Characteristics of families in debt and the nature of indebtedness’ 25 CAB (2008), ‘With a little help from my friends’
2 │ The demand for debt advice services
10
London Economics
Debt Advice in the UK
Income and Socio-economic Group
Ethnicity
Economic status
Region e.g. England/Scotland/Wales/N.I., regions within England
Urban/rural
Residency (tenant, owns etc)
Personal situation (married, single, children etc)
Education
Financial exclusion
Mental ill health
Disability
Prisoners/Ex-prisoners
The section provides a picture of those who firstly, are in debt, and secondly, have sought advice.
2.3.1 Age
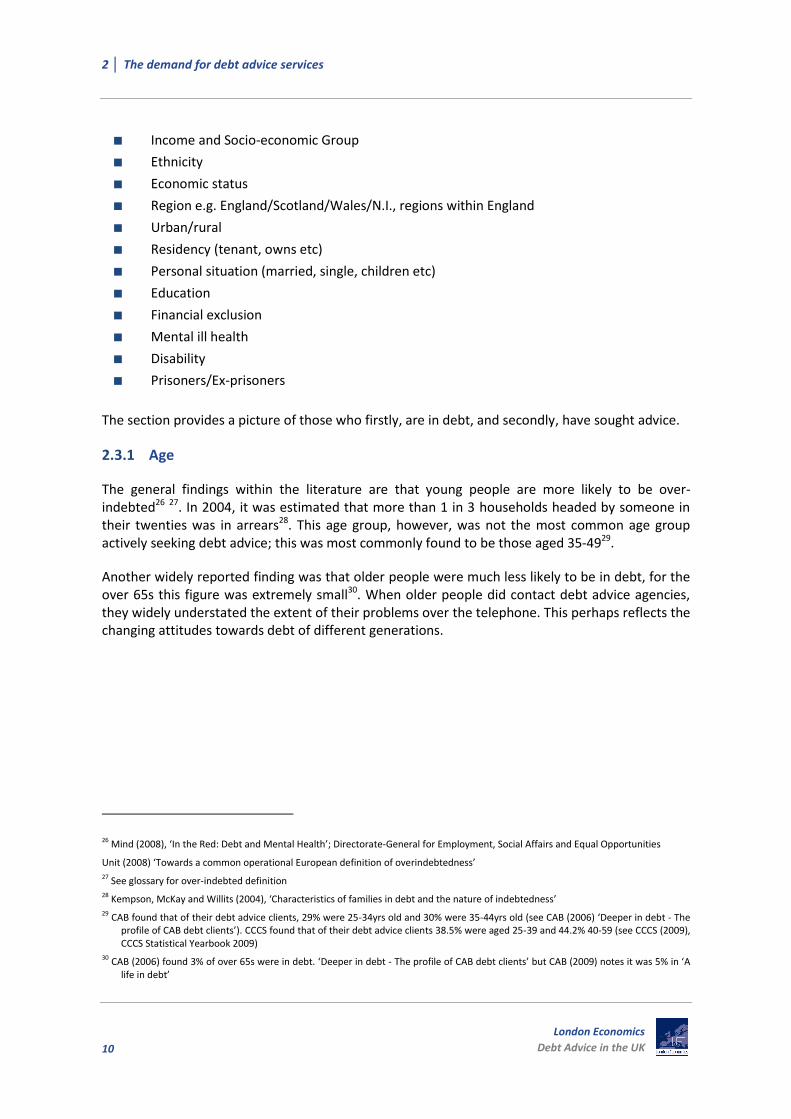
The general findings within the literature are that young people are more likely to be over-indebted26 27. In 2004, it was estimated that more than 1 in 3 households headed by someone in their twenties was in arrears28. This age group, however, was not the most common age group actively seeking debt advice; this was most commonly found to be those aged 35-4929.
Another widely reported finding was that older people were much less likely to be in debt, for the over 65s this figure was extremely small30. When older people did contact debt advice agencies, they widely understated the extent of their problems over the telephone. This perhaps reflects the changing attitudes towards debt of different generations.
26 Mind (2008), ‘In the Red: Debt and Mental Health’; Directorate-General for Employment, Social Affairs and Equal Opportunities
Unit (2008) ‘Towards a common operational European definition of overindebtedness’ 27 See glossary for over-indebted definition 28 Kempson, McKay and Willits (2004), ‘Characteristics of families in debt and the nature of indebtedness’ 29 CAB found that of their debt advice clients, 29% were 25-34yrs old and 30% were 35-44yrs old (see CAB (2006) ‘Deeper in debt - The
profile of CAB debt clients’). CCCS found that of their debt advice clients 38.5% were aged 25-39 and 44.2% 40-59 (see CCCS (2009), CCCS Statistical Yearbook 2009)
30 CAB (2006) found 3% of over 65s were in debt. ‘Deeper in debt - The profile of CAB debt clients’ but CAB (2009) notes it was 5% in ‘A life in debt’

2 │ The demand for debt advice services
London Economics
Debt Advice in the UK 11
Source: CAB (2009) ‘A Life in Debt’ (Debt Advice Clients) and Tudela and Young (2003), ‘The distribution of unsecured debt in the United Kingdom: survey evidence’ for those in positive debt
Figure 4 shows how the percentage of debt advice clients in each age group rises with age peaking at the age group 35-44 and decreasing with age after this point.
Interestingly, it can be also be observed from Figure 4 that younger people were more likely to be over-indebted yet were less likely to seek debt advice – this could mean there is a high latent demand for debt advice amongst young people.
In contrast, Gall (2009) looked at mortgage arrears specifically and, for this type of debt, young people were found to be much more likely to seek advice, although it was noted that, as first-time buyers are generally younger, this partly explains the difference to the general observed pattern.31
CCCS (a free-to-client debt advice provider) found that their client’s average age is increasing each year and that in 2010 the average age of their users was 42.32This was also the average age reported by another fee-charging debt advice provider, contacted as part of our research.
31 Gall (2009), ‘Understanding mortgage arrears’ 32 CCCS (2010), ‘CCCS Statistical Yearbook 2010’
Figure 4: CAB Debt Advice Clients by Age (2009)
0
5
10
15
20
25
30
35
16-24 25-34 35-44 45-54 55-64 65+
Pe
rce
nta
ge %
Age
Debt advice clients Those in positive debt

2 │ The demand for debt advice services
12
London Economics
Debt Advice in the UK
Figure 5: Percentage point difference between age groups of population and those who sought advice (CAB)
Note: The statistics for the whole population were 0-14 and for CAB clients this was 0-16 so some of the percentage difference here is due to the different measures that are used. Source: (whole population) - Eurostat - Population on 1 January: Structure indicators (demo_pjanind) accessed 16.08.11 and CAB profile of debt clients
Figure 5 shows vividly that young people (in this case we are referring to the 17-24 age group) are less likely to seek debt advice. This is in spite of the fact that this group is more over-indebted than the population as a whole. For the age group 0-16 years old one would expect to observe the documented under-representation as this group are unlikely to secure credit and are therefore very unlikely to have debts. As a result this group of individuals will be less likely to require debt advice. However, CAB did report that 0.1% of their clients was under the age of 16.
The two age groups 25-34 and 35-49 were over-represented; meaning a much higher proportion of this group sought advice than are observed in the general population. This is consistent with findings from the literature.
CAS (2011) found that age affected the type of debt that people were most likely to have. For example, credit card debt had a higher prevalence in the 35-44 age group than for any other age
- 18
- 13
- 8
- 3
2
7
12
17
0 – 16 17 – 24 25 – 34 35 – 49 50 – 64 65 – 74 75 – 84 85 +

2 │ The demand for debt advice services
London Economics
Debt Advice in the UK 13
group and telephone bill debt was clearly a problem for young people, with those aged 16-24 being twice as likely to seek advice on this issue compared to those in the 35-44 group.33
2.3.2 Gender
Findings concerning the gender of debt advice users were divided; some of the literature found that debt advice clients were evenly split between males and females34. A similar volume of literature found that slightly more females sought advice – although this was usually only by a few percentage points35.
Curiously, Patel et al (2010) found that a larger proportion of men had debt problems36; one possible explanation for this is that males were found to be less likely to seek advice and more likely to take the ‘ostrich’ approach37.
On average, the debts owned by males were greater than those of females and they were more likely to go bankrupt, even though the number of female bankrupts has been increasing in recent years38.
A report by Citizens Advice Scotland (CAS) noted that women’s average debts were much less than men’s average debts, £14,752 compared with £25,77239. Evans, McAteer and Gavurin (2011) generally reached the same conclusion although they found that women’s credit card debts were higher than men’s. They provided a possible explanation as to why men’s debts are larger arguing that men typically are the ‘bread-winners’ and therefore may be more likely to put the debt in their name.40
2.3.3 Income and Socio-economic group
The literature provides a clear picture of debt advice users in terms of their income, namely the majority of debt advice seekers are on very low incomes, mostly an income of less than half the UK national average41. Many of these households were under the poverty line and in a cycle of debt due to their persistent low income.
33 CAS (2011), ‘Debt Advice in Scotland - The role of the Scottish CAB Service in the debt advice landscape’ 34 Found to be 50:50 by KPMG (2010), ‘Research Project to examine Future Debt Advice Provision in Northern Ireland’; Moorhead and
Robinson and Matrix Research Consultancy (2006), ‘A trouble shared legal problems clusters in solicitors’ and advice agencies’ 35 Williams (2007), ‘Twelve months later: does advice help? The impact of debt advice – advice agency clients study’; Opinion Leader
(2008), ‘Evaluation of the Financial Inclusion Fund Face-to-Face Debt Advice Project Final Report for Stage 2 of the Evaluation’ 36 Balmer, Patel Denvil and Pleasence (2010), ‘Unmanageable Debt and Financial Difficulty in the English and Welsh Civil and Social
Justice Surevy: report for the Money Advice Trust’ 37 Turley and White (2007), ‘Assessing the Impact of Advice for People with Debt Problems’ 38 Insolvency service(Year not available), ‘Characteristics of a Bankrupt’ 39 Citizens Advice Scotland (2009), ‘Drowning in Debt’ 40 Evans, McAteer and Gavurin (2011), ‘Report 1: Debt and Household Incomes’ 41 CAB (2006), ’Deeper in debt - The profile of CAB debt clients’; Pleasence, Buck, Balmer and Williams (2007), ‘A Helping Hand: The
Impact of Debt Advice on People’s Lives’

2 │ The demand for debt advice services
14
London Economics
Debt Advice in the UK
Those on low income are also the most likely to consider their debt ‘a heavy burden’.42. This latter finding is also supported by looking at the socio-economic groups of those in debt43. If ‘over-indebted’ is defined as repayments of 25% or more of income, people in higher socio-economic groups are more likely to be over-indebted. However, when over-indebted is defined as repayments of 50% of income or more, those in the lower socio-economic groups are more over-indebted44.
Debt advice seekers that contacted CABs were mostly from low to middle income households45, Citizens Advice Scotland reported that their clients exhibit lower income compared with the Scottish average46. Moreover, a high-proportion of households with low-income receive their income entirely via some form of benefits and/or tax credits47.
However, not all debt advice clients have low income; households with unsecured debts generally have higher incomes48. High-income households also tend to have a larger amount of debt49, perhaps due to a greater access to credit.
The finding regarding the link between income and over-indebtedness impacts on the link between an individual’s socio-economic status and over-indebtedness as, in general, higher income is associated with a higher socio-economic group. Furthermore, those in the lowest socio-economic groups (C2, D and E) 50 had much less financial understanding than those in higher groups (A, B and C), with 70% of those from the lower groups not knowing what APR (Annual Percentage Rate) stands for, compared with 50% for higher groups51.
A suggestion was made by one debt advice provider in the Camden borough that lower and higher earners have different advice needs and that they require different delivery channels. Poorer households require significant “hand-holding” through face-to-face advice provision while higher income households prefer to rely on self-help in dealing with their debt problems. We note this point here as the borough of Camden has been identified as a ‘borough of contrasts’ as it contains some of the most and least deprived households in the country – often living in close proximity52.
42 Betti et al. (2001), ‘Study of the problem of Consumer Indebtedness: Statistical Aspects’ 43 Tudela and Young (2003), ‘The distribution of unsecured debt in the United Kingdom: survey evidence’ 44Woods (2006), ‘Personal over-indebtedness in Northern Ireland’ 45 BMRB International Limited (2004), ‘Widening the scope? FSA and CAB research into delivering financial advice through the CAB’ 46 Citizens Advice Scotland (2009), ‘Drowning in Debt’ 47 CAB (2009), ‘A Life in Debt’ 48 Mitchell, Mouratidis and Weale (2005), ‘Poverty and Debt’; Del Rio and Young (2005), ‘The impact of unsecured debt on financial
distress among British households’ 49 May, Tudela and Young (2004), ‘British household indebtedness and financial stress: a household-level picture’ 50 See glossary for socio-economic group definitions 51 Deputy Minister for Social Justice and Regeneration (2005), ‘Deputy Minister’s Review of Over-indebtedness in Wales’ 52 Camden Council – Background stats

2 │ The demand for debt advice services
London Economics
Debt Advice in the UK 15
Figure 6: Debt Advice Clients by Income Groups (NDL)
Note: [N.B Figure 6 excludes the categories ‘don’t know’ and ‘refused’ which were 8% and 10% respectively]. Source: Gardner and Wells (Year not available), Evaluation of Money Advice Debtline pilot and business case for development of ‘National Debtline’
Figure 6 shows that less of those on low incomes and higher numbers of those on middle incomes sought debt advice.
Interestingly, the percentage of those who sought debt advice falls as income groups rise above £10-15k, however the figure increases again for the £50k+ group meaning more of this group sought debt advice – whether this means a higher proportion of this group are in debt or if they sought advice more often cannot be inferred directly from this data.
2.3.4 Ethnicity
With regards to the ethnicity of debt advice clients, although some of the literature indicates that the proportion of those in debt from black and minority ethnic groups (BME) backgrounds were similar to that of the UK population, the more common finding is that those from BME backgrounds are over-represented.
0
2
4
6
8
10
12
14
16
18
<£5k £5-10k £10-15k £15-20k £20-25k £25-30k £30-40k £40-50k £50k+
Per
cen
tage
%
Income

2 │ The demand for debt advice services
16
London Economics
Debt Advice in the UK
For example, one study found that 12% of CAB clients were from BME backgrounds53, another study found that this figure was 14.2%54. For the UK population as a whole, the percentage of individuals from BME backgrounds is just 8% (according to 2001 census55). Figure 7 shows this over-representation graphically.
Figure 7: Percentage of BME group seeking debt advice
Source: Harrison and Woolley (2004), ‘Debt and Disability - The impact of debt on families with disabled children’
MacFarlane (2011) noted that people from BME backgrounds may have additional needs when they seek advice; it was suggested that “as people from BME[R] groups become frailer and less mentally able, they may revert back to their mother tongue and need to communicate with someone who can understand them”.56 Furthermore, another report by Dayson (2004) identified that there may be cultural, ethnicity or faith based barriers to seeking debt advice57.
Figure 8 provides a fuller picture of the differences between the demographics of the entire population and of those who seek advice.
53 CAB (2009), ‘A Life in Debt’ 54 Harrison and Woolley (2004), ‘Debt and Disability - The impact of debt on families with disabled children’ 55 As cited by article in footnote 23 56 MacFarlane (2011), ‘Corporate review of advice services’ 57 Dayson (2004), ‘Financial exclusion: its impact on individuals, disadvantaged communities and the city economy’
0
2
4
6
8
10
12
14
16
BME in population BME who sought debt advice
%

2 │ The demand for debt advice services
London Economics
Debt Advice in the UK 17
Figure 8: Percentage point difference between CAB clients and whole population - Ethnicity
Source: Demographics of population obtained from ONS, ‘Census 2001 National report for England and Wales part’ and CAB profile of debt clients
The most marked differences were that white people were under-represented among the group of those who sought advice, and Black/British were over-represented.
One report found that Black, Pakistani and Bangladeshi communities have been shown to experience significantly higher levels of financial exclusion than the general population – this could partly explain why they are more likely to be over-indebted58.
2.3.5 Economic status
The majority of the literature found that, mostly, debt advice clients were not in employment. How this was defined varied in the literature (including unemployed, stay at home, other not working) and the estimates put the figure of clients not in employment between 61%59 and 67%60.
58 Buck, Tam and Fisher (2007), ‘Putting Money Advice Where the Need is: Evaluating the Potential for Advice Provision in Different Outreach Locations’
59 Evans and McAteer (2011), ‘State of Play Report: A Business Case – Financial Impact of Debt Advice for Social Landlords’ 60 Williams (2007), ‘Twelve months later: does advice help?’
-5
-4
-3
-2
-1
0
1
2
3
4
5
White Mixed Asian Black/Black British Chinese/Other ethnic group

2 │ The demand for debt advice services
18
London Economics
Debt Advice in the UK
Balmer et al (2005) found that that those who were in not employment were particularly vulnerable to debt, and were twice as likely to be in arrears compared with those who are employed61.
However, National Debtline reported that half of their clients were in full time employment62, this could be due to the sample used or their client base could be different from debt advice clients as a whole. People who sought advice from CAB tended to be unemployed63. Dayson and Vik (2011) reported that clients of fee-charging debt management firms were much more likely to be employed and have higher incomes than those who seek advice from the free-to-client sector64.
2.3.6 Region
When looking at the regions in which the debt advice clients live, there is some evidence that some regions have higher levels of personal indebtedness when compared to the UK as a whole. For the UK as a whole, it was found that 6% of adults had been in arrears in the past twelve months65. However, in three regions (London, Yorkshire and the Humber and North-East), this figure was much higher at 17%66. Another report found that relative to population, Yorkshire tied with London as the region most in need of debt advice with 24/10,000 people receiving counselling.67 Londoners were found to be particularly exposed to debt problems because of high living costs and property prices68.
A broader observation was that Welsh households were more likely to have active credit commitments than the British average, by 10 percentage points69.
One particular finding seems counter-intuitive; for families with children, those in the South-East were most likely to be in arrears, with those in the North-East being the least likely70. A possible explanation for this mentioned within the source is a possible lower take-up level of financial products in the North-East region.
61 Balmer, Pleasence, Buck and Walker (2005), ‘Worried Sick: The Experience of Debt Problems and their Relationship with Health, Illness and Disability’
62 Illuminas (2008), ‘National Debtline: Evaluation of performance presentation’. [N.B in NDL’s report it said it was not possible to verify if their sample was representative of their debt advice clients as a whole].
63 Fearnley (2007), ‘Gauging Demand for free-to-client money advice’ 64 Dayson and Vik (2011), ‘Evolution of Financial Inclusion in Leeds since 2004’ 65 Directorate-General for Employment, Social Affairs and Equal Opportunities Unit (2008), ‘Towards a common operational European
Definition of overindebtedness’ 66 Kempson, (2004), ‘Over indebtedness in Britain: A report to the Department of Trade and Industry’ 67 CCCS (2010), ‘CCCS Statistical Yearbook 2010’ 68 London Health Forum, ‘London : capital of debt - Reducing the health consequences of debt’ 69 Deputy Minister for Social Justice and Regeneration (2005), ‘Deputy Minister’s Review of Over-indebtedness in Wales’ 70Kempson, McKay and Willits (2004) ‘Characteristics of families in debt and the nature of indebtedness’

2 │ The demand for debt advice services
London Economics
Debt Advice in the UK 19
The socio-economic characteristics of those who went bankrupt in London were different when compared to those for the rest of the UK; there was a higher proportion of male bankrupts and a lower proportion of young bankrupts71.
2.3.7 Urban/Rural
The prevalence of debt problems amongst people living in rural and urban areas was mostly comparable, although it was reported that those living in rural areas had a higher level of debt to income ratio72.
Somewhat curiously, those living closest to a debt advice provider (less than 2 miles) were the most likely to deal with their debt problem on their own73. For Northern Ireland, it was found that those living in Belfast were the most likely to be over-indebted74.
CAS (2011) found that location affected what types of debt people were more likely to have. For example, Scottish CABs in urban areas (25%) and islands (25%) settings were more likely to provide advice on credit card debt than city CABs, and CAB in island settings were more like to provide advice on catalogue and telephone debt than in the rest of Scotland75.
2.3.8 Residency
An overwhelming finding in the literature was that a significantly large proportion of debt advice clients rented their homes as opposed to owning them (outright or with a mortgage). Although estimates varied, the figure put the proportion of debt advice clients who rent their homes at approximately 60-70%76. Considering that nationally 70% of UK households own their home77, this is clearly a significant result. However, it should be noted that these percentages refer to 2003 and that, following the substantial expansion of mortgage credit from 2000 to 2008, the situation may be different now.
It is noted that those who rented their homes were more likely to visit a CAB for advice than homeowners, and the Consumer Credit Counselling Service (CCCS), a charity providing free debt advice, report a higher proportion of homeowners (49%)78 compared with other debt advice providers.
Income could be an explanatory factor here, in that those who rent possibly do so because they cannot afford to buy, because they are on low income, and it could be this low income which results in more over-indebted households. Furthermore, a high proportion of those renting did so
71 Insolvency Service (Year not available), ‘Characteristics of a Bankrupt’ 72 CAB (2003), ‘In too Deep’ 73 Balmer and Patel (2009),’ The experience of Money and Debt Problems in Rural Areas’ 74 Woods (2006), ‘Personal over-indebtedness in Northern Ireland’ 75 CAS (2011), ‘Debt Advice in Scotland - The role of the Scottish CAB Service in the debt advice landscape’ 76 Edwards (2003) says 60% renting, ‘In too deep, CAB clients' experience of debt; Williams (2007) 72% rent, ‘Twelve months later: does
advice help?’ 77 Edwards (2003), ‘In too deep, CAB clients' experience of debt’ 78 CCCS (2009), ‘CCCS Statistical Yearbook 2009’

2 │ The demand for debt advice services
20
London Economics
Debt Advice in the UK
through a social landlord, and one study found that of the poorest 10% of the population, over half live in social rented housing79. A report by CAS found that clients who rent their homes were more likely than owner occupiers to say that low income was the reason for their financial difficulties80.
An interesting finding from a fee-charging debt advice provider was that their clients were significantly more likely to live in military accommodation than the general population81, this is a pattern not discussed in the literature.
2.3.9 Personal Situation
When looking at debt advice clients’ personal situations (e.g. single/married/divorced and with/without children), there are several groups that are identified as being more likely to have debt problems.
The first of these is lone parent families. It is widely acknowledged that lone parents are much more likely to suffer with debt problems. One report by CAB found that 16% of their respondents were lone parents (the national average is just 7%)82. However, it was found that lone parents were much more likely to use CAB as opposed to other sources of debt advice83, so this may partly explain this over-representation. A further observation is that lone parents were likely to remain in arrears for a longer period of time than cohabiting households. CAS (2011) found that living on your own, with or without children, appears to be a risk factor for debt84.
Divorced individuals were also more likely to be in arrears with 26% of people seeking debt advice being divorced (this is much higher than the national average of 7%)85.
Another factor which greatly influences a household’s likeliness of being in debt is children. Households with children are much more likely to be in debt, and the level of their debt is often much larger than households where there were no children86. Some groups such as couples without children were less likely to use CAB than say, lone parents (as discussed above).
2.3.10 Education and financial literacy
Findings from the literature are that well educated people are less likely to be in debt87. Generally, those with low education are over-represented, Williams (2007) note that respondents tend to
79 79 Evans and McAteer (2011), ‘State of Play Report: A Business Case – Financial Impact of Debt Advice for Social Landlords’ 80 Citizens Advice Scotland (2009), ‘Drowning in Debt’ 81 Conversation with Matthew (CEO Harrington Brooks) 82 CAB (2007), ‘Set up to fail’ 83 Fearnley (2007), ‘Gauging Demand for free-to-client money advice’ 84 CAS (2011), ‘Debt Advice in Scotland - The role of the Scottish CAB Service in the debt advice landscape’ 85 Williams (2007), ‘Twelve months later: does advice help? The impact of debt advice – advice agency clients study’ 86 Evans, McAteer and Gavurin (2011), ‘Report 1: Debt and Household Incomes’ 87 Disney, Bridges and Gathergood (2008), ‘Drivers of over indebtedness’

2 │ The demand for debt advice services
London Economics
Debt Advice in the UK 21
exhibit low levels of educational attainment88 and another source reported low levels of literacy and numeracy amongst debt advice clients89.
There could be high latent demand by those with low educational attainment as low levels of literacy and numeracy were found to be a barrier to seeking advice90.
An interesting finding is that those who read mid-market tabloid newspapers were more likely to contact fee-charging debt management companies; whereas broadsheet readers usually contacted creditors themselves91, this perhaps demonstrates how certain factors can affect how the over-indebted deal with their problem.
A worrying finding concerning education and its relevance to debt was that 12% of people were not able to do a basic calculation and work out what option is best (£10 or 10% off a £300 TV)92. Another report found that only 4 in 10 people knew what APR stands for93. A lack of financial understanding means that people unnecessarily become over-indebted and are perhaps more prone to being exploited by ‘loan sharks’ and the like.
2.3.11 Financial Exclusion
Financial exclusion is widely discussed in the literature. Several characteristics are identified in one report as being indicators that an individual is financially excluded. These are: no bank account, user of high interest credit, no savings, income less than £14,500 and owing priority debts94. An estimated 1.1 million adults in the UK do not have access to a bank account95.
CAB reports that 96% of their clients have no savings, 51% used high interest credit, 56% have income below £14,500 and that 46% owe priority debts. Clearly this indicates a high level of financial exclusion amongst their client base.96 With regards to savings, it was observed by Goode and Waring (2011) that even a low-level of savings acts as a ‘buffer’ against unexpected shocks97.
Financially excluded individuals are vulnerable individuals and as such, this group has been specifically targeted with regards to debt advice. The government’s Financial Inclusion Fund (FIF) was used specifically to provide face-to-face advice to financially excluded individuals.
88 Williams (2007), Ministry of Justice Research unit, ‘Twelve months later: does advice help? The impact of debt advice – advice agency clients study’
89 Day, Collard and Hay (2008), ‘Money Advice Outreach Evaluation: Qualitative Outcomes for Clients’ 90 Deputy Minister for Social Justice and Regeneration (2005), ‘Deputy Minister’s Review of Over-indebtedness in Wales’ 91 Mintel (2010), ‘Debt Management, Financial Intelligence’ 92 Blake and de Jong (2008), ‘Short Changed - Financial Exclusion: A guide for donors and funders’ 93 Woods (2006), ‘Personal over-indebtedness in Northern Ireland’ 94 Opinion Leader (2007), ‘Evaluation of the Financial Inclusion Fund Face-to-Face Debt Advice Project Final report for stage one of the
evaluation’ 95 Ellison, Whyley and Forster (2010), Realising banking inclusion: The achievements and challenges, A report to the Financial Inclusion
Taskforce 96 CAB (2010), ‘Face-to-face debt advice – at the heart of local community support services 97 Goode and Waring (2011), ‘Seeking direction: Men, money advice and the road to financial health’

2 │ The demand for debt advice services
22
London Economics
Debt Advice in the UK
2.3.12 Mental Health
There is evidence of a strong yet complicated relationship between debt and mental health as the literature finds that mental health is both a cause and effect of having debt problems.
Those with mental health problems are much more likely to experience problems with debt. 23.8% of mental health sufferers have debt problems; the figure for those without a mental health disorder was just 8.1%98. Of those with debt problems, 1 in 2 also suffers with mental health problems99.
Although a debt advice client discloses a mental health problem the equivalent of every 30 seconds, 33% of collections staff ‘never’ or ‘rarely’ ask basic questions about the mental health problem100, which indicates that debt advice clients with mental health problems are not receiving additional support which they perhaps require in order to deal with their debt problems effectively.
2.3.13 Disability
There is evidence in the literature that a high proportion of debt advice clients are disabled. Estimates of the proportion of debt advice clients who were disabled range from 23%101 to 46%102. In the UK population 17% are disabled103, therefore this over-representation is significant. A report by Citizens Advice Scotland (CAS) reported that 3 in 5 of CAB client households have at least one person with a health or disability issue104.
The very nature of disabled or long-term sick means they often cannot work and thus have low income, therefore this group of people are vulnerable with regards to becoming over-indebted and likely to require debt advice. One report by Balmer et al. (2005) notes that those with a disability are much more likely to suffer from long-term debt rather than short-term debt problems105.
2.3.14 Prisoners
A few studies looked at debt advice given to prisoners and ex-prisoners. This group of people are particularly vulnerable as currently there is no legislation which freezes interest on debts whilst the debtor is in prison and so debt problems can worsen whilst in prison.
98 Jenkins et al (2008), ‘Debt income and mental disorder in the general population’ 99 Jenkins, Fitch, Hurlston and Walker (2009), ‘Recession, Debt and Mental Health’ 100
Royal College of Psychiatrists and Money Advice Trust (2010), ‘Debt collection and mental health : ten steps to improve recovery’
101 CAB (2006), ‘Deeper in debt’ 102 Pleasence, Buck, Balmer and Williams (2007), ‘A Helping Hand: The Impact of Debt Advice on People’s Lives’ 103 2001 Census. Pleasence, Buck, Balmer and Williams (2007), ‘A Helping Hand: The Impact of Debt Advice on People’s Lives’ cited this 104 CAS (2009), ‘Drowning in Debt’ 105 Balmer, Pleasence, Buck and Walker (2005), ‘Worried Sick: The Experience of Debt Problems and their Relationship with Health,
Illness and Disability’

2 │ The demand for debt advice services
London Economics
Debt Advice in the UK 23
Bath and Edgar (2010) found that prisoners typically have low incomes (50% had household income below £10,000 prior to imprisonment) and are more likely to be unemployed (40% were unemployed before imprisonment).106 This links to our previous discussion that unemployed are vulnerable to debt, compared to those in full-time employment (footnote 61).
Prisoners were also found to have high incidence of mental health problems. Bath and Edgar also found that the majority of prisoners have at least one mental health problem107, a further factor typically associate with over-indebtedness.
Prisoners were also found to have high levels of financial exclusion108, and they also face further barriers to seeking advice than other debt advice clients; as they are in custody they cannot easily contact debt advice providers unless the debt advice providers come to them.
A CAB report found that debt problems were the second most common enquiry from prisoners, coming second only to benefits. The report also found that one fifth of prisoners had increased financial problems; with one third of these worsening whilst the person was in prison.109 Bath and Edgar, however, found a much larger percentage of prisoners and ex-prisoners said their debt problems had worsened whilst in prison (40% and 64% respectively)110.
Patel (2011) notes that the demand for debt advice exceeds supply for prisoners. This is an important issue to address as it was found that aged debt left untouched whilst the person was imprisoned significantly increased the propensity to re-offend111.
This is key as Bath and Edgar identified that reducing re-offending by investing in advice services for prisoners would cost a lot less than keeping them in prisons; debt advice would cost as little as £319 per prisoner per year, if a face-to-face advice service was rolled out for all prisoners, compare this with the £35,000 per year it would cost to keep them in prison if they return due to re-offending112.
2.4 Debt advice services sought by debt advice clients
Work undertaken in parallel to the present study by IFF Research shows that a wide range of debt service aspects are viewed as important or very important by respondents to a survey of over-indebted individuals/households (see figure below).
The most critical factor appears to be confidentiality with 74% of respondents listing this aspect as being very important and another 18% as important.
106 Bath and Edgar (2010), ‘Time is Money - financial responsibility after prison’ 107 Bath and Edgar (2010), ‘Time is Money - financial responsibility after prison’ 108 Day, Collard and Hay (2008), ‘Money Advice Outreach Evaluation: Qualitative Outcomes for Clients’ 109 Hopwood Road, Maynard and Sandbach (2007), ‘Locked out - CAB evidence on prisoners and ex-offenders’. 110 Bath and Edgar (2010), ‘Time is Money - financial responsibility after prison’ 111 Patel (2011), ‘A review of face to face debt advice in prisons’ 112 Bath and Edgar (2010), ‘Time is Money - financial responsibility after prison’

2 │ The demand for debt advice services
24
London Economics
Debt Advice in the UK
Next, the following three other aspects are judged to be very important by almost 2/3 of survey respondents:
The service offers expert financial support
The service does not judge
Someone knows and understands the individual’s financial situation
Figure 9: Importance of various aspects of debt service advice
Source: IFF (2011), ‘Debt advice in the UK’, presentation to Money Advice Service, October
Those respondents with serious debt problems (i.e. faced minor or severe creditor action) also indicated that they required considerable emotional support as part of the debt advice service (see figure below).
74%
63%
60%
59%
55%
54%
54%
50%
49%
44%
42%
35%
18%
27%
27%
31%
32%
35%
34%
38%
37%
42%
31%
37%
0% 10% 20% 30% 40% 50% 60% 70% 80% 90% 100%
Service is confidential
Service offers expert financial support
Service does not judge
Someone knows and understands the individual's financial situation
Detailed examination of finances as part of the service
Getting in touch with someone quickly
Dealing with the same person on each occasion
Follow-up support after initial contact
Regular updates/follow up support on repayments and creditor dealings
Demonstrating that the service has helped other people before
Service is anonymous
Regular follow-ups on emotional well-being
Very important Important

2 │ The demand for debt advice services
London Economics
Debt Advice in the UK 25
Figure 10: Average of percentage of respondents agreeing with 10 different statements expressing need for emotional support
Source: IFF (2011), ‘Debt advice in the UK’, presentation to Money Advice Service, October
Interestingly, in terms of channel of interaction with the debt advice provider, a majority selected the face-to-face channel over the telephone channel, e-mail, a web-base solution, post and printed material only when it came to disclosing financial information, working out the best solution and putting a solution in place.
For updates on progress, a majority of survey respondents selected the e-mail channel while for establishing the first contact with the debt advice provider and for any emotional follow-up, survey respondents indicated no clear preference between face-to-face, telephone and e-mail.
2.5 Customer journey
According to Parker (2009), the debt advice customer journey can be split into five stages113:
Experiences prior to seeking debt advice. Customers often tried to contact their creditors directly and went to their bank prior to contacting advice provider. Balmer et al (2010) found that 10% of those who sought advice had previously tried self-help, with 24% using the internet114.Another report shows that roughly half of those seeking advice had a ‘cluster’ of problems – not just problems with debt115. The range of problems faced by those seeking debt advice is illustrated in Figure 11. It shows that more than 1/3 of debt
113 Parker (2009), ‘National Debtline and Business Debtline Customer Journey Mapping’ 114 Balmer, Patel, Denvir and Pleasence (2010), ‘Unmanageable Debt and Financial Difficulty in the English and Welsh Civil & Social
Justice Survey: Report for the Money Advice Trust’ 115 Moorhead and Robinson and Matrix Research Consultancy (2006), ‘A trouble shared legal problems clusters in solicitors’ and advice
agencies’
8
20
34
43
56
0
10
20
30
40
50
60
Keeping up no problem
Keeping up a struggle Non-payment of bills Minor creditor action Severe creditor action
%

2 │ The demand for debt advice services
26
London Economics
Debt Advice in the UK
advice seekers have also problems with their social benefits (a point already noted earlier) and ¼ with their rent.
Figure 11: Percentage of individuals seeking debt advice who have other problems as well
Source: Moorhead et al. (2006)
Initial contact and receipt of advice. Wallis (2005) found that people tend to seek advice once they were at a ‘crisis point’116.
Acting on advice/self-help. Illuminas found that 71% of NDL clients’ contacted creditors directly themselves afterwards and of these 80% came to an agreement. Of those callers who didn’t contact creditors after NDL advice, half had already contacted them or had existing arrangements in place117. CCCS said that following advice, clients are offered self-help pack or opportunity to receive further counselling via telephone (90% choose latter)118.
Repeat contact (if any). Customers had repeat contact for several reasons, including: revising their budget, applying for DMP, reassurance (about bailiff/court action) and additional information. Williams (2007) found that 74% of debt advice clients received advice 1-3 times119.
Follow up referrals/signposting
116 Wallis (2005), ‘Advice and the best way of delivering it - Literature survey for the Financial Capability Generic Advice project’ 117 Illuminas (2010), ‘National Debtline - Performance Evaluation 2010’ 118 Michael Bell Associates (2001), ‘Facing up to debt: Housing debt advice & Counselling in Scotland’ 119 Williams (2007), Ministry of Justice Research unit, ‘Twelve months later: does advice help? The impact of debt advice – advice
agency clients study’
36
24
14
10 97 7 6 5
31 1 1
9
37
24
46 6
2 2 2 2 2 2
0
5
10
15
20
25
30
35
40
%
Interview data Observation data

2 │ The demand for debt advice services
London Economics
Debt Advice in the UK 27
Parker (2009)also found that, while the first port of call for most people was their bank, people did not view that this helped their circumstances or that they received help with their debt problems, and they were not signposted to a free debt advice agency.
3 │ Debt advice providers in the UK
28
London Economics
Debt Advice in the UK
3 Debt advice providers in the UK
This section focuses on the supply of debt advice by providers such as:
Friends and family
Citizens Advice Bureaux (CAB) – Centrally delivered/managed/funded
Citizens Advice Bureaux (CAB) locally delivered/managed/funded
National Debtline
Consumer Credit Counselling Service (CCCS)
Payplan
Financial services providers, e.g. banks, building societies, credit unions…
Housing Associations
Fee charging debt management companies
Others
Debt advice in general can be given formally or informally. The main focus of this report is on formal debt advice, but some points are also noted with regards to informal debt advice.
Figure 12 gives an overview of formal and informal debt advice and this serves as the basis of the discussion in the following sub-sections.

3 │ Debt advice providers in the UK
London Economics
Debt Advice in the UK 29
Figure 12: Informal and formal debt advice providers
Source: London Economics
3.1 Informal debt advice
Informal debt advice can be given by the following:
Family and friends
Professionals
Financial Professionals (e.g. accountant/solicitor)
Housing Associations
Others
Half of those with debt problems would go to family or friends for debt advice120. A much smaller proportion (roughly 4%) of those with debt problems also sought informal advice from accountants or solicitors121.
120 Mintel (2010), ‘Debt Management, Financial Intelligence’ found that 58% of people would turn to family/friends for advice; MIND (2008), ‘In the Red: Debt and Mental Health’ found this figure to be 46.8%
121 Kempson (2002), ‘Over indebtedness in Britain: A report to the Department of Trade and Industry’ and Virginia Wallis (2005), ‘Advice and the best way of delivering it - Literature survey for the Financial Capability Generic Advice project’ both found this figure to be 4%.
Professionals
Fee-charging debt advice providers
Signposting companies
Free-to-client debt advice
providers
Friends/Family
Formal Debt Advice
Informal Debt Advice
Financial
Housing Associations
Other

3 │ Debt advice providers in the UK
30
London Economics
Debt Advice in the UK
Whilst Housing Associations provided debt advice which was sometimes formal and other times informal, we discuss their role as part of our discussion of formal debt advice because the literature mainly considers formal advice with regards to housing associations. There are ‘Other’ sources that people could get informal advice from that are not explicitly mentioned here.
3.2 Formal debt advice
Formal debt advice providers in the UK can be split into two main sectors depending on the cost to service users:
Free-to-client Commercial (fee-charging) companies
A third type of firm has been identified and we have labelled these ‘sign-posting’ companies as they are commonly referred to as such in the literature. These companies do not explicitly provide debt advice but can send debt advice clients to specific debt advice providers in both the free-to-client and commercial sectors:
Money Advice Scotland
Money Extra
Others
We discuss both the free-to-client and commercial sectors in turn.
3.2.1 Free-to client sector
The free-to-client sector can be further broken down in terms of the type of the debt advice providers and how they are funded. We distinguish between the following debt advice providers:
Mainly funded by public bodies
Mainly funded by private sector
Housing associations
Other
Debt advice providers have been placed into these sub categories according to where the majority of their funding comes from. The ‘Other’ section comprises legal advice, financial institutions and debt advice providers where information about funding was not readily available and other sources that provide debt advice.

3 │ Debt advice providers in the UK
London Economics
Debt Advice in the UK 31
Note: The figure above is for illustration only. It does not provide an exhaustive picture of all free-to-client debt advice providers Source: London Economics
Funded by public bodies
Advice4debtNI/Debtaction/Dealing with debt
Citizens Advice Bureau
Advice4debtNI is an independent debt advice provider in Northern Ireland, funded by the government, specifically by the Department for Trade and Industry (DETI). Advice4debtNI is run by the social purpose company A4e. Debtaction NI and Dealing with Debt are both projects run by DETI providing free face-to-face advice in NI. in June 2010, Debt Action NI had 18 advisers (including 4 part-time)122.
The majority of CAB’s funding comes from the government although it does receive a substantial amount from the private sector. CAB was the most widely mentioned debt advice provider in the literature. There are high levels of awareness of CAB amongst the public123; more so than for any other debt advice provider. One study looked at what debt advice providers were most commonly
122 Department of Enterprise, Trade and Investment by KPMG (2010), ‘Research Project to examine Future Debt Advice Provision in Northern Ireland’
123 Perchard (2011) reported 95% public awareness of CAB, ‘Household debt and bankruptcy - the view from Citizens Advice Bureaux in the United Kingdom’
Figure 13: Main organisations providng free-to-client debt advices
Free to client debt
advice providers
Funded by private sector
Housing Associations
Funded by Public bodies
Other
CCCS
PayPlan
Money Advice Trust
Citizens Advice Bureau
Advice4Debt NIDebt Action
Dealing with Debt
Other
Legal Advice
Financial Institutions
Funding info. not available
Christians Against Poverty

3 │ Debt advice providers in the UK
32
London Economics
Debt Advice in the UK
contacted and found the most common was CAB at 31%124.CAB has 28,500 staff nationwide, of which 21,500 are volunteers125.
Funded by private sector
Consumer Credit Counselling Service (CCCS)
Money Advice Trust (MAT)
Payplan
Christians Against Poverty
CCCS was also a widely mentioned free-to-client debt advice provider. It was reported they have the largest share in the free-to-client Debt Management Plan (DMP) market126. Their funding comes from the commercial sector through their ‘Fairshare’ scheme. The ‘Fairshare’ scheme is a system for funding used by CCCS, where they receive 10% of the debt that they recover for creditors, as a charitable donation. This funds their entire debt advice activity. The BIS/YouGov Debt Tracker survey found CCCS to be second most commonly contacted debt advice provider127.
MAT runs Business Debtline (BDL) and National Debtline (NDL), a telephone based service based in Birmingham, which serves the whole of the UK. According to the BIS/YouGov survey found that 12% of those with debt problems contacted NDL, coming third only to CCCS and CAB and ‘professional advisers’ as a whole128. We categorised NDL as being funded by the private sector, as they receive 52% from this sector, however it is important to note that 48% of their funding comes from government and other public bodies.
Payplan also use the ‘fairshare’ funding mentioned previously. They claim to help 100,000 people for free each year, and one report named them amongst the CAB, CCCS and NDL as the four largest free-to-client debt advice providers129. The BIS/YouGov found that 9% of those with debt problems contacted Payplan130.
Although the companies mentioned above are funded by the private sector, the funding from the private sector is relatively small in terms of the whole market. Gillespie and Dobbie found that, taking account of support for the money advice infrastructure and National Debtline, private sector funding for money advice is only around 3% of the total131.
124 BIS (2011), ‘Credit, debt and financial difficulty in Britain (2009/10)’ 125 CAB (2010), ‘Citizens Advice Service - Annual Report and Accounts 2009/10’ 126 Mintel (2010), ‘Debt Management, Financial Intelligence’ reported that CCCS has 65-70% of free-to-client DMPs market 127 24% of people contacted CCCS as found by BIS (2011), ‘Credit, debt and financial difficulty in Britain (2009/10)’ 128 BIS (2011), ‘Credit, debt and financial difficulty in Britain (2009/10)’ 129 Gathergood (2011), ‘Demand, capacity and need for debt advice in the UK’ 130 BIS (2011), ‘Credit, debt and financial difficulty in Britain (2009/10)’ 131 Gillespie and Dobbie (2009), ‘Funding Money Advice Services’

3 │ Debt advice providers in the UK
London Economics
Debt Advice in the UK 33
Housing Associations
Several housing associations provide debt advice to their tenants. Those found to be doing so in the literature are:
Affinity Suttton Amicus Horizon Circle 33 Housing Trust Hyde Group Metropolitan Housing Partnership Southern Housing Group Wandle Housing Association
Social landlords face particular problems due to the rise in the number of people with debt problems, particularly as those in social housing tend to be poor. As discussed in footnote 79, there is a definite rationale for landlords to provide debt advice to help their tenants and ultimately help them to retrieve unpaid rents/debts.
Other
Legal Advice
Legal advice is linked to debt advice, as often with severe debt problems and arrears, legal action is taken against debtors. The Legal Services Commission (LSC) funds some free-to-client debt advice providers – e.g. the LSC provides the majority of funding for DAWN Advice.
Financial Institutions
Banks/building societies and the staff of such institutions often give debt advice to their customers as part of their service. This is done both formally and informally.
Funding information not available
Bristol Debt Advice Centre
Debt Advice Foundation (Advice UK)
Frontline Debt Advice
These are free-to-client debt advice providers. However, information on funding was not readily available, and these organisations have only a small market share.
Funding Issues – Free to client sector
For the free-to-client sector, funding is an issue which was mentioned widely in the literature. This relates to the finding that the demand for debt advice is greater than the supply, meaning resources are over-stretched.

3 │ Debt advice providers in the UK
34
London Economics
Debt Advice in the UK
The current economic climate has further increased the demand for debt advice services and the government’s deficit reduction programme means that the future of publicly-funded free debt advice services is uncertain as many free-to-client providers rely on local authorities or government funding132. Advice UK noted in a recent report that they have not been given any additional funding despite the extra demand they are facing as a result of the recession.133 More recently, they found that 41% of their members had already faced funding cuts and 58% expected to have their funding cut in the near future134.
In Scotland, the funding of free face-to-face advice comes from a number of sources such as the Big Lottery fund amongst other charitable trusts e.g. Scottish Gas Energy Trust. This is in contrast to England and Wales where much of the funding comes through Community Legal Services, and some local authority funding and charitable trusts135.
Securing sufficient funding is vital for some free-to-client sector providers if they are to continue supplying their debt advice services. KPMG (2008) found the majority of funding is used for staff and overheads.136 If future funding is cut, this will restrict the capacity of the organisation thus further increasing unmet demand for debt advice; which may lead to deterioration in the quality of services provided - ultimately resulting in a negative impact on consumers.
Camden Council noted that having looked at the services they provide, if funding was cut, the only way they could restrict their services would be to ration them to Camden residents only – this would mean excluding those from surrounding boroughs where debt advice services are non-existent. This is obviously not ideal, but was the only option foreseen137.
In order to deal with the funding issue, Gillespie and Dobbie (2009) suggest several alternative funding systems including charging creditors.138 However, one problem with this latter approach, as noted by Wells et al (2010), is that creditors feel no direct link between advice given and the benefit to individual creditors.139 Other funding suggestions were releasing money from dormant bank accounts, charging those who can afford to pay for debt advice to cross subsidise those who cannot, and a compulsory contribution from the credit industry. Wells et al (2010) also found that there was a strong reluctance to the latter which is effectively a statutory levy on the industry. Both reports conclude that funding is currently short-sighted and unsustainable.
132 Advice UK (2009), ‘Delivery of money advice services across England, Scotland and Wales by members of the AdviceUK network’ 133 Advice UK (2009), ‘Delivery of money advice services across England, Scotland and Wales by members of the AdviceUK network’ 134 Advice UK (2011), ‘Advice Services: What Next? Reflections from the BOLD project’ 135 CAS (2011), ‘Debt Advice in Scotland - The role of the Scottish CAB Service in the debt advice landscape’ 136 KPMG (2008), ‘Post Project Evaluation of the Debt Advice Service - Final Report’ 137 From telephone conversation with official from Camden Council 138 Gillespie and Dobbie (2009), ‘Funding Money Advice Services’ 139 Wells, Leston and Gostelow (2010), ‘The Impact of Independent Debt Advice Services on the UK Industry’
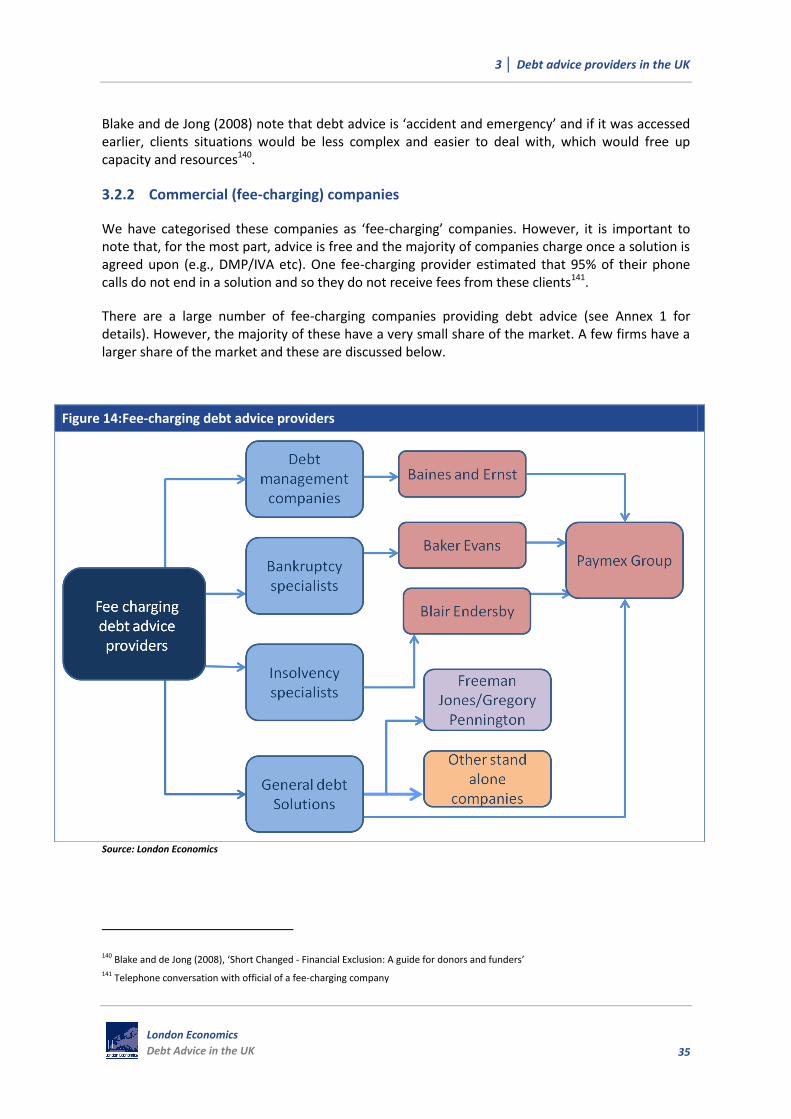
3 │ Debt advice providers in the UK
London Economics
Debt Advice in the UK 35
Blake and de Jong (2008) note that debt advice is ‘accident and emergency’ and if it was accessed earlier, clients situations would be less complex and easier to deal with, which would free up capacity and resources140.
3.2.2 Commercial (fee-charging) companies
We have categorised these companies as ‘fee-charging’ companies. However, it is important to note that, for the most part, advice is free and the majority of companies charge once a solution is agreed upon (e.g., DMP/IVA etc). One fee-charging provider estimated that 95% of their phone calls do not end in a solution and so they do not receive fees from these clients141.
There are a large number of fee-charging companies providing debt advice (see Annex 1 for details). However, the majority of these have a very small share of the market. A few firms have a larger share of the market and these are discussed below.
Source: London Economics
140 Blake and de Jong (2008), ‘Short Changed - Financial Exclusion: A guide for donors and funders’ 141 Telephone conversation with official of a fee-charging company
Figure 14: Fee-charging debt advice providers

3 │ Debt advice providers in the UK
36
London Economics
Debt Advice in the UK
Paymex Group
The Paymex group is a one of the largest financial solutions companies in the UK, and has over a decade of experience in debt solutions. They provide debt advice and solutions which service Scotland as well as England. Their company consists of:
Baines and Ernst (Debt Management Company) Baker Evans (Bankruptcy Specialists) Blair Endersby (Insolvency Specialists) Buchanan Roxburgh (Scottish Financial Solutions) Easycall finance (loans and financing options)
Freeman Jones (Think Money)/Gregory Pennington
Gregory Pennington is the sister company of Think Money, which is run by Freeman Jones. Gregory Pennington is one of the largest debt management companies in the UK. Think Money are one of the UK's largest and longest-established providers of financial products and advice and Freeman Jones is an established firm of licensed Insolvency Practitioners.
Trading names of Freeman Jones are Debt Advisory Centre and Debt Reducers. The Think Money Group includes Debt Advisors Direct and Debt and You.
Other stand-alone companies
The next largest companies were identified as:
Debt Free Direct/Clear Start
Harrington Brooks
Kensington Financial Management Consultants
Chiltern
1996 they have worked for over 250,000 clients.
Eurodebt
Other
There are numerous other debt advice providers in the private sector, which are not explicitly mentioned here.

3 │ Debt advice providers in the UK
London Economics
Debt Advice in the UK 37
The fee-charging sector is a large part of the debt advice market, and as Accenture (2010) pointed out “fee-charging debt management companies (DMCs) offer a valuable service to consumers, filling the gap which results from the scarcity of resources in the free-to-client sector”142.
Funding Issues – Fee-charging sector
As previously mentioned, fees are mostly charged by these advice providers once a solution is agreed upon. There is usually an initial fee and a monthly fee, which is a percentage of the monthly repayments.
For example, Baines and Ernst’s fees for DMPs are as follows: An initial fee – calculated from the financial information provided by the client in the application process and is equivalent to first two months of the plan - and a monthly fee (management fee) – this fee is for their services every month and covers the cost of administering payments to creditors, dealing with queries from them and the professional services to the client. The amount is equivalent to 17.625% of the monthly payment (the amount is a minimum of £35 and maximum of £100)143.
Eurodebt – another fee-charging provider whose average initial fee for DMPs (Instruction fee) is £779.98 and average monthly fee is £34 (min £27.50 and max £90)144. The initial fee for an IVA is much higher, with an average of £1,700 (plus VAT).
The difference between free-to-client and fee-charging companies has been widely discussed in the literature which suggests that they have different aims; fee-charging providers may be more concerned with reducing costs and increasing profits whereas public bodies that are not-for-profit such as CAB receive funding to provide service.
Collard (2009) notes that there are concerns that some fee-charging debt advice providers sometimes do not act in their clients’ best interest – by recommending solutions that are not appropriate in order to gain fees145.
Moreover, the OFT (2010) found in a mystery shopping exercise that 92% of the fee-charging providers observed failed to mention to client that they can receive free advice, and some advisers even attempted to discredit the services provided by free-to-client sector146.
However, levels of customer satisfaction seem to be very high amongst clients of fee-charging providers, with one company contacted reporting that 94% of their clients said they were honest, open and that they ‘had a positive impact on [their] lives’.
142 Accenture (2010), ‘A New Model for Dealing with Personal Debt’ 143 http://www.bainesandernst.co.uk/bainesandernst-fees/ 144 http://www.eurodebt.com/cost.asp 145 Collard (2009), ‘An independent review of the fee-charging debt management industry’ 146 OFT (2010), ‘Debt Management Guidance Compliance Review: Mystery Shopping’

3 │ Debt advice providers in the UK
38
London Economics
Debt Advice in the UK
3.2.3 Market Shares
Figure 15 shows the most commonly contacted debt advice providers. The two most commonly contacted providers are CAB and CCCS, both of which are free-to-client debt advice providers.
Source: BIS (2011), ‘Credit, debt and financial difficulty in Britain (2009/10)’
Because of the competitive nature of the market, market shares are not easily available. Also, as each company has its own measures, comparing these can be difficult. However, some literature does report market shares in certain areas.
Figure 15: Most commonly contact debt advice providers (2009/10)
0
5
10
15
20
25
30
35
Pe
rce
nta
ge %

3 │ Debt advice providers in the UK
London Economics
Debt Advice in the UK 39
Figure 16: Whole debt advice market (2011)
Note: The percentages are the proportion of those with debt problems who contacted the mentioned provider. Source: Greater London Authority (2011) ‘Treading Water’ reports market shares for UK
Figure 16 shows what share debt advice providers have of the debt advice market as a whole – including both fee-charging and free-to-client sector. From Figure 16 it can be observed that CAB has largest share of the total debt advice market, followed closely by CCCS. NDL also has a considerable share. Fee-charging providers have a much smaller part of the market.
Free-to-client market shares
Debt Management Plans – Free to client
CCCS are reported to have 65-70% of the free DMP market. Accenture (2010) predicted that by the end of 2010, 562,000 fee-charging plans would be in operation compared to around 220,000 in the free advice sector147.
Fee-charging market shares
Debt Management Plan
Baines and Ernst are reported to have 15% of the market share for DMPs148. Gregory Pennington and Think Money Group have a 20% of the DMP market. Debt Free Direct/Clear Start, Harrington Brooks, Kensington Financial Management Consultants, Chiltern, Eurodebt were reported to
147 Accenture (2010), ‘A New Model for Dealing with Personal Debt’ 148 All market share references on this page come from: Mintel (2010), ‘Debt Management, Financial Intelligence’

3 │ Debt advice providers in the UK
40
London Economics
Debt Advice in the UK
jointly have 55-60% of the market share for DMPs. The rest of the small firms have jointly 5-10% of the DMP market.
Source: Mintel (2010), ‘Debt Management, Financial Intelligence’
Individual Voluntary Arrangement (IVA) Market
It is reported that Debt Free Direct is the largest IVA provider in the market, with its parent company, Fairpoint Group, claiming to have over 16,000 IVAs under management as at June 2008 and a 20% share of new business (Mintel, 2010).
Morgan (2008) illustrates how the IVA market has changed over the years. She notes that in 1995, there were many less firms than there are today (there were just 284) but 39 firms jointly handled over 50% of cases; whilst in 2006 there were 339 firms in the market, yet only 8 of these handled over 50% of cases – this shows how a few firms have large market shares149.
149 Morgan (2008), ‘Causes of Early Failures in Individual Voluntary Arrangements (IVA)’
Figure 17: Market Share (Fee-charging sector): DMPs
20%
15%
55%
10%
Gregory Pennington/Think
Money
Baines and Ernst (Paymex)
Debt Free Direct/Clear Start, Harrington Brookes, Kensington Financial Management Consultants, Chiltern, Eurodebt
Other small firms

4 │ Delivery of debt advice
London Economics
Debt Advice in the UK 41
4 Delivery of debt advice
4.1 Awareness of debt advice services and referrals
4.1.1 Awareness of debt advice services
Awareness of CAB was high, with one report stating that 97% of people had heard of CAB.150 However, it seemed that the awareness was of CAB in general, and not regarding the specific free face-to-face debt advice that they provide.
Day, Collard and Hay (2008) also found that awareness of free-to-client providers was generally high151, and Downs and Woolrych (2009) found that CAB awareness again was very high and the majority of people had heard of FSA and NDL. Roughly a third had heard of CCCS and for Advice UK and Payplan this figure was approximately 10%152.
On the other hand, Collard, Finney and Crosswaite (2009) found that few people were aware of free-to-client services and reluctant to contact them. Furthermore, Opinion Leader (2008) found that 2/3 of Financial Inclusion Fund (FIF) clients were not aware of any other debt advice services153.
Evans, McAteer and Gavurin (2011) suggest however, that low awareness is not the main reason why consumers don’t seek debt advice; it is due to the fact they do not perceive themselves as having debt problems in the first place154.
4.1.2 Referrals to debt advice services
Here we focus on how those seeking debt advice find out about a debt advice provider in the first instance. A report by Opinion Research Leader (2008) found that those who contacted debt advice providers found out about the organisations in two main ways: word of mouth (28%) and referral from another organisation (23%).
However, OFT (2004) found that most commonly, people had used the organisation before. Other popular referral methods mentioned were magazine/radio/TV advertising and ‘mailshots’ through the door or in magazines.
150 CAB (2010), ‘Citizens Advice Introduction to the service 2009/10’; 151 Day, Collard and Hay (2008), ‘Money Advice Outreach Evaluation: Qualitative Outcomes for Clients’ 152 Downs and Woolrych (2009), ‘Gambling and Debt Pathfinder study’ 153 Opinion Leader (2008), ‘Evaluation of the Financial Inclusion Fund Face-to-Face Debt Advice Project Final Report for Stage 2 of the
Evaluation’ 154 Evans, McAteer and Gavurin (2011), ‘Report 1: Debt and Household Incomes’

4 │ Delivery of debt advice
42
London Economics
Debt Advice in the UK
Figure 18: CCCS Referral Sources
Source: CCCS (2010) CCCS Statistical Yearbook 2010
Figure 18 shows the most common referral sources to the CCCS, with over half of CCCS clients being referred by their creditors. This is followed by family and friends. The other referral sources mentioned have a comparatively small share.
Overall these results suggest that creditors may have a substantial influence on what debt advice providers consumers contact. In this regard, Evans, McAteer and Gavurin (2011) suggest that all lenders should ‘hot-key’ to free-to-client debt advice providers rather than fee-charging debt advice providers155. It is also important to recall that lenders are encouraged to signpost to free advice providers by FSA regulation and OFT consumer credit guidance.
4.2 Delivery channels used by service providers
The main delivery channels in use by debt advice providers are face-to-face, telephone, internet (website/email) and a small number of providers use postal services. The latest BIS/YouGov Debt Tracker survey shows that of those who received debt advice, 42% did so via telephone, 35% via face-to-face and 17% online (Figure 19)156.
155 Evans, McAteer and Gavurin (2011), ‘Report 1: Debt and Household Incomes’ 156 BIS (2011), ‘Credit, debt and financial difficulty in Britain (2009/10)’

4 │ Delivery of debt advice
London Economics
Debt Advice in the UK 43
Figure 19: -Debt advice delivery channels
Source: BIS (2011), ‘Credit, debt and financial difficulty in Britain (2009/10)’
Of the 62 debt advice providers whose offering was reviewed for the present analysis (see Annex 1); all use telephone as a delivery channel for debt advice and all but 2 provide debt advice online157. However, many fewer provide face-to-face advice158.
It is worth noting that 35% of debt advice clients received face-to-face advice as shown by Figure 19, but a much smaller proportion of debt advice providers use this delivery channel.
The type and mix of delivery channels used varies across. CAB and professional advisers mostly use face-to-face, whereas CCCS, Payplan and NDL mainly use telephone159. One study found that 72% of fee-charging debt management firms use telephone as their main form of communication160 161.
Almost all debt advice providers use more than one delivery channel; however the level of integration between these is not clear. Some debt advice customers may use the websites of debt advice providers as ‘signposting’ if they feel self-help is not possible but the literature does not
157 N.B except two where information on communication methods were not available 158 In this regard, it is useful to note that a report by AdviceUK found that almost all of the independent advice centres that belong to
the AdviceUk network provide face-to-face advice (96.3%) and 63.2% of the sample also delivers advice by telephone. Thirty-six per cent of those who provide advice by email and phone calls confirmed that this mode of delivery is on the increase. A very small number offered debt advice by one channel only.
159 BIS (2011), ‘Credit, debt and financial difficulty in Britain (2009/10)’ 160 Mintel (2010), ‘Debt Management, Financial Intelligence’ 161 Dayson and Vik (2011), ‘Evolution of Financial Inclusion in Leeds since 2004’ also found that majority of fee-charging providers use
telephone as delivery channel
42
35
17
6
% of clients who recieved debt advice via delivery channels
Telephone
Face-to-face
Online
Don't know/can't remember

4 │ Delivery of debt advice
44
London Economics
Debt Advice in the UK
explicitly discuss whether and how a debt advice customer would receive services via an integration of the delivery channels.
4.2.1 Evaluations of delivery channels
Of the stakeholders which were consulted during the study, one stakeholder (CCCS) noted that they found that all the delivery channels (telephone, face-to-face and online) were all equally effective – meaning, for example, that their customers were no more or less likely to remain on a DMP dependent on what delivery channel they used.
However, Morgan (2008) finds that the channel of delivery does have an impact on how likely an IVA was to be seen through until the end, with face-to-face being the most effective. This was thought to be due to misunderstandings occurring over the telephone162.
Face-to-face debt advice
There are of course, advantages and disadvantages for all of the delivery channels. Looking firstly at face-to-face advice, this has been identified as being a better delivery channel for those who are financially excluded and for those who have multiple or complicated debt problems163.
As noted above, the fee-paying sector may lack incentives to provide face-to-face advice (as it is an expensive delivery channel) and this could ultimately cause problems as vulnerable people and those with complicated debt problems benefit more from face-to-face advice when compared to the other delivery channels. However, an interesting finding from a large fee-charging debt advice provider is that although they offer face-to-face advice, they hardly have any demand for this, and almost all of their clients contacted them online or by telephone164.
Cullen (2004) identified that face-to-face advice allowed clients to build up trust with their adviser165, which can be especially important to vulnerable clients such as mental health patients. A report which looked at debt advice given to prisoners found that face-to-face advice increased confidence with managing money and improved the well-being of clients166.
However, there are also a number of disadvantages:
The greatest disadvantage of face-to-face advice is the cost. It is much more expensive than the other delivery channels. NAO (2010) found that face-to-face debt advice costs roughly five times more than advice over the telephone (£270 compared with £50)167. Given resource constraints, this obviously limits the amount of people that can receive face-to-face debt advice.
162 Morgan (2008), ‘Causes of Early Failures in Individual Voluntary Arrangements (IVA)’ 163 Patel (2011), ‘A review of face to face debt advice in prisons’ 164 Telephone conversation with official from a fee-charging organisation 165 Cullen (2004), ‘Out of the picture CAB evidence on mental health and social exclusion’ 166 Patel (2011), ‘A review of face to face debt advice in prisons’ 167 NAO (2010), ‘Helping over indebted customers’
4 │ Delivery of debt advice
London Economics
Debt Advice in the UK 45
The restriction of opening hours can further limit who can access these services. Another disadvantage was that some customers found face-to-face advice too time-
consuming168.
Overall, according to a 2007 study, four out of five people prefer to receive debt advice face-to-face. However, those who are financially excluded are the least likely to want face-to-face advice169. The reason for this is not clear. According to the authors of the 2007 study, it is possible that “financially excluded groups may prefer a more anonymous way of receiving advice on sensitive matters, such as serious money problems.” Another alternative explanation is that financially excluded prefer to receive written advice so that family members or friends can explain to them what the advice means.
A recent NAO report notes that 25% of people would prefer to receive debt advice over the telephone170.
A key issue with the various surveys focusing, among others, on the channel of debt advice provision is that they focus on preferences and not on actual needs. Moreover, many of the survey participants may not have good information about what the various channels can deliver in terms of debt advice. Thus, their responses are likely to be based on incomplete information and, therefore, of limited usefulness for policy-makers.
As face-to-face advice is expensive, one report looked at the question of whether more should be done to shift clients to a non-face-to-face delivery channel and all of the organisations interviewed as part of that study supported such a move as it would release capacity for those who most need face-to-face appointments and help via the telephone171.
Debt advice via Telephone
Debt advice via telephone is much more commonly used by debt advice providers, and the advantages of this method of communication are large.
It is much cheaper (NDL reports their costs as £40 per client and £25 per call) 172. Some debt advice clients preferred this mode of contact compared to face-to-face advice
as it allowed them to preserve anonymity and avoid the embarrassment associated with the stigma of debt173.
Telephone services can offer longer opening hours compared to face-to-face advice meaning their services are accessible to more people.
A majority of people (58%) prefer to speak to someone over the phone than receive debt advice via email and telephone users report high levels of customer satisfaction174.
168 Wallis (2005), ‘Advice and the best way of delivering it - Literature survey for the Financial Capability Generic Advice project’ 169 Buck, Tam and Fisher (2007), ‘Putting Money Advice Where the Need is: Evaluating the Potential for Advice Provision in Different
Outreach Locations’ 170 NAO (2010). 171 MacFarlane (2011), ‘Corporate review of advice services’ 172 KPMG (2010) ‘Research Project to examine Future Debt Advice Provision in Northern Ireland’ 173 Wallis (2005), ‘Advice and the best way of delivering it - Literature survey for the Financial Capability Generic Advice project’ 174 Illuminas (2008), ‘National Debtline: Evaluation of performance presentation’

4 │ Delivery of debt advice
46
London Economics
Debt Advice in the UK
Telephone services can be more convenient for those who require debt advice but are not close to local face-to-face service.
A disadvantage of telephone as a main form of communication for debt advice is that some groups of people such as the elderly were found to understate their debt problems over the telephone.175.
Goode and Waring (2011) found that, if there is a cost to users associated with debt advice via telephone (some advice providers have a free number but not all do), then this becomes a barrier for people wishing to seek debt advice via this channel176.
CAB (2010) notes a number of reasons why some clients sought face-to-face advice after seeking telephone advice from another organisation. The most common of these were: people wanted to see someone face-to-face; the other provider didn’t resolve the problems; the problems were too complex or urgent for the other organisation to deal with and they wanted a second opinion.
Debt Advice Online
Debt advice received online via website or emails is very cheap to implement. CCCS reports that its ‘Debt Remedy’ online tool costs £5 per client177 and this is an obvious advantage. However, advice via website is generally ‘self-help’ and therefore is unsuitable for some vulnerable groups of people such as those who lack the financial literacy to cope with their problems alone.
Those who lack internet access are inherently excluded from debt advice online; in some groups the level of this exclusion was large. For example, of those without dependent children, just 75% had access to the internet compared to 91% for those with dependent children178. These factors leading to exclusion of online advice need to be considered by debt advice providers when choosing the internet as their main method of communication.
Debt advice users who use websites/emails are more likely to self-help without additional assistance from the debt advice provider. Therefore the effectiveness of the debt advice may be related to the fact that the nature of delivery is self-help and thus requires a higher level of active engagement by the user, and not because debt advice is being provided online.
Demographics and delivery channels
The review of the existing literature suggests that the demographics of those who sought debt advice affected what channel of delivery they were most likely to use.
CCCS found that their online clients were better off than those receiving debt advice via other communication channels179. A study supporting this view also found that online clients were
175 Deputy Minister for Social Justice and Regeneration (2005), ‘Deputy Minister’s Review of Over-indebtedness in Wales’ 176 Goode and Waring (2011), ‘Seeking direction: Men, money advice and the road to financial health’ 177 NAO (2010), ‘Helping over indebted customers’ 178 Eurostat: Households - Level of Internet access (isoc_ci_in_h) [accessed 5th August 2011]. 179 CCCS (2009), ‘CCCS Statistical Yearbook 2009’

4 │ Delivery of debt advice
London Economics
Debt Advice in the UK 47
generally younger and more affluent, as well as being better placed to pay off their debts180.A NDL pilot found that those in socio-economic group DE were much less likely to receive debt advice via telephone despite the fact they are more commonly over-indebted181. Young people are thought to benefit more from face-to-face advice, due to its easily accessible and informal nature182.
New/Innovative channels of delivery
One study discussed a new service which was launched in Scotland in 2004. Scottish Executive funded a number of pilots, including a mobile phone service to manage debt, which was aimed at young people183. This latter channel involves a text messaging service, educational materials on money management and budgeting and development of referral mechanisms. Use of this service increased whilst it was being advertised but demand reduced afterwards, implying that if new schemes like this are to be effective then more would have to be done to increase awareness of such services.
Trend and Madge (2009) found that very few agencies were using newer technologies, such as SMS messaging to remind clients of their appointments or providing advice by email. Some agencies were using triage systems184 while others were resisting this or using a variation that they thought was more suitable185.
4.2.2 Nature of delivery
Wells et al. (2010) identify three debt advice service models, namely:
self-help; assisted self-help; and full assistance.
Self-help is the provision of information without advice for those who feel confident in dealing direct with their creditors. This group of users tend to have levels of income that enable them to repay their debts in part or full.
Assisted self-help usually entails clients having an interview with an adviser and they are then given a self-help pack. The individual takes responsibility for negotiating with their creditors.
Full assistance (typically face-to-face) will typically be required by those who are not financially confident, who have complex debt problems and/or low incomes and so may require more holistic
180 CCCS (2010), ‘CCCS Statistical Yearbook 2010’ 181 Patel (2011), ‘A review of face to face debt advice in prisons’ 182 Wallis (2005), ‘Advice and the best way of delivering it - Literature survey for the Financial Capability Generic Advice project’ 183 Gillespie, Dobbie and Mulvey (2007), ‘Money Advice for Vulnerable Groups - Final Evaluation Report’ 184 A triage system is where clients situations are assessed so that they can prioritised, in order to allocate resources effectively to those
most in need (in this case of debt advice) 185 Trend and Madge (2009), ‘Money Advice Quality Model: Quality of Money Advice Baseline Survey Final report’

4 │ Delivery of debt advice
48
London Economics
Debt Advice in the UK
support including income/benefits maximisation, and support with negotiating with creditors for rescheduling of debt186.
The nature of delivery is not explicitly discussed in the literature but one can infer that there seems to be a difference in what form of help is delivered through the different modes of interaction. Typically, face-to-face consists of more involved help ‘full assistance’ and telephone generally provides ‘assisted self-help’. Online could be therefore seen as ‘self-help’187.
For housing associations that provided debt advice, most of the debt advice was via informal referrals, although over half had formal referral mechanisms in place. Approximately 30% had specialist in-house teams to provide debt advice to residents188.
Again, the literature does not mention the interaction of these types of service delivery, although it is clear that, while some vulnerable groups need full assistance, others that are more capable could greatly benefit from a lower level of assistance or perhaps even self-help services189.
4.2.3 Impact of the nature of delivery
With regards to the nature of delivery and its effectiveness in helping those with debt problems, there is no ‘one size fits all approach’. Which nature of delivery is suitable depends on the individual’s clients needs.
Self-help
The main finding seems to be that the more educated people are, the more likely they are to be able to ‘self-help’190. CAB reported that they had a high level of one-off advice, which indicated that approximately one third of their customers could have ‘self-helped’191 and the general view is that this self-help should be encouraged where possible, so that full assistance is open for those who are unable to help themselves. Debt advice clients that use ‘self-help’ debt advice can get a sense of responsibility from it, which can help them overcome feelings of shame and embarrassment which often surround those with debt problems.
Self-help is much cheaper to deliver (as it can be done online or over telephone) and this is an obvious advantage. However, it is vital that those using this nature of delivery for debt advice are capable of dealing with their problems.
One report noted that there had been an influx of debt advice clients who were on higher income and were more affluent, and that these people should self-assist so that those who are more
186 All three definitions has Wells, Leston and Gostelow (2010), ‘The Impact of Independent Debt Advice Services on the UK Industry’ 187 CAB (2010), ‘Citizens Advice Service - Annual Report and Accounts 2009/10’ identified website as self-help and face-to-face as
assistance 188 Evans and McAteer (2011), ‘State of Play Report: A Business Case – Financial Impact of Debt Advice for Social Landlords’ 189 CAB (2008), ‘With a little help from my friends’ suggests that self-help should be offered to those who can cope with it. 190 KPMG (2010), ‘Research Project to examine Future Debt Advice Provision in Northern Ireland’ found that the number of clients receiving one off advice and the level of qualifications amongst clients indicates that clients may be able to self-help. 191 KPMG (2010) ‘Research Project to examine Future Debt Advice Provision in Northern Ireland’

4 │ Delivery of debt advice
London Economics
Debt Advice in the UK 49
vulnerable can use more involved services192. However, determining what nature of delivery is the most appropriate is difficult as Wells (2010) noted, “There is no formal process to direct consumers to the ‘right’ service for their debt advice needs. For the funders of debt advice, ensuring that consumers receive the right level of help is critical to the efficiency of the service provided”193.
Assessing how much of the debt advice market is ‘self-help’ is difficult, because many people may visit websites, and receive self-help without explicitly contacting a staff member of an organisation. For instance, CAB reported that their website Adviceline got 10.5million hits last year194, but as one user may have several hits on one site it is difficult to interpret this figure.
Assisted self-help
As previously mentioned, telephone services appear mostly to be assisted self-help, and since the majority of debt advice is given over the telephone, one could infer that most advice is assisted self-help.
This nature of delivery is ideal for those who can cope with problems with a little help, and can be delivered much cheaper than full-assistance195.
Full Assistance
Full assistance is necessary to help those otherwise unable to deal with their debt problems alone. There are several vulnerable groups identified in the literature including those that are financially-excluded, disabled or suffering with mental problems who would, in general, be best helped by full assistance.
Wadia and Parkinson (2009) found that, for full assistance, a second face-to-face session was particularly effective in enabling clients to become more financially capable and that offering clients a longer advice session was also effective as it enabled advisers to build up more of a relationship with clients and focus on empowering them rather than solving their problems for them196. This shows how full assistance can be integrated with future self-help, as those who receive face-to-face now, may be able to self-help in the future.
Full assistance tends to be more face-to-face, and this makes it a very expensive way of delivery debt advice – so those who can self-help or use assisted-self help methods should do so to free up resources for the most vulnerable. However as mentioned above there exist no formal process to establish what nature of delivery is best for each client and therefore doing so is difficult.
192 KPMG (2010), ‘Research Project to examine Future Debt Advice Provision in Northern Ireland’ 193 Wells, Leston and Gostelow (2010), ‘The Impact of Independent Debt Advice Services on the UK Industry’ 194 CAB (2010), ‘Citizens Advice Service - Annual Report and Accounts 2009/10’ 195 Assuming full assistance is face-to-face and assisted self-help is done online or telephone 196 Wadia and Parkinson (2009), ‘The Capitalise Financial Capability Pilot Project Summary Evaluation Report’

4 │ Delivery of debt advice
50
London Economics
Debt Advice in the UK
4.3 Effectiveness of debt advice
Effectiveness of debt advice is notoriously difficult to assess, as it is measured in several different ways and the information gap is notable. This is partly due to the fact that, when advice is self-help or one-off advice, often debt advice providers will not track outcomes for such clients and therefore the effectiveness of debt advice cannot be measured for these people.
For the purposes of this report, effectiveness of debt advice is defined as follows:
Whether the debt of clients is reduced, in the short and long-term Whether clients stay out of debt problems over a period of 2 to 3 years following the
receipt of advice, or do they get in different debt problems in future.
We focus on these two above definitions. However, there are other ways in which effectiveness can be assessed:
Customer satisfaction of debt advice – this is dealt with in section 6 The ‘emotional comfort’ of debt advice – i.e. does it relieve stress. We do not focus on
this in this report.
Parker (2009) found that for NDL’s self-help debt advice via telephone “assisted self-help advice is invaluable in dealing with the immediate debt problem and its impact remains valuable after time”197. Advice was reported to remain valuable as high levels of satisfaction and recommendation remain over time, previous callers appear to have reduced their debts and a high proportion of respondents are able to maintain payment arrangements over time198. In fact, of NDL clients from 2008, 53% no longer have outstanding debts (57% of 2004 callers and 73% of 2003 callers).
Gardner and Wells found that half of those surveyed had significantly reduced their debt199, whilst Williams (2007)200 observed that debt was reduced on average by £7585 twelve months after advice was received.
For A4e, Advice NI and CAB, the effectiveness of debt advice was similar. The majority of previous clients believed their situation was still the same in terms of what they actually owed, but they were in a better position to pay off those debts at a manageable rate, no longer received phone calls and letters from creditors and believed the advice will help prevent them from getting into debt again201.
197 Parker (2009) ‘National Debtline and Business Debtline Customer Journey Mapping’ 198 As found in a longitudinal study by Illuminas (2008), ‘National Debtline Performance Evaluation’ 199 Gardner and Wells (Year not available), ‘Evaluation of Money Advice Debtline pilot and business case for development of ‘National
Debtline’ 200 Williams (2007), ‘Twelve months later: does advice help? The impact of debt advice – advice agency clients study’ 201 Department of Enterprise, Trade and Investment by KPMG (2010), ‘Research Project to examine Future Debt Advice Provision in
Northern Ireland’

4 │ Delivery of debt advice
London Economics
Debt Advice in the UK 51
In terms of whether debt advice is effective in reducing the debts of clients, Pleasence and Balmer (2007) note that people offered debt advice will be more likely than those not offered advice to: cease being in debt; face fewer debts and lower priority debts202. A high proportion 60% had paid off or reduced their debts since they received debt advice. A similar percentage had new arrangements for paying off debts203. Furthermore, Gall (2009) found that how long a borrower takes to contact their lender is closely linked to whether or not they turn out to repay their arrears, and that borrowers that waited a greater length of time to contact their lender tended not to have repaid their arrears (just 19% paid them in full)204.
4.3.1 Wider effects of debt advice
Some of the literature identified that debt advice had wider benefits, and this was due to several reasons; if action has to be taken against those in debt this is costly to the creditors, debt written off has wider costs to economy and there can be wider benefits to debt advice as a result of maximisation of income. Various studies have identified the following broader benefits:
Improving financial well-being
Maintaining relationships and family stability
Avoiding mental health issues
Maintaining employment and wages
Avoiding criminality
Avoiding homelessness
Increasing income
Avoiding the costs of court and recovery action
These various benefits are discussed in greater details in a second report by London Economics (2011)205.
Dayson (2009) notes that, as a result of the provision of debt advice, every year, 26 million pounds of additional income is generated in the local economy in Leeds with an impact on the regional economy of over £28 million. The total costs of running these debt advice interventions are £3.3 million206. However, it is important to note than ‘income maximisation’ mainly consists of ‘benefit maximisation’.
Advice UK worked out the social return on investment (SROI), in the cases in which it was possible to calculate a value for the advice given. The SROI shows a return of approximately £9 for each £1 invested. For debt advice at a late intervention, the social cost was £19,207 and the cost to the
202 Pleasence and Balmer (2007), ‘Changing Fortunes: Results from a Randomized Trial of the Offer of Debt Advice in England and Wales’ 203 Dayson (2009), ‘Financial Inclusion Initiatives: Economic impact and regeneration in city economies - The case of Leeds’ 204 Gall (2009), ‘Understanding mortgage arrears’ 205 London Economics (2011), ‘Funding debt advice in the UK – A proposed model’, Report to the Money Advice Service 206 Dayson (2009), ‘Financial Inclusion Initiatives: Economic impact and regeneration in city economies - The case of Leeds’

5 │ Services offered by debt advisers
52
London Economics
Debt Advice in the UK
State £9,511. For early intervention debt advice this was much lower; the social costs were £7,746, and the cost to State £1,521207.
Creditors also benefit from debt advice provided to debtors. For example, Wells, Leston and Gostelow (2010) find that when individuals receive debt advice, creditors recover 51% of the debts owed, on average, relative to only 46% when advice is not received.
5 Services offered by debt advisers
Figure 20: Pyramid showing structure of debt advice
Source: London Economics - adapted from MacFarlane (2011), 'Corporate review of advice services'
Figure 16 shows how debt advice is structured, on the left hand-side the advice is split into:
Tools (Informal/formal): these are processes undertaken to either prevent clients getting into debt problems (or to stop their situation worsening) or to establish the severity of the clients situation, and to determine the most suitable solution, if appropriate.
Solutions (Informal/formal): these are undertaken (if necessary) and unlike tools – result in a reduction of the clients debt via one means or another.
207 Advice UK (2011), ‘Advice Services: What Next? Reflections from the BOLD project’
Prevention: money management, debt advice
budget plans, income/expenditure forms, self-help – booklets, websites
negotiating with creditors, agreeing payment plans,
court proceedings
Bankruptcy, IVAs, DMPs, DROs
Formal tools
Informal solutions
Formal solutions
Informal tools

5 │ Services offered by debt advisers
London Economics
Debt Advice in the UK 53
Different licensing requirements prevail at the top two levels. For ‘Informal solutions’, the advice provider has to be licensed by the OFT. For some formal solutions, namely bankruptcy and IVAs, registration of the adviser with the Insolvency Service is required.
5.1 Complexity of debt handled
5.1.1 Level of debt
Estimates on the average amount of debt per client varied greatly. KPMG (2008) found the average amount of debt to be £4,128208. However, the majority of literature places the estimate at between £16,000209 and £21,000 with most of those estimates falling in the range of between £16,000 and £18,000.
5.1.2 Type of debt
The debt of debt advice seekers includes the following types of debt:
Mortgage Credit card Utility (telephone/gas/electricity) Water Loans – secured Loans – unsecured Overdraft Rent Tax Benefit overpayment Council Tax TV Licence Hire purchase
Debts can be classified into priority and non-priority debts based on the enforcement powers of the creditors. Priority debts are those where non payment can result in the loss of: liberty, home, essential services or essential goods.210 Priority debts are usually mortgage/rent arrears and council tax debts211 but they can also include utility bills.
Debts can also be classified into secured and unsecured debts; this distinction is made on whether any collateral is secured against the debt, or not in the latter case. Unsecured credit is mainly in the form of personal loans and carries a greater risk for creditors as in the event of default they cannot seize any assets. Therefore interest rates tend to be higher on these types of loans.
208 KPMG (2008), ‘Post Project Evaluation of the Debt Advice Service - Final Report’ 209 Wells, Leston and Gostelow (2010) stated the average as £16,700; Williams (2007), ‘Twelve months later: does advice help? The
impact of debt advice – advice agency clients study’ and Pleasence, Buck, Balmer and Williams (2007), ‘A Helping Hand: The Impact of Debt Advice on People’s Lives’ both put the average at £18,780 and the highest estimate was Illuminas (2008), ‘National Debtline: Evaluation of performance presentation’ for which it was £23,024.
210 CAB (2006), ‘Deeper in debt - The profile of CAB debt clients’ 211 BMRB International Limited (2004), ‘Widening the scope? FSA and CAB research into delivering financial advice through the CAB’

5 │ Services offered by debt advisers
54
London Economics
Debt Advice in the UK
The literature review identified a number of common types of debt of debt advice seeker. Credit card debt is very common -indeed this was the most common type of debt for clients of three advice providers in Northern Ireland212. Personal loans are also very common213. Other commonly observed types of debt include store cards, overdrafts, catalogue debts and bank loans.
Wells et. al (2010) identified the percentage of those who had certain types of debt and classified people into three groups: ‘total population’, ‘all of those in arrears’ and ‘those in arrears who sought advice’. Figure 21 shows these statistics.
Figure 21: Types of debt (2010)
Source: Wells et al (2010), ‘The Impact of Independent Debt Advice Services on the UK Industry’
For almost all the debts (excluding student loan, home collected loan, DSS/Social Fund loan and Mortgage) the pattern is what is intuitively expected i.e. that a higher percentage of ‘those in arrears’ have these types of debt and this percentage is higher still for ‘those in arrears who sought advice’. This is intuitive as if people are in arrears, they generally will have more debts and if they have sought advice then they are expected to be in a worse financial situation still.
212 DETI NI DATA 213 Statistical End of year report - Dealing with Debt 2010-11.
0 10 20 30 40 50 60 70 80
Mortgage
Secured personal loan
Unsecured personal loan
Authorised overdraft
HP agreement
Car finance loan
DSS/Social Fund loan
Loan from friend/family
Catalogue
Home collected loan
Pawnbroker
Student loan
Payday loan
Store card – balance not paid off
Credit card – balance not paid off
Percentage %
Those who sought debt advice
All those in arrears
Total population

5 │ Services offered by debt advisers
London Economics
Debt Advice in the UK 55
The exceptions, as noted above, however provide some interesting patterns. Firstly, ‘those in arrears’ were much less likely to have a student loan than the total population. This perhaps reflects that those who do not go to university have a lower earning ability and therefore are more likely to suffer with debt problems. ‘Those in arrears who sought advice’ were more likely to have a student loan than those in arrears, which shows as aforementioned low education can be a barrier to seeking advice.
Interestingly, those in arrears were much less likely to have a mortgage than the population as a whole. One could perhaps infer that those in arrears are more likely to have lower income and therefore much less likely to be able to afford a mortgage. Those who sought debt advice were more likely to have a mortgage than the total population, perhaps reflecting that renters are less likely to seek advice.
With regards to mortgage debt, an interesting pattern emerges from client information from a ‘free-to-client’ debt advice provider. It shows that the incidence of mortgage arrears grew significantly in the period 2003 to 2009. This figure then fell, which could perhaps be a result of the current record-low base rate (0.5%) that has been in place since March 2009 (and was decreased significantly at end of 2008).
Both those in arrears and those who sought advice were significantly more likely to have a home collected loan than the total population. However, among this group, those who sought advice were less likely than all of those in arrears to have a home collected loan.
One report found that, looking at the size of the debts, mortgages were the largest debt (making up 32% of the total amount of debt dealt with) and this is intuitive as a house is generally the most expensive commodity anyone will buy in their lifetime. The second largest debt was credit card/unsecured debt214 and this perhaps reflects the effect that the availability of credit has on consumer behaviour – ease of use and high levels of advertising have meant that consumer use of credit has greatly increased over the past decade or so.
Understanding the complexity of a client’s debt is vital in order for advisers to be able to help their clients successfully. As previously mentioned, differentiating between priority and non-priority debts is important because if a debt advice client has priority debts these need to be dealt with quickly so as to avoid the repossession of any of the client’s assets.
NDL analysed what types of debts their clients have. The results give us an indication of the number of different types of debts each client had and on average National Debtline client demographic data show that the number of debts of NDL clients is 6215.
Furthermore, the CCCS Statistical Yearbook (2010) found that the national average amount of debts was 5.7 so this is consistent with the above findings216. However, CAS (2009) found that the average number of debts was 6.3 compared with 5.1 in 2003217. A study by Balmer et al. (2005)
214 Advice NI (2010), ‘Debt Action NI Report 09/10’ 215 ‘NDL quarterly statistics’ 216 CCCS, ‘CCCS Statistical Yearbook 2010’ 217 CAS (2009), ‘Drowning in Debt’

5 │ Services offered by debt advisers
56
London Economics
Debt Advice in the UK
found the number of debts to be lower for most people – perhaps reflecting that number of debts has increased over recent years. However, the report states that those who suffer from other problems such as domestic violence or a relationship breakdown have a higher number of debts – perhaps reflecting the complexity of their problems in their life as a whole218.
5.2 Debt handling tools
Many different tools are used by debt advice providers to help their clients with their debt problems. Some of these tools are general, such as writing letters to creditors and others are specifically designed and used by certain debt advice providers and these will be discussed in more detail as examples:
The Common Financial Statement (CFS) is a budgeting tool that can be used by advice agencies and other third party organisations to make debt repayment offers to creditors on behalf of clients. It provides a detailed budgeting format to provide an accurate overview of a person's income, expenditure, assets and liabilities.
MAT has a CFS website which includes an FAQ section, an online application form, a ‘licence holders only’ section (debt advice providers – agencies and advisers) which allows clients to access current trigger figures and a copy of the CFS spreadsheet and finally, a CFS resources library for licence holders which gives information on the latest CFS developments and research, linked projects and e-bulletins219.
My Money Steps is a new, innovative online debt advice service developed by the Money Advice Trust in partnership with Barclaycard. It aims to meet the growing demand for free, impartial debt advice by providing an alternative route to help people manage and control their finances themselves. Advising users on the positive steps they can take to get on top of their debts, it’s also designed to encourage good, longer-term financial habits220.
CCCS uses an online tool Debt Remedy which provides a free service to clients. It allows their clients to anonymously input their information online and receive advice from CCCS debt advisers221.
Another tool used by CCCS is E-couch, which is a tool providing specialist help for those with mental health problems. The self-help interactive program has modules for depression, generalised anxiety & worry, social anxiety, relationship breakdown, and loss & grief222.
218 Balmer, Pleasence, Buck and Walker (2005), ‘Worried Sick: The Experience of Debt Problems and their Relationship with Health, Illness and Disability’
219 http://www.cfs.moneyadvicetrust.org/ 220 http://www.mymoneysteps.moneyadvicetrust.org/about/ 221 https://debtremedy.cccs.co.uk/start.aspx 222 http://ecouch.anu.edu.au/cccs

5 │ Services offered by debt advisers
London Economics
Debt Advice in the UK 57
5.3 Debt solutions
There are many debt solutions available to those who have debt problems. One fee-charging debt advice provider noted that many of their clients are unaware of the debt solutions available to them, with the ‘stereotypical’ client believing they can solve their problems by borrowing more money. It is therefore important for debt advice providers to fully and simply explain the following debt solutions223.
The debt solutions available to debt advice users vary depending on region. In particular, debt solutions are different in Scotland than in England and Wales. Northern Ireland has the same debt solutions as mentioned for England and Wales, with the exception of Debt Relief Orders.
5.3.1 Formal debt solutions (England, Northern Ireland and Wales)
Formal debt solutions include:
Debt Management Plan (DMP) Individual Voluntary Arrangement (IVA) Debt Relief Order (DRO) Bankruptcy Administration Order (AO)
The following formal debt solutions are available although each one usually has some requirements.
Debt Management Plan (DMP)
A DMP is not legally binding unlike an IVA224.
DMPs have a number of advantages:
They allow the debtor to bring income and expenditure back into line without taking on more borrowing.
The debtor can follow this option by him/herself or with the help of a no fee charging debt advice agency.
However, there are also a number of disadvantages identified in the literature:
There is no guarantee that a person’s creditors will accept the reduced payments and/or freeze future interest payments.
A person’s credit reference file will show details of the DMP, affecting their ability to get credit in the future225.
223 From telephone conversation with official of fee-charging advice provider 224 Source: http://www.bainesandernst.co.uk/debt-management-plan/debt-management- plan/ 225 KPMG (2008), ‘Post Project Evaluation of the Debt Advice Service - Final Report’

5 │ Services offered by debt advisers
58
London Economics
Debt Advice in the UK
Advice NI reported that DMPs were the most common outcome for their clients, and cited low income amongst their clients as a reason for this. The second most common outcome was one-off advice, suggesting that less complicated cases can be dealt with over the phone226. ‘Dealing with debt NI’ also found this and also reported that IVAs were the least common solution227.
There has been much debate over DMPs and their effectiveness. An important point to note, as reported by the Financing and Leasing Association (FLA) (2010), is that DMPs can ‘fail’ for several reasons228. They can positively fail if the debtor finds a more suitable way to pay off their debts and so comes off the DMP, and they can negatively fail if the debtor cannot keep up payments (usually due to them being set too high).
Additionally, one fee-charging debt advice provider contacted as part of the present study noted that DMPs can be a temporary solution, and have the effect of stopping creditor contacting debtors (after the first few months) and therefore the scrutiny facing DMPs is unnecessary229, as they can be viewed as a temporary solution230. A free-to-client advice provider supported this point of view and added that DMPs can be used to ‘buy time’ for clients, noting that, even if bankruptcy is suggested as a solution debt advice clients are reluctant to go down this route231.
An important issue arises from this discussion of DMPs. Are they beneficial to debt advice clients or does the client believe the DMP to be the final solution, in which case, they may have been mis-informed and given false hope?
Individual Voluntary Arrangements (IVA)
An IVA is where the debtor (normally through an intermediary) reaches an arrangement with creditors to repay a percentage of the debt over the life of the IVA, usually 5 years. This is done by a licensed insolvency practitioner.
At the end of the IVA any outstanding debt is usually written off. IVA debtors do not lose their homes, but they can find that they have to live to a very tight budget until their debts are repaid, while their credit record is also damaged232.
The number of IVAs has registered very strong growth from 2003. The effectiveness of IVAs (in terms of successful completion of IVAs) shows a slight upward trend since about 2000, although 20% of IVAs still fail.
226 Advice NI (2010), ‘Debt Action NI Report 09/10’ 227 Dealing with debt (2011), ‘End of Year Statistical Report April - March 2010 - 2011’ 228 FLA (2010), ‘Consumer credit and personal insolvency review call for evidence - Response by the Finance & Leasing Association’ 229 Telephone conversation with official of a for fee advice provider 230 Telephone conversation with official of a for fee advice provider 231 Correspondence with CCCS 232 KPMG (2008), ‘Post Project Evaluation of the Debt Advice Service - Final Report’

5 │ Services offered by debt advisers
London Economics
Debt Advice in the UK 59
Source: Morgan (2008), ' Causes of Early Failures in Individual Voluntary Arrangements’
Most IVA failures (circa 60%) occur during the first two years. Most arrangements fail because the debtors can no longer afford the contributions. This can be caused by either the contributions being set too high at the outset or because of a change in circumstances. The three issues identified as being linked to failures were: the quality of advice; the terms of the arrangements; and the influence of the interested parties233.
Debt Relief Order (DRO)
Debt Relief Orders (DROs) were introduced in 2009 as a remedy for people in debt whose debts total less than £15,000 and who have little or no disposable income and assets. Unlike other formal remedies for debt relief such as bankruptcy, DROs are delivered in partnership with debt advisers, mainly from the free advice sector234.
Once a debt relief order has finished, these debts are written off. Most debts, but not all debts can be written off by a DRO. 235 For example student loans, court fines, court orders and child support payments cannot be written off by a DRO.
Citizen’s Advice currently deliver the largest number of Debt Relief orders for the Insolvency Service and process around 1,700 DROs for clients per month236. Our stakeholder research
233 Morgan (2008), ‘Causes of Early Failures in Individual Voluntary Arrangements (IVA)’ 234 Advice UK (2009), ‘Delivery of money advice services across England, Scotland and Wales by members of the AdviceUK network’ 235 Source: http://www.debtrelieforder.co.uk/faqs 236 Correspondence with Citizens Advice
Figure 22: Success rate of IVAs (%)
0
10
20
30
40
50
60
70
80
90
100
1990 1991 1992 1993 1994 1995 1996 1997 1998 1999 2000 2001 2002 2003 2004 2005 2006 2007
Success rate of IVAs (%)

5 │ Services offered by debt advisers
60
London Economics
Debt Advice in the UK
suggested that DROs are particularly effective at solving debt problems for those with low income and no assets237.
From our stakeholder research, we found that DETI NI is proposing something similar to a DRO for Northern Ireland.
Bankruptcy
Bankruptcy is an option for any individual who cannot pay their debts “as and when they fall due”. The Bankruptcy proceeding has two aims: to free the individual from the pressures of creditors to enable him or her to make a fresh start and; to ensure that all assets are distributed fairly among the creditors. The declaration of bankruptcy is usually seen as a last resort taken by those who can no longer afford to repay their debts. In most cases it will mean the loss of all an individual’s major assets238.
An individual can be made bankrupt in three ways; voluntarily (by themselves), involuntarily (by the creditors) or by the supervisor or anyone bound by an IVA. Once someone has been declared bankrupt they face restrictions e.g. they cannot be a company director or chartered accountant/lawyer, borrow £500 or more without disclosing to creditor that they are bankrupt. Twelve months from the date that the court declared person bankrupt, bankruptcy restrictions usually come to an end. However, the restrictions can continue for 2 to 15 years after the declaration date of bankruptcy if careless, criminal or dishonest behaviour were the main causes of your bankruptcy239.
Administration Order (AO)
An Administration Order is a single county court order that covers credit debts and certain other debts which are all treated together. It allows debtors to make a single payment every month into the court. The court staff then divides the money amongst their creditors on a pro-rata basis. An Administration Order stops creditors from taking further action against debtors240.
5.3.2 Formal Debt Solutions (Scotland)
Sequestration
Protected Trust Deeds (PTD)
Debt Arrangement Scheme (DAS)
237 Telephone conversation with official from Citizens Advice 238 KPMG (2008), ‘Post Project Evaluation of the Debt Advice Service - Final Report’ 239 http://www.direct.gov.uk/en/MoneyTaxAndBenefits/ManagingDebt/Bankruptcy/DG_187323 240 http://www.insolvencyhelpline.co.uk/debt_factsheets/administration_orders.php

5 │ Services offered by debt advisers
London Economics
Debt Advice in the UK 61
Sequestration
Sequestration is the Scottish legal term for bankruptcy. The process of sequestration means to transfer the assets and property belonging to the debtor into the hands of a Trustee, who will then dispose of them for the benefit of the creditors241.
There is also a new alternative route to bankruptcy. LILA is the route into bankruptcy for people who have low income and low assets. Low income is defined as gross weekly income of no more than the standard national minimum wage for a forty hour working week. Low assets is defined as no single asset worth more than £1,000 and total assets are not worth more than £10,000242.
Figure 23: Sequestrations awarded and PTDs Registered 2006-2011
Source: AIB (2011), ‘Accountant in Bankruptcy - Annual Report and accounts 2010/11’
Figure 23 shows the number of sequestrations and PTDs registered between 2006 and 2011. The most noticeable pattern is the large increase in the number of sequestrations between 07/08 and 08/09; this could be due to the recession that the UK was facing at the time. A more interesting pattern is after 2008/9, as the number of sequestrations falls, accompanied by an increase in the number of PTDs.
Protected Trust Deeds (PTD)
A Protected Trust Deed (PTD) (also known as a Trust Deed, Protected Trust or Scottish Trust Deed) is a legally binding agreement between an individual who is unable to pay his or her creditors and a licensed Insolvency Practitioner (known as the Trustee)243. It is therefore comparable to an IVA in England and Wales.
241 http://www.moneyadvicescotland.org.uk/content/faq 242 http://www.aib.gov.uk/Services/Legislation/accesstobankruptcy/Debtorsapplication/Lila 243 http://www.trustdeed.org/

5 │ Services offered by debt advisers
62
London Economics
Debt Advice in the UK
Debt Arrangement Scheme (DAS)
DAS is a government-run debt management tool which allows someone in debt to repay their debts through a debt payment programme (DPP). The DPP will allow a debtor to pay off their debts over an extended period of time while giving protection from creditors taking action against them to recover the debt in the DPP.
The DPP can last for any reasonable length of time and, if approved, will freeze all interest, fees and charges on the debt included; resulting in them being written off if the debtor fully completes the DPP244.
The Accountant in Bankruptcy reported that there were 1,910 DAS in 2010/11, a 34.8% increase on the previous year245 and also observed a reduction in the number of people seeking debt relief through bankruptcy and protected trust deeds alongside an increase of 35% in uptake of DASs.
5.3.3 Issues with formal debt solutions
One finding about debt solutions in general is that once a customer has entered a particular debt solution, it is relatively rare to subsequently change to another solution246; this is not a good outcome if the solution is not right for the customer in the first place.
Furthermore, Accenture (2010) found significant examples of fee-charging firms offering the most profitable solution for them, rather than the solution which was the most suitable for the consumer247.
5.3.4 Informal debt solutions
It is not always necessary for debt advice clients to enter into a formal solution in order for them to get out of debt. Sometimes they can come to an arrangement with creditors, as described below.
Negotiate with creditors Negotiate reduced payments Negotiate to freeze interest/fees/charges Negotiate token payments
Court proceedings
There is a major information gap in information on these solutions. As they are not formal, the outcomes are not measured as they are for the formal solutions.
244 http://www.dasscotland.gov.uk/about 245 AIB (2011), ‘Accountant in Bankruptcy - Annual Report and accounts 2010/11’ 246 FLA (2008), ‘Consumer credit and personal insolvency review call for evidence - Response by the Finance & Leasing Association’ 247 Accenture (2010), ‘A New Model for Dealing with Personal Debt’

5 │ Services offered by debt advisers
London Economics
Debt Advice in the UK 63
5.3.5 Impact of debt tools and solutions
Figure 22 shows what Pleasence, Buck, Balmer and Williams (2007) found to be the most commonly used debt solutions and who instigated them, the client or the adviser. It can be observed that negotiated reduced payments were the most commonly used debt solution, followed closely by a budget plan. Note that for all of the above debt solutions except ‘increasing income from benefits’, advisers were much more likely to undertake the debt solutions than the client themselves.
Figure 24: Most commonly used debt tools and solutions (6 months after advice sought)
Note: ‘Negotiated’ above means negotiated with creditors. Source: Pleasence, Buck, Balmer and Williams (2007), ‘A Helping Hand: The Impact of Debt Advice on People’s Lives’
An interesting pattern occurs, the more likely an adviser is to undertake a debt solution or tool the more likely the client is to undertake the debt solution themselves, suggesting that these are the preferred tools whoever uses them.
Williams (2007) identified that the two most commonly used tool were helping clients to work out a budget plan and negotiating with creditors248. From stakeholder research we found that clients viewed drawing up a budget plan as an invaluable process and a ‘high point’ of their experiences with the debt advice provider249.
Interestingly, one report250 found that the type of action taken by a debt advice client greatly varied depending on who they sought advice from. For example, those who sought advice from Payplan were less likely to report that they cut back on spending (only 29% did so compared with
248 Williams (2007), ‘Twelve months later: does advice help? The impact of debt advice – advice agency clients study’ 249 Parker (2009), ‘National Debtline and Business Debtline Customer Journey Mapping’ 250 BIS (2011)
0
10
20
30
40
50
60
70
80
Budget Plan Negotiated
reduced payments
Negotiated to
freeze interest
Organised DMP Negotiated debt
moratorium
Increased income
from benefits
Gone bankrupt
Pe
rce
nta
ge %
By advisor after 6 months
By client after 6 months

5 │ Services offered by debt advisers
64
London Economics
Debt Advice in the UK
41% overall), those who saw a professional adviser were more likely to take out a consolidation loan (10% compared to 4% overall) and CCCS clients were much more likely to contact creditors (50% compared with 31% overall). These results clearly indicate that advice given to clients varies amongst the debt advice providers.
5.3.6 Processes used by debt advisers
We sought to find information about the tools and processes used by debt advice providers. While information is scant, some findings are reported below.
“Our advisers use [a] money advice module... and will be using... a web based CRM from April 2012...This incorporates the Common Financial statement, standard letters, debt payment modelling etc”.
“Our advisers are trained and supported to use the debt advice process for dealing with clients in debt which includes exploring the clients problem (and related problems), advising on liability for debt and challenging as needed, maximising income and budgeting, drawing up a financial statement, dealing with priority debts and enforcement, working out a strategy or solution for dealing with debts and negotiating with non priority/credit debts as appropriate”.
“Our advisers use our in-house information system... as well as other debt advice reference materials as needed - most notably the debt advice handbook. Increasingly we are linking financial capability and debt advice and are developing our process model further around this”.
Trend and Madge (2009) found that advice was perceived as ‘good’ when the advisers maximised clients income (includes benefit maximisation) and when they successfully managed to reduce or write off some of the client’s debt251.
From our stakeholder research, one fee-charging debt advice provider told us that their debt advisers went through a detailed income and expenditure form which allowed the adviser to fully understand their client’s situation, and recommend the most suitable solution252.
A free-to-client debt advice provider told us how they encourage a ‘repayment ethic’ that is, if their client can afford to pay back their debts – they should. The provider described their advisers processes, saying their advisers prioritise certain debts (priority debts) and discuss income required for basic living costs, and from there decide the options available to their clients253.
CCCS described their services as ‘comprehensive counselling’ and said that they provide ongoing support for their clients on DMPs and that it is not a ‘self-help’ model254.
251 Trend and Madge (2009), ‘Money Advice Quality Model: Quality of Money Advice Baseline Survey Final report’
252 Conversation with official of for fee debt advice provider
253 Correspondence from CCCS 254 Correspondence from CCCS

5 │ Services offered by debt advisers
London Economics
Debt Advice in the UK 65
5.3.7 Impact of processes
We sought to find information about the relative advantages and disadvantages of various processes in terms of what works best, cost, etc. Unfortunately, there exists hardly any information on the processes that are used, let alone on the impact of the processes used. This is an area with major information gaps.

6 │ Customer satisfaction with debt advice
66
London Economics
Debt Advice in the UK
6 Customer satisfaction with debt advice
Overall, reported levels of customer satisfaction are high. Illuminas (2010) reported that 93% of NDL clients were satisfied with the service they received and that 90% felt that contacting NDL was positive step towards managing debts255. One report listed various aspects that were perceived as ‘good advice’. Advisers were praised for:
giving clients reassurance providing clients with comprehensive advice good listening skills having a non-judgemental attitude in depth questioning (as clients felt this meant advisers were giving them a tailored
response as opposed to generic advice)256
Trend and Madge (2009) added the following:
taking a holistic approach to debt advice (considering clients other issues) good case notes (this allows case follow-ups to easily carried out)257
Bad experiences of debt advice were usually due to a break in contact with the adviser258.
However, Illuminas also found that some clients reported that the terminology used by staff was difficult to understand, and that on first contact with the adviser they felt shame and embarrassment – however they say it was a ‘cathartic’ experience after they had disclosed their problems.
Trend and Madge (2009) also found that bad advice occurred when the adviser did not share the full information with the client and when all options and consequences of such were not explored, and there were some issues with the mishandling/misuse of personal data259.
There is some evidence suggesting that Scottish clients are less satisfied than English customers with the debt advice they received,260 usually due to advisers discussing English debt solutions rather than the relevant Scottish debt solutions261. However, AIB (2011) found that overall customer satisfaction rating was 93% - similar to levels found in England262.
255 Illuminas (2010), ‘National Debtline - Performance Evaluation 2010’ 256 Parker (2009), ‘National Debtline and Business Debtline Customer Journey Mapping’ 257 Trend and Madge (2009), ‘Money Advice Quality Model: Quality of Money Advice Baseline Survey Final report’ 258 Day, Collard and Hay (2008), ‘Money Advice Outreach Evaluation: Qualitative Outcomes for Clients’ 259 Trend and Madge (2009), ‘Money Advice Quality Model: Quality of Money Advice Baseline Survey Final report’ 260 Illuminas (2008), National Debtline: Evaluation of performance presentation’ 261 OFT (2010), ‘Debt Management Guidance Compliance Review: Mystery Shopping’ 262 AIB (2011), ‘Accountant in Bankruptcy - Annual Report and accounts 2010/11’

6 │ Customer satisfaction with debt advice
London Economics
Debt Advice in the UK 67
Gillespie, Dobbie and Mulvey (2007) suggested several ways in which debt advice could be improved:
flexibility in the delivery of the service fast access to support proactive approaches to advice building of trust and confidence raise awareness of clients rights take time to reinforce advice given263
Debt advice clients also were more “forgiving” of free-to-client debt advice providers, citing long waiting times and short appointments as disadvantages, whilst realising that as a ‘free’ organisation they are limited to what services they can provide264.
6.1.1 Wider benefits to clients
As well as aiming to reduce the debts of clients (this was our main definition of effectiveness), debt advice had wider positive effects on those received advice. Dayson (2009) reported that 41% of CAB clients reported an improvement to their health after using the service265.
Illuminas (2010) noted that advice given by NDL had a positive impact on most aspects of well-being of their clients266.
Furthermore, a study by Leeds City Council (2011) found that 41% of clients believed money advice was linked to improvement in their health; 67% of clients reported reduction in stress due to advice received267. Pleasence and Balmer (2007) found that after 20 weeks clients reported they were more likely to be: in better health, less anxious, be optimistic about their prospects and to regard their situation as improved268.
263 Gillespie, Dobbie and Mulvey (2007), ‘Money Advice for Vulnerable Groups - Final Evaluation Report’ 264 Turley and White (2007), ‘Assessing the Impact of Advice for People with Debt Problems’ 265 Dayson (2009), ‘Financial Inclusion Initiatives: Economic impact and regeneration in city economies - The case of Leeds’ 266 Illuminas (2010), ‘National Debtline - Performance Evaluation 2010’ 267 Leeds City Council (2011), ‘Improving public health through income maximisation - Commissioning advice services best practice
guide’ 268 Pleasence and Balmer (2007), ‘Changing Fortunes: Results from a Randomized Trial of the Offer of Debt Advice in England and Wales’
7 │ Conclusions
68
London Economics
Debt Advice in the UK
7 Conclusions
A number of key points emerge from this review of publicly available information on the UK landscape.
First, the UK debt advice industry is fragmented, and no comprehensive and comparable data are collected at the present time that would enable the establishment of a robust global market picture.
Second, as a result of this lack of market data, the estimates of the demand for debt advice vary markedly and are somewhat uncertain. From a policy perspective, this is obviously a major issue as, in the absence of reliable data on the demand and its split between free and fee-based advice, it is difficult to determine the extent to which there is a market failure which may call for a draw on the public purse or an industry levy.
A particular issue in this regard is the fact that in most surveys of debt and debt advice, respondents are asked questions about the household financial situation and whether they sought debt advice. It is not clear that, in such cases, the best base for extrapolating the global demand for debt advice is the UK population or the number of UK households.
Third, as result of the fragmentation, potential debt advice seekers do not necessarily have a good knowledge of the range of the options to them and may select a debt advice provider who may not necessarily have on offer the solution that would best suit that particular customer. Lack of clear signposting to various solutions/providers appears to be an issue.
Fourth, in terms of channels used for the provision of debt advice, face-to-face is a very important one for certain customer groups or in certain circumstances. However, it is not clear that all customers currently served through a face-to-face channel really require the use of such a channel. It may be possible to increase debt advice capacity within the existing resource base by shifting customers to non-face-to-face channels. In this regard, it would be useful to explore in future surveys such as the BIS/YouGov Debt Tracker survey whether survey participants who received debt advice through the face-to-face channel feel retrospectively that part or all of the debt advice services could have been provided through a different channel.
Fifth, there exists no information on which services and channels work best. While the evaluations undertaken by some debt advice providers are useful, they provide only limited information as often the sample is small, attrition in the survey population is high, and more importantly, they do not and cannot assess the efficiency, impacts and effectiveness of their own services relative to those offered by other debt advice providers. Moreover, as far as we know, such evaluations do not attempt to estimate a deadweight loss269 for the debt advice supported by public funds or industry contributions. In order to inform policy, it would be useful to consider asking in future longitudinal surveys, such as the Wealth and Assets Survey, a number of questions which would
269 I.e. the impact on the efficient allocation and use of resources devoted to the provision of debt advice.

7 │ Conclusions
London Economics
Debt Advice in the UK 69
allow one to assess the effectiveness of various debt advice services and channels as well as the deadweight loss.

References
70
London Economics
Debt Advice in the UK
References
Accenture (2010), ‘A New Model for Dealing with Personal Debt’
Advice NI (2010), ‘Debt Action NI Report 09/10’
Advice UK (2009), ‘Delivery of money advice services across England, Scotland and Wales by members of the AdviceUK network’
Advice UK (2011), ‘Advice Services: What Next? Reflections from the BOLD project’
AIB (2011), ‘Accountant in Bankruptcy - Annual Report and accounts 2010/11’
Balmer, Pleasence, Buck and Walker (2005), ‘Worried Sick: The Experience of Debt Problems and their Relationship with Health, Illness and Disability’
Balmer and Patel (2009),’ The experience of Money and Debt Problems in Rural Areas’
Balmer, Patel, Denvir and Pleasence (2010), ‘Unmanageable Debt and Financial Difficulty in the English and Welsh Civil & Social Justice Survey: Report for the Money Advice Trust’
Bath and Edgar (2010), ‘Time is Money - financial responsibility after prison’
Betti et al. (2001), ‘Study of the problem of Consumer Indebtedness: Statistical Aspects’
BIS (2011), ‘Credit, debt and financial difficulty in Britain (2009/10)’
BMRB International Limited (2004), ‘Widening the scope? FSA and CAB research into delivering financial advice through the CAB’
Buck, Tam and Fisher (2007), ‘Putting Money Advice Where the Need is: Evaluating the Potential for Advice Provision in Different Outreach Locations’
CAB (2003), ‘In too Deep’
CAB (2007), ‘Set up to fail’
CAB (2008), ‘With a little help from my friends’
CAB (2006) ‘Deeper in debt - The profile of CAB debt clients’
CAB (2009), ‘A life in debt’
CAB (2010), ‘Citizens Advice Service - Annual Report and Accounts 2009/10’
CAB (2010), ‘Face-to-face debt advice – at the heart of local community support services’
CAS (2009), ‘Drowning in Debt’

References
London Economics
Debt Advice in the UK 71
CAS (2011), ‘Debt Advice in Scotland - The role of the Scottish CAB Service in the debt advice landscape’
CCCS (2009), CCCS Statistical Yearbook 2009
CCCS (2010), CCCS Statistical Yearbook 2010
Citizens Advice Scotland (2009), ‘Drowning in Debt’
Collard (2009), ‘An independent review of the fee-charging debt management industry’
Cullen (2004), ‘Out of the picture CAB evidence on mental health and social exclusion’
Day, Collard and Hay (2008), ‘Money Advice Outreach Evaluation: Qualitative Outcomes for Clients’
Dayson (2004), ‘Financial exclusion: its impact on individuals, disadvantaged communities and the city economy’
Dayson (2009), ‘Financial Inclusion Initiatives: Economic impact and regeneration in city economies - The case of Leeds’
Dayson and Vik (2011), ‘Evolution of Financial Inclusion in Leeds since 2004’
Dealing with debt (2011), ‘End of Year Statistical Report April - March 2010 - 2011’
Del Rio and Young (2005), ‘The impact of unsecured debt on financial distress among British households’
Deputy Minister for Social Justice and Regeneration (2005), ‘Deputy Minister’s Review of Over-indebtedness in Wales’
Directorate-General for Employment, Social Affairs and Equal Opportunities Unit (2008), ‘Towards a common operational european definition of overindebtedness’
Disney, Bridges and Gathergood (2008), ‘Drivers of over indebtedness’
Downs and Woolrych (2009), ‘Gambling and Debt Pathfinder study’
Edwards (2003), ‘In too deep, CAB clients' experience of debt’
Ellison, Whyley and Forster (2010), Realising banking inclusion: The achievements and challenges, A report to the Financial Inclusion Taskforce, August
Evans, McAteer and Gavurin (2011), ‘Report 1: Debt and Household Incomes’
Evans and McAteer (2011), ‘State of Play Report: A Business Case – Financial Impact of Debt Advice for Social Landlords’
Fearnley (2007), ‘Gauging Demand for free-to-client money advice’

References
72
London Economics
Debt Advice in the UK
FLA (2010), ‘Consumer credit and personal insolvency review call for evidence - Response by the Finance & Leasing Association’
Gall (2009), ‘Understanding mortgage arrears’
Gardner and Wells (Year not available), ‘Evaluation of Money Advice Debtline pilot and business case for development of ‘National Debtline’
Gathergood (2011), ‘Demand, capacity and need for debt advice in the UK’
Gillespie and Dobbie (2009), ‘Funding Money Advice Services’
Gillespie, Dobbie and Mulvey (2007), ‘Money Advice for Vulnerable Groups - Final Evaluation Report’
Goode and Waring (2011), ‘Seeking direction: Men, money advice and the road to financial health’
Harrison and Woolley (2004), ‘Debt and Disability - The impact of debt on families with disabled children’
Hopwood Road, Maynard and Sandbach (2007), ‘Locked out - CAB evidence on prisoners and ex-offenders’
Illuminas (2008), ‘National Debtline: Evaluation of performance presentation’
Insolvency service(Year not available), ‘Characteristics of a Bankrupt’
Jenkins et al (2008), ‘Debt income and mental disorder in the general population’
Jenkins, Fitch, Hurlston and Walker (2009), ‘Recession, Debt and Mental Health’
Kempson (2002), ‘Over indebtedness in Britain: A report to the Department of Trade and Industry’
Kempson, McKay and Willitts (2004), ‘Characteristics of families in debt and the nature of indebtedness’
Kober, Claire (2005), ‘In the Balance: Disabled people's experiences of debt’
KPMG (2008), ‘Post Project Evaluation of the Debt Advice Service - Final Report’
KPMG (2010), ‘Research Project to examine Future Debt Advice Provision in Northern Ireland’
Leeds City Council (2011), ‘Improving public health through income maximisation - Commissioning advice services best practice guide’
London Economics (2011), ‘Funding debt advice in the UK – A proposed model’, Report to the Money Advice Service
London Health Forum (2009), ‘London: capital of debt - Reducing the health consequences of debt’, September

References
London Economics
Debt Advice in the UK 73
MacFarlane (2011),’ Corporate review of advice services’
May, Tudela and Young (2004), ‘British household indebtedness and financial stress: a household-level picture’
Michael Bell Associates (2001), ‘Facing up to debt: Housing debt advice & Counselling in Scotland’
Mind (2008), ‘In the Red: Debt and Mental Health’;
Mintel (2010), ‘Debt Management, Financial Intelligence’
Mitchell, Mouratidis and Weale (2005), ‘Poverty and Debt’
Morgan (2008), ‘Causes of Early Failures in Individual Voluntary Arrangements (IVA)’
Moorhead and Robinson and Matrix Research Consultancy (2006), ‘A trouble shared legal problems clusters in solicitors’ and advice agencies’
NAO (2010), ‘Helping over indebted customers’
OFT (2010), ‘Debt Management Guidance Compliance Review: Mystery Shopping’
Opinion Leader (2008), ‘Evaluation of the Financial Inclusion Fund Face-to-Face Debt Advice Project Final Report for Stage 2 of the Evaluation’
Parker (2009), ‘National Debtline and Business Debtline Customer Journey Mapping’
Patel (2011), ‘A review of face to face debt advice in prisons’
Perchard (2011), ‘Household debt and bankruptcy - the view from Citizens Advice Bureaux in the United Kingdom’
Pleasence, Buck, Balmer and Williams (2007), ‘A Helping Hand: The Impact of Debt Advice on People’s Lives’
Pleasence and Balmer (2007), ‘Changing Fortunes: Results from a Randomized Trial of the Offer of Debt Advice in England and Wales’
Royal College of Psychiatrists and Money Advice Trust (2010), ‘Debt collection and mental health : ten steps to improve recovery’
Social Market Research (2010), ‘Research on Helping Customers to Avoid/Manage Debt’
Trend and Madge (2009), ‘Money Advice Quality Model: Quality of Money Advice Baseline Survey Final report’
Tudela and Young (2003), ‘The distribution of unsecured debt in the United Kingdom: survey evidence’
Turley and White (2007), ‘Assessing the Impact of Advice for People with Debt Problems’

References
74
London Economics
Debt Advice in the UK
Wadia and Parkinson (2009), ‘The Capitalise Financial Capability Pilot Project Summary Evaluation Report’
Wallis (2005), ‘Advice and the best way of delivering it - Literature survey for the Financial Capability Generic Advice project’
Wells, Leston and Gostelow (2010), ‘The Impact of Independent Debt Advice Services on the UK Industry’
Williams (2007), Ministry of Justice Research unit, ‘Twelve months later: does advice help? The impact of debt advice – advice agency clients study’
Williams (2007), ‘Twelve months later: does advice help?’
Woods (2006), ‘Personal over-indebtedness in Northern Ireland’

Annex 1│ List of debt advice providers
London Economics
Debt Advice in the UK 75
Annex 1 List of debt advice providers
For the purpose of the present study, we undertook a web-sweep of debt advice providers, below is a list of providers and these are categorised as in the report. Therefore this is list is not comprehensive; it may exclude some organisations and particularly individuals that provide debt advice.
Table 3: Debt advice providers
Name of Provider
Commercial (fee-charging providers)
Paymex Group
Baines and Ernst
Blair Endersby
Buchanan Roxburgh
Baker Evans
Easycall finance
Freeman Jones
Debt Advisory Centre
Think Money (Gregory Pennington)
Debt Advisors Direct/Debt and You
Stand alone companies
Bridgewood Debt Solutions
Champion Finance
Clark Richards (Complete Money Limited)
Clear Debt Group (inc. Abacus Finance)
Clear Start
Curtis Faraday
Debt Advice Group (Debt Free Direct)
Debt Advice Line Ltd (Mitchell Farrar Group)
Debt Advice Now (Optimum 4 Limited)
Debt Help
Debtline (The Richmond Group )
DebtOptions.co.uk (Financial Management Limited)
Debt Release Direct (Release Money Limited)
Debt Support Trust
Debt Sure
Dissolve Debt
Eurodebt (Pentagon (UK) Limited)
Financial Helpline
First Debt Advice (Scotland)
Harrington Brooks

Annex 1│ List of debt advice providers
76
London Economics
Debt Advice in the UK
Lewis Alexander
McCambridge Duffy (debtadvice.co.uk)
Money Advice Group
Money Plus Group (Chiltern, The Debt People and Hamilton Locke)
Money Solve (Elizabeth Beesley)
MRA Debt Help Ltd
Nicon Debt Management
OB Financial Ltd (debtsolutions4me.co.uk)
Spencer Hayes
The Debt Advisor
Total Debt Solutions
Varden Nuttal
Vincent Bond &Co
Wilson Field
WRI Associates (Scotland)
Free-to-client providers:
Funded by public bodies:
Advice4debtni/Debt Action/Dealing with debt
Dawn Advice (Charity) - member of CAB
Citizens Advice Bureau (CAB)
Bristol Debt Advice Centre
Greater Merseyside Money Advice Partnership
Funded by private sector
Consumer Credit Counselling Service (CCCS)
Debt Advice Foundation (AdviceUK)
Payplan
Money Advice Trust
(National Debtline and Business Debtline)
Money Advice Service
Christians Against Poverty
Other – funding information not available
Bristol Debt Advice Centre (charity)
Debt Advice Network (charity)
Frontline Debt advice
Housing Associations
Affinity Sutton
Amicus Horizon
Circle 33 Housing Trust (Circle)
Hyde Group
Metropolitan Housing Partnership
Southern Housing Group
Wandle Housing Association
Signposting companies
Money Extra

Annex 1│ List of debt advice providers
London Economics
Debt Advice in the UK 77
Money Advice Scotland