Debit Card and Cash Usage: A Cross-Country Analysis;
53
Debit Card and Cash Usage: A Cross-Country Analysis Gene Amromin and Sujit Chakravorti Federal Reserve Bank of Chicago WP 2007-04
Transcript of Debit Card and Cash Usage: A Cross-Country Analysis;
Debit Card and Cash Usage: A Cross-Country Analysis Gene Amromin and Sujit Chakravorti
Fe
dera
l Res
erve
Ban
k of
Chi
cago
WP 2007-04

Debit Card and Cash Usage: A Cross-Country Analysis
Gene Amromin and Sujit Chakravorti
March 2007
Abstract During the last decade, debit card transactions grew rapidly in most advanced countries. While check usage declined and has almost disappeared in some countries, the stock of currency in circulation has not declined as fast. We use panel estimation techniques to analyze the change in transactional demand for cash resulting from greater usage of debit cards in 13 countries from 1988 to 2003. We are able to disentangle cash’s store of value function from its payment function by separating cash into three denomination categories. We find that the demand for low denomination notes and coins decreases as debit card usage increases because merchants need to make less change for customer purchases. On the other hand, the demand for high denomination notes is generally less affected suggesting that these denomination notes are also used for non-transactional purposes. Key words: payment networks, money demand, consumer choice, technological infrastructure JEL Classifications: D23, E41, G21 Amromin can be reached at [email protected] and Chakravorti can be reached at [email protected]. We thank Dick Porter for helpful discussions regarding currency usage. We thank Erin Davis, Tiffany Gates, Victor Lubasi, Tim McHugh, Sue Parren, and Stan Rabinovich for excellent research assistance. The views expressed are those of the authors and do not represent the views of the Federal Reserve Bank of Chicago or the Federal Reserve System.
1
In this article, we study the factors influencing the adoption of electronic payment
alternatives such as debit cards and their impact on cash usage. This area of research is relevant
for several reasons. First, greater usage of cash substitutes affects how much cash the central
bank should supply. Economists continue to debate the implications of a possible reduction in
currency demand for monetary policy (Buiter, 2005; Chakravorti, 2006; Freedman, 2000,
Friedman, 1999; Goodhart, 2000; Kroszner, 2003; Woodford, 2000). One consequence of lower
demand for cash is a decrease in seigniorage revenue. Humphrey, Kaloudis, and Øwre (2004)
view outstanding currency as interest-free loans and if there is a significant reduction in the
quantity of cash in circulation resulting from the use of alternative payment instruments, the
potential loan repayment would be very large. Second, some economists have suggested social
welfare would improve if fewer cash transactions occurred (De Grauwe, Buyst, and Rinaldi
2000; Van Hove, 2004a). However, whether the number of cash transaction has indeed declined
in recent years proved to be a tricky empirical question, owing to difficulties in separating cash’s
payment function from its store of value function. Third, the relationship between the
willingness of consumers and merchants to adopt non-cash payment alternatives and the pricing
of those payment instruments has attracted considerable research attention (Chakravorti and
McHugh, 2002; Humphrey, Pulley, and Vesala, 1996; Markose and Loke, 2002; Rochet and
Tirole, 2003). Any debate on the pricing of payment instruments should start with studying the
factors influencing the migration from cash to other payment media. Our analysis provides a
necessary first step to address these issues.
We discuss payment trends in thirteen countries—Austria, Belgium, Canada, Finland,
France, Germany, Italy, Japan, the Netherlands, Sweden, Switzerland, the United Kingdom, and
the United States—from 1988 to 2003. We find that in most countries, debit card usage has
increased significantly and check usage continues to decrease or has almost disappeared.
2
However, the aggregate demand for cash has not fallen drastically with widespread adoption of
non-cash payment instruments. Unlike other payment instruments, cash serves as a universally
accessible store of value in addition to being a payment medium. Thus, any analysis of the
impact of cash alternatives must first disentangle the two competing functions of cash. This task
is complicated further by the unique anonymity feature of cash, which is valued highly by those
trying to avoid detection by the public authorities. Cash transactions are more difficult to trace
to the transactors because it can be used multiple times without third-party intervention unlike
payment cards where each transaction is converted to good funds. Consequently, cash has an
enduring appeal for facilitating illicit transactions, as well as for storing ill-gotten (or, at least,
untaxed) wealth (Drehmann, Goodhart, and Krueger, 2002).
Our analysis differs from the existing literature in the following ways. First, we
decompose cash demand by currency denomination type to better identify the transactional
motive for cash holdings. Denominations larger than those commonly dispensed by a country’s
ATMs are posited to be better suited for store of value purposes. Although ATM-dispensed
banknotes form the bulk of transactional currency demand by volume, analysis of fluctuations in
such “medium-value” denominations presents a number of empirical challenges. In particular,
the rapid growth of ATM networks over the past two decades had a theoretically ambiguous
effect on observed quantities of medium-value notes in circulation. On the one hand, more
ATMs may have reduced the stock of such notes by lowering transaction costs of obtaining
them. On the other hand, the need to stock a larger number of ATMs with currency to be
dispensed may have generated the opposite effect. Consequently, medium-value banknotes
represent a noisy data source for establishing a relationship between the growth of alternative
payment instruments and cash demand. In contrast, the demand for smaller denomination notes
and coins is unaffected by secular changes in ATM networks. Rather, we argue that these forms

3
of cash capture the demand by merchants and other receivers of cash to make change for
purchases. Since change is given only in the case of cash transactions, changes in the stock of
small notes and coins provide a better gauge of fluctuations in transactional demand for
currency. Although other papers employed currency decomposition by denomination (see e.g.
Drehmann, Goodhart, and Krueger, 2002; Fischer, Köhler, and Seitz, 2004; and Porter and
Judson, 1996), we believe that ours is the first paper to attempt identification of cash demand
through its “trickling down” to change-making small denomination notes and coins.
Second, we employ different econometric techniques than those commonly used in this
literature to address strong serial correlation that is present when analyzing annual cross-country
payments data. We show that results depend importantly on the choice of the econometric
model. Finally, our data covers the time period of rapid growth in debit card usage in almost all
countries in the sample. That is, unlike many of the previous studies, we are able to analyze the
effect of accelerating and decelerating changes in debit card usage on cash demand.
Providers of debit card services must convince both consumers and merchants to use
them over existing and emerging payment alternatives. We find that enabling consumers to use
debit cards is not sufficient to increase their usage. The recent payments literature using a two-
sided market framework highlights the importance of having both sides—payors and payees—on
board (Armstrong, 2004; Rochet and Tirole, 2003). Consumers, for the most part unknowingly,
added debit cards to their wallets because they were mainly seen as devices to access cash and
make deposits at automated teller machines (ATMs) that became popular almost a decade before
widespread debit card usage. They were unable to use their cards to make purchases until
merchants adopted POS debit terminals. While adoption of payments technology by end-users
does not guarantee widespread usage, in the case of debit cards, we show that adoption of debit

4
card terminals by merchants was the critical step that led to the explosive growth in debit card
transactions.
Finally, we study the impact of debit card usage on the stock of currency and coin
outstanding. The impact of debit cards varies by currency denomination category. We find that
larger denomination notes are affected by the short-term interest rate but not by the adoption of
POS debit card terminals. However, both debit card infrastructure and financial institution
branch infrastructure significantly affects the demand for small denomination notes and coins
whereas the short-term interest rate has little effect. This result supports the hypothesis that
small denomination notes and coins are required to make change for purchases when cash is
used. If cash is not used, the demand for change and consequently the demand for small
denomination notes and coins both decrease. Because financial institutions are the main
distributors of small denomination notes and coins, less debit card usage requires a more
extensive branch network to distribute and collect small denomination notes and coins.
This article is organized as follows. In section 1, we discuss payment trends across the
countries in our sample. In section 2, we review the literature that analyzes the impact of
electronic payment alternatives on cash. We discuss the data in section 3 and analyze the key
factors driving the adoption of debit cards in section 4. In section 5, we focus on the relationship
between the adoption of debit cards and changes in the stock of cash, broken by denomination
categories. We offer some concluding remarks in section 6.
I. Cross-Country Payment Trend Comparisons
While there are major differences in banking and regulatory structures along with
differences in cultural attitudes toward payments between countries in our sample, certain
common payment trends exist. First, debit card usage grew rapidly during the 1990s in most
5
countries in our sample. In Figure 1, we plot debit card transactions over time by country. In
1988, all countries except for Finland had less than 10 debit card transactions per person per
year. By 2004, all countries except Japan had more than 10 transactions per person per year and
several had more than 60. The increase in debit card transactions suggests that the net benefits of
using debit cards have increased vis-à-vis other payment instruments for consumers and
merchants (assuming that the total number of transactions is growing at a slower rate than debit
card transactions.)
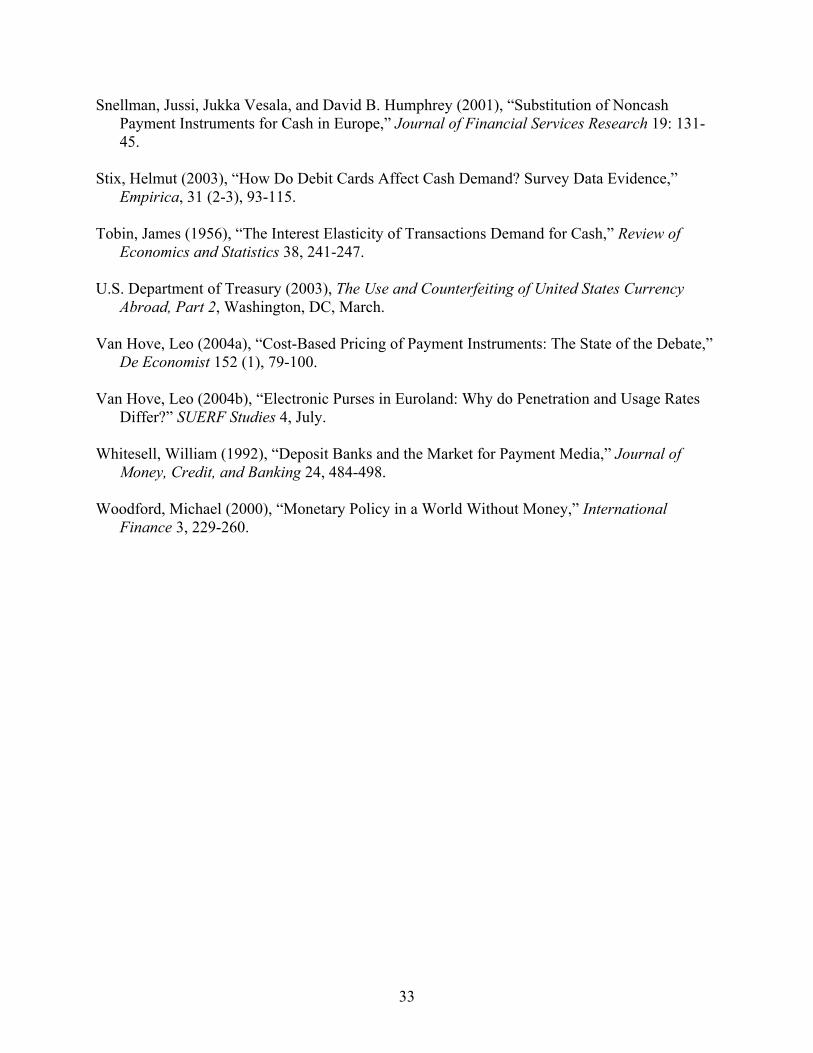
The second common trend is that check usage continues to decrease in most countries
and has disappeared in many countries. There are eight countries where on average less than two
checks per person were written in 2004 (see Table 1). Even in countries with a relatively high
number of check transactions such as Canada (43 checks/person), France (66 checks/person), the
United Kingdom (35 checks/person), and the United States (119 checks/person), check usage
continues to decline. Some studies find that debit cards have substituted for check transactions
(Borzekowski and Kiser, 2006 and Klee, 2006).
Third, cash has not disappeared from these countries although several cash substitutes
exist.1 While general-purpose stored-value cards have not been widely adopted, other general-
purpose payment instruments, e.g. credit and debit cards, can now be used for transactions in
environments that were until recently “cash only.”2 Mass transit and fast food restaurants
represent just two of the more ubiquitous industries where such switch took place. Some surveys
of merchants and consumers suggest that cash demand for transactions is decreasing in many
1 Originally, checks were a cash substitute. Humphrey (2004) reports that in addition to replacing cash transactions for consumer payments, employee disbursements, and smaller-value business purchases shortly after the Civil War, checks were used until 1915 for large-value business transactions and interbank transfers in the United States. 2 For more on the lack of widespread acceptance of general-purpose stored value, see Chakravorti (2004) and Van Hove (2004b). More recently, prepaid cards have become popular for certain applications such as gift giving and disbursement of payroll and government benefits in the United States. For more details, see Chakravorti and Lubasi (2006).

6
countries (American Bankers Association and Dove Consulting, 2005; Jyrkönen, 2004; Stix,
2003).
One metric to compare cash transactions across countries is the total per capita annual
non-cash transactions. Generally, greater use of non-cash payment instruments indicates a lesser
reliance on cash as a payment medium.3 The number of non-cash transactions per capita in 2004
(Table 1) ranges from 36 for Japan to 288 for the United States. Furthermore, non-cash
transactions have increased between 2001 and 2004 for all countries in our sample, suggesting a
reduction in cash transactions over time within a country.
Two measures of overall cash demand are cash holdings per capita and cash outstanding
to GDP ratio. However, these two measures are unable to distinguish between cash’s store of
value and payment functions. In Table 2, we compare countries by their per capita currency
holdings (in US dollars) and their ratio of the stock of currency to GDP in 1998.4 Currency per
capita ranges from $613 for Finland to $3,620 for Japan. Similarly, the currency to GDP ratio
ranges from .024 for Finland to .116 for Japan. For the most part, the ordering of countries is
similar for both “stock” measures of currency demand. The ordering is also consistent with the
“flow” measure of currency demand summarized in Table 1.5
Several researchers have noted that it is unlikely that the average individual in these
countries hold this much cash. Rogoff (1998) states that between 70 percent to 80 percent of
OECD currency stock is either held by the domestic underground economy or in developing
countries. In addition to household cash holdings, Rogoff argues that businesses (presumably
legal ones) are very efficient in cash management and are not likely to hold much cash in OECD 3 Humphrey, Pulley, and Vesala (1996) were the first, to our knowledge, to use this metric to compare cash usage across countries. 4 We chose 1998 to stay sufficiently far from the introduction of the euro in 2002 and the increase in Y2K precautionary supply in 1999 for some countries. 5 Germany, Switzerland, and the United States represent important exceptions, since a substantial share of the currency stock of these countries is estimated to be held abroad. We address this issue below.
7
countries. While it is difficult to measure underground activity, some estimates suggest that it is
sizable. Schneider (2006) estimates that the shadow economy in 21 OECD countries averaged
16.3 percent of GDP during the period 2002-2003. He states that the primary justification for
why transactions take place in the shadow economy is tax avoidance.
For certain countries, these measures overstate domestic cash usage because significant
holdings of their currencies are held outside their countries’ borders. U.S. dollars being held
outside of the United States have been estimated to be around 60 percent of total currency in
circulation (U.S. Department of Treasury, 2003).6 Prior to the introduction of the Euro in 2002,
up to forty percent of deutsche marks circulated outside of Germany (Seitz, 1995). Large
portions of Swiss francs are believed to be either held outside of Switzerland or held in safe
deposit banks inside the country (Boeschoten, 1992; Fischer, Köhler, and Seitz, 2004; and
Rogoff, 1998). Rogoff (1998) also suggests that a non-trivial amount of Japanese currency is
probably held outside of Japan but there is little hard evidence.
Several economists have attempted to quantify legal currency usage by studying
consumption patterns.7 For instance, Humphrey (2004) calculates total cash purchases as the
residual of personal consumption that is not captured by check, debit card, or credit card
registered transactions. Humphrey eliminates $50 and $100 notes from his estimation to better
gauge legal uses of currency. Humphrey estimates that cash share of legal consumer payments
fell from .31 in 1974 to .20 in 2000 in the United States.
For Sweden, Andersson and Guibourg (2001) estimated that cash payments in registered
sales (those for which value-added tax are collected) declined by 18 percent between 1991 and
1999. They suggest that almost all of the decline has been due to greater usage of payment
6 Lambert and Stanton (2001) and Porter and Judson (1996) discuss foreign demand of U.S. currency. 7 See Carbo Valverde, Humphrey, and Lopez del Paso (2003), Humphrey, Kaloudis, and Øwre (2004), and Snellman, Vesala, and Humprey (2001).

8
cards. However, they are unable to explain 45 percent to 65 percent of cash holdings. They
suggest that anonymity may be a critical factor in continued cash usage especially for
transactions that use the 1,000 Swedish krona note.8
II. Literature Review
The theoretical literature on money demand is quite large.9 Many models extend the
Baumol (1952)-Tobin (1956) model where interest rates, income, and the acquisition costs of
cash including shoe leather costs, determine the supply of money. Payment practices and
transactions costs are fundamental features of these models.10
This article best fits in the empirical literature that investigates changes in cash demand
resulting from the adoption of new payment infrastructure for cash or non-cash payment
alternatives. The empirical literature on cross-country payment usage continues to grow.
Extensive research in the area of Dutch currency usage and the adoption of alternative payment
media was done by Boeschoten (1992). He noted the difficulty in disentangling the transactional
use from other uses of currency, most notably hoarding. He found that adoption of credit cards
and “point-of-sale transactions” were responsible for 40 percent of the fall in currency ratio
between 1965 and 1975. However, this trend reversed from 1975 to 1990 indicating an increased
role for banknotes as a store of value. He estimates that 50 percent to 60 percent of the Dutch
currency was hoarded in 1990.
In addition to his study of Dutch money demand, Boeschoten estimated money demand
using a 15-country panel. He found significant hoarding in these countries as well. He was able
to predict future currency holdings based on the adoption of payment cards but not for all the
8 As of December 31, 2006, the Swedish krona/U.S. dollar rate was 6.85. 9 Duca and VanHoose (2004) reviews this literature. 10 For more recent models using an inventory approach, see Alvarez, Atkeson, and Edmond (2003).

9
countries in his sample. He also analyzed percentage of currency held by financial institutions
and found that on average 13 percent of currency outstanding is held by financial institutions for
the countries in his sample.
Humphrey, Pulley, and Vesala (1996) (henceforth HPV) studied the factors influencing
the migration to less costly payment alternatives such as debit cards and electronic and paper
giros. They looked at 14 countries for the time period from 1987 to 1993. They used five
regressions where the dependent variable was the annual transactions volume of one of the five
payment instruments (check, electronic or paper giro, credit card, and debit card). Their
independent variables included the prices of each payment instrument (only available for 10 of
the countries), real GDP, number of POS and ATM terminals, lagged volumes of the other
payment instruments, cash holdings per person, violent crime, and concentration ratio of the
largest five banks.
They found the following. The influence of prices was modest because often prices for
payment instruments did not vary much during their sample period and bundled across all
account services. POS and ATM terminals are strongly positively related to debit card usage
suggesting that similar infrastructure is used. They found that all payment instruments except for
debit cards substitute for cash. The institutional variables measuring crime and banking
concentration were not stable across different econometric models.
Unlike HPV, Drehmann, Goodhart, and Krueger (2002) (henceforth DGK) regress
aggregate cash holdings per capita on several macro variables (real GDP per capita, nominal
interest rates, and tax GDP ratio), two payment infrastructure variables (ATMs and POS
terminals), and crime. They divide currency into large bills (greater than 50 British pounds) and
small bills (less than 50 British pounds). Their rationale for this division is to separate illegal use
of cash from transactional use. While they get significant estimates for the coefficients for the
10
macro variables, they do not get significant results for the payment infrastructure variables or
crime.
Another approach to isolate the impact of debit cards on cash usage is to survey
individuals and their payment habits. While surveys of relatively small sample of individuals
over a small period of time has its limitations, these studies may help to explain the demand for
cash given payment alternatives from a microeconomic aspect that is not present in aggregate
studies of money demand. For Austria, Stix (2003) finds that those individuals that make
purchases frequently with debit cards on average hold 20 percent less cash in their wallets and
those that frequent ATMs hold 18 percent less cash in their wallets. For France, Bounie and
François (2006) find that transaction size, type of good and where the purchase is made are key
factors for the consumer choice of a payment instrument.11 They also find that cash and checks,
not surprisingly, are common when merchants do not accept payment cards. In addition, they are
able to confirm well-established demographic factors that determine payment usage such as age,
education, and gender.
III. Data
We employ three different data sources. For payment data, currency outstanding,
population, and banking infrastructure, we use the Bank for International Settlements’
Committee of Payment Settlement Systems’ Statistics on Payment and Settlement Systems in
Selected Countries (Red Book) and the European Central Bank’s Payment and Securities
Systems in the European Union (Blue Book).12 We also contacted several central banks for
clarification and to fill in some of the missing data. For short-term interest rates, foreign
11 For theoretical models that address the link between size of transaction and payment instrument, see Shy and Tarkka (2002) and Whitesell (1992). 12 We used the Blue Book for Austrian and Finnish data.

11
exchange rates, gross domestic product, and the ratio of self-employed to total employment, we
use the International Monetary Fund’s International Financial Statistics.
A key dependent variable in our regressions is the ratio of outstanding currency to GDP.
Cash outstanding includes holdings by businesses, individuals and financial institutions but
excludes cash held at central banks. For euro countries, we only consider the period from 1988
to 1999, which eliminates the last two pre-Euro years in which currency stocks (particularly
those of large-denomination notes) started to decline in anticipation of the regime switch. For
the other countries, the sample period is from 1988 to 2003.
For certain regressions, we divide cash outstanding/GDP into three categories— large,
medium, and small denominations. The Red and Blue books provide currency outstanding for
each note denominations and coin type. The medium denomination note category was chosen by
surveying the central banks of the respective countries to determine which denomination was
prevalently distributed by ATMs. Denominations above this threshold were categorized as large
denominations, while those below this threshold (including coins) were categorized as small
denominations.
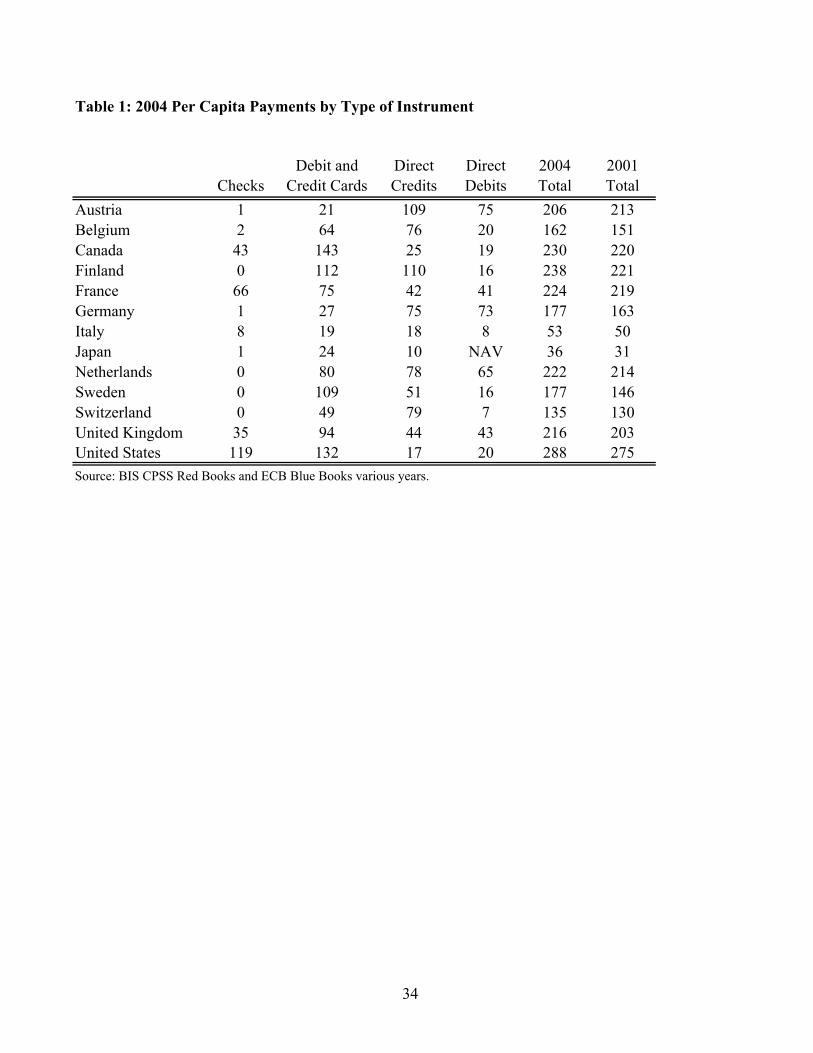
In some countries, only a single currency note is commonly distributed by ATMs (e.g.,
the $20 note in the United States). In other countries (e.g. Germany), ATMs routinely provide a
set of different denominations. In such cases, we categorize all of the ATM-distributed
denominations as medium. Table 3 summarizes the data on currency denominations and ATM
conventions in each of the countries in our sample. The large category includes denominations
above “medium” and small includes denominations below “medium” along with coins. If the
highest denomination is also the main denomination for ATM withdrawals (as is the case in
Japan with the ¥10,000 note), we categorize it as large. Other currency such as a US $2

12
banknote, commemorative or limited edition coins or banknotes were excluded from the
denomination data.
In several countries higher denomination coins were introduced during our sample
period, replacing, in some cases, paper notes of similar value. In these cases, we kept the coin
and note within the same denomination category. In addition, certain currency denominations
were replaced by new denominations. In these cases, we kept both new note and the old note
that it was replacing in the same category.
As mentioned in the introduction, Germany, Switzerland, and the United States have a
sizable fraction of their currencies held outside their countries’ borders. Since foreign holdings
are much less likely to be influenced by domestic cash and debit card infrastructure, we need to
adjust our cash measures. In the case of the United States, we use the Flow of Funds Accounts
series on currency holdings abroad. For Germany, we utilize the time series estimates of Fisher,
Kohler, and Seitz (2004).13 Data limitations prevent us from making any adjustments for Swiss
currency stocks.
The following variables were taken from the Red and Blue books: number of ATMs,
number of POS debit card terminals, number of debit cards, number of checks, and number of
bank branches. Each of these variables was normalized to per capita terms by dividing each
variable by the population of each country during that year with the exception of POS debit
terminals. POS debit terminals were normalized by 10,000 individuals.
As in any cross-country study, certain variables may not be defined consistently. For
example, definitions of debit cards vary somewhat across countries. Although “debit”
transactions are usually associated with nearly immediate withdrawal of funds, in some countries
(e.g. France) “debit” cards include those in which the funds may be withdrawn up to one month 13 Since holdings of domestic currency abroad are heavily concentrated in large denomination notes (Judson and Porter, 1996), we subtract the estimated foreign holdings from large denomination notes series for both Germany and the United States.
13
following the transaction. Because in most countries in our sample, PIN-based debit cards are
much more widely used than signature-based cards and data for PIN-based transactions are more
consistent, we focus on the usage of PIN-based debit cards. In most countries in our sample, all
debit cards are PIN-based.
IV. Adoption of Debit Cards
The ultimate goal of this paper is to understand the relationship between electronic cash
substitutes like debit cards and demand for currency. Observed debit card transactions appear to
be a good gauge of the extent to which such cards represent a viable alternative to cash.
However, using transactions data directly to explain fluctuations in cash demand presents two
empirical problems. The first problem is one of measurement. In several countries, reported
debit card transaction data are incomplete, in the sense that they only capture a part of debit card
payments. For instance, in the United States, signature debit card payments are executed over
credit card networks and do not consistently appear as a part of “debit” transactions. In some
cases, credit and debit card transactions are not separated, e.g. France. The second problem is
econometric. A flow measure of debit card use is an endogenous variable, in the sense that it is
influenced by the same factors that affect transactional cash demand. Some of these factors may
be unobserved or unavailable, making coefficient estimates on debit card transactions both
biased and inconsistent. One example of such an omitted factor is the cost of debit card use,
which clearly influences both cash and debit use in transacting payments.
To circumvent these problems to some extent, we rely on measures of debit card
infrastructure rather than usage, namely, the number of debit cards in circulation and the number
of debit card terminals. Both of these variables are measured more precisely, and are less likely
to be directly affected by omitted factors influencing cash usage. For example, the consumer

14
cost of a debit card transaction is less likely to be reflected in the number of debit card terminals
installed by merchants. Yet, it may offer a reasonable proxy of merchant expectations on debit
card use at the point of sale.
Instrumenting debit card usage by these infrastructure variables has an additional benefit
in that it allows us to study the factors influencing debit card adoption. In particular, we are
interested in whether consumer or merchant acceptance contributed to the takeoff of debit cards
and an alternative payment instrument. As mentioned before, debit and ATM functionality
usually reside on the same card. Therefore, many debit cards were held by consumers before
they were able to use them to make purchases. On the other hand, merchant acceptance was
contingent on the expectation that debit cards would be used if terminals were installed and the
net benefits of accepting debit cards were greater than accepting alternative payment media.
Clearly, a key factor in deciding to accept debit cards is the cost of doing so. Recently,
economists have applied two-sided market analysis to payment cards to study pricing of payment
services.14 The literature on two-sided markets stresses that the proportion of the total price paid
by each end-user group need not be symmetric to achieve optimal usage levels. In fact, many
two-sided markets have asymmetric pricing between end-users such as newspapers (readers and
advertisers), Adobe Acrobat (creators and readers of PDF files), and dating clubs (women may
be let in at a reduced price and men pay a higher fee).
For the most part, consumers do not pay per-transaction debit card fees.15 Although there
may be a bundled fee for a transaction account, once that is paid the marginal cost to use a debit
card is close to zero. In most instances, merchants that accept debit cards face fixed and per-
14 For more on two-sided markets, see Armstrong (2004) and Rochet and Tirole (2003). 15 There are some exceptions. While not common, a few U.S. merchants impose surcharges on PIN-based debit transactions (Chakravorti and Shah, 2003). In addition, some U.S. financial institutions impose per-transaction fees for PIN-based debit card transactions.

15
transaction fees.16 While we do not have pricing data, we can compare adoption of debit cards
by consumers and merchants by looking at the number of debit cards and debit terminals,
respectively.
Table 4 presents data on the number of debit terminals per 10,000 individuals along with
debit cards/person in 2003.17 Countries in our sample that have high debit card usage also
generally have high card adoption by consumers and high adoption of terminals by merchants.
However, this relationship is far from uniform. For instance, Italy has relatively few debit cards
per capita despite having a high number of debit terminals. Also noteworthy is that while Japan
has three times as many debit cards in circulation as residents, the adoption of debit terminals is
the lowest in our sample. Thus, both debit terminals and debit cards are required for a high
number of debit card transactions.
To study the evolution of debit card usage within a country, we use a fixed effects
econometric model with clustered standard errors. Specifically, our regression is:
Debit Transactionsit = α + β1 Debit Cardsit + β2 Debit Terminalsit + β3 ATMsit + β4 Checksit (1)
+ β5 Bank Branchesit + β6 Share of Self-Employedit + β7 STIRit + εit
Using the country fixed effects specification means that we are effectively trying to
explain changes in debit card acceptance in a given country by changes in debit card
infrastructure and in control variables. These control variables are intended to capture
competitive pressures from other payment instruments (cash and checks), as well as the costs of
facilitating debit card transactions.
16 Van Hove (2004b) reports that merchants in Denmark do not pay any per-transaction fees when accepting debit cards. 17 Canada is an exception, as the number of debit cards there was last reported in 2000.
16
To lessen endogeneity concerns mentioned above, we use measures of the extent of cash
infrastructure to proxy for cash “competitiveness.” These measures are the number of ATMs
and bank branches. The relationship between debit card usage and ATM is ambiguous because
greater usage of ATMs may encourage greater comfort with card payments. On the other hand, a
greater number of ATMs allows easier access to cash and may lead to greater dependence on
cash for payments. Similarly, more bank branches suggest lower acquisition costs of cash,
thereby encouraging greater reliance on cash. For alternative paper-based payment
infrastructure, we include check volumes. Many U.S. studies have suggested that debit cards
substitute for checks. In countries that use checks, we would expect a negative relationship
between debit card and check transactions.
The cost of facilitating debit card transactions depends, in part, on merchant size
distribution. In particular, smaller merchants would be more reluctant to invest in debit card
terminals because their transaction volume may not recover the fixed cost. This is especially the
case if such merchants still have to accept cash and still incur cash handling costs. Thus, to
capture the extent to which merchants can rely on economies of scale in debit card terminal
acquisition, we look at the country- and time-specific share of small merchants. One proxy for
such measure is provided by the ratio of the self-employed to total employment. In Table 5, we
report these ratios for 1998. Note that Italy, Austria, and Japan are near the bottom in debit card
transactions and are the top three in terms of proportion of self-employed to total employment.
While fixed effect panel estimation does not allow analysis of the cross-sectional relationships,
we use this variable to control for consolidation in the retail industry. A more traditional
measure of cost of debit card use is their opportunity cost relative to non-interest-bearing
payment instruments such as cash. To the extent that demand deposit accounts linked to debit

17
cards generate a positive (albeit low) nominal rate of return, we would expect the number of
debit card transactions to rise with short-term interest rates.
All variables in (1) are in logarithms with subscripts i and t indicating, respectively, an
observation in country i in year t. The number of debit card transactions, debit cards in
circulation, ATMs, checks written, and bank branches is expressed in per capita terms, while the
number of point-of-sale debit card terminals is defined in units per 10,000 residents.18 The Share
of Self-Employed is based on the IMF annual employment composition data for each country,
and STIRit is defined as the short-term interest rate in country i in year t.
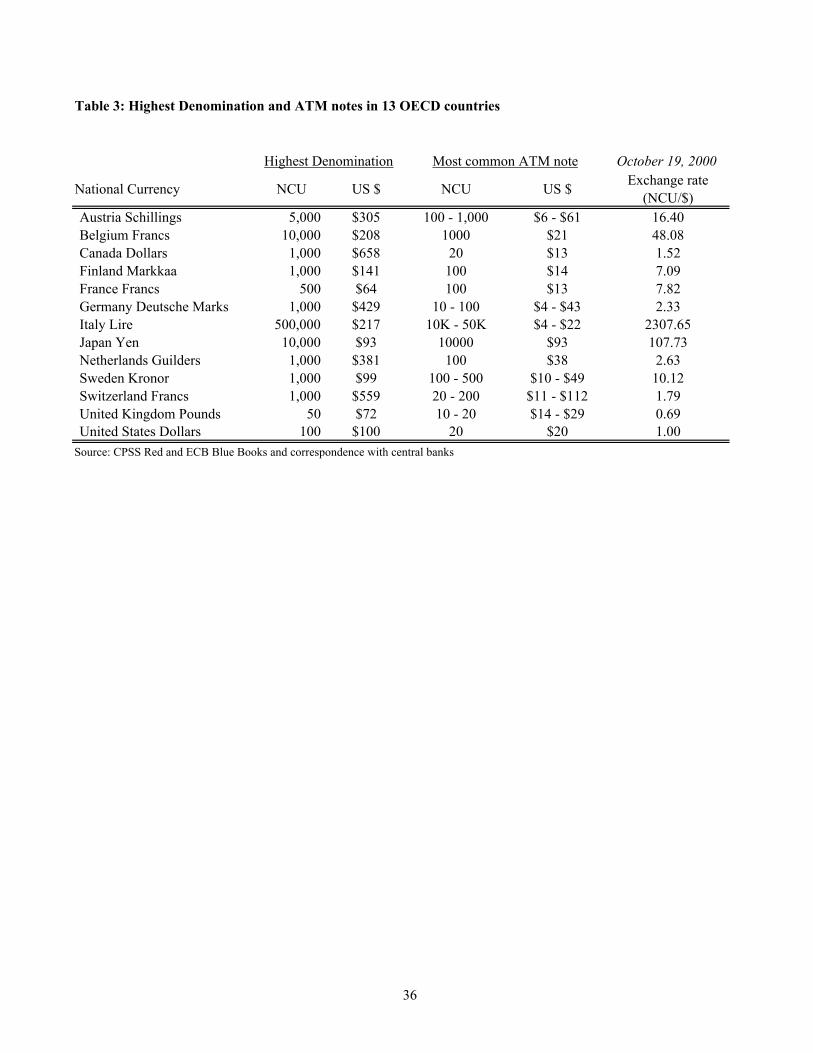
In Table 6, we report our regression results. Shading indicates coefficient estimates that
are statistically significant at least at the 5 % level. In regression (1) (column 1 in Table 6), the
only variable proxying for debit card infrastructure is the number of debit cards, which is found
to be a strong indicator of greater debit card use. In this specification, the number of ATMs also
has a significant positive effect on debit card transactions, while checks detract from debit card
usage. The sign on self-employed is opposite from what we expected, as is that on the short-
term interest rate.
However, these results are sensitive to a specific measure of debit card infrastructure. In
regression (2) that uses the number of debit card terminals, none of the control variables (with
the exception of the short-term interest rate) retains statistical significance. This result persists
when both debit card terminals and cards are used in the regressions (column 3 in Table 6).
Moreover, in that specification only the number of debit card terminals remains a strong
predictor of debit card usage. Taken together, these results suggest that merchant adoption is
driving debit card usage, and that the number of debit card terminals is indeed a strong
instrument for transactional demand for debit cards.
18 Check data prior to 2001 does not exist for the United States.
18
V. Debit Cards and Cash Substitution
In this section, we study the impact on the cash/GDP ratio resulting from changes in
payment infrastructure, merchant size distribution and the opportunity cost of holding cash. We
assume that central banks provide an elastic supply of currency. Therefore, supply of cash
equals demand for cash. All countries in our sample had their own currencies until 2002 when
the Euro was introduced. Austria, Belgium, Finland, France, Germany, Italy, and the
Netherlands are part of the euro area and have not issued their own currencies since 2002.
Canada, Japan, Sweden, Switzerland, the United Kingdom, and the United States maintained
their own national currencies throughout the sample period. Initially, we consider the total stock
of cash outstanding for each country, but later we segment cash into large, medium and small
denomination classes to isolate cash’s payment function.
We plot a time series of currency to GDP ratios in figure 2. The ratio was decreasing for
most countries throughout the 1970’s and much of the 1980’s, but flattened out for most
countries since then reflecting, in part, successful stabilization of inflation. A number of
geopolitical shocks that occurred since 1988 had a measurable effect on demand of certain
currencies. In particular, the unification of Germany and disintegration of Yugoslavia resulted in
increased demand for Deutsche marks, while the collapse of the Soviet Union greatly increased
the demand for U.S. dollars (Fisher, Kohler, and Seitz, 2004; U.S. Department of Treasury,
2003). The increased demand for Japanese yen is partly attributable to an extremely low or
negative inflation environment over the past 15 years.
We will econometrically test a money demand equation where the demand for money is a
function of alternate payment infrastructure, cash infrastructure, proportion of small merchants,
and the opportunity cost of money. We use the following econometric specification:

19
(Currency/GDP)it = α + β1 Debit Card Terminalsit + β2 ATMsit + β3 Bank Branchesit (2)
+ β4 Share of Self-Employedit + β5 STIRit + εit
The currency-to-GDP ratio is a convenient metric of money demand. First, it has a
simple theoretical interpretation as the inverse of money velocity. Second, normalization by
GDP allows us to analyze developments in multiple countries without worrying about exchange
rate movements. The ratio is also likely to be stationary, although the short time dimension of
our data does not allow us to take advantage of this time series property. Our definition of
currency includes the outstanding stock of notes and coins. For euro countries, we only consider
the period from 1988 to 1999, which eliminates the last two pre-Euro years in which currency
stocks (particularly those of large-denomination notes) started to decline in anticipation of the
regime switch. For the other countries, the sample period is from 1988 to 2003.19
The vector of explanatory variables is fairly parsimonious, necessitated by a relatively
small dataset and the econometric design that relies on fixed effects estimation. The standard
money demand variables that capture shoe-leather and opportunity costs of cash are
complemented with a measure of competing payment instruments.
As argued in the previous section, the number of debit card terminals at the point of sale
is a strong instrument for the demand for debit card transactions that likely substitute for some
cash transactions.20 In Figure 3, we provide a cross-country snapshot in 1998 of the relationship
between currency/GDP ratio and the number of debit terminals. In general, countries with a high
number of debit card terminals tend to have lower currency/GDP ratios suggesting broadly that
debit cards may be substituting for cash transactions.
19 As a consequence, we have an unbalanced panel in which non-euro countries are over-represented. 20 Debit cards could substitute for other non-cash transactions as well. If debit cards substituted for only non-cash transactions, the demand for cash would not be affected by debit card transactions.

20
For cash infrastructure (or shoe-leather cost factors), we use the number of ATMs and the
number of bank branches per capita. ATMs are a predominant source of cash in all the countries
that we study, but the relationship between cash usage and ATMs is ambiguous. On the one
hand, greater number of ATMs potentially increase the velocity of cash as consumers can access
cash more easily. Hence, more ATMs would imply lower currency stocks.
However, the relationship between ATMs and cash may be changing over time
depending on debit card usage at the point of sale. Initially, the introduction of ATMs increases
the demand of cash of which a part is in response to filling ATMs with cash by ATM operators.
In other words, a decrease in demand for cash by individuals is offset by increased demand to fill
ATMs which may require idle cash especially if they are not serviced daily. The demand by
ATM operators for cash may be greater than the reduction of cash holdings by consumers
especially when the number of ATMs and transactions are increasing.21 Once the number of
ATMs has stabilized and/or the amount of withdrawals per machine decreases resulting from
greater usage of debit cards, the demand for cash by ATM operators would fall.22
We use the number of branches of financial institutions as a measure for cash access
especially for non-ATM dispensed notes and coin. While payers may not mind withdrawing
notes of only certain denominations, receivers of cash need to have different denominations on
hand to make change. As a result, branches of financial institutions play a key role in disbursing
currency of varying denominations to consumers and especially merchants. As in the case of the
ATMs, a more extensive branching network may either lower day-to-day cash holdings by
21 ATM owners may overstock their machines since they face reputational harm if their machines do not have cash when customers arrive. Furthermore, in some countries, ATM fees compensate ATM who have excess cash in their machines. 22 Snellman and Viren (2006) argue that ATMs can be used as a strategic tool to entice consumers to use non-cash electronic payment instruments especially when there is market power in the banking sector.

21
merchants (i.e. increase velocity) or increase overall cash holdings through filling more bank
vaults or by lowering the costs of, say, converting paychecks to cash.23
The share of self-employed in total employment is a proxy for the proportion of small
merchants in an economy. We expect a positive relationship between cash and the self-
employed. Smaller merchants are generally slower in adopting newer payment technologies
because it takes longer to recover fixed costs and may face higher per-transaction costs. Having
a more atomistic employment structure may also be associated with lower levels of tax
compliance, which would also involve greater use of cash. The second column of Table 5 lists
the size of shadow economies for the countries in our sample, as estimated in Schneider (2006).
A simple comparison of the two columns in Table 5 suggests a positive association between the
self-employed share and shadow economy size (ρ=0.5). Finally, the opportunity cost of holding
cash is measured by the short-term interest rate. As before, all variables are in logarithms, with
debit card terminals, ATMs, and bank branches normalized by population.
All Currency
In Table 7, we report results for a number of different econometric specifications. In
addition to the variables described above, we add a Y2K dummy to capture any increase in
currency stock resulting from the Y2K concerns in 1999. As before, statistical significance at
the 5% level or better is indicated by shading.
In the first column, we report our results using a pooled OLS regression, which treats
cross- and within-country effects as interchangeable. We find that a 10 percent increase in the
number of debit card terminals per capita (which is a much lower rate of growth than that
realized, on average, in our sample countries) results in a 1.2 percent decrease in the
currency/GDP ratio. We also find that the number of bank branches positively affects the 23 However, we would expect the demand for cash by merchants would make the relationship between cash and bank branches lean in one direction.

22
demand for currency, as does the share of self-employed. As expected, the short-term interest
rate is negatively related to cash holdings.
Pooled OLS regressions applied to country panel can be problematic for two reasons.
First, they do not differentiate between changes within and between countries. Second, they fail
to take into account substantial serial correlation within individual countries. Thus, OLS
standard errors may be severely biased, leading to incorrect statistical interpretation of the results
(Petersen, 2006). Given large differences across countries exemplified, for instance, in Tables 1-
3, we use a country fixed effects (FE) specification. As a consequence, we focus on whether
within-country changes in the explanatory variables affect country-specific changes in currency
demand.
While our coefficient estimates are significantly lower when employing a fixed effect
econometric specification, the coefficients on debit terminals, bank branches, and short-term
interest rates remain statistically significant. The coefficient on the self-employed share falls
from .15 to .02 and is no longer significant. However, in the FE specification, the number of
ATMs is negatively correlated with currency stock, with a 10 percent increase in ATMs resulting
in a 0.4 percent decrease in the currency to GDP ratio.
The fixed effects approach addresses the second econometric problem – within-country
serial correlation – only if country-specific effects are constant over time. A simple analysis of
residuals from the FE regression suggests that this is not the case. Consequently, we consider
two alternative methods of correcting our estimates. First, we assume that error terms εit are
first-order autocorrelated. Second, we compute clustered standard errors (Rogers, 1993), which
allow an arbitrary temporal dependency pattern within each country (Petersen, 2006). We
employ clustered standard errors both with the FE estimator and the random-effects (RE)
23
estimator. The latter augments FE estimates with information on mean differences across
countries.
The results of these three models, shown in columns (3)-(5) of Table 7, highlight both the
importance of accounting for within-country serial correlation and the sensitivity of results to a
specific choice of how to do this. In particular, while the effect of debit card terminals on
currency demand is negative in all three specifications, it loses statistical significance in a simple
FE model with cluster-adjusted standard errors (column 3).24 Making correlation adjustments
also eliminates any identifiable effect of ATM infrastructure as well as that of the self-employed
share. Only the short-term interest rates—the cornerstone of money demand models—retains
statistical significance in every specification.
In sum, the results of fixed effects estimation differ substantially from those of pooled
OLS regressions, particularly if necessary serial correlation adjustments are made. Again, this
gives rise to two possibilities—measurement error and model misspecification.
We entertain the first possibility by restricting the sample to countries that do not have
substantial foreign demand for their currency. Although we try to account for the foreign
component of demand for the U.S. dollars and the Deutsche marks (see section III), these
adjustments may be rather imperfect. And since all of the explanatory variables are domestic,
the foreign demand component still left in the dependent variable would obscure the relationship.
Panel B of Table 7 shows the results for the sample of 10 OECD countries that exclude
Germany, Switzerland, and the United States. Pooled OLS estimates from the truncated sample
are quite similar to those from the full sample. Interestingly, there is now much more persistence
in statistical significance of the estimates across specifications. We estimate a consistently
negative effect of debit card terminals on currency demand (although it is still weaker than that
24 Note that, by construction, making the clustering adjustment by itself leaves FE point estimates unchanged.
24
estimated with pooled OLS). The share of self-employed is estimated to have a positive effect
on currency demand in 3 out of 4 specifications that include country fixed effects (columns 2-4).
Denomination-specific regressions
By aggregating all currency denominations along with coins, the different roles of money
may not be distinguishable. Consequently, in this subsection we categorize currency into three
groups—large, medium, and small. Unlike DGK (2002), the goal of our categorization is to
isolate transactional and store of value roles of currency. Our priors are that large denominations
are primarily used for store of value and affected by short-term interest rates while small
denominations and coins are used for transactional purposes and affected by the usage of other
payment instruments such as debit cards.
Using ATM-distributed denominations as the “medium-threshold,” we define large and
small denomination categories as described in section III. While the ATM-dispensed banknotes
form the bulk of transactional currency demand by volume, they represent a potentially noisy
data source for identifying links between the growth of alternative payment instruments and cash
demand. We expect smaller denomination notes and coins to be a good gauge of the changing
needs of merchants and other receivers of cash to make change for purchases. Since change is
given only in the case of cash transactions, changes in the stock of small notes and coins likely
provide the most accurate reflection of fluctuations in transactional demand for currency.25
There are several additional benefits from partitioning the currency by denomination.
Since the bulk of foreign currency demand is limited to large denominations, we expect the
small- and medium-notes demand estimates to be more stable across samples (e.g. panels A and
25 In the United States, some merchants, such as grocery stores, are willing to give cash back to their debit card customers. This service is analogous to cash back received for checks, a common means to acquire cash in the 1980s. Some analysts have suggested that these merchants provide cash back services to reduce their cash handling costs. However, this practice is not widespread for the countries in our sample.

25
B in Table 7). Moreover, by isolating ATM-distributed currencies we attempt to provide a more
precise estimate on what we term the ATM demand factor. As argued above, the effect of ATM
on currency demand is ambiguous and existing empirical studies produce conflicting results.
Finally, if the share of self-employed affects currency demand by facilitating black market
activity, we would expect to identify a relationship for the large denomination category.26 If, on
the contrary, the self-employed stay away from electronic payments for cost reasons, we would
expect to find an effect on demand for small denominations.
The following table summarizes our null hypotheses for denomination-specific models:
Smaller denominations & coins
ATM-dispensed denominations
Larger denominations
Debit card terminals <0 ? ~0 ATM access ~0 ? ~0 Bank access ? ~0 ?
Self-employed >0 if fixed costs ~0 if tax evasion
? ~0 if fixed costs >0 if tax evasion
The “~0” notation indicates the null of no identifiable effect. A confirmation of this
hypothesis for ATM and bank access variables would serve as additional evidence of the
appropriateness of our currency categorization. That is, ATM density should affect only ATM-
distributed categories, and bank density should have an effect only on bank-distributed
categories.
Table 8 shows the results of fitting a country fixed effects model with cluster-adjusted
standard errors to each denomination category. We chose FE-clustered specification since its
non-parametric formulation gives us a chance to get standard errors right without making strong
assumptions. It is also the only model in which debit terminals had no statistically identifiable
26 Arguably, even the lemonade stand operator wishing to avoid tax payments would at some point have to convert coins and small denomination notes it collects for larger notes suitable for storing wealth or transacting.
26
effect on total currency demand in the full sample (see panel A of Table 7). Thus, it sets a
somewhat higher hurdle for the denomination-specific exercise.
Panel A of Table 8 contains full sample estimates. As expected, debit card terminals
have a very strong negative effect on demand for small denominations, but not on that for
medium or large denominations. Also, the ATM infrastructure is found to affect only the ATM-
dispensed medium category. This effect is fairly precisely identified (p-value of 0.04) and is
negative, indicating that, on net, ATM proliferation lowers the stock of ATM-dispensed notes.
The bank branch infrastructure has a significant (and positive) effect only on bank-distributed
denominations – i.e. those that cannot typically be obtained from ATMs. The ratio of self-
employed is influential only for small denomination demand, consistent with the hypothesis of
high fixed costs of installing electronic payments terminals for small merchants.
Interestingly, we fail to find a statistically measurable effect of short-term interest rates
on disaggregated currency demand. Even the large denomination notes, which in their role as
store of value should reflect the opportunity costs of currency holdings, have at best a marginally
significant effect (p-value of 0.11). However, to the extent that the full sample does not account
fully for foreign currency holdings, the estimated response to fluctuations in domestic short-term
rates may be muted. Thus, we repeat the exercise on the truncated sample that excludes
Germany, Switzerland, and the U.S.
Panel B of Table 8 presents the results for the truncated sample. This time, there is a very
strong and precisely identified effect of changes in short-term interest rates on changes in large-
denomination currency holdings. Importantly, all other results are very similar to those obtained
for the full sample, corroborating the expectation of more stable coefficient estimates across
samples.
27
To check for robustness regarding the dividing lines between the denomination classes,
we also run our regressions using DGK’s classification. We use 50 British pounds as the cutoff
between large and medium. This results in the large denomination category becoming smaller
while the medium category becomes larger. The small denomination category is the same as our
original one. To compare with DGK, we also report results for a category that combines the
medium and small classes.
In panel A of Table 9, we report the results of our regressions. For the large
denomination category, the coefficient on short-term interest rate is now significant in the full
sample. Because the large classification is narrower, it is more likely that these notes are used as
a store of value instead for a medium of exchange. The effect of ATMs is now being picked up
in the large, and not the medium denomination category. Debit terminals are estimated to
dampen the demand for both small and medium denomination notes, although the effect on
medium notes is identified much less precisely. In the category where small and medium
denominations are combined, only the coefficient on debit terminals is significant (and negative),
suggesting that the medium notes are masking the impact of branches and the self-employed
ratio.
For completeness, we show the same set of regressions without Germany, Switzerland,
and the United States in panel B of Table 9. For the large denomination category, ATMs are no
longer significant but are now significant for the medium category. Interestingly, the estimated
ATM sign on the new “medium” specification is now negative. The results for the combined
medium and small category in the truncated sample are still negatively related to the number of
debit card terminals.

28
VI. Conclusion
In the 1990s, the usage of debit cards increased rapidly in all of the countries in our
sample with the exception of Japan. Our empirical results suggest that the adoption of POS debit
terminals by merchants was the key factor in the explosive growth in debit card usage. This
suggests that both consumers and merchants generally prefer debit cards to other payment
alternatives for certain types of transactions.
Despite the strong growth in the adoption of electronic payment instruments particularly
debit cards, cash usage remains significant in most OECD countries suggesting that electronic
alternatives have not succeeded in mimicking all the benefits of cash. For example, the
anonymity feature of cash is particularly beneficial for tax evasion or illegal transactions and is a
key factor for the continued demand for large denomination notes.
As we have noted, the effect of electronic payment instruments on cash usage has been
studied by several researchers. However, previous studies have not been able to capture a
significant effect of debit cards on cash demand using country panel estimation. A key feature of
our econometric model is the ability to disentangle cash’s dual roles—store of value and
payment media. We are able to isolate the transactional role of cash by focusing on the small
denomination class which we define as currency and coin that is lower in value than that
dispensed by ATMs. The demand for these notes and coins is driven by purchases requiring
merchants to make change. In contrast, electronic substitutes are able to reduce the demand for
small denomination notes and coins because no change is required for these transactions. Our
regression results suggest that the adoption of debit card terminals has reduced the demand for
cash in small denomination notes and coin.
Our empirical results suggest that electronic alternatives to cash will indeed reduce the
demand for cash of certain denominations. However, the general demand for cash will continue
29
to be strong in the future because of cash’s anonymity and store of value features. In addition,
greater usage of OECD currencies in many emerging economies will result in a shift from
domestic money demand in the country of currency issuance to money demand by residents in
other countries. However, only certain OECD currencies are likely to play this role, e.g. U.S.
dollar and the euro. The foreign demand for these currencies may decrease as the adoption of
electronic instruments proliferates globally.
30
References:
Andersson, Martin and Gabriela Guibourg (2001), “The Use of Cash in the Swedish Economy,” Sveriges Riksbank Economic Review 4, 28-37.
American Bankers Association and Dove Consulting (2005), 2005/2006 Study of Consumer
Payment Preferences. Armstrong, Mark (2004), “Competition in Two-Sided Markets,” Mimeo, University College
London. Alvarez, Fernando, Andrew Atkeson, and Chris Edmond (2003), “On the Sluggish Response of
Prices to Money in an Inventory-Theoretic Model of Money Demand,” NBER Working Paper No. 10016, October.
Baumol, William J. (1952), “Transactions Demand for Cash: An Inventory Theoretic Approach,”
Quarterly Journal of Economics 66, 545-556. Boeschoten, Willem C. (1992), Currency Use and Payment Patterns, Financial and Monetary
Policy Studies, vol. 23, Dordrecht/Boston/London: Kluwer Academic Publishers. Borzekowski, Ron and Elizabeth K. Kiser (2006), “The Choice at the Checkout: Competition
Among Payment Instruments,” FEDS Working Paper, 2006-17. Bounie, David and Abel François (2006), “Cash, Check or Bank Card?: The Effects of
Transaction Characteristics on the Use of Payment Instruments,” Telecom Paris Working Papers in Economics and Social Sciences ESS-06-05.
Buiter, Willem H. (2005), “New Developments in Monetary Economics: Two Ghosts, Two
Eccentricities, a Fallacy, a Mirage and a Mythos,” The Economic Journal 115, C1-C31. Carbo Valverde, Santiago, David B. Humphrey, and Rafael Lopez del Paso (2003), “The Falling
Share of Cash Payments in Spain,” Moneda y Credito 217, 167-190 Chakravorti, Sujit (2004), “Why Has Stored Value Not Caught On?” Journal of Financial
Transformation 12, 39-48. Chakravorti, Sujit (2006), “The Evolving Payments Landscape and its Implications for Monetary
Policy,” in Institutional Change in the Payments System and Monetary Policy, ed Stefan W. Schmitz and Geoffrey Wood, London: Routledge, 81-92.
Chakravorti, Sujit and Victor Lubasi (2006), “Payment Instrument Choice: The Case of Prepaid
Cards,” Federal Reserve Bank of Chicago Economic Perspectives 30 (2), 29-43. Chakravorti, Sujit and Timothy McHugh (2002), “Why Do We Use so Many Checks?” Federal
Reserve Bank of Chicago Economic Perspectives 26 (3), 44-59.

31
Chakravorti, Sujit and Alpa Shah (2003), “Underlying Incentives in Credit Card Networks,” The
Antitrust Bulletin, 58 (1), 53-75. Committee on Payment and Settlement Systems (various years), Statistics on Payment and
Settlement Systems in Selected Countries, Basle, Switzerland. De Grauwe, Paul, Erik Buyst, and Laura Rinaldi (2000), “The Costs of Cash and Cards
Compared: The Cases of Iceland and Belgium,” mimeo. Drehmann, Mathias, Charles Goodhart, and Malte Krueger (2002), “The Challenges Facing
Currency Usage: Will the Traditional Transaction Medium be able to Resist Competition from new Technologies?,” Economic Policy, April, 195-227.
Duca, John V. and David D. VanHoose (2004), “Recent Developments in Understanding the
Demand for Money,” Journal of Economics and Business 56, 247-272. European Central Bank (various years), Payment and Securities and Settlement Systems in the
European Union, Frankfurt, Germany. Fischer, B., P. Kohler, and F. Seitz (2004), “The Demand for Euro Area Currencies: Past,
Present, and Future,” European Central Bank Working Paper Series, N. 330. Freedman, Charles (2000), “Monetary Policy Implementation: Past Present and Future—Will the
Advent of Electronic Money Lead to the Demise of Central Banking?” International Finance 3 (2), 211-227.
Friedman, Benjamin M. (1999), “The Future of Monetary Policy: The Central Bank as an Army
with Only a Signal Corps?” International Finance 2 (3), 321-338. Goodhart, Charles A. E. (2000), “Can Central Banking Survive the IT Revolution?”
International Finance 3 (2), 189-209 Humphrey, David B. (2004), “Replacement of Cash by Card in U.S. Consumer Payments,”
Journal of Economics and Business 56, 211-225 Humphrey, David B., Aris Kaloudis, and Grete Øwre (2004), “The Future of Cash: Falling Legal
Use and Implications for Government Policy,” Journal of International Financial Markets, Institutions, and Money 14, 221-233.
Humphrey, David B., Lawrence B. Pulley, Jukka M. Vesala (1996), “Cash, Paper, and Electronic
Payments: A Cross-Country Analysis,” Journal of Money, Credit, and Banking 28 (4), part 2, 914-939.
International Monetary Fund (various years), International Financial Statistics, Washington,
DC.
32
Jyrkönen, Hanna (2004), “Less Cash on the Counter—Forecasting Finnish Payment
Preferences,” Bank of Finland Discussion Papers 27/2004. Klee, Elizabeth (2006), “Families’ Use of Payment Instruments During a Decade of Change in
the U.S. Payment System,” Federal Reserve Board Finance and Economics Discussion Series 2006-02.
Kroszner, Randall S. (2003), “Currency Competition in the Digital Age," ed. D. Altig and B. D.
Smith, Evolution and Procedures in Central Banking, New York: Cambridge University Press, 275-299.
Lambert, Michael J. and Kristin D. Stanton (2001), “Opportunities and Challenges for the U.S.
Dollar as an Increasingly Global Currency: A Federal Reserve Perspective,” Federal Reserve Bulletin, September, 567-575.
Markose, Sheri M. and Yiing Jia Loke (2002), “Can Cash Hold Its Own? International
Comparisons: Theory and Evidence,” University of Essex, mimeo. Petersen, Mitchell (2006), “Estimating Standard Errors in Finance Panel Data Sets: Comparing
Approaches,” Northwestern University, working paper. Porter, Richard D. and Ruth A. Judson (1996), “The Location of US Currency: How Much is
Abroad?,” Federal Reserve Bulletin, October, 883-903. Rochet, Jean-Charles and Jean Tirole (2003), “Platform Competition in Two-Sided Markets,”
Journal of European Economic Association 1 (4), 990-1029. Rogers, W.H. (1993), “Regression Standard Errors in Clustered Samples,” Stata Technical
Bulletin 13, 19-23. Rogoff, Kenneth (1998), “Blessing or Curse? Foreign and Underground Demand for Euro
Notes,” Economic Policy 26, 263-290. Schneider, Friedrich (2006), “Shadow Economies and Corruption All Over the World: What Do
We Really Know?,” IZA Discussion Paper No. 2315, September. Seitz, F (1995), “The Circulation of the Deutsche Mark Abroad,” Deutsche Bundesbank working
paper. Shy, Oz and Juha Tarkka (2002), “The Market for Electronic Cash Cards,” Journal of Money,
Credit and Banking 34, 299-314. Snellman, Heli and Matti Viren (2006), “ATM Networks and Cash Usage,” mimeo.
33
Snellman, Jussi, Jukka Vesala, and David B. Humphrey (2001), “Substitution of Noncash Payment Instruments for Cash in Europe,” Journal of Financial Services Research 19: 131-45.
Stix, Helmut (2003), “How Do Debit Cards Affect Cash Demand? Survey Data Evidence,”
Empirica, 31 (2-3), 93-115. Tobin, James (1956), “The Interest Elasticity of Transactions Demand for Cash,” Review of
Economics and Statistics 38, 241-247. U.S. Department of Treasury (2003), The Use and Counterfeiting of United States Currency
Abroad, Part 2, Washington, DC, March. Van Hove, Leo (2004a), “Cost-Based Pricing of Payment Instruments: The State of the Debate,”
De Economist 152 (1), 79-100. Van Hove, Leo (2004b), “Electronic Purses in Euroland: Why do Penetration and Usage Rates
Differ?” SUERF Studies 4, July. Whitesell, William (1992), “Deposit Banks and the Market for Payment Media,” Journal of
Money, Credit, and Banking 24, 484-498. Woodford, Michael (2000), “Monetary Policy in a World Without Money,” International
Finance 3, 229-260.
ChecksDebit and
Credit CardsDirect Credits
Direct Debits
2004 Total
2001 Total
Austria 1 21 109 75 206 213Belgium 2 64 76 20 162 151Canada 43 143 25 19 230 220Finland 0 112 110 16 238 221France 66 75 42 41 224 219Germany 1 27 75 73 177 163Italy 8 19 18 8 53 50Japan 1 24 10 NAV 36 31Netherlands 0 80 78 65 222 214Sweden 0 109 51 16 177 146Switzerland 0 49 79 7 135 130United Kingdom 35 94 44 43 216 203United States 119 132 17 20 288 275Source: BIS CPSS Red Books and ECB Blue Books various years.
Table 1: 2004 Per Capita Payments by Type of Instrument
34

Table 2: Cash Holdings (USD) per Capita and Currency/GDP in 1998
Country Currency/Capita Currency/GDPFinland 613 0.024United Kingdom 738 0.03Canada 806 0.039France 847 0.034Sweden 1226 0.044Italy 1251 0.06Netherlands 1311 0.053Belgium 1365 0.056Austria 1677 0.064United States 1850 0.059Germany 1875 0.072Switzerland 3408 0.091Japan 3620 0.116Source: BIS CPSS Red Books and ECB Blue Books various years.
35
October 19, 2000
National Currency NCU US $ NCU US $ Exchange rate (NCU/$)
Austria Schillings 5,000 $305 100 - 1,000 $6 - $61 16.40Belgium Francs 10,000 $208 1000 $21 48.08Canada Dollars 1,000 $658 20 $13 1.52Finland Markkaa 1,000 $141 100 $14 7.09France Francs 500 $64 100 $13 7.82Germany Deutsche Marks 1,000 $429 10 - 100 $4 - $43 2.33Italy Lire 500,000 $217 10K - 50K $4 - $22 2307.65Japan Yen 10,000 $93 10000 $93 107.73Netherlands Guilders 1,000 $381 100 $38 2.63Sweden Kronor 1,000 $99 100 - 500 $10 - $49 10.12Switzerland Francs 1,000 $559 20 - 200 $11 - $112 1.79United Kingdom Pounds 50 $72 10 - 20 $14 - $29 0.69United States Dollars 100 $100 20 $20 1.00
Source: CPSS Red and ECB Blue Books and correspondence with central banks
Highest Denomination Most common ATM note
Table 3: Highest Denomination and ATM notes in 13 OECD countries
36

Table 4: Debit Terminals/10,000 Residents and Debit Cards per Capita in 2003*
Country Debit Terminals/10000 Debit Cards per CapitaJapan 1.57 3.06Germany 6.01 1.10Austria 9.03 1.02Belgium 10.96 1.33Switzerland 11.16 0.83Netherlands 11.53 1.34Sweden 12.17 0.63United States 13.23 0.89Canada 14.24 1.17United Kingdom 14.54 1.06Italy 16.14 0.49France 16.63 0.74Finland 17.66 0.79*For Canada, 2000 figures are taken because more recent figures are not availableSource: CPSS Red and ECB Blue Books
37

Country Self-employed ratio
(1998)Shadow Economy as % of official GDP
(1999)France 7.70 15.2United States 7.94 8.7Sweden 8.33 19.2Germany 10.19 16Finland 12.18 18.1United Kingdom 12.88 12.7Switzerland 13.61 8.6Netherlands 14.82 13.1Canada 17.26 16Belgium 17.40 22.2Japan 17.60 11.2Austria 20.76 9.8Italy 34.47 27.1Source: IMF and shadow economy estimates are from Schneider (2006)
Table 5: Self-employed to Total Employment Ratio
38
Dependent variable: log (debit card volume/pop) 1 2 3log(Debit Card Number/pop) 0.67 0.12
4.81 -0.53
log(Debit Card Terminals/pop) 0.99 0.917.25 5.13
log(ATM/pop) 1.32 0.25 0.253.19 1.67 1.33
log(Checkvol/pop) -0.51 0 -0.03(-3.72) 0.02 (-0.23)
log(Bank branches/pop) 1.78 0.17 0.251.64 (0..29) 0.45
log(Ratio of self-employed) 38.58 9.56 14.272.25 -1.03 1.29
log(Short-term interest rate) -13.9 -4.78 -4.97(-2.81) (-2.04) (-1.88)
constant -12.51 -5.94 -7.06
N 182 187 182
Goodness-of-fit measure 0.94 0.97 0.97
Table 6: Debit Card Adoption
39

Panel A: 13 OECD countries, pre-Euro if applicableCorrections for country-level serial correlation
Dependent variable: log (currency stock / GDP ratio) Pooled OLS
Fixed Effects (FE)
FE with cluster-adjusted SE
FE with AR(1) errors
RE with cluster-adjusted SE
log(Debit terminals/pop) -0.12 -0.02 -0.02 -0.05 -0.03(-10.3) (-2.19) (-1.43) (-3.47) (-2.32)
log(ATMs/pop) -0.05 -0.04 -0.04 0.06 -0.01(-1.3) (-2.13) (-1.34) (1.69) (-0.29)
log(Bank branches/pop) 0.46 0.30 0.30 0.11 0.36(9.52) (5.78) (4.17) (1.58) (5.68)
log(Ratio of self-employed) 0.15 0.02 0.02 0.14 0.14(3.77) (0.32) (0.15) (1.02) (1.26)
log(Short-term interest rate) -0.30 -0.07 -0.07 -0.03 -0.09(-10.5) (-4.27) (-3.18) (-2.09) (-4.05)
Y2K dummy 0.01 0.04 0.04 0.09 0.04(0.19) (1.3) (1.8) (7.23) (1.86)
constant 2.04 1.82 1.82 1.46 1.61
N 169 169 169 156 169adj. R2 within R2 within R2 within R2 overall R2
Goodness-of-fit measure 0.67 0.31 0.31 0.36 0.57
Panel B: 10 OECD countries, pre-Euro if applicable; exclude Germany, Switzerland,and US as countries with a large share of currency abroad or out of circulation.
Corrections for country-level serial correlation
Dependent variable: log (currency stock / GDP ratio) Pooled OLS
Fixed Effects (FE)
FE with cluster-adjusted SE
FE with AR(1) errors
RE with cluster-adjusted SE
log(Debit terminals/pop) -0.12 -0.02 -0.02 -0.07 -0.04(-8.45) (-2.68) (-2.04) (-4.12) (-2.79)
log(ATMs/pop) -0.13 -0.03 -0.03 0.04 -0.01(-3.07) (-1.78) (-1.09) (1.11) (-0.24)
log(Bank branches/pop) 0.26 0.35 0.35 0.23 0.35(3.56) (7.4) (4.51) (2.63) (4.42)
log(Ratio of self-employed) 0.23 0.22 0.22 0.33 0.33(4.89) (2.13) (1.00) (2.08) (2.31)
log(Short-term interest rate) -0.31 -0.09 -0.09 -0.03 -0.12(-9.67) (-4.89) (-4.36) (-2.05) (-4.64)
Y2K dummy 0.00 0.04 0.04 0.07 0.03(-0.02) (1.2) (1.71) (5.47) (1.63)
constant 1.61 1.33 1.33 1.01 1.11
N 128 128 128 118 128adj. R2 within R2 within R2 within R2 overall R2
Goodness-of-fit measure 0.71 0.43 0.43 0.39 0.52
Table 7: Various Econometric Models of Simple Currency Demand
40

Large: greater than ATM-dispensedOriginal classification Medium: ATM-dispensed notes
Low: less than ATM-dispensed notes+coin
Panel A: 13 OECD countries, pre-Euro if applicable note: same as alt.
Dependent variable: Large/GDP Medium/GDP Small/GDPlog(Debit terminals/pop) 0.00 0.03 -0.04
(-0.16) (0.88) (-3.69)log(ATMs/pop) -0.03 -0.24 0.00
(-0.29) (-2.25) (0)log(Bank branches/pop) 0.42 0.21 0.27
(2.53) (1.04) (2.91)log(Ratio of self-employed) -0.34 0.29 0.32
(-1.12) (1.3) (3.16)log(Short-term interest rate) -0.06 -0.04 -0.02
(-1.65) (-1.57) (-1.46)Y2K dummy 0.02 0.02 0.00
(0.34) (0.73) (-0.12)constant -2.57 -4.95 -5.81
N 169 169 169within R2 within R2 within R2
Goodness-of-fit measure 0.07 0.21 0.66
Panel B: 10 OECD countries, pre-Euro if applicable; exclude Germany, Switzerland,and US as countries with a large share of currency abroad or out of circulation.
Dependent variable: Large/GDP Medium/GDP Small/GDPlog(Debit terminals/pop) -0.03 0.03 -0.04
(-1.13) (1.15) (-3.21)log(ATMs/pop) 0.05 -0.27 0.00
(0.78) (-2.75) (0.09)log(Bank branches/pop) 0.47 0.26 0.30
(2.56) (1.29) (2.97)log(Ratio of self-employed) 0.22 0.24 0.40
(0.88) (0.54) (2.69)log(Short-term interest rate) -0.13 -0.03 -0.03
(-5.24) (-0.76) (-1.59)Y2K dummy 0.05 0.00 -0.01
(1.63) (-0.01) (-0.48)constant -3.81 -5.00 -6.07
N 128 128 128adj. R2 within R2 within R2
Goodness-of-fit measure 0.26 0.46 0.64
logarithm of
logarithm of
Table 8: Denomination-specific currency demand: FE model with cluster-adjusted SEs
41

Large: greater than 50 GBPAlternative classification Medium: ATM-dispensed notes if less than 50GBP
Low: less than ATM-dispensed notes+coin
Panel A: 13 OECD countries, pre-Euro if applicable
Dependent variable: Large/GDP Medium/GDP Small/GDP (Medium+Small)/GDPlog(Debit terminals/pop) 0.06 -0.06 -0.04 -0.06
(1.44) (-2.01) (-3.69) (-2.3)
log(ATMs/pop) -0.26 0.12 0.00 0.09(-1.99) (1.4) (0) (1.34)
log(Bank branches/pop) 0.56 -0.18 0.27 -0.10(2.31) (-0.95) (2.91) (-0.64)
log(Ratio of self-employed) -0.19 -0.04 0.32 0.04(-0.53) (-0.19) (3.16) (0.21)
log(Short-term interest rate) -0.09 0.02 -0.02 0.02(-2.2) (0.62) (-1.46) (0.77)
Y2K dummy 0.04 0.04 0.00 0.03(0.65) (1.73) (-0.12) (1.62)
constant -3.42 -3.78 -5.81 -3.66
N 169 169 169 169within R2 within R2 within R2 within R2
Goodness-of-fit measure 0.11 0.21 0.66 0.26
Panel B: 10 OECD countries, pre-Euro if applicable; exclude Germany, Switzerland,and US as countries with a large share of currency abroad or out of circulation.
Dependent variable: Large/GDP Medium/GDP Small/GDP (Medium+Small)/GDPlog(Debit terminals/pop) 0.04 -0.07 -0.04 -0.06
(0.93) (-2.58) (-3.21) (-2.89)
log(ATMs/pop) -0.22 0.15 0.00 0.12(-1.86) (2.18) (0.09) (2.05)
log(Bank branches/pop) 0.60 -0.17 0.30 -0.10(2.27) (-0.91) (2.97) (-0.59)
log(Ratio of self-employed) 0.26 0.36 0.40 0.38(0.71) (1.58) (2.69) (2.07)
log(Short-term interest rate) -0.13 -0.03 -0.03 -0.02(-4.05) (-1.13) (-1.59) (-0.97)
Y2K dummy 0.10 0.01 -0.01 0.00(1.62) (0.3) (-0.48) (0.24)
constant -4.53 -4.82 -6.07 -4.53
N 128 128 128 128within R2 within R2 within R2 within R2
Goodness-of-fit measure 0.27 0.26 0.64 0.28
logarithm of
logarithm of
Table 9: Denomination-specific currency demand: FE model with cluster-adjusted SEs
42
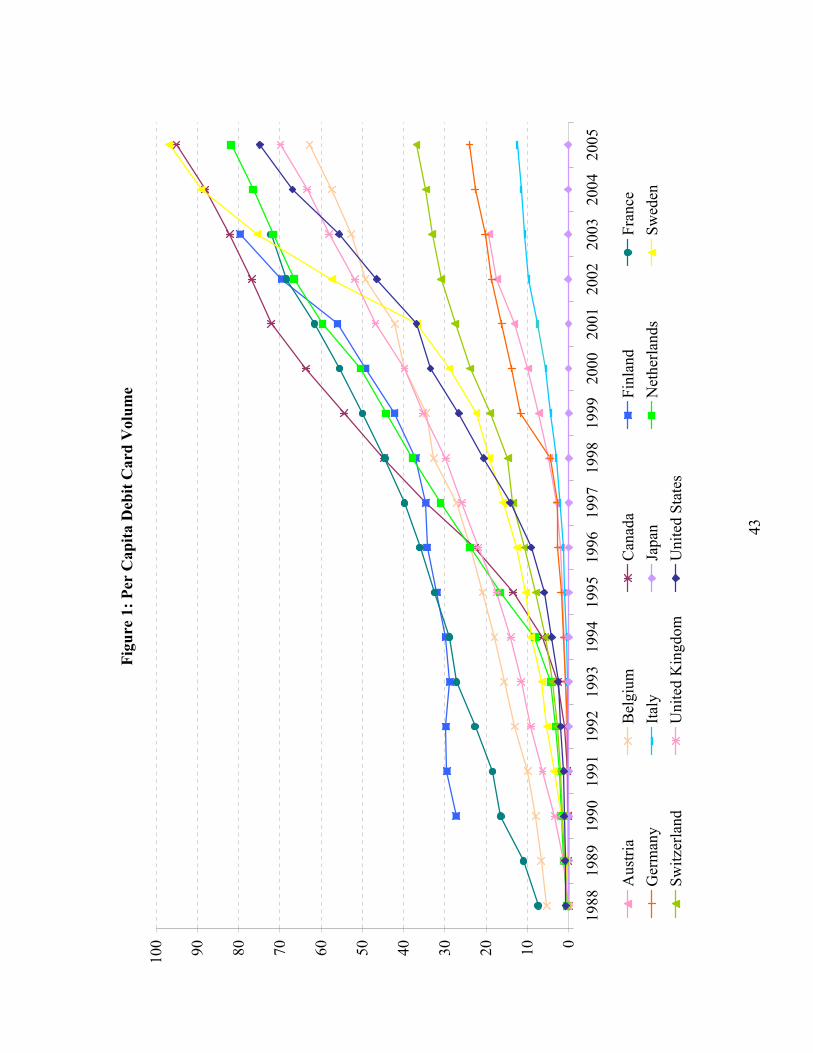
43
Figu
re 1
: Per
Cap
ita D
ebit
Car
d V
olum
e
0102030405060708090100
1988
1989
1990
1991
1992
1993
1994
1995
1996
1997
1998
1999
2000
2001
2002
2003
2004
2005
Aus
tria
Bel
gium
Can
ada
Finl
and
Fran
ceG
erm
any
Italy
Japa
nN
ethe
rland
sSw
eden
Switz
erla
ndU
nite
d K
ingd
omU
nite
d St
ates

44
Figu
re 2
: Cur
renc
y H
oldi
ngs/
GD
P
0
0.02
0.04
0.06
0.080.1
0.12
0.14
0.16
0.18
1970
1975
1980
1985
1990
1995
2000
2005
Aus
tria
Bel
gium
Can
ada
Finl
and
Fran
ceG
erm
any
Italy
Japa
nN
ethe
rland
sSw
eden
Uni
ted
Kin
gdom
Uni
ted
Stat
esSw
itzer
land

45
Figu
re 3
: Cur
renc
y/G
DP
and
Deb
it T
erm
inal
s/10
00 In
divi
dual
s (19
98)
AU
BE
CA
FI
FR
DE
IT
JP
NL
SE
SWI
UK
US
0
0.02
0.04
0.06
0.080.1
0.12
0.14
02
46
810
1214
1
Working Paper Series
A series of research studies on regional economic issues relating to the Seventh Federal Reserve District, and on financial and economic topics.
Standing Facilities and Interbank Borrowing: Evidence from the Federal Reserve’s WP-04-01 New Discount Window Craig Furfine Netting, Financial Contracts, and Banks: The Economic Implications WP-04-02 William J. Bergman, Robert R. Bliss, Christian A. Johnson and George G. Kaufman Real Effects of Bank Competition WP-04-03 Nicola Cetorelli Finance as a Barrier To Entry: Bank Competition and Industry Structure in WP-04-04 Local U.S. Markets? Nicola Cetorelli and Philip E. Strahan The Dynamics of Work and Debt WP-04-05 Jeffrey R. Campbell and Zvi Hercowitz Fiscal Policy in the Aftermath of 9/11 WP-04-06 Jonas Fisher and Martin Eichenbaum Merger Momentum and Investor Sentiment: The Stock Market Reaction To Merger Announcements WP-04-07 Richard J. Rosen Earnings Inequality and the Business Cycle WP-04-08 Gadi Barlevy and Daniel Tsiddon Platform Competition in Two-Sided Markets: The Case of Payment Networks WP-04-09 Sujit Chakravorti and Roberto Roson Nominal Debt as a Burden on Monetary Policy WP-04-10 Javier Díaz-Giménez, Giorgia Giovannetti, Ramon Marimon, and Pedro Teles On the Timing of Innovation in Stochastic Schumpeterian Growth Models WP-04-11 Gadi Barlevy Policy Externalities: How US Antidumping Affects Japanese Exports to the EU WP-04-12 Chad P. Bown and Meredith A. Crowley Sibling Similarities, Differences and Economic Inequality WP-04-13 Bhashkar Mazumder Determinants of Business Cycle Comovement: A Robust Analysis WP-04-14 Marianne Baxter and Michael A. Kouparitsas The Occupational Assimilation of Hispanics in the U.S.: Evidence from Panel Data WP-04-15 Maude Toussaint-Comeau
2
Working Paper Series (continued) Reading, Writing, and Raisinets1: Are School Finances Contributing to Children’s Obesity? WP-04-16 Patricia M. Anderson and Kristin F. Butcher Learning by Observing: Information Spillovers in the Execution and Valuation WP-04-17 of Commercial Bank M&As Gayle DeLong and Robert DeYoung Prospects for Immigrant-Native Wealth Assimilation: WP-04-18 Evidence from Financial Market Participation Una Okonkwo Osili and Anna Paulson Individuals and Institutions: Evidence from International Migrants in the U.S. WP-04-19 Una Okonkwo Osili and Anna Paulson Are Technology Improvements Contractionary? WP-04-20 Susanto Basu, John Fernald and Miles Kimball The Minimum Wage, Restaurant Prices and Labor Market Structure WP-04-21 Daniel Aaronson, Eric French and James MacDonald Betcha can’t acquire just one: merger programs and compensation WP-04-22 Richard J. Rosen Not Working: Demographic Changes, Policy Changes, WP-04-23 and the Distribution of Weeks (Not) Worked Lisa Barrow and Kristin F. Butcher The Role of Collateralized Household Debt in Macroeconomic Stabilization WP-04-24 Jeffrey R. Campbell and Zvi Hercowitz Advertising and Pricing at Multiple-Output Firms: Evidence from U.S. Thrift Institutions WP-04-25 Robert DeYoung and Evren Örs Monetary Policy with State Contingent Interest Rates WP-04-26 Bernardino Adão, Isabel Correia and Pedro Teles Comparing location decisions of domestic and foreign auto supplier plants WP-04-27 Thomas Klier, Paul Ma and Daniel P. McMillen China’s export growth and US trade policy WP-04-28 Chad P. Bown and Meredith A. Crowley Where do manufacturing firms locate their Headquarters? WP-04-29 J. Vernon Henderson and Yukako Ono Monetary Policy with Single Instrument Feedback Rules WP-04-30 Bernardino Adão, Isabel Correia and Pedro Teles
3
Working Paper Series (continued) Firm-Specific Capital, Nominal Rigidities and the Business Cycle WP-05-01 David Altig, Lawrence J. Christiano, Martin Eichenbaum and Jesper Linde Do Returns to Schooling Differ by Race and Ethnicity? WP-05-02 Lisa Barrow and Cecilia Elena Rouse Derivatives and Systemic Risk: Netting, Collateral, and Closeout WP-05-03 Robert R. Bliss and George G. Kaufman Risk Overhang and Loan Portfolio Decisions WP-05-04 Robert DeYoung, Anne Gron and Andrew Winton Characterizations in a random record model with a non-identically distributed initial record WP-05-05 Gadi Barlevy and H. N. Nagaraja Price discovery in a market under stress: the U.S. Treasury market in fall 1998 WP-05-06 Craig H. Furfine and Eli M. Remolona Politics and Efficiency of Separating Capital and Ordinary Government Budgets WP-05-07 Marco Bassetto with Thomas J. Sargent Rigid Prices: Evidence from U.S. Scanner Data WP-05-08 Jeffrey R. Campbell and Benjamin Eden Entrepreneurship, Frictions, and Wealth WP-05-09 Marco Cagetti and Mariacristina De Nardi Wealth inequality: data and models WP-05-10 Marco Cagetti and Mariacristina De Nardi What Determines Bilateral Trade Flows? WP-05-11 Marianne Baxter and Michael A. Kouparitsas Intergenerational Economic Mobility in the U.S., 1940 to 2000 WP-05-12 Daniel Aaronson and Bhashkar Mazumder Differential Mortality, Uncertain Medical Expenses, and the Saving of Elderly Singles WP-05-13 Mariacristina De Nardi, Eric French, and John Bailey Jones Fixed Term Employment Contracts in an Equilibrium Search Model WP-05-14 Fernando Alvarez and Marcelo Veracierto Causality, Causality, Causality: The View of Education Inputs and Outputs from Economics WP-05-15 Lisa Barrow and Cecilia Elena Rouse
4
Working Paper Series (continued) Competition in Large Markets WP-05-16 Jeffrey R. Campbell Why Do Firms Go Public? Evidence from the Banking Industry WP-05-17 Richard J. Rosen, Scott B. Smart and Chad J. Zutter Clustering of Auto Supplier Plants in the U.S.: GMM Spatial Logit for Large Samples WP-05-18 Thomas Klier and Daniel P. McMillen Why are Immigrants’ Incarceration Rates So Low? Evidence on Selective Immigration, Deterrence, and Deportation WP-05-19 Kristin F. Butcher and Anne Morrison Piehl Constructing the Chicago Fed Income Based Economic Index – Consumer Price Index: Inflation Experiences by Demographic Group: 1983-2005 WP-05-20 Leslie McGranahan and Anna Paulson Universal Access, Cost Recovery, and Payment Services WP-05-21 Sujit Chakravorti, Jeffery W. Gunther, and Robert R. Moore Supplier Switching and Outsourcing WP-05-22 Yukako Ono and Victor Stango Do Enclaves Matter in Immigrants’ Self-Employment Decision? WP-05-23 Maude Toussaint-Comeau The Changing Pattern of Wage Growth for Low Skilled Workers WP-05-24 Eric French, Bhashkar Mazumder and Christopher Taber U.S. Corporate and Bank Insolvency Regimes: An Economic Comparison and Evaluation WP-06-01 Robert R. Bliss and George G. Kaufman Redistribution, Taxes, and the Median Voter WP-06-02 Marco Bassetto and Jess Benhabib Identification of Search Models with Initial Condition Problems WP-06-03 Gadi Barlevy and H. N. Nagaraja Tax Riots WP-06-04 Marco Bassetto and Christopher Phelan The Tradeoff between Mortgage Prepayments and Tax-Deferred Retirement Savings WP-06-05 Gene Amromin, Jennifer Huang,and Clemens Sialm Why are safeguards needed in a trade agreement? WP-06-06 Meredith A. Crowley
5
Working Paper Series (continued) Taxation, Entrepreneurship, and Wealth WP-06-07 Marco Cagetti and Mariacristina De Nardi A New Social Compact: How University Engagement Can Fuel Innovation WP-06-08 Laura Melle, Larry Isaak, and Richard Mattoon Mergers and Risk WP-06-09 Craig H. Furfine and Richard J. Rosen Two Flaws in Business Cycle Accounting WP-06-10 Lawrence J. Christiano and Joshua M. Davis Do Consumers Choose the Right Credit Contracts? WP-06-11 Sumit Agarwal, Souphala Chomsisengphet, Chunlin Liu, and Nicholas S. Souleles Chronicles of a Deflation Unforetold WP-06-12 François R. Velde Female Offenders Use of Social Welfare Programs Before and After Jail and Prison: Does Prison Cause Welfare Dependency? WP-06-13 Kristin F. Butcher and Robert J. LaLonde Eat or Be Eaten: A Theory of Mergers and Firm Size WP-06-14 Gary Gorton, Matthias Kahl, and Richard Rosen Do Bonds Span Volatility Risk in the U.S. Treasury Market? A Specification Test for Affine Term Structure Models WP-06-15 Torben G. Andersen and Luca Benzoni Transforming Payment Choices by Doubling Fees on the Illinois Tollway WP-06-16 Gene Amromin, Carrie Jankowski, and Richard D. Porter How Did the 2003 Dividend Tax Cut Affect Stock Prices? WP-06-17 Gene Amromin, Paul Harrison, and Steven Sharpe Will Writing and Bequest Motives: Early 20th Century Irish Evidence WP-06-18 Leslie McGranahan How Professional Forecasters View Shocks to GDP WP-06-19 Spencer D. Krane Evolving Agglomeration in the U.S. auto supplier industry WP-06-20 Thomas Klier and Daniel P. McMillen Mortality, Mass-Layoffs, and Career Outcomes: An Analysis using Administrative Data WP-06-21 Daniel Sullivan and Till von Wachter
6
Working Paper Series (continued) The Agreement on Subsidies and Countervailing Measures: Tying One’s Hand through the WTO. WP-06-22 Meredith A. Crowley How Did Schooling Laws Improve Long-Term Health and Lower Mortality? WP-06-23 Bhashkar Mazumder Manufacturing Plants’ Use of Temporary Workers: An Analysis Using Census Micro Data WP-06-24 Yukako Ono and Daniel Sullivan What Can We Learn about Financial Access from U.S. Immigrants? WP-06-25 Una Okonkwo Osili and Anna Paulson Bank Imputed Interest Rates: Unbiased Estimates of Offered Rates? WP-06-26 Evren Ors and Tara Rice Welfare Implications of the Transition to High Household Debt WP-06-27 Jeffrey R. Campbell and Zvi Hercowitz Last-In First-Out Oligopoly Dynamics WP-06-28 Jaap H. Abbring and Jeffrey R. Campbell Oligopoly Dynamics with Barriers to Entry WP-06-29 Jaap H. Abbring and Jeffrey R. Campbell Risk Taking and the Quality of Informal Insurance: Gambling and Remittances in Thailand WP-07-01 Douglas L. Miller and Anna L. Paulson Fast Micro and Slow Macro: Can Aggregation Explain the Persistence of Inflation? WP-07-02 Filippo Altissimo, Benoît Mojon, and Paolo Zaffaroni Assessing a Decade of Interstate Bank Branching WP-07-03 Christian Johnson and Tara Rice Debit Card and Cash Usage: A Cross-Country Analysis WP-07-04 Gene Amromin and Sujit Chakravorti