DEAL NOTESM&A and Investments Review for the...
18
DEAL NOTES M&A and Investments Review for the Marketing, Media, Technology and Service Industries Securities offered through Petsky Prunier Securities, LLC 1H12 Marketing, Media, Technology and Service Industries Announced 1,481 Transactions Totaling $78.3 Billion; Social and Mobile Subsegments Accounted for 22 Percent of Activity and 10 Percent of Value Digital Media/Commerce was the Most Active Segment in 1H12 with 515 Transactions; Software & Information was the Highest Value Segment with $31.8 Billion in Deal Value During the first half of 2012, Petsky Prunier tracked 1,481 transactions for a total of $78.3 billion across seven broad segments: Digital Advertising, Agency/Consulting, Marketing Technology, Digital Media/Commerce, Software & Information, Out-of-Home & Specialty Media and Marketing Services. e Social and Mobile subsegments within the broader Agency/Consulting, Digital Advertising, Digital Media/Commerce and Marketing Technology segments together accounted for 22 percent of total activity and 10 percent of value. Digital Media/Commerce was the most active segment overall, with continued technology and market shifts driving ongoing demand for eCommerce and Social Media/Apps. In addition, growing adoption of cloud-based software resulted in Software & Information being the highest transaction value segment in the first half of the year. IN THIS ISSUE Overview of M&A and Investment Activity 1 Big Data’s Big Opportunities and Challenges 3 Hyper-Local Marketing Evolves Beyond Daily Deals 4 Mobile Growth Drives Increasing Need for Data Security 5 Segment Analysis: Digital Advertising 6 Agency/Consulting 7 Marketing Technology 8 Digital Media/Commerce 9 Software & Information 10 Marketing Services 11 Out-of-Home & Specialty Media 12 Recent Transactions 18 About Petsky Prunier 18 (Continued on page 2) Software & Information $31,873 Marketing Services $1,477 Marketing Technology $13,405 Digital Advertising $3,341 Digital Media/ Commerce $13,556 Out-of-Home & Specialty Media $7,770 Agency/ Consulting $6,861 MARKETING, MEDIA, TECHNOLOGY AND SERVICE INDUSTRIES 1H12 M&A AND INVESTMENT ACTIVITY ($ in Millions) $25.9 $42.0 $47.9 $30.6 $42.1 $36.2 1Q11 2Q11 3Q11 4Q11 1Q12 2Q12 787 DEAL VOLUME 825 796 DOLLAR VALUE 709 772 MARKETING, MEDIA, TECHNOLOGY AND SERVICE INDUSTRIES 1Q11-2Q12 M&A AND INVESTMENT ACTIVITY ($ in Billions) 686
Transcript of DEAL NOTESM&A and Investments Review for the...

DE AL NOT ES M&A and Investments Review for the Marketing, Media, Technology and Service Industries
Securities offered through Petsky Prunier Securities, LLC
1H12 Marketing, Media, Technology and Service Industries Announced 1,481 Transactions Totaling $78.3 Billion; Social and Mobile Subsegments
Accounted for 22 Percent of Activity and 10 Percent of Value
Digital Media/Commerce was the Most Active Segment in 1H12 with 515 Transactions; Software & Information was the Highest Value Segment with $31.8 Billion in Deal Value
During the first half of 2012, Petsky Prunier tracked 1,481 transactions for a total of $78.3 billion across seven broad segments: Digital Advertising, Agency/Consulting, Marketing Technology, Digital Media/Commerce, Software & Information, Out-of-Home & Specialty Media and Marketing Services. The Social and Mobile subsegments within the broader Agency/Consulting, Digital Advertising, Digital Media/Commerce and Marketing Technology segments together accounted for 22 percent of total activity and 10 percent of value. Digital Media/Commerce was the most active segment overall, with continued technology and market shifts driving ongoing demand for eCommerce and Social Media/Apps. In addition, growing adoption of cloud-based software resulted in Software & Information being the highest transaction value segment in the first half of the year.
I N T H I S I S S U E
Overview of M&A and Investment Activity 1
Big Data’s Big Opportunities and Challenges 3Hyper-Local Marketing Evolves Beyond Daily Deals 4Mobile Growth Drives Increasing Need for Data Security 5
Segment Analysis: Digital Advertising 6 Agency/Consulting 7 Marketing Technology 8 Digital Media/Commerce 9 Software & Information 10 Marketing Services 11 Out-of-Home & Specialty Media 12
Recent Transactions 18About Petsky Prunier 18
(Continued on page 2)
Software & Information
$31,873
Marketing Services $1,477
Marketing Technology
$13,405
Digital Advertising
$3,341
Digital Media/ Commerce
$13,556
Out-of-Home & Specialty Media
$7,770
Agency/ Consulting
$6,861
Chart Title MARKETING, MEDIA, TECHNOLOGY AND SERVICE INDUSTRIES 1H12 M&A AND INVESTMENT ACTIVITY
($ in Millions)
$25.9
$42.0 $47.9
$30.6
$42.1 $36.2
1Q11 2Q11 3Q11 4Q11 1Q12 2Q12
787 DEAL
VOLUME 825 796
DOLLAR VALUE
MARKETING, MEDIA, TECHNOLOGY AND SERVICE INDUSTRIES!M&A AND INVESTMENT ACTIVITY: 1Q11 - 2Q12!
($ in Billions)!
709 772
MARKETING, MEDIA, TECHNOLOGY AND SERVICE INDUSTRIES!1H12 M&A AND INVESTMENT ACTIVITY!
($ in Millions)!
MARKETING, MEDIA, TECHNOLOGY AND SERVICE INDUSTRIES 1Q11-2Q12 M&A AND INVESTMENT ACTIVITY
($ in Billions)
686
2
Overview of 1H12 M&A and Investment Activity (continued from page 1)
1H12 Most Active Strategic Buyers by Number of Transactions
BuyerNumber of Transactions Representative Targets
WPP Group 15 AKQA, Converge Technologies, DTDigital, EffectiveUI, Frey G2, Grape, OOO JvisionPublicis Groupe 8 BBR Group, i&e, Indigo Consulting, King Harvest, Longtuo, Mediagong, PixelparkFacebook 6 Face.com, GazeHawk, Glancee, Instagram, Karma, LightboxGroupon 6 Adku, DITTO.ME, FeeFighters, HyperPublic, Kima Labs, Mertado, UpTake NetworksInterpublic Group of Companies 5 FRUKT Communications, FUSE, Lakestar Media, Nicole Weber CommunicationsOmnicom Group 5 Adam & Eve Group, Fleishman-Hillard Vanguard, Medical Collective IntelligenceChime Communications 4 iLUKA, McKenzie Clark, Rough Hill, StratAgile, Succinct CommunicationsHavas 4 Creative Lynx, Ignition, Victors & Spoils, Snapworx MobileIHS 4 Displaybank, GlobalSpec, IMS Research, XeDARTwitter 4 Hotspots.io, Posterous, RestEngine, SummifyGoogle 3 Meebo.com, Quickoffice, Retailigence, TxViaIBM 3 TeaLeaf Technology, Varicent Software, WorklightMDC Partners 3 dotbox, R.J. Palmer, TargetCastSalesforce.com 3 Brighter Option, Buddy Media, Stypi
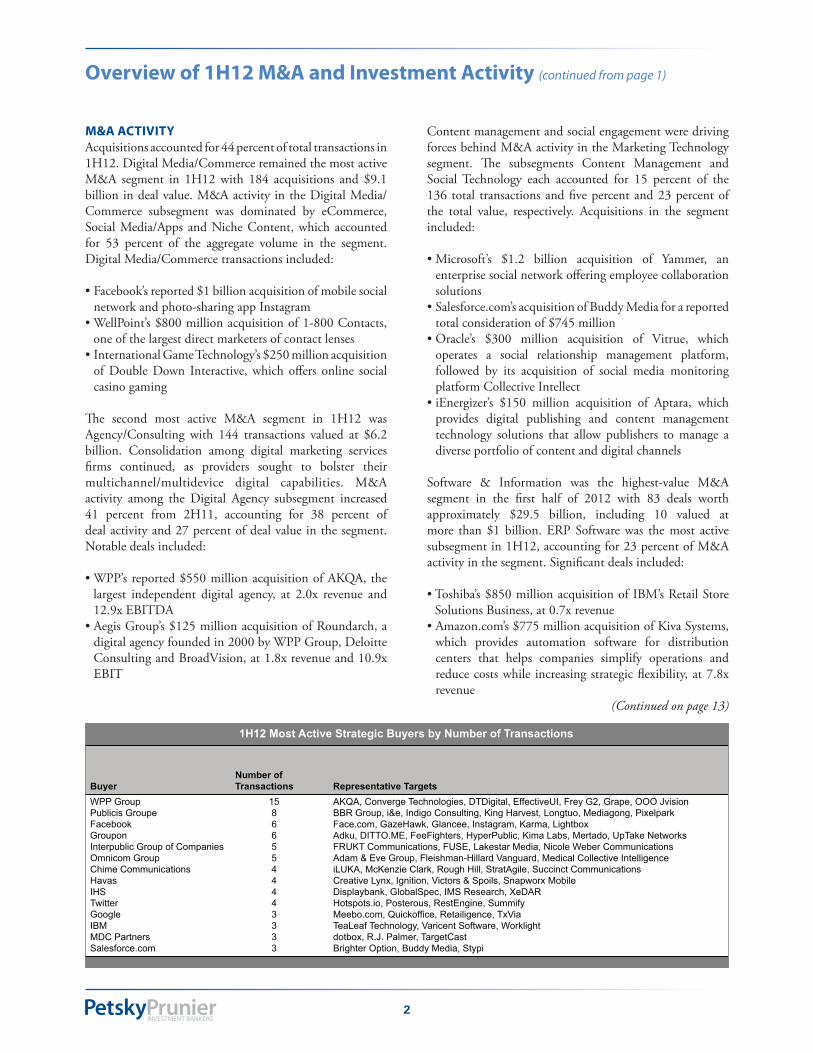
M&A ACTIVITyAcquisitions accounted for 44 percent of total transactions in 1H12. Digital Media/Commerce remained the most active M&A segment in 1H12 with 184 acquisitions and $9.1 billion in deal value. M&A activity in the Digital Media/Commerce subsegment was dominated by eCommerce, Social Media/Apps and Niche Content, which accounted for 53 percent of the aggregate volume in the segment. Digital Media/Commerce transactions included:
• Facebook’s reported $1 billion acquisition of mobile social network and photo-sharing app Instagram
• WellPoint’s $800 million acquisition of 1-800 Contacts, one of the largest direct marketers of contact lenses
• International Game Technology’s $250 million acquisition of Double Down Interactive, which offers online social casino gaming
The second most active M&A segment in 1H12 was Agency/Consulting with 144 transactions valued at $6.2 billion. Consolidation among digital marketing services firms continued, as providers sought to bolster their multichannel/multidevice digital capabilities. M&A activity among the Digital Agency subsegment increased 41 percent from 2H11, accounting for 38 percent of deal activity and 27 percent of deal value in the segment. Notable deals included:
• WPP’s reported $550 million acquisition of AKQA, the largest independent digital agency, at 2.0x revenue and 12.9x EBITDA
• Aegis Group’s $125 million acquisition of Roundarch, a digital agency founded in 2000 by WPP Group, Deloitte Consulting and BroadVision, at 1.8x revenue and 10.9x EBIT
Content management and social engagement were driving forces behind M&A activity in the Marketing Technology segment. The subsegments Content Management and Social Technology each accounted for 15 percent of the 136 total transactions and five percent and 23 percent of the total value, respectively. Acquisitions in the segment included:
• Microsoft’s $1.2 billion acquisition of Yammer, an enterprise social network offering employee collaboration solutions
• Salesforce.com’s acquisition of Buddy Media for a reported total consideration of $745 million
• Oracle’s $300 million acquisition of Vitrue, which operates a social relationship management platform, followed by its acquisition of social media monitoring platform Collective Intellect
• iEnergizer’s $150 million acquisition of Aptara, which provides digital publishing and content management technology solutions that allow publishers to manage a diverse portfolio of content and digital channels
Software & Information was the highest-value M&A segment in the first half of 2012 with 83 deals worth approximately $29.5 billion, including 10 valued at more than $1 billion. ERP Software was the most active subsegment in 1H12, accounting for 23 percent of M&A activity in the segment. Significant deals included:
• Toshiba’s $850 million acquisition of IBM’s Retail Store Solutions Business, at 0.7x revenue
• Amazon.com’s $775 million acquisition of Kiva Systems, which provides automation software for distribution centers that helps companies simplify operations and reduce costs while increasing strategic flexibility, at 7.8x revenue
(Continued on page 13)

3
In addition, machines that are becoming more computerized are generating enormous amounts of data that wasn’t available before. Smart devices are also adding to the mix. “Cell phones with GPS now have information on where you are, when you call and whether you’re making a phone call, text message or accessing the Internet,” says Sandy Steier, CEO of 1010data, a cloud-based data warehouse/business intelligence platform provider. “Even devices like gas and electric smart meters are now recording data every 15 seconds and sending it back to a utility.”
The fastest growing contributor to big data today, however, is unstructured data, such as social media and search engines. “Unstructured data creates enormous amounts of data in real-time on an ongoing basis.” says Vina. “The ability to combine these types of online data with structured information opens a new universe of possibilities.”
The challenge, Stoecker adds, is for companies to make sure they are always able to consume data from new sources and make sense of it, which requires having the right set of tools. Dashboards, Stoecker says, with their rear-view approach, are not much help with understanding big data. “I want to know what’s happening next. I need tools that give my contemporary questions contemporary answers, because in six months, I’m going to have a whole new set of questions.”
DEVELOPINg A PLATfORM fOR BIg DATA ANALySISOne benefit of today’s big data is it can now be worked with in its raw, unfiltered state and can be published in different formats. “Just collect it, and let us worry about how to store it and sift through it to find you what you need,” says Steier.
Vina agrees. “Vendors have been advocating bigger warehouses at lower costs for awhile, but you can’t consolidate the whole world,” he says. “The real issue is about offering capabilities to make that data actionable and being able to use it.” Moreover, Vina says, many companies now have “multiple islands” for data management or data governance without a cohesive strategy. “Everyone has to be on the same page. You can’t have different units using different systems and strategies. You need something that provides you with a holistic infrastructure for data quality, security, etc. across all departments.”
Big Data’s Big Opportunities and Challenges: Turning an ever-increasing amount of information into actionable insight
Companies today are hungrier than ever for customer insight that can help them streamline operations, increase customer lifetime value and grow revenue. “Our customers are chomping at the bit to receive as much data as possible as quickly as possible to get their questions answered,” says Dean Stoecker, chairman and CEO of Alteryx, an analytics solutions provider for enterprises. “Whether it’s call center management, store operations, replenishment programs or supply chain, senior executives are trying to figure out how to get a higher return, and, for that, they need a wider variety of content.”
The good news is, there is no shortage of information available. The challenge is for organizations to manage the massive amounts of data they are increasingly collecting, which solutions providers say is doubling every two to three years. “Companies are producing 15 petabytes of new information daily,” says Stoecker. “That’s more than the content of an average library every single day. But you don’t need to store it. You just need to read it, process it and store what’s relevant.”
Adding to that challenge is the fact that the solutions have historically been centered in IT, where there is little knowledge of business problem-solving. Today, Stoecker says, analysts are no longer sequestered in IT, but rather, sit within the lines of business, which requires a different set of tools.
WHERE THE gROWTH IS COMINg fROMThere are two types of data – structured and unstructured. Structured data is being produced by the companies themselves. As businesses acquire other organizations, expand globally and centralize operations, “data warehouses are getting larger,” says Angel Vina, CEO of Denodo Technologies, a data virtualization company that offers unified data services capability and data integration across structured and unstructured information.
For some particular use cases, Vina says, “all this data is available, easy to combine and ready to use, but that’s rare. In many cases, there are incompatibility issues. We provide a middle layer that turns fragmented pieces into a single, unified view.”
(Continued on page 15)
“Companies are producing 15 petabytes of new information daily. That’s more than the content of an average library every single day. But you don’t need to store it. You just need to read it, process it and store what’s relevant.”
Dean Stoecker, chairman and CEO, Alteryx
“Vendors have been advocating bigger warehouses at lower costs for awhile, but you can’t consolidate the whole world. The real issue is about offering capabilities to make that data actionable and being able to use it.”
Angel Vina, CEO, Denodo Technologies

4
Hyper-Local Marketing Evolves Beyond Daily Deals: Digital promotions now drive expanded set of integrated online/offline marketing programs
From the Yellow Pages to daily deals and foursquare, local marketing continues to evolve to keep pace with changing consumer media preferences. But with consumer time and attention at a premium, marketers are increasingly turning to a multichannel portfolio – driven by digital promotions – to create hyper-local marketing programs that reach consumers at the right time, in the right place and on the right screen.
“We are employing a ‘TraDigital’ approach to create a multimedia platform of traditional and digital offers that reach consumers who can access deals any way they want, wherever they are,” says Dean DeBiase, chairman and CEO at Entertainment, which has introduced a diverse suite of digital coupon and savings products, including Entertainment.com™ Savings Membership, Entertainment® Mobile and Entertainment.com Deals™, to supplement its ubiquitous Entertainment Membership Book.
“This degree of flexibility – in how consumers redeem offers, not how we tell them to – is critical,” DeBiase explains. In April 2012, his company rolled out an Entertainment.com digital card, available at Walgreens pharmacies nationwide, allowing consumers to redeem offers in-store or online. The program followed the launch of the Entertainment.com Saving Membership, a digital alternative to the print book, and mobile coupon redemption on its Entertainment Mobile app, allowing consumers to search for local offers through their smartphones’ GPS or by manually entering a location, and then redeem them by showing their screen to the participating merchant. Consumer pricing for each of Entertainment’s memberships is $30 for an annual subscription.
DIgITAL ADS DRIVE REVENuE INCREASESNew research confirms that digital technologies are now driving local advertising growth. According to local media research firm BIA/Kelsey, local online/interactive/digital advertising revenue will climb to $38.5 billion in 2016, representing a CAGR of 12.7% over 2011. The growth of the digital segment is expected to offset slower growth in total local media advertising revenue.
“Our goal is to capture ad spend transitioning from print to digital and, subsequently, moving into local digital,” says Heath Clarke, chairman and CEO of Local Corporation, which drives consumer traffic from more than 1,200 websites, in addition to its flagship Local.com search engine and Spreebird Deals site. The company is currently beta testing a Spreebird Rewards loyalty card program to reward frequent customers and help participating merchants build a database of power users. Consumers swipe the card at the point of sale and will, initially, receive rewards, or “Spreebucks,” they can use for future purchases.
Local Corporation has aggressively used acquisitions to expand its portfolio of digital marketing products and now targets local brick-and-mortar businesses with a turnkey set of digital advertising services, including website and content development, search engine optimization (SEO), audience targeting and analytics, display advertising and social media management, with pricing that starts below $200 per month.
“We’ve launched six new mobile products in the past three quarters,” Clarke says, adding that 80 percent of the company’s Spreebird Deals users view offers via their mobile devices, including both smartphones and tablets. “We distinguish between smartphone and tablet users, because we’re seeing a difference in how they convert,” Clarke explains. “Tablet users convert more efficiently into buyers than smartphone users, who may do a price check or review the product. But even if smartphones don’t yet monetize at the same rate, it’s still a valuable channel. It’s a unique opportunity to track how the consumer bought.”
CARD-CONNECTED OffERS ADD TO THE MIx While mobile is a high-growth area for hyper-local marketers, card-connected promotions are an integral part of the hyper-local marketing mix and are the focus of edo Interactive’s Prewards performance marketing platform, which brings financial institutions and advertisers together to provide incentives through the consumer’s credit card at the point-of-sale.
“We are employing a ‘TraDigital’ approach to create a multimedia platform of traditional and digital offers that reach consumers who can access deals any way they want, wherever they are.”
Dean DeBiase, chairman and CEO, Entertainment
“Tablet users convert more efficiently into buyers than smartphone users, who may do a price check or review the product. But even if smartphones don’t yet monetize at the same rate, it’s still a valuable channel. It’s a unique opportunity to track how the consumer bought.”
Heath Clarke, chairman and CEO, Local Corporation
(Continued on page 16)

5
Mobile growth Drives Increasing Need for Data Security: New solutions protect data, as lines blur between personal and business devices
Growth in smartphone and tablet use among U.S. consumers continues unabated, causing the lines to blur between personal and business use of mobile devices. Research firm eMarketer predicts that, by the end of 2012, 115.8 million people in the U.S. will have smartphones and 54.8 million will have tablets. At the same time, 29 percent of business executives say they use their mobile devices after work hours; 27 percent say they use them on weekends, according to a survey by Doremus and the Financial Times.
As a result, mobile device management, or MDM, has become a must-have data security tool for companies in a wide range of vertical industries struggling to manage the increasing numbers of employee-owned mobile devices. “In the past, if you had a BlackBerry for business, the notion of data loss and leakage due to personal apps didn’t exist,” explains John Herrema, senior vice president of corporate strategy at Good Technology. “But along comes the iPhone, and it changes how people use mobile devices. It’s all about the personal use of apps, and the most popular apps all share and replicate data.”
Good Technology offers a set of secure mobile apps that provide employees with a web browser, email messaging, calendaring and an online address book. The company has also developed an app toolkit called Good Dynamics, which allows third-party developers, such as Quickoffice and Box.net, to build additional business productivity apps that are compliant with Good Technology’s data controls and security.
Good Technology’s approach provides companies with a network of controlled apps, allowing employees to continue to download and use personal apps without co-mingling business and personal data. Pricing is based on a one-time licensing fee of $159 per device. The system includes “jailbreak detection,” which alerts customers if there is a data breach. “Passwords, encryption, device wiping – those are table stakes, you have to have them,” Herrema explains. “The real risk of mobile devices is what the user is doing intentionally. A document doesn’t go into Dropbox accidentally; the user has to set up the account and move the data. It may be well-intentioned, but it’s not accidental.”
MDM MEETS ByODTransparency is critical, as more American knowledge workers trade in their company-owned BlackBerrys to buy their preferred smartphones and data plans to match, a trend called BYOD, or Bring Your Own Device. According to a survey by technology giant Cisco Systems, 95 percent of organizations now allow employee-owned devices in some way, shape or form in the office; and 36 percent of enterprises provide full support for employee-owned devices.
“With BYOD, suddenly all of your windows have become doors – and it’s not one front door anymore, there are hundreds of front doors,” explains Amit Pandey, president and CEO of Zenprise, whose MDM software includes Zenprise Mobile Manager and Zencloud, a cloud-based solution that can get customers up and running on the system in minutes. “How do you control data when there are so many ways that people can enter the house?”
Zenprise Mobile Manager utilizes an on-site server through which customers set their data protection policies and register all mobile phones on the system. Mobile users must enter a four-digit passcode to be authenticated and access their business apps. The system is integrated with Microsoft’s SharePoint, an enterprise-level document sharing and collaboration tool, allowing users to securely share business documents. Company data and personal apps are separated by an invisible firewall, meaning personal email or apps are not monitored or encrypted. Zenprise pricing is also based on the number of devices registered on the system.
“Our vision is not to get in the way of the consumer experience,” says Pandey. “But IT and compliance officers are nervous about what employees are doing with their devices. Our goal is to make both sides happy and put everything securely on the same device. Employers will find that employees will be happier with the freedom of choice.”
“MDM can be intrusive and restrictive, especially if you want the employee to pay for the device and the data plan,” adds Good Technology’s Herrema. “Our approach manages
(Continued on page 17)
“In the past, if you had a BlackBerry for business, the notion of data loss and leakage due to personal apps didn’t exist. But along comes the iPhone, and it changes how people use mobile devices.”
John Herrema, senior vice president of corporate strategy, Good Technology
“In many ways, companies have a good sense about what security level applies to what documents. We’re just extending those policies to the phone, which is now the equivalent of the laptop in terms of information stored.”
Amit Pandey, president and CEO, Zenprise

6
DIgITAL ADVERTISINg FIRST HalF DEal NOTES 2012
M&A AND INVESTMENT ACTIVITy The Digital Advertising segment remained active across all channels in 2Q12, with 55 announced deals worth approximately $1.2 billion. Digital Video had the greatest number of transactions in 2Q12 with a 15 percent increase in activity compared to 1Q12. Buyers and investors also favored businesses that expanded their offerings across multiple web-connected devices, including PCs and mobile and tablet devices. Notable transactions included:
• Norwest Venture Partners’ $39 million investment in India-based Komli Media, an ad network platform operator with solutions across display, mobile, video, social, search and data. With its recent acquisition of Southeast Asia-based Admax Network, Komli now claims to be the largest independent digital media company in Asia Pacific
• Google Ventures’ $35 million investment in Machinima, which operates a video entertainment network that distributes its content across YouTube, social networks, mobile and tablet devices and eCommerce websites
• The Discovery Channel’s $30 million investment in Revision3, an Internet television network spanning web, mobile and tablet devices
The two largest deals in the segment were:
• Towers Watson’s $435 million acquisition of Extend Health, which operates the largest private online Medicare exchange in the U.S., at 6.8x revenue and 28.6x EBITDA. Best known for its workplace benefits and talent management consulting services, Towers Watson is using the acquisition to enter the emerging healthcare digital advertising vertical via affiliate marketing – an increasingly popular solution for online insurance sales
• Norwest Equity Partners’ $50 million investment in GoHealth.com, which operates a consumer-facing portal that allows users to comparison shop for health coverage
BuyERS Strategic buyers accounted for more than one-third of the transactions in the segment. While strategics’ percentage of total deals announced declined 12 percent from the previous quarter, their acquisitions were spread evenly across the Digital Advertising subsegments. Venture and growth capital investment activity remained high, with 35 transactions announced worth $443 million, focused most aggressively on the Digital Video, Mobile Marketing and Ad Networks subsegments during the quarter.
1Q12 2Q12 1H12 vs 2H11 LTM
SubsegmentNumber of
TransactionsDeal Value($ Millions)
Number of Transactions
Deal Value($ Millions)
Number of Transactions
Deal Value($ Millions)
Number of Transactions
Deal Value($ Millions)
Strategic 37 13,979 23 4,006 (25%) (67%) 301 66,183Private Equity - Buyout 9 7,662 14 3,870 35% (45%) 58 27,038Private Equity - VC/Growth Capital 71 923 105 1,433 36% (56%) 436 6,186
Total 117 22,564 142 9,309 15% (61%) 795 99,406
1Q12 2Q12 1H12 vs 2H11 LTM
SubsegmentNumber of
TransactionsDeal Value($ Millions)
Number of Transactions
Deal Value($ Millions)
Number of Transactions
Deal Value($ Millions)
Number of Transactions
Deal Value($ Millions)
Strategic 29 1,859 20 779 (33%) (58%) 262 8,307Private Equity - Buyout 0 0 0 0 (100%) (100%) 7 363Private Equity - VC/Growth Capital 32 260 35 443 (03%) (76%) 282 4,331
Total 61 2,118 55 1,222 (19%) (64%) 551 13,001
Software & Information Transactions by Type of Buyer
Digital Advertising Transactions by Type of Buyer
(% Change)
(% Change)
1Q12 2Q12 1H12 vs 2H11 LTM
SubsegmentNumber of
TransactionsDeal Value($ Millions)
Number of Transactions
Deal Value($ Millions)
Number of Transactions
Deal Value($ Millions)
Number of Transactions
Deal Value($ Millions)
Digital Agency 34 853 27 899 36% 112% 192 5,375General Agency 9 129 8 184 13% 6% 61 1,216Experiential Marketing 8 334 6 117 8% 146% 32 893Social Agency 2 13 6 48 (33%) (82%) 29 583Design Agency 0 0 5 65 (44%) (81%) 20 674Healthcare Agency 4 63 4 63 14% (5%) 35 1,795Public Relations 11 241 4 39 (21%) (60%) 51 1,397Promotion Agency 2 25 3 40 150% 87% 13 153Other Consulting 8 1,735 2 100 (71%) 351% 75 5,157Specialty Agency 3 31 2 503 (17%) (41%) 19 1,534Marketing Consulting 2 922 1 1 (85%) 84% 32 1,603Media Planning/Buying 2 30 0 0 0% (54%) 13 667
Subtotal 85 4,376 68 2,057 (17%) 36% 572 21,048Other 11 428 0 0 (21%) 23% 38 1,310
Total 96 4,804 68 2,057 (17%) 35% 610 22,357
1Q12 2Q12 1H12 vs 2H11 LTM
SubsegmentNumber of
TransactionsDeal Value($ Millions)
Number of Transactions
Deal Value($ Millions)
Number of Transactions
Deal Value($ Millions)
Number of Transactions
Deal Value($ Millions)
Digital Video 13 1,244 15 164 8% 74% 106 3,653Mobile Marketing 19 472 11 114 (21%) 6% 141 2,313Ad Networks/Exchanges 10 188 11 221 (16%) (47%) 111 2,291Online Lead Generation 10 97 7 105 (37%) (52%) 101 2,358Affiliate/CPA Network 4 59 5 530 50% 861% 23 828Search Marketing 1 15 4 80 (58%) (83%) 34 895Game Advertising 1 15 1 5 (33%) (1%) 10 132Email Services 3 28 1 3 (43%) (50%) 25 532Total 61 2,118 55 1,222 (19%) 2% 551 13,001
1Q12 2Q12 1H12 vs 2H11 LTM
SubsegmentNumber of
TransactionsDeal Value($ Millions)
Number of Transactions
Deal Value($ Millions)
Number of Transactions
Deal Value($ Millions)
Number of Transactions
Deal Value($ Millions)
Printer 11 149 7 107 38% (4%) 56 2847Logistics 2 33 4 250 (14%) (56%) 17 1480Retail Services 1 20 3 354 33% 476% 13 4650Loyalty/Retention 1 15 3 37 (50%) (75%) 28 1206Data Processing/Enhancement 0 0 2 6 100% (65%) 10 128Database/Analytics 1 6 1 25 (75%) (74%) 28 1253Fulfillment 1 150 1 15 (33%) 224% 8 270List Broker/Manager 0 0 1 5 NM NM 2 16Call Center 3 65 0 0 (25%) (90%) 17 1237Collections 2 40 0 0 NM NM 5 95
Total 23 678 22 800 (15%) (28%) 209 14,059
1Q12 2Q12 1H12 vs 2H11 LTM
SubsegmentNumber of
TransactionsDeal Value($ Millions)
Number of Transactions
Deal Value($ Millions)
Number of Transactions
Deal Value($ Millions)
Number of Transactions
Deal Value($ Millions)
Entertainment Media 0 0 5 3,064 67% 33% 10 6,031B-to-B Media 3 17 4 105 (30%) (63%) 26 523Digital Place-Based Media 4 58 3 38 (53%) (68%) 41 826Traditional Outdoor 2 3,603 2 130 (50%) 1,052% 19 4,200Yellow Pages 1 4 1 750 100% 9,820% 3 762Other 0 0 0 0 NM NM 4 831Subtotal 10 3,682 15 4,087 (41%) 388% 99 12,342
Total 10 3,682 15 4,087 (32%) 138% 103 13,174Other subsegments include Shopper/Trader/Coupons
Most Active Agency/Consulting Subsegments
Most Active Out-of-Home & Specialty Media Subsegments
(% Change)
(% Change)
Other subsegments include Branded Communications, B-to-B Agency, DM Agency, Ethnic/Multicultural Agency and DR Media Buying
Most Active Digital Advertising Subsegments
(% Change)
Most Active Marketing Services Subsegments
(% Change)
7
AgENCy/CONSuLTINg FIRST HalF DEal NOTES 2012
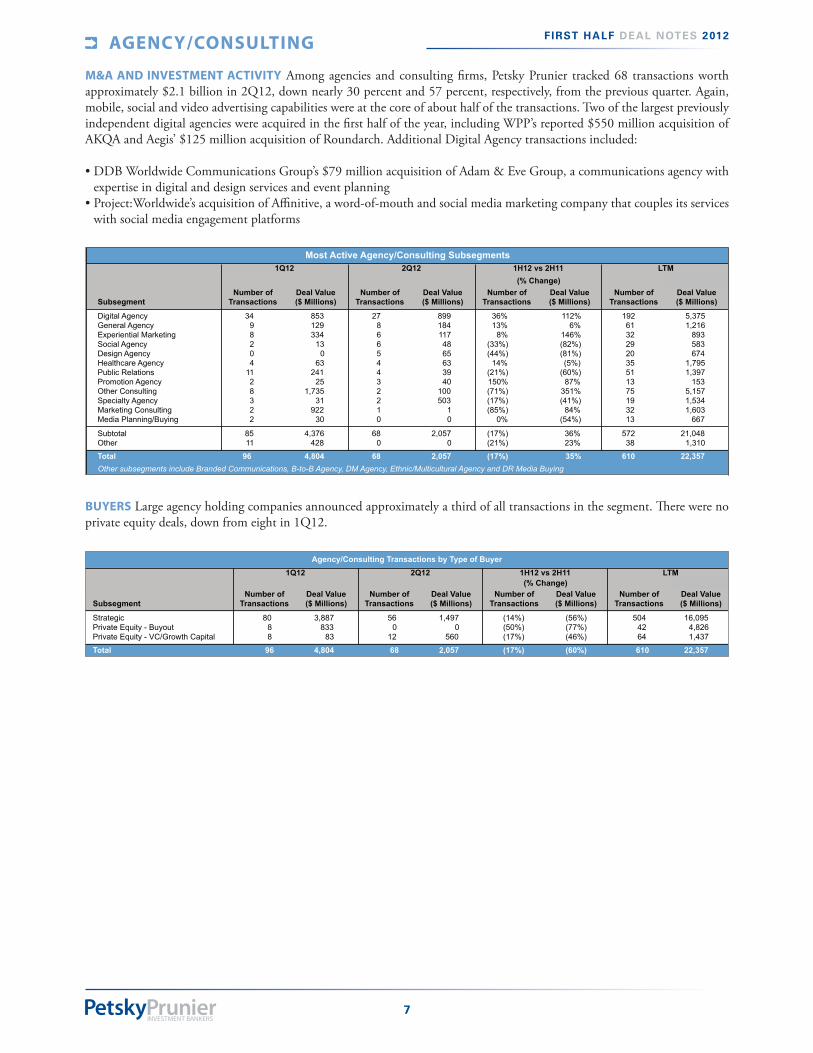
M&A AND INVESTMENT ACTIVITy Among agencies and consulting firms, Petsky Prunier tracked 68 transactions worth approximately $2.1 billion in 2Q12, down nearly 30 percent and 57 percent, respectively, from the previous quarter. Again, mobile, social and video advertising capabilities were at the core of about half of the transactions. Two of the largest previously independent digital agencies were acquired in the first half of the year, including WPP’s reported $550 million acquisition of AKQA and Aegis’ $125 million acquisition of Roundarch. Additional Digital Agency transactions included:
• DDB Worldwide Communications Group’s $79 million acquisition of Adam & Eve Group, a communications agency with expertise in digital and design services and event planning
• Project:Worldwide’s acquisition of Affinitive, a word-of-mouth and social media marketing company that couples its services with social media engagement platforms
BuyERS Large agency holding companies announced approximately a third of all transactions in the segment. There were no private equity deals, down from eight in 1Q12.
1Q12 2Q12 1H12 vs 2H11 LTM
SubsegmentNumber of
TransactionsDeal Value($ Millions)
Number of Transactions
Deal Value($ Millions)
Number of Transactions
Deal Value($ Millions)
Number of Transactions
Deal Value($ Millions)
Digital Agency 34 853 27 899 36% 112% 192 5,375General Agency 9 129 8 184 13% 6% 61 1,216Experiential Marketing 8 334 6 117 8% 146% 32 893Social Agency 2 13 6 48 (33%) (82%) 29 583Design Agency 0 0 5 65 (44%) (81%) 20 674Healthcare Agency 4 63 4 63 14% (5%) 35 1,795Public Relations 11 241 4 39 (21%) (60%) 51 1,397Promotion Agency 2 25 3 40 150% 87% 13 153Other Consulting 8 1,735 2 100 (71%) 351% 75 5,157Specialty Agency 3 31 2 503 (17%) (41%) 19 1,534Marketing Consulting 2 922 1 1 (85%) 84% 32 1,603Media Planning/Buying 2 30 0 0 0% (54%) 13 667
Subtotal 85 4,376 68 2,057 (17%) 36% 572 21,048Other 11 428 0 0 (21%) 23% 38 1,310
Total 96 4,804 68 2,057 (17%) 35% 610 22,357
1Q12 2Q12 1H12 vs 2H11 LTM
SubsegmentNumber of
TransactionsDeal Value($ Millions)
Number of Transactions
Deal Value($ Millions)
Number of Transactions
Deal Value($ Millions)
Number of Transactions
Deal Value($ Millions)
Digital Video 13 1,244 15 164 8% 74% 106 3,653Mobile Marketing 19 472 11 114 (21%) 6% 141 2,313Ad Networks/Exchanges 10 188 11 221 (16%) (47%) 111 2,291Online Lead Generation 10 97 7 105 (37%) (52%) 101 2,358Affiliate/CPA Network 4 59 5 530 50% 861% 23 828Search Marketing 1 15 4 80 (58%) (83%) 34 895Game Advertising 1 15 1 5 (33%) (1%) 10 132Email Services 3 28 1 3 (43%) (50%) 25 532Total 61 2,118 55 1,222 (19%) 2% 551 13,001
1Q12 2Q12 1H12 vs 2H11 LTM
SubsegmentNumber of
TransactionsDeal Value($ Millions)
Number of Transactions
Deal Value($ Millions)
Number of Transactions
Deal Value($ Millions)
Number of Transactions
Deal Value($ Millions)
Printer 11 149 7 107 38% (4%) 56 2847Logistics 2 33 4 250 (14%) (56%) 17 1480Retail Services 1 20 3 354 33% 476% 13 4650Loyalty/Retention 1 15 3 37 (50%) (75%) 28 1206Data Processing/Enhancement 0 0 2 6 100% (65%) 10 128Database/Analytics 1 6 1 25 (75%) (74%) 28 1253Fulfillment 1 150 1 15 (33%) 224% 8 270List Broker/Manager 0 0 1 5 NM NM 2 16Call Center 3 65 0 0 (25%) (90%) 17 1237Collections 2 40 0 0 NM NM 5 95
Total 23 678 22 800 (15%) (28%) 209 14,059
1Q12 2Q12 1H12 vs 2H11 LTM
SubsegmentNumber of
TransactionsDeal Value($ Millions)
Number of Transactions
Deal Value($ Millions)
Number of Transactions
Deal Value($ Millions)
Number of Transactions
Deal Value($ Millions)
Entertainment Media 0 0 5 3,064 67% 33% 10 6,031B-to-B Media 3 17 4 105 (30%) (63%) 26 523Digital Place-Based Media 4 58 3 38 (53%) (68%) 41 826Traditional Outdoor 2 3,603 2 130 (50%) 1,052% 19 4,200Yellow Pages 1 4 1 750 100% 9,820% 3 762Other 0 0 0 0 NM NM 4 831Subtotal 10 3,682 15 4,087 (41%) 388% 99 12,342
Total 10 3,682 15 4,087 (32%) 138% 103 13,174Other subsegments include Shopper/Trader/Coupons
Most Active Agency/Consulting Subsegments
Most Active Out-of-Home & Specialty Media Subsegments
(% Change)
(% Change)
Other subsegments include Branded Communications, B-to-B Agency, DM Agency, Ethnic/Multicultural Agency and DR Media Buying
Most Active Digital Advertising Subsegments
(% Change)
Most Active Marketing Services Subsegments
(% Change)
1Q12 2Q12 1H12 vs 2H11 LTM
SubsegmentNumber of
TransactionsDeal Value($ Millions)
Number of Transactions
Deal Value($ Millions)
Number of Transactions
Deal Value($ Millions)
Number of Transactions
Deal Value($ Millions)
Strategic 88 3,566 89 5,108 (15%) (74%) 780 41,128Private Equity - Buyout 3 83 4 364 0% (85%) 30 3,947Private Equity - VC/Growth Capital 155 1,799 176 2,636 (05%) (79%) 1,194 23,958
Total 246 5,448 269 8,109 (09%) (77%) 2,004 69,032
1Q12 2Q12 1H12 vs 2H11 LTM
SubsegmentNumber of
TransactionsDeal Value($ Millions)
Number of Transactions
Deal Value($ Millions)
Number of Transactions
Deal Value($ Millions)
Number of Transactions
Deal Value($ Millions)
Strategic 52 1,691 80 9,035 (25%) (63%) 563 38,868Private Equity - Buyout 4 68 0 0 (75%) (98%) 27 4,067Private Equity - VC/Growth Capital 100 1,006 121 1,605 7% (65%) 781 9,005
Total 156 2,765 201 10,640 (10%) (67%) 1,371 51,941
1Q12 2Q12 1H12 vs 2H11 LTM
SubsegmentNumber of
TransactionsDeal Value($ Millions)
Number of Transactions
Deal Value($ Millions)
Number of Transactions
Deal Value($ Millions)
Number of Transactions
Deal Value($ Millions)
Strategic 80 3,887 56 1,497 (14%) (56%) 504 16,095Private Equity - Buyout 8 833 0 0 (50%) (77%) 42 4,826Private Equity - VC/Growth Capital 8 83 12 560 (17%) (46%) 64 1,437
Total 96 4,804 68 2,057 (17%) (60%) 610 22,357
Digital Media/Commerce Transactions by Type of Buyer
Marketing Technology Transactions by Type of Buyer
Agency/Consulting Transactions by Type of Buyer
(% Change)
(% Change)
(% Change)

8
MARKETINg TECHNOLOgy FIRST HalF DEal NOTES 2012
M&A AND INVESTMENT ACTIVITy Technology companies’ pursuit of “social stacks” to integrate mobile and social channels with existing CRM and SFA offerings was a major driver of acquisition activity during the quarter. In 2Q12, there were 201 transactions (80 acquisitions and 121 investments) in the segment valued at approximately $10.6 billion. Compared to 1Q12, transaction activity increased 29 percent while value nearly quadrupled, with the most activity occurring among Content Management and Social Technology companies. There were 10 acquisitions in the Social Technology subsegment worth $2.3 billion. Transactions included the acquisitions of the two largest independent social media marketing platforms:
• Salesforce.com’s acquisition of Buddy Media for reported total consideration of $745 million• Oracle’s $300 million acquisition of Vitrue, which operates a social relationship management platform, followed by its
acquisition of social media monitoring platform Collective Intellect
The explosion of unstructured data continued to drive demand for web analytics tools capable of building a semantic understanding of online conversations, intent and action. As a result, Analytics & Reporting was the third-most active subsegment within Marketing Technology in 2Q12, with seven acquisitions and 19 investments, worth approximately $255 million and $112 million, respectively. Notable transactions included:
• IBM’s acquisition of Varicent Software, a sales analytics software provider• VMWare’s acquisition of Cetas Software, which provides big data analytics solutions for online businesses to gain insights and
visibility into their customer/audience behavior
BuyERS Mega CRM and BI tools providers Oracle, Microsoft and Salesforce.com accounted for nearly one-quarter of the segment’s M&A deal value in 2Q12. Compared to the previous quarter, buyers focused on acquisitions of scale to add value to their current technology platforms, rather than acquiring a number of smaller, less-established companies. The number of investments in 2Q12 increased slightly, with the largest increase in activity seen among Content Management, Analytics & Reporting and Social Technology, which increased 200 percent, 111 percent and 42 percent, respectively.
1Q12 2Q12 1H12 vs 2H11 LTM
SubsegmentNumber of
TransactionsDeal Value($ Millions)
Number of Transactions
Deal Value($ Millions)
Number of Transactions
Deal Value($ Millions)
Number of Transactions
Deal Value($ Millions)
eCommerce 56 1,371 77 3,441 (1%) (9%) 437 21,311Social Media/Apps 61 709 54 1,597 (17%) (6%) 435 17,678Mobile Content/Apps 35 335 33 715 5% 143% 212 2,446Gaming 30 984 27 517 (2%) (25%) 254 9,397Niche Content 22 531 22 631 (4%) 67% 216 4,765Classifieds/Auctions/P-to-P 15 478 18 390 6% 76% 106 3,220Digital Promotion/Coupon 11 108 12 167 (49%) (80%) 174 5,625Vertical Search 7 264 12 239 138% 367% 49 1,070Comparison Shopping 2 32 5 275 (53%) (54%) 42 1,699Local Search 5 619 6 119 (27%) 371% 43 1,165Web Search/Portals 1 2 3 19 (43%) (85%) 24 591
Other 1 15 0 0 (50%) 178% 12 66Subtotal 246 5,448 269 8,109 (9%) (2%) 2,004 69,032
Total 246 5,448 269 8,109 (9%) (2%) 2,004 69,032Other includes Domain Portfolio/Marketplace and Virtual Goods
SubsegmentNumber of
TransactionsDeal Value($ Millions)
Number of Transactions
Deal Value($ Millions)
Number of Transactions
Deal Value($ Millions)
Number of Transactions
Deal Value($ Millions)
Content Management 15 315 42 725 24% 46% 169 4,161Social Technology 29 288 37 2,506 (8%) 62% 206 5,670Analytics & Reporting 15 121 26 367 5% (52%) 124 2,622Mobile Technology 20 629 18 477 (16%) (23%) 177 4,845BI tools 8 135 9 172 (19%) (82%) 45 2,227Online Targeting/Optimization 12 146 9 90 40% (53%) 94 1,759Commerce Management 11 172 8 4,514 (49%) 473% 115 11,749Email/Messaging Software 6 202 7 424 63% 145% 44 1,394SFA/Lead Management 3 49 7 86 100% 65% 30 400Ad Serving 5 87 6 134 57% (6%) 45 771MRM/Workflow Management 2 24 6 141 (11%) (15%) 31 1,596Search & Discovery 2 11 4 52 (45%) (74%) 28 529
Subtotal 128 2,179 179 9,686 (3%) 33% 1,108 37,722Other 28 586 22 954 (40%) (79%) 263 14,218
Total 156 2,765 201 10,640 (10%) (18%) 1,371 51,941
1Q12 2Q12 1H12 vs 2H11 LTM
Subsegment Number of Transactions
Deal Value($ Millions)
Number of Transactions
Deal Value($ Millions)
Number of Transactions
Deal Value($ Millions)
Number of Transactions
Deal Value($ Millions)
Infrastructure Software 29 1,550 35 1,842 36% 179% 147 6,812ERP Software 25 4,472 28 1,518 47% (65%) 126 30,031HC-Providers Software 12 2,954 17 611 26% 333% 78 5,834Software NEC 7 5,077 16 372 NM NM 26 5,551Financial Software 9 2,434 11 340 25% 2% 64 8,329HC-BioPharma Software 2 47 7 481 50% 258% 21 939Market Research 11 169 5 81 (56%) (85%) 108 3,295HR Software 9 2,267 5 259 75% (40%) 41 7,307Credit/Risk Software 2 75 4 85 (14%) (84%) 21 1,471Engineering Software 2 39 3 1,413 (17%) 173% 12 2,025Marketing Data 1 13 3 259 (67%) (75%) 26 2,826Geo-Demo Software 2 106 2 33 33% (73%) 9 664Subtotal 111 19,203 136 7,295 24% (14%) 679 75,082Other 6 3,361 6 2,014 (54%) 44% 116 24,324
Total 117 22,564 142 9,309 15% (8%) 795 99,406
Most Active Digital Media/Commerce Subsegments
(% Change)
Most Active Marketing Technology Subsegments1Q12 2Q12 1H12 vs 2H11 LTM
(% Change)
Other subsegments include Creative Production Platform, Content Delivery Network, CRM, Data Quality, Internet Service Providers, Marketing Asset Management, Media Management Systems, Product/Price Software, Segmentation/Data Mining, SEM/SEO Tools, Teleservices/eServices, Website Creation/Hosting and Web to Print
Most Active Software & Information Subsegments
(% Change)
Other subsegments includes Credit/Risk Management, Engineering/Scientific/Tech, Financial, Geo-demographic, HC-Payors Software, Healthcare-BioPharma, Healthcare-Payors, Healthcare-Providers, HR, IT, Legal, Legal Software and Product/Price
1Q12 2Q12 1H12 vs 2H11 LTM
SubsegmentNumber of
TransactionsDeal Value($ Millions)
Number of Transactions
Deal Value($ Millions)
Number of Transactions
Deal Value($ Millions)
Number of Transactions
Deal Value($ Millions)
Strategic 88 3,566 89 5,108 (15%) (74%) 780 41,128Private Equity - Buyout 3 83 4 364 0% (85%) 30 3,947Private Equity - VC/Growth Capital 155 1,799 176 2,636 (05%) (79%) 1,194 23,958
Total 246 5,448 269 8,109 (09%) (77%) 2,004 69,032
1Q12 2Q12 1H12 vs 2H11 LTM
SubsegmentNumber of
TransactionsDeal Value($ Millions)
Number of Transactions
Deal Value($ Millions)
Number of Transactions
Deal Value($ Millions)
Number of Transactions
Deal Value($ Millions)
Strategic 52 1,691 80 9,035 (25%) (63%) 563 38,868Private Equity - Buyout 4 68 0 0 (75%) (98%) 27 4,067Private Equity - VC/Growth Capital 100 1,006 121 1,605 7% (65%) 781 9,005
Total 156 2,765 201 10,640 (10%) (67%) 1,371 51,941
1Q12 2Q12 1H12 vs 2H11 LTM
SubsegmentNumber of
TransactionsDeal Value($ Millions)
Number of Transactions
Deal Value($ Millions)
Number of Transactions
Deal Value($ Millions)
Number of Transactions
Deal Value($ Millions)
Strategic 80 3,887 56 1,497 (14%) (56%) 504 16,095Private Equity - Buyout 8 833 0 0 (50%) (77%) 42 4,826Private Equity - VC/Growth Capital 8 83 12 560 (17%) (46%) 64 1,437
Total 96 4,804 68 2,057 (17%) (60%) 610 22,357
Digital Media/Commerce Transactions by Type of Buyer
Marketing Technology Transactions by Type of Buyer
Agency/Consulting Transactions by Type of Buyer
(% Change)
(% Change)
(% Change)
9
DIgITAL MEDIA/COMMERCE FIRST HalF DEal NOTES 2012
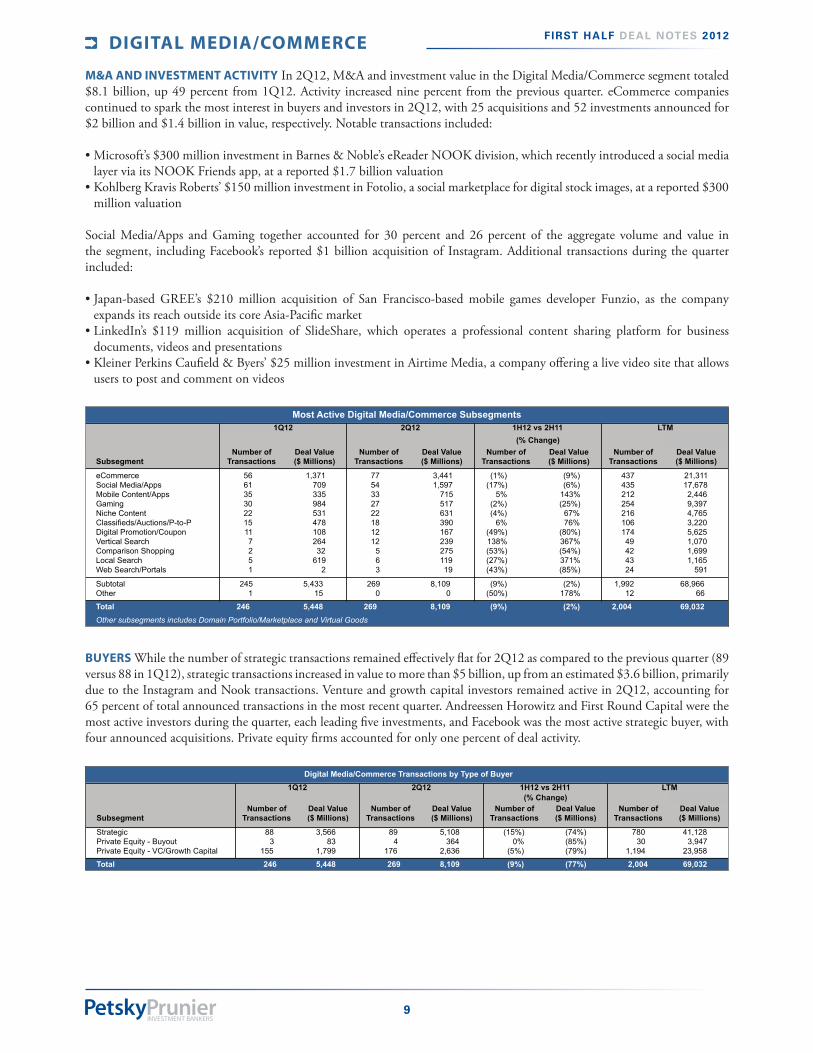
M&A AND INVESTMENT ACTIVITy In 2Q12, M&A and investment value in the Digital Media/Commerce segment totaled $8.1 billion, up 49 percent from 1Q12. Activity increased nine percent from the previous quarter. eCommerce companies continued to spark the most interest in buyers and investors in 2Q12, with 25 acquisitions and 52 investments announced for $2 billion and $1.4 billion in value, respectively. Notable transactions included:
• Microsoft’s $300 million investment in Barnes & Noble’s eReader NOOK division, which recently introduced a social media layer via its NOOK Friends app, at a reported $1.7 billion valuation
• Kohlberg Kravis Roberts’ $150 million investment in Fotolio, a social marketplace for digital stock images, at a reported $300 million valuation
Social Media/Apps and Gaming together accounted for 30 percent and 26 percent of the aggregate volume and value in the segment, including Facebook’s reported $1 billion acquisition of Instagram. Additional transactions during the quarter included: • Japan-based GREE’s $210 million acquisition of San Francisco-based mobile games developer Funzio, as the company
expands its reach outside its core Asia-Pacific market• LinkedIn’s $119 million acquisition of SlideShare, which operates a professional content sharing platform for business
documents, videos and presentations• Kleiner Perkins Caufield & Byers’ $25 million investment in Airtime Media, a company offering a live video site that allows
users to post and comment on videos
BuyERS While the number of strategic transactions remained effectively flat for 2Q12 as compared to the previous quarter (89 versus 88 in 1Q12), strategic transactions increased in value to more than $5 billion, up from an estimated $3.6 billion, primarily due to the Instagram and Nook transactions. Venture and growth capital investors remained active in 2Q12, accounting for 65 percent of total announced transactions in the most recent quarter. Andreessen Horowitz and First Round Capital were the most active investors during the quarter, each leading five investments, and Facebook was the most active strategic buyer, with four announced acquisitions. Private equity firms accounted for only one percent of deal activity.
1Q12 2Q12 1H12 vs 2H11 LTM
SubsegmentNumber of
TransactionsDeal Value($ Millions)
Number of Transactions
Deal Value($ Millions)
Number of Transactions
Deal Value($ Millions)
Number of Transactions
Deal Value($ Millions)
eCommerce 56 1,371 77 3,441 (1%) (9%) 437 21,311Social Media/Apps 61 709 54 1,597 (17%) (6%) 435 17,678Mobile Content/Apps 35 335 33 715 5% 143% 212 2,446Gaming 30 984 27 517 (2%) (25%) 254 9,397Niche Content 22 531 22 631 (4%) 67% 216 4,765Classifieds/Auctions/P-to-P 15 478 18 390 6% 76% 106 3,220Digital Promotion/Coupon 11 108 12 167 (49%) (80%) 174 5,625Vertical Search 7 264 12 239 138% 367% 49 1,070Comparison Shopping 2 32 5 275 (53%) (54%) 42 1,699Local Search 5 619 6 119 (27%) 371% 43 1,165Web Search/Portals 1 2 3 19 (43%) (85%) 24 591
Subtotal 245 5,433 269 8,109 (9%) (2%) 1,992 68,966Other 1 15 0 0 (50%) 178% 12 66
Total 246 5,448 269 8,109 (9%) (2%) 2,004 69,032Other subsegments includes Domain Portfolio/Marketplace and Virtual Goods
Most Active Digital Media/Commerce Subsegments
(% Change)
1Q12 2Q12 1H12 vs 2H11 LTM
SubsegmentNumber of
TransactionsDeal Value($ Millions)
Number of Transactions
Deal Value($ Millions)
Number of Transactions
Deal Value($ Millions)
Number of Transactions
Deal Value($ Millions)
Strategic 88 3,566 89 5,108 (15%) (74%) 780 41,128Private Equity - Buyout 3 83 4 364 0% (85%) 30 3,947Private Equity - VC/Growth Capital 155 1,799 176 2,636 (5%) (79%) 1,194 23,958
Total 246 5,448 269 8,109 (9%) (77%) 2,004 69,032
Digital Media/Commerce Transactions by Type of Buyer
(% Change)

1Q12 2Q12 1H12 vs 2H11 LTM
SubsegmentNumber of
TransactionsDeal Value($ Millions)
Number of Transactions
Deal Value($ Millions)
Number of Transactions
Deal Value($ Millions)
Number of Transactions
Deal Value($ Millions)
eCommerce 56 1,371 77 3,441 (1%) (9%) 437 21,311Social Media/Apps 61 709 54 1,597 (17%) (6%) 435 17,678Mobile Content/Apps 35 335 33 715 5% 143% 212 2,446Gaming 30 984 27 517 (2%) (25%) 254 9,397Niche Content 22 531 22 631 (4%) 67% 216 4,765Classifieds/Auctions/P-to-P 15 478 18 390 6% 76% 106 3,220Digital Promotion/Coupon 11 108 12 167 (49%) (80%) 174 5,625Vertical Search 7 264 12 239 138% 367% 49 1,070Comparison Shopping 2 32 5 275 (53%) (54%) 42 1,699Local Search 5 619 6 119 (27%) 371% 43 1,165Web Search/Portals 1 2 3 19 (43%) (85%) 24 591
Other 1 15 0 0 (50%) 178% 12 66Subtotal 246 5,448 269 8,109 (9%) (2%) 2,004 69,032
Total 246 5,448 269 8,109 (9%) (2%) 2,004 69,032Other includes Domain Portfolio/Marketplace and Virtual Goods
SubsegmentNumber of
TransactionsDeal Value($ Millions)
Number of Transactions
Deal Value($ Millions)
Number of Transactions
Deal Value($ Millions)
Number of Transactions
Deal Value($ Millions)
Content Management 15 315 42 725 24% 46% 169 4,161Social Technology 29 288 37 2,506 (8%) 62% 206 5,670Analytics & Reporting 15 121 26 367 5% (52%) 124 2,622Mobile Technology 20 629 18 477 (16%) (23%) 177 4,845BI tools 8 135 9 172 (19%) (82%) 45 2,227Online Targeting/Optimization 12 146 9 90 40% (53%) 94 1,759Commerce Management 11 172 8 4,514 (49%) 473% 115 11,749Email/Messaging Software 6 202 7 424 63% 145% 44 1,394SFA/Lead Management 3 49 7 86 100% 65% 30 400Ad Serving 5 87 6 134 57% (6%) 45 771MRM/Workflow Management 2 24 6 141 (11%) (15%) 31 1,596Search & Discovery 2 11 4 52 (45%) (74%) 28 529
Subtotal 128 2,179 179 9,686 (3%) 33% 1,108 37,722Other 28 586 22 954 (40%) (79%) 263 14,218
Total 156 2,765 201 10,640 (10%) (18%) 1,371 51,941
1Q12 2Q12 1H12 vs 2H11 LTM
Subsegment Number of Transactions
Deal Value($ Millions)
Number of Transactions
Deal Value($ Millions)
Number of Transactions
Deal Value($ Millions)
Number of Transactions
Deal Value($ Millions)
Infrastructure Software 29 1,550 35 1,842 36% 179% 147 6,812ERP Software 25 4,472 28 1,518 47% (65%) 126 30,031HC-Providers Software 12 2,954 17 611 26% 333% 78 5,834Software NEC 7 5,077 16 372 NM NM 26 5,551Financial Software 9 2,434 11 340 25% 2% 64 8,329HC-BioPharma Software 2 47 7 481 50% 258% 21 939Market Research 11 169 5 81 (56%) (85%) 108 3,295HR Software 9 2,267 5 259 75% (40%) 41 7,307Credit/Risk Software 2 75 4 85 (14%) (84%) 21 1,471Engineering Software 2 39 3 1,413 (17%) 173% 12 2,025Marketing Data 1 13 3 259 (67%) (75%) 26 2,826Geo-Demo Software 2 106 2 33 33% (73%) 9 664Subtotal 111 19,203 136 7,295 24% (14%) 679 75,082Other 6 3,361 6 2,014 (54%) 44% 116 24,324
Total 117 22,564 142 9,309 15% (8%) 795 99,406
Most Active Digital Media/Commerce Subsegments
(% Change)
Most Active Marketing Technology Subsegments1Q12 2Q12 1H12 vs 2H11 LTM
(% Change)
Other subsegments include Creative Production Platform, Content Delivery Network, CRM, Data Quality, Internet Service Providers, Marketing Asset Management, Media Management Systems, Product/Price Software, Segmentation/Data Mining, SEM/SEO Tools, Teleservices/eServices, Website Creation/Hosting and Web to Print
Most Active Software & Information Subsegments
(% Change)
Other subsegments includes Credit/Risk Management, Engineering/Scientific/Tech, Financial, Geo-demographic, HC-Payors Software, Healthcare-BioPharma, Healthcare-Payors, Healthcare-Providers, HR, IT, Legal, Legal Software and Product/Price
SOfTWARE & INfORMATION FIRST HalF DEal NOTES 2012
M&A AND INVESTMENT ACTIVITy A total of 142 Software & Information transactions worth approximately $9.3 billion, including 37 acquisitions and 105 investments, were announced in 2Q12. The shift in technology deployment from traditional licensing models to cloud offerings, including SaaS, IaaS and PaaS, was a driver of acquisitions and investments across Infrastructure, ERP and Healthcare Software subsegments. Market Research remained the most active Information segment, with five transactions. Notable transactions included:
• MICROS Systems’ $186 million acquisition of Torex Retail Holdings, a provider of SaaS-based education tools, at 4.1x revenue and 13.9x EBITDA
• Toshiba’s $850 million acquisition of IBM’s Retail Store Solutions business, which offers point-of-sale technology and software to collect and analyze data around customers’ purchasing trends
• India-based Piramal Healthcare’s $635 million acquisition of Decision Resources Group, a provider of web-enabled research and predictive analytics via its proprietary databases
There were 27 deals announced worth approximately $3 billion among Healthcare Software and Healthcare Information companies in 2Q12. In addition to Veritas Capital’s $1.3 billion buyout of Thomson Reuters Healthcare and Genstar Capital’s $400 million acquisition of eResearch Technology, healthcare-related transactions during the most recent quarter included: • Lightyear Capital’s $335 million acquisition of Fidelity National Information Services’ Healthcare Benefits Solutions Business,
which provides benefits administration, account processing and payment fulfillment to healthcare providers, at 2.8x revenue • Silver Lake Partners’ $120 million acquisition of MEDSEEK, a provider of online strategic patient engagement and analytics
solutions for healthcare organizations• Capita Group’s $31 million acquisition of Clinical Solutions Holdings, which provides decision support and clinical
knowledge software solutions to healthcare staff
BuyERS Investors continued to make up the majority of activity in 2Q12, accounting for 74 percent of activity and 15 percent of value in the segment. Private equity buyers announced 14 acquisitions totaling $3.9 billion.
1Q12 2Q12 1H12 vs 2H11 LTM
SubsegmentNumber of
TransactionsDeal Value($ Millions)
Number of Transactions
Deal Value($ Millions)
Number of Transactions
Deal Value($ Millions)
Number of Transactions
Deal Value($ Millions)
Strategic 37 13,979 23 4,006 (25%) (67%) 301 66,183Private Equity - Buyout 9 7,662 14 3,870 35% (45%) 58 27,038Private Equity - VC/Growth Capital 71 923 105 1,433 36% (56%) 436 6,186
Total 117 22,564 142 9,309 15% (61%) 795 99,406
1Q12 2Q12 1H12 vs 2H11 LTM
SubsegmentNumber of
TransactionsDeal Value($ Millions)
Number of Transactions
Deal Value($ Millions)
Number of Transactions
Deal Value($ Millions)
Number of Transactions
Deal Value($ Millions)
Strategic 29 1,859 20 779 (33%) (58%) 262 8,307Private Equity - Buyout 0 0 0 0 (100%) (100%) 7 363Private Equity - VC/Growth Capital 32 260 35 443 (03%) (76%) 282 4,331
Total 61 2,118 55 1,222 (19%) (64%) 551 13,001
Software & Information Transactions by Type of Buyer
Digital Advertising Transactions by Type of Buyer
(% Change)
(% Change)
10

1Q12 2Q12 1H12 vs 2H11 LTM
SubsegmentNumber of
TransactionsDeal Value($ Millions)
Number of Transactions
Deal Value($ Millions)
Number of Transactions
Deal Value($ Millions)
Number of Transactions
Deal Value($ Millions)
Printer 11 149 7 107 38% (4%) 56 2847Logistics 2 33 4 250 (14%) (56%) 17 1480Loyalty/Retention 1 15 3 37 (50%) (75%) 28 1206Retail Services 1 20 3 354 33% 476% 13 4650Data Processing/Enhancement 0 0 2 6 100% (65%) 10 128Database/Analytics 1 6 1 25 (75%) (74%) 28 1253Fulfillment 1 150 1 15 (33%) 224% 8 270List Broker/Manager 0 0 1 5 NM NM 2 16
Subtotal 17 373 22 800 (9%) (14%) 162 11,849Other 6 305 0 0 (40%) (56%) 47 2210
Total 23 678 22 800 (15%) (28%) 209 14,059
Other subsegments includes Ad Specialty/Premiums, Call Center, Channel Services, Collections, Lettershop, Offline Lead Generation, Performance/Contract Sales and Printer-Transactional
Most Active Marketing Services Subsegments
(% Change)
11
MARKETINg SERVICES FIRST HalF DEal NOTES 2012
M&A AND INVESTOR ACTIVITy A total of 22 transactions were announced in the Marketing Services segment in 2Q12 for approximately $800 million. Compared to the previous quarter, volume was flat while value increased 18 percent. While there was a 36 percent decrease in the number of deals in the Printer subsegment, it was still the most active subsegment with seven acquisitions in 2Q12. The other active Marketing Services subsegments during the quarter were Logistics, with four transactions worth approximately $250 million, and Retail Services, which accounted for three transactions valued at $354 million. Transactions in the subsegment included:
• TorQuest Partners’ $103 million acquisition of Array Marketing Group, a customer merchandising solutions provider for brands and retailers
• Acosta Sales & Marketing’s acquisition of Mosaic Sales & Marketing, a field marketing, merchandising and sales company, to provide greater depth and breadth to Acosta’s marketing and sales services
• ComVest Group’s $12 million buyout of Carta Commerce, a provider of card-linked marketing solutions that increase revenue and customer loyalty for merchants, banks, card issuers and loyalty programs
BuyERS Similar to the prior quarter, strategic buyers accounted for the majority of transaction activity in 2Q12, with 13 transactions valued at approximately $427 million. Two buyout transactions and seven investments were announced.
1Q12 2Q12 1H12 vs 2H11 LTM
SubsegmentNumber of
TransactionsDeal Value($ Millions)
Number of Transactions
Deal Value($ Millions)
Number of Transactions
Deal Value($ Millions)
Number of Transactions
Deal Value($ Millions)
Strategic 19 415 13 427 (11%) (69%) 148 7,068Private Equity - Buyout 2 245 2 278 (60%) (87%) 30 6,441Private Equity - VC/Growth Capital 2 18 7 95 29% (72%) 31 550
Total 23 678 22 800 (15%) (79%) 209 14,059
1Q12 2Q12 1H12 vs 2H11 LTM
SubsegmentNumber of
TransactionsDeal Value($ Millions)
Number of Transactions
Deal Value($ Millions)
Number of Transactions
Deal Value($ Millions)
Number of Transactions
Deal Value($ Millions)
Strategic 6 3,466 10 3,626 (43%) (29%) 69 10,234Private Equity - Buyout 2 208 2 131 100% (80%) 12 2,220Private Equity - VC/Growth Capital 2 8 3 331 (29%) (50%) 22 720
Total 10 3,682 15 4,087 (32%) (37%) 103 13,174
Out-of-Home & Specialty Media Transactions by Type of Buyer
Marketing Services Transactions by Type of Buyer
(% Change)
(% Change)

OuT-Of-HOME & SPECIALTy MEDIA FIRST HalF DEal NOTES 2012
M&A AND INVESTOR ACTIVITy Petsky Prunier tracked 15 transactions among Out-of-Home & Specialty Media companies in 2Q12 (12 acquisitions and three investments), totaling approximately $4.1 billion in deal value. In comparison to the prior quarter, the number of transactions in the segment increased by 50% and total deal value increased by 11 percent. Entertainment Media was the most active subsegment in 2Q12, with five transactions worth approximately $3.1 billion, up from none in 1Q12. Transactions included:
• Dalian Wanda Group’s $2.6 billion acquisition of AMC Entertainment, at 1.0x revenue and 9.8x EBITDA• Cerberus Capital Management’s $740 million acquisition of AT&T’s Yellow Pages businesses, AT&T Advertising Solutions
and AT&T Interactive• Providence Equity Partners’ $200 million growth equity investment in entertainment media production company
The Chernin Group• MTB Holdings’ $42 million acquisition of Eastern Holdings, which publishes consumer magazines and trade journals, as well
as organizing exhibitions and marketing events
BuyERS Strategic buyers announced 10 transactions worth approximately $3.6 billion, accounting for 67 percent of activity and 89 percent of value in 2Q12. Transaction activity among both venture and growth capital and private equity firms was flat compared to the previous quarter.
1Q12 2Q12 1H12 vs 2H11 LTM
SubsegmentNumber of
TransactionsDeal Value($ Millions)
Number of Transactions
Deal Value($ Millions)
Number of Transactions
Deal Value($ Millions)
Number of Transactions
Deal Value($ Millions)
Strategic 19 415 13 427 (11%) (69%) 148 7,068Private Equity - Buyout 2 245 2 278 (60%) (87%) 30 6,441Private Equity - VC/Growth Capital 2 18 7 95 29% (72%) 31 550
Total 23 678 22 800 (15%) (79%) 209 14,059
1Q12 2Q12 1H12 vs 2H11 LTM
SubsegmentNumber of
TransactionsDeal Value($ Millions)
Number of Transactions
Deal Value($ Millions)
Number of Transactions
Deal Value($ Millions)
Number of Transactions
Deal Value($ Millions)
Strategic 6 3,466 10 3,626 (43%) (29%) 69 10,234Private Equity - Buyout 2 208 2 131 100% (80%) 12 2,220Private Equity - VC/Growth Capital 2 8 3 331 (29%) (50%) 22 720
Total 10 3,682 15 4,087 (32%) (37%) 103 13,174
Out-of-Home & Specialty Media Transactions by Type of Buyer
Marketing Services Transactions by Type of Buyer
(% Change)
(% Change)
1Q12 2Q12 1H12 vs 2H11 LTM
SubsegmentNumber of
TransactionsDeal Value($ Millions)
Number of Transactions
Deal Value($ Millions)
Number of Transactions
Deal Value($ Millions)
Number of Transactions
Deal Value($ Millions)
Digital Agency 34 853 27 899 36% 112% 192 5,375General Agency 9 129 8 184 13% 6% 61 1,216Experiential Marketing 8 334 6 117 8% 146% 32 893Social Agency 2 13 6 48 (33%) (82%) 29 583Design Agency 0 0 5 65 (44%) (81%) 20 674Healthcare Agency 4 63 4 63 14% (5%) 35 1,795Public Relations 11 241 4 39 (21%) (60%) 51 1,397Promotion Agency 2 25 3 40 150% 87% 13 153Other Consulting 8 1,735 2 100 (71%) 351% 75 5,157Specialty Agency 3 31 2 503 (17%) (41%) 19 1,534Marketing Consulting 2 922 1 1 (85%) 84% 32 1,603Media Planning/Buying 2 30 0 0 0% (54%) 13 667
Subtotal 85 4,376 68 2,057 (17%) 36% 572 21,048Other 11 428 0 0 (21%) 23% 38 1,310
Total 96 4,804 68 2,057 (17%) 35% 610 22,357
1Q12 2Q12 1H12 vs 2H11 LTM
SubsegmentNumber of
TransactionsDeal Value($ Millions)
Number of Transactions
Deal Value($ Millions)
Number of Transactions
Deal Value($ Millions)
Number of Transactions
Deal Value($ Millions)
Digital Video 13 1,244 15 164 8% 74% 106 3,653Mobile Marketing 19 472 11 114 (21%) 6% 141 2,313Ad Networks/Exchanges 10 188 11 221 (16%) (47%) 111 2,291Online Lead Generation 10 97 7 105 (37%) (52%) 101 2,358Affiliate/CPA Network 4 59 5 530 50% 861% 23 828Search Marketing 1 15 4 80 (58%) (83%) 34 895Game Advertising 1 15 1 5 (33%) (1%) 10 132Email Services 3 28 1 3 (43%) (50%) 25 532Total 61 2,118 55 1,222 (19%) 2% 551 13,001
1Q12 2Q12 1H12 vs 2H11 LTM
SubsegmentNumber of
TransactionsDeal Value($ Millions)
Number of Transactions
Deal Value($ Millions)
Number of Transactions
Deal Value($ Millions)
Number of Transactions
Deal Value($ Millions)
Printer 11 149 7 107 38% (4%) 56 2847Logistics 2 33 4 250 (14%) (56%) 17 1480Retail Services 1 20 3 354 33% 476% 13 4650Loyalty/Retention 1 15 3 37 (50%) (75%) 28 1206Data Processing/Enhancement 0 0 2 6 100% (65%) 10 128Database/Analytics 1 6 1 25 (75%) (74%) 28 1253Fulfillment 1 150 1 15 (33%) 224% 8 270List Broker/Manager 0 0 1 5 NM NM 2 16Call Center 3 65 0 0 (25%) (90%) 17 1237Collections 2 40 0 0 NM NM 5 95
Total 23 678 22 800 (15%) (28%) 209 14,059
1Q12 2Q12 1H12 vs 2H11 LTM
SubsegmentNumber of
TransactionsDeal Value($ Millions)
Number of Transactions
Deal Value($ Millions)
Number of Transactions
Deal Value($ Millions)
Number of Transactions
Deal Value($ Millions)
Entertainment Media 0 0 5 3,064 67% 33% 10 6,031B-to-B Media 3 17 4 105 (30%) (63%) 26 523Digital Place-Based Media 4 58 3 38 (53%) (68%) 41 826Traditional Outdoor 2 3,603 2 130 (50%) 1,052% 19 4,200Yellow Pages 1 4 1 750 100% 9,820% 3 762Other 0 0 0 0 NM NM 4 831Subtotal 10 3,682 15 4,087 (41%) 388% 99 12,342
Total 10 3,682 15 4,087 (32%) 138% 103 13,174Other subsegments include Shopper/Trader/Coupons
Most Active Agency/Consulting Subsegments
Most Active Out-of-Home & Specialty Media Subsegments
(% Change)
(% Change)
Other subsegments include Branded Communications, B-to-B Agency, DM Agency, Ethnic/Multicultural Agency and DR Media Buying
Most Active Digital Advertising Subsegments
(% Change)
Most Active Marketing Services Subsegments
(% Change)
12

13
Overview of 1H12 M&A and Investment Activity (continued from page 2)
1H12 Most Active Investors by Number of Transactions
BuyerNumber of Transactions Representative Targets
Accel Partners 14 Avito.ru, Baby.com.br, BeachMint, CardSpring, Dragonplay, Endorse, Qualtrics, VigilentAndreessen Horowitz 13 Belly, GitHub, Mixpanel, Priceonomics, Skout, Shoptiques, Clover, NationBuilderGoogle Ventures 12 Adimab, AppStack, AVOS Systems, ClearStory Software, Machinima, Nimble, YeswareIntel Capital 9 AtHoc, Adaptivity, BrightEdge, Fashion.me, KupiVip.ru, ScienceLogic, SpeaktoitNew Enterprise Associates 9 10gen, Blue Jeans Network, BuzzFeed, Compass Labs, Lithium Technologies, SugarCRMNorwest Venture Partners 9 Adaptive Planning, Elemental Technologies, Gemvara, Komli Media, Manta Media, ModCloth500 Startups 7 955 Dreams, Curebit, FlightFox, Mile High Organics, NetPlenish, Senzari, SwitchcamAugust Capital Management 7 Adara Media, Aisle50, Ditto Technologies, Flingo, PubMatic, Tegile Systems, ThreatmetrixFoundry Group 7 Attachments.me, BigDoor Media, DataHero, Fitbit, Mocavo, SEOmoz, SinglyKleiner Perkins Caufield & Byers 7 Airtime Media, AppDynamics, Drawbridge, Karma Science, Shape Security, SoundCloudBattery Ventures 6 Avalara, Neolane, RelayFoods.com, SingleHop, Sprinklr, SumallCrosslink Capital 6 Scripted, 500friends, Affine, Coupa Software, GraphDive, RichRelevanceNEA 5 BOKU, Curalate, If This Then That, Viddy, WibiData.comSequoia Capital 5 Birst, FutureAdvisor, Kaminario, Songkick.com, The Backplane
Digital Advertising activity was led by the Mobile Marketing subsegment, which accounted for a quarter of deal volume and one-fifth of deal value in the segment, reflecting the growing prevalence of tablet applications and improved social media access through mobile devices. Transactions in the segment included:
• Singapore Telecommunications’ $321 million acquisition of Amobee Media Systems, a provider of mobile advertising solutions, at 10.7x revenue
• PlayPhone’s $52 million acquisition of SocialHour, a mobile marketing firm specializing in social marketing and lead generation
INVESTMENT ACTIVITyInvestments totaling $11.2 billion accounted for 56 percent of overall volume and 14 percent of deal value in 1H12. Digital Media/Commerce was the most active and highest value segment for investment, with 331 deals announced worth $4.4 billion. eCommerce, Social Media/Apps and Mobile Content/Apps were the three most active subsegments in the first six months of the year, accounting for 68 percent of investments in the segment. Digital Media/Commerce investments included:
• General Atlantic’s $304 million investment in Axel Springer Digital Classifieds, at a reported $1 billion valuation
• Microsoft’s $300 million investment in B&N tablet NOOK, at a reported $1.7 billion valuation
• Rakuten’s $100 million investment in social network Pinterest, at a reported $1.5 billion valuation
There were 221 announced investments worth approximately $2.6 billion in the Marketing Technology segment in the first half of the year. Social Technology was again the most active subsegment, with 46 investments worth approximately $340 million. Large Marketing Technology deals included:
• JPMorgan Chase’s $100 million investment in Conduit, which provides website owners and bloggers with a platform for building online communities, at a reported $1.3 billion valuation
• Meritech Capital Partners’ $70 million investment in Evernote, which provides an application that allows individuals to save their ideas, projects and experiences, at a reported $1 billion valuation
• August Capital Management’s $45 million investment in digital publishing platform provider PubMatic
BuyER & INVESTOR ACTIVITyStrategic buyers accounted for 41 percent of all control deals and 68 percent of transaction value in 1H12, with 602 transactions worth approximately $53.3 billion. More than 50 percent of those transactions occurred within the Digital Media/Commerce and Agency/Consulting segments, while another 22 percent were announced within the Marketing Technology segment. The most active strategic buyers in 1H12 were WPP Group, Publicis Groupe, Facebook and Groupon with 15, eight, six and six announced transactions.
Buyout firms announced 50 acquisitions totaling $13.7 billion in 1H12. The Software & Information segment accounted for 84 percent of total buyout value with 23 transactions reaching $11.5 billion in value. The Agency/Consulting segment was the second most active segment. Sizeable buyout transactions announced in 1H12 included:
• Veritas Capital’s $1.3 billion buyout of Thomson Reuters Healthcare
• Apax Partners’ $1 billion acquisition of Paradigm, a software company focused on the oil and natural gas industry
• Genstar Capital’s $400 million buyout of eResearch Technology, a provider of health outcomes research services to biopharmaceutical sponsors and contract research organizations, at 2.2x revenue and 9.8x EBITDA
(Continued on page 14)
14
Overview of 1H12 M&A and Investment Activity (continued from page 13)
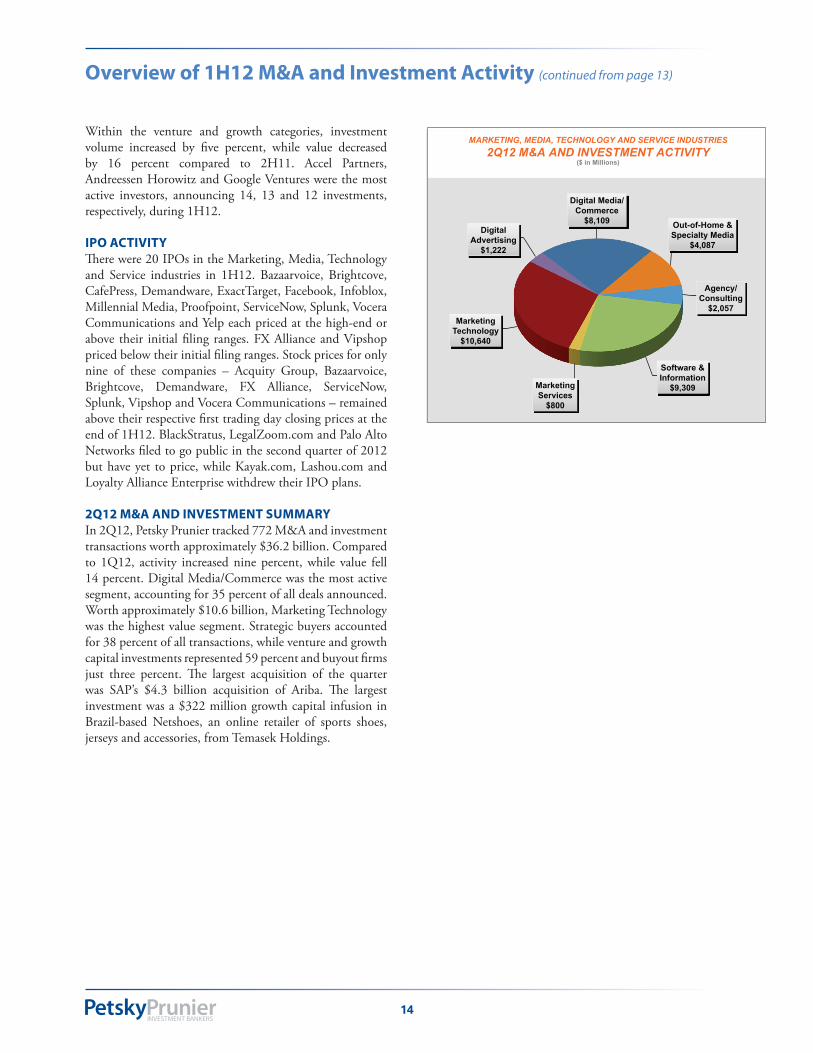
Within the venture and growth categories, investment volume increased by five percent, while value decreased by 16 percent compared to 2H11. Accel Partners, Andreessen Horowitz and Google Ventures were the most active investors, announcing 14, 13 and 12 investments, respectively, during 1H12.
IPO ACTIVITyThere were 20 IPOs in the Marketing, Media, Technology and Service industries in 1H12. Bazaarvoice, Brightcove, CafePress, Demandware, ExactTarget, Facebook, Infoblox, Millennial Media, Proofpoint, ServiceNow, Splunk, Vocera Communications and Yelp each priced at the high-end or above their initial filing ranges. FX Alliance and Vipshop priced below their initial filing ranges. Stock prices for only nine of these companies – Acquity Group, Bazaarvoice, Brightcove, Demandware, FX Alliance, ServiceNow, Splunk, Vipshop and Vocera Communications – remained above their respective first trading day closing prices at the end of 1H12. BlackStratus, LegalZoom.com and Palo Alto Networks filed to go public in the second quarter of 2012 but have yet to price, while Kayak.com, Lashou.com and Loyalty Alliance Enterprise withdrew their IPO plans.
2Q12 M&A AND INVESTMENT SuMMARyIn 2Q12, Petsky Prunier tracked 772 M&A and investment transactions worth approximately $36.2 billion. Compared to 1Q12, activity increased nine percent, while value fell 14 percent. Digital Media/Commerce was the most active segment, accounting for 35 percent of all deals announced. Worth approximately $10.6 billion, Marketing Technology was the highest value segment. Strategic buyers accounted for 38 percent of all transactions, while venture and growth capital investments represented 59 percent and buyout firms just three percent. The largest acquisition of the quarter was SAP’s $4.3 billion acquisition of Ariba. The largest investment was a $322 million growth capital infusion in Brazil-based Netshoes, an online retailer of sports shoes, jerseys and accessories, from Temasek Holdings.
22%
Software & Information
$9,309 Marketing Services
$800
Marketing Technology
$10,640
Digital Advertising
$1,222
Digital Media/ Commerce
$8,109 Out-of-Home & Specialty Media
$4,087
Agency/ Consulting
$2,057
MARKETING, MEDIA, TECHNOLOGY AND SERVICE INDUSTRIES
2Q12 M&A AND INVESTMENT ACTIVITY ($ in Millions)
MARKETING, MEDIA, TECHNOLOGY AND SERVICE INDUSTRIES 2Q12 M&A AND INVESTMENT ACTIVITY
($ in Millions)

15
THE BENEfIT Of THE CLOuDPlacing data in the cloud provides significant cost savings on infrastructure, maintenance and headcount, while also offering analytical benefits. It allows solutions providers to publish the same data to different users in different ways, ways that are relevant to each of them, Stoecker says. “As new features are released, we can put them in the cloud without shipping anything out. We can build new apps without engaging IT at all. The speed of the analytics is more than just the kind of analytics being produced.”
The cloud is also providing new opportunities for utilizing data. For instance, after Dollar General, which has 10,000 stores, began working with 1010data, the company realized that having its data in the cloud meant it could be made available to manufacturers, providing CPGs with further insight to help with marketing and promotion.
Dollar General and 1010data created a cloud-based vendor portal program that allows CPGs to look at, not just their own products, but everybody’s products, enabling the manufacturers to do an ‘affinity analysis’ and determine, for example, the likelihood that someone who buys a two-liter bottle of Coke will also buy chips. “That level of access to data is unprecedented,” Steier says.
BIg DATA’S BIg fuTuREThe challenge, Stoecker says, is to make sure you’re always able to consume data from new sources. You have to have the tools that allow that and then be able to make sense out of it. Overall, “I think it’s important to understand that big data can be translated into big opportunities. We want people to be excited about big data, not afraid of it.”
The growth we’ve seen as a result of an increasing number of sources, including the Internet, smart machines and social networks, “will undoubtedly continue,” says Steier, “although I believe we are close to the limit. If people could start to do things with the data they collect they would collect more, and, if the big data industry is successful, that will cause even more data to be collected. I think data will become even more valuable and people will collect even more of it, and it will snowball.”
In addition, Steier feels that any large company’s data is likely useful outside its own industry. “With the right ingenuity, someone could look at data from almost any industry and find some value in it.”
Stoecker predicts that data growth will outpace people’s ability to know what to do with it. Therefore, the challenge for vendors is to focus not on the data itself, but on the opportunities of knowing what to do with it. He advises that companies need to remember to focus on being proactive, not reactive. As data analysis continues its transition away from IT and into the lines of business, companies will see “magnitude improvements” in performance over the IT model. “If it took 100 days before to get a query or analysis done, it takes 10 days now,” he says. “But, it has to be done at the lines of business with tools that emulate what has traditionally been in BI stacks.”
Adds Vina, “It’s cheaper and cheaper to store data today. The challenge will be in finding efficient ways to manage, govern, use, publish and expose that data inside corporations.”
“If people could start to do things with the data they collect they would collect more, and if the big data industry is successful, that will cause even more data to be collected. I think data will become even more valuable and people will collect even more of it, and it will snowball.”
Sandy Steier, CEO, 1010data
Big Data’s Big Opportunities and Challenges: Turning an ever-increasing amount of information into actionable insight(continued from page 3)

16
“Hyper-local marketing is about joining the online and offline worlds to follow consumers from stimulus to actual spend,” says Mark Marinacci, edo Interactive’s chief revenue officer. For the past year, edo has been live with more than 100 participating banks, including Ally Bank and Fifth Third Bank, delivering relevant, digital offers accessed via customers’ credit cards that are instantly redeemable at the merchant’s cash register. The banks provide edo with an anonymous set of credit or debit card customer records, which edo analyzes and segments to deliver targeted offers to credit card holders based on customer spending patterns. Marinacci points out that the bank data use is compliant with all regulations and there is no personally identifiable information (PII) involved.
“We’ve created a new audience channel that has more data for targeting, more scale and more measurability for marketers,” says Marinacci. “There’s no need for a merchant to upgrade their POS systems; no software, hardware or staff training involved. In addition, consumers don’t need to download an app, they just swipe their credit cards.”
MOBILE, DIgITAL DISTRIBuTION PARTNERSHIPS SHAPE fuTuREedo is launching Prewards programs for two of the top five credit issuers, and is in discussions with many more, according to Marinacci. Some of those discussions will incorporate mobile offers, as banks think more creatively about how to take care of their customers. “The deal market today is primarily email and is moving increasingly to mobile,” he says. “We used to target based on search, then based on friends, then based on foursquare check-in. But now, the transaction data is what’s differentiating targeting, and transactions plus location will be the next big thing.” For example, a rule can be set within the Prewards platform that, if a consumer makes a purchase at a Macy’s near a PF Chang’s, the system will offer an incentive to stay for lunch via the consumer’s mobile device.
Also on the horizon are digital distribution partnerships that combine massive online audiences with the tens of thousands of local promotions available through companies including Local Corporation and Entertainment. “We have more than $10 million worth of coupons sitting there every day,” says DeBiase of Entertainment, whose company has agreements to provide local advertising offers to Google and eBay, and expects to announce more over the next 18 months. “These companies want to leverage our content and technology to accelerate the sales on their sites.”
And don’t count daily deals out yet. Each of these executives agrees that daily deals have a role to play, albeit a more limited one that needs to be integrated into the hyper-local marketing landscape. “Daily deals only work for certain verticals,” says Local Corporation’s CEO Clarke. “It should be one of a group of products that marketers use to solve the online/offline gap.”
“Merchants need a way to engage consumers on multiple levels,” agrees DeBiase. “We have daily deals in most of our profitable markets, but they are a selective tool for merchants to use for acquisition marketing.”
Hyper-Local Marketing Evolves Beyond Daily Deals: Digital promotions now drive expanded set of integrated online/offline marketing programs(continued from page 4)
“We used to target based on search, then based on friends, then based on foursquare check-in. But now, the transaction data is differentiating targeting for us, and transactions plus location will be the next big thing.”
Mark Marinacci, chief revenue officer, edo Interactive

17
business data completely separately and allows people to use the mobile device freely in their personal life. We’ve found a way to deliver what the business needs and still have total security and control over data.”
Herrema also believes companies can find hidden savings when the funds associated with all the returned BlackBerrys are put to better use. “Smart companies take the savings and attach more of their employees to the BYOD security system. There are huge productivity benefits at the lower levels when you broaden the number of employees connected.”
POLICy, STRATEgy, KEyS TO SuCCESSfuL MOBILE DATA MANAgEMENT MDM is being utilized by many companies, particularly those in highly regulated fields, such as financial services, healthcare and government. Professional services firms that cater to these markets also have a strong need to monitor and secure data related to their clients’ businesses.
“We have customers in government, aerospace, energy, healthcare and retail, as well as other industries,” says Zenprise’s Pandey. “In many ways, companies have a good sense about what security level applies to what documents. We’re just extending those policies to the phone, which is now the equivalent of the laptop in terms of information stored. The data wipe and lock-in capability we have is essential. We need to make sure mobile phones have the capability to lock down data.”
Ultimately, MDM is about managing data and establishing a corporate culture and policies that make data security a priority throughout the organization. “We prefer to think of what we do as mobile data management, not mobile device management,” explains Good Technology’s Herrema. “You don’t have to manage the device if you can control the data.”
Zenprise has a similar approach to MDM. “We’re not managing only at the device level, we are managing at the corporate policy level,” agrees Pandey. “We’re managing data at the source, so the smartphone or tablet is just the access point.”
Pandey suggests that companies considering MDM carefully evaluate their use cases to determine how much data security is needed and how intrusive or transparent it should be to the end user. “This is not a trial solution. Many companies are tempted to put something in place quickly. But in a large company, it’s best to be proactive, not reactive. The challenge is to sit down and think through all your requirements, as well as the long-term threats to your data security.”
Mobile growth Drives Increasing Need for Data Security: New solutions protect data, as lines blur between personal and business devices (continued from page 5)
“We prefer to think of what we do as mobile data management, not mobile device management. You don’t have to manage the device if you can control the data.”
John Herrema, senior vice president of corporate strategy, Good Technology
“This is not a trial solution. Many companies are tempted to put something in place quickly. But in a large company, it’s best to be proactive, not reactive. The challenge is to sit down and think through all your requirements, as well as the long-term threats to your data security.”
Amit Pandey, president and CEO, Zenprise

Securities offered through Petsky Prunier Securities, LLC, member FINRA/SIPC
Expertise. Commitment. Results. [email protected] Broad Street, 38th FloorNew York, NY 10004
Petsky Prunier is one of the leading investment banks in the internet, marketing, media, technology, information, healthcare and service industries. Our firm’s mergers and acquisitions and private placements advisory services reflect a unique blend of product specialization and industry expertise. Together with strategic consulting firm Winterberry Group, a Petsky Prunier company, the organization represents one of the largest industry-specific advisors providing strategic and transactional services. Securities transactions are processed through Petsky Prunier Securities LLC.
ABOuT PETSKy PRuNIER LLC
RECENT TRANSAC TIONS
has been sold to a leader in global healthcare primary market research and influence network mapping
a portfolio company of
a leader in multichannel retail, eCommerce and loyalty marketing services
has been sold to
a provider of a cloud-based integration platform for the digital
marketing industry
has received $15M financing led by
a leader in technology and global in-app advertising for Facebook,
Apple (iOS), and Android developers
has received a $66M investment from
a leading digital direct marketing company utilizing a proprietary database to provide customer
acquisition solutions for major brands
has received an equity investment from
with debt financing from
has sold
and
a leading provider of services for domain name registration, acquisition,
brokerage and sales
to
has been sold to the top independent
direct-to-consumer marketer of dental savings plans
a leading provider of taxi-based outdoor media
has been sold to
(NYSE: PAY)
has been sold to
a global digital marketing agency
a leading data management and audience optimization platform
(DMP) company
a unit of
a leading marketing services
and BPO company
has sold
to
has sold
to
a leading provider of integrated data, technology and analytics solutions
has acquired
a pioneer in measuring the impact of promotion on
physician prescribing behavior
has sold
a premier provider of affinity programs for universities and colleges
to
a leading advertising technology company
(Xetra: DPW.DE)
has been sold to
(TSX: PTO)
to
a portfolio company of
Vestar Capital Partners
has sold
and
a portfolio company of
Parthenon Capital Partners
has merged with
has been sold to (Nasdaq:GSIC)
has sold
a leading urban and multicultural agency
to
a subsidiary of
(NYSE: IPG)
has received a majority investment from
has been sold to
a leading shopper marketing execution company
a rapidly growing provider of online and offline performance-based customer
acquisition solutions to a number of the largest suppliers of home services in the
U.S. the leader in attribution management and
online advertising analytics