DDOT Guidelines on Vehicular and Pedestrian Interval ... on Vehicular and... · DDOT Guidelines on...
14
DDOT Guidelines on Vehicular and Pedestrian Interval Calculation (Revision 6 – January 25, 2013) INTRODUCTION The purpose of this memo is to outline the procedures and methodologies used in determining the Green (G), Yellow (Y) and All-Red (AR) vehicle intervals, and the pedestrian Walk (W), Flashing Don’t Walk (FDW) and Don’t Walk (DW) times, as part of the citywide traffic signal optimization for the District Department of Transportation (DDOT). The 2009 Federal Highway Administration (FHWA) Manual on Uniform Traffic Control Devices (MUTCD) and the Institute of Transportation Engineers’ (ITE) Manual on Traffic Signal Design specify standard procedures for the calculation of vehicle change and pedestrian clearance intervals. In addition, DDOT-specific guidelines were referenced from the 2009 DDOT Design and Engineering Manual. These methods are explained in detail in the following. In all cases of developing signal timings, engineering judgment governs. VEHICLE INTERVALS The vehicle interval consists of Green (G), Yellow (Y), and All-Red (AR) time. This section details the methods used in calculating these intervals. Standards for Minimum Green time A minimum green time of 10 seconds for the major street, 7 seconds for the minor street and 5 seconds for turn movements shall be provided. Standards for Maximum Green time The maximum green time is the maximum length of time that a phase may be held in green in the presence of an opposing call. The timer starts at the end of the initial interval, in the presence of an opposing call. If there is no opposing call, the timer will be reset until an opposing call occurs. The maximum green time must be calculated for each phase in Plans 1-8 and entered into the MAXIMUM field on the Dial Sheet. MAXIMUM is enabled during Plans 1 through 8. Plan 9 is the emergency evacuation plan. If Plan 9 is used, the maximum green time for each phase shall be calculated and entered into the Dial Sheet as MAXIMUM 2. MAXIMUM 2 is enabled during Plan 9 only. The maximum times must be longer than the green times so that the controller does not force off the phase prematurely. The following calculations add 25% to the longest green time for each phase to allow for longer green times during transition, and for future increases to the phase times. (0A) MAXIMUM = 1.25 x MAX (SPLIT 1-8 – (Y+AR)) (0B) MAXIMUM 2 = 1.25 x (SPLIT 9 – (Y+AR)) Where: Y = Yellow change interval (seconds);
Transcript of DDOT Guidelines on Vehicular and Pedestrian Interval ... on Vehicular and... · DDOT Guidelines on...
DDOT Guidelines on Vehicular and Pedestrian Interval Calculation (Revision 6 – January 25, 2013)
INTRODUCTION
The purpose of this memo is to outline the procedures and methodologies used in determining the Green (G), Yellow (Y) and All-Red (AR) vehicle intervals, and the pedestrian Walk (W), Flashing Don’t Walk (FDW) and Don’t Walk (DW) times, as part of the citywide traffic signal optimization for the District Department of Transportation (DDOT). The 2009 Federal Highway Administration (FHWA) Manual on Uniform Traffic Control Devices (MUTCD) and the Institute of Transportation Engineers’ (ITE) Manual on Traffic Signal Design specify standard procedures for the calculation of vehicle change and pedestrian clearance intervals. In addition, DDOT-specific guidelines were referenced from the 2009 DDOT Design and Engineering Manual. These methods are explained in detail in the following. In all cases of developing signal timings, engineering judgment governs.
VEHICLE INTERVALS
The vehicle interval consists of Green (G), Yellow (Y), and All-Red (AR) time. This section details the methods used in calculating these intervals.
Standards for Minimum Green time A minimum green time of 10 seconds for the major street, 7 seconds for the minor street and 5 seconds for turn movements shall be provided.
Standards for Maximum Green time The maximum green time is the maximum length of time that a phase may be held in green in the presence of an opposing call. The timer starts at the end of the initial interval, in the presence of an opposing call. If there is no opposing call, the timer will be reset until an opposing call occurs.
The maximum green time must be calculated for each phase in Plans 1-8 and entered into the MAXIMUM field on the Dial Sheet. MAXIMUM is enabled during Plans 1 through 8. Plan 9 is the emergency evacuation plan. If Plan 9 is used, the maximum green time for each phase shall be calculated and entered into the Dial Sheet as MAXIMUM 2. MAXIMUM 2 is enabled during Plan 9 only. The maximum times must be longer than the green times so that the controller does not force off the phase prematurely. The following calculations add 25% to the longest green time for each phase to allow for longer green times during transition, and for future increases to the phase times.
(0A) MAXIMUM = 1.25 x MAX (SPLIT1-8 – (Y+AR))
(0B) MAXIMUM 2 = 1.25 x (SPLIT9 – (Y+AR))
Where: Y = Yellow change interval (seconds);

January 25, 2013 Page 2 of 14 AR = All-Red clearance interval (seconds); SPLIT1-8 = Phase Split Times in Plans 1-8 (seconds);
SPLIT9 = Phase Split Time in Plan 9 (seconds).
• MAX (SPLIT1-8 – (Y+AR)) determines the largest green time allotted to a phase in Plans 1-8.
• The calculated MAXIMUM and MAXIMUM 2 values shall be rounded up to the nearest 5 seconds.
Calculation methodology for the Yellow change interval for Through Movements The MUTCD mandates that engineering practices shall be used to determine Yellow clearance intervals. Section 40.7.5 of DDOT’s Design and Engineering Manual states that the minimum duration of the Yellow interval in the District of Columbia shall be 4 seconds. The following formula is recommended by ITE for the calculation of the Yellow change interval:
(1)
Where: Y = Yellow change interval (seconds); t = reaction time, assumed to be 1 second; S = posted speed limit + 5 MPH; D = deceleration rate, assumed to be 10 ft. /sec. 2; G = approach grade in percent.
If a lower Yellow interval is calculated, it shall be adjusted to 4 seconds. Any exceptions shall require approval by DDOT. In addition, the following need to be considered prior to finalizing the Yellow interval:
• The maximum recommended yellow interval is 6 seconds, per MUTCD. • Yellow times shall be rounded to the nearest half-second. For intersections with interval
based controllers which can only utilize integer values, Yellow times shall be rounded to the nearest whole number second.
• For concurrent through phases (i.e. northbound/southbound and eastbound/westbound through movements), the yellow intervals are recommended to be the same duration, with the maximum on either approach being used for both approaches.
The calculation procedures for the Yellow interval for left turn movements and the different left turn phase sequences are described under Left turn phases on page 7.
Calculation methodology for the All-Red clearance interval for Through Movements The MUTCD specifies that the use of the All-Red clearance interval is optional; however, it mandates that engineering practices shall be used to determine All-Red clearance intervals, if used. Per the 2009 DDOT Design and Engineering Manual Section 40.7.6, red clearance intervals are not required, but may be considered where any of the following conditions exist:
Intersections that are wide, offset or contain unusual geometry; Intersections where the visibility of conflicting traffic is blocked or limited; Movements where the approach speeds are 55 mph or more; or Where it is desirable to help clear vehicles that recurrently become queued in the
intersection where there are permissive left turns.
)32.0(733.0
GDStY×+×
+=

January 25, 2013 Page 3 of 14 When AR intervals are used, the minimum duration is recommended to be 1 second for through movements. Typical All-Red clearance intervals range from 1 to 3 seconds, per Section 40.7.6 of DDOT’s Design and Engineering Manual.
The methods utilized by various transportation agencies in the region for the calculation of AR clearance interval were reviewed. The following formulae are being utilized for the purposes of calculation of the AR clearance interval:
(2A)1
vLwAR*47.1
+= (2B)2
vPAR
*47.1= (2C) 2
vLPAR*47.1
+=
(2D)3
vLWAR
*47.1+
=
(2E)4
vwAR
*47.1=
Where:
AR = All-Red clearance interval (sec.); w = distance from stop line to far side of the intersection (ft.); W= distance from the near curb line to the center of the far lane (ft.); P = distance from stop line to far side of the farthest conflicting crosswalk (ft.); L = vehicle length, (assumed to be 20 ft.); v = posted, 85th percentile, operating, design or prevailing speed (varies).
• All Red times shall be rounded to the nearest half-second. For intersections with interval based controllers which can only utilize integer values, All Red times shall be rounded to the nearest whole number second.
Figure 1 on the following page illustrates how the distances “W”, “w”, “P”, and “L” are measured for through movements.
Figure 1 - Measurement of Values of "W", “w”, "P" and “L”5
1 ITE formula in use by MDSHA, VDOT, & Montgomery County; v is posted speed.
2 ITE formula. 3 Formula in use by PennDOT (2009); v is approach speed. 4 Formula in use by NCDOT; v is design speed which is assumed to be the posted speed limit unless a speed study is provided. If provided, the design speed is taken as the 85th percentile speed up to 10 mph over the posted limit. 5 Tarnoff, P. (2004) Traffic Signal Clearance Intervals, ITE Journal

January 25, 2013 Page 4 of 14 The following example illustrates the AR clearance interval that will be obtained through use of each of the above equations. The approximate measurements were taken using Google Earth© at the westbound approach of Benning Road and Minnesota Avenue, NE. Figure 2 shows the intersection and associated measurements.
w = 90 ft. W = 50 ft. P = 115 ft. L = 20 ft.
v = 30 mph
(2A) 30*47.12090 +
=R = 2.50 sec.
(2B) 30*47.1
115=R = 2.61 sec.
(2C) 30*47.120115 +
=R = 3.07 sec.
(2D) 30*47.12050 +
=R = 1.59 sec.
(2E) 30*47.1
90=R = 2.04 sec.
Pursuant to the requirements of the 2009 DDOT Design and Engineering Manual, the methodology described in equation (2E) shall be utilized for the calculation of the AR clearance intervals. Based on a citywide study of 85th percentile speeds, the value of v should be equal to the posted speed limit + 5 MPH, when calculating the AR interval duration for through movements, unless specific speed measurements are available.
The reasons to adopt equation (2E) are outlined below:
• AR times calculated in accordance with equation (2E) are expected to provide sufficient time for a vehicle entering the intersection at the last moment of the Yellow interval to reach the far side of the intersection.
• The start-up lost time typically associated with vehicles on conflicting approaches (on average measured up to 2 seconds) is estimated to provide additional time for the entered vehicle to safely clear the intersection.
• Many intersections in the District of Columbia are near or over capacity and, as illustrated in Tarnoff, P. (2004), the length of the AR interval has a dramatic impact on delays under these conditions. While AR intervals are not required by the MUTCD or DDOT, it is desirable to provide them as an added safety feature. However, the potential safety benefits must be balanced with the desire to reduce intersection delays. Equation (2E) provides the requisite balance.
Figure 2 - Benning Road and Minnesota Avenue, NE
January 25, 2013 Page 5 of 14 The calculation procedures for the AR interval for left turn movements and the different left turn phase sequences is described under Left turn phases in the following pages.
Total vehicle clearance interval (Y+AR) The following rules are applied to the sum of the Yellow and All-Red (Y+AR) intervals:
• The total vehicle clearance interval in the District of Columbia shall never be less than 4.0 seconds in duration, per 2009 DDOT Design and Engineering Manual Section 40.7.6.1.
• Due to rounding, there may be cases where the initial calculated values would be lower than the final / recommended values. Therefore, the total recommended vehicle clearance interval shall be greater than or equal to the total calculated vehicle clearance interval. This requirement can be expressed as:
Any additional clearance time required to satisfy the above requirement shall be added to the recommended Yellow interval in half-second increments. This formula shall not apply to left turn intervals, except as determined by engineering judgment, on a case by case basis

January 25, 2013 Page 6 of 14 T-Intersection Phases Yellow and All-Red intervals for T-Intersection phases shall use the same methodology and rules as for through movement phases except that the measurement for the side street phase shall be measured as shown in Figure 3.
Figure 3 – Measurement of Intersection Widths for T-Intersections
Extension of left edge line for near side of cross-street
w
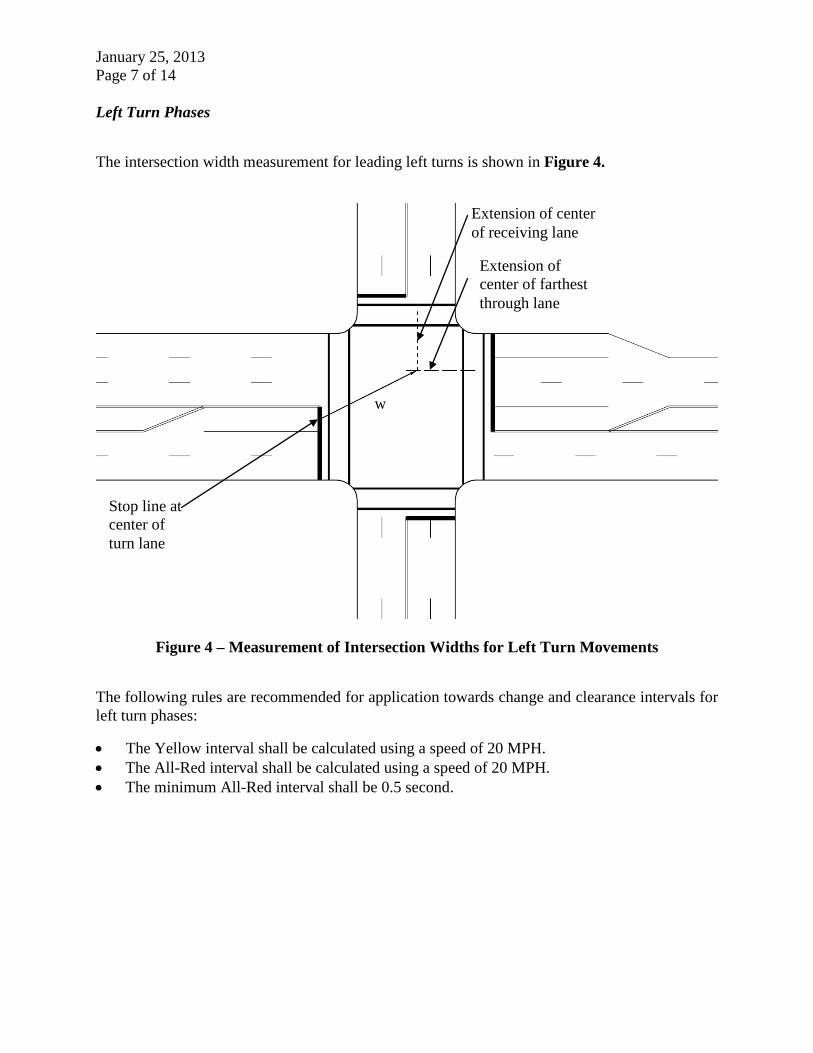
January 25, 2013 Page 7 of 14 Left Turn Phases
The intersection width measurement for leading left turns is shown in Figure 4.
Figure 4 – Measurement of Intersection Widths for Left Turn Movements
The following rules are recommended for application towards change and clearance intervals for left turn phases:
• The Yellow interval shall be calculated using a speed of 20 MPH. • The All-Red interval shall be calculated using a speed of 20 MPH. • The minimum All-Red interval shall be 0.5 second.
w
Extension of center of farthest through lane
Extension of center of receiving lane
Stop line at center of turn lane

January 25, 2013 Page 8 of 14 Leading Left Turns - The Lead-Lead left turn phase sequence has both opposing left-turn phases starting and operating simultaneously6
. Figure 5 shows the ring-barrier structure of a Lead-Lead left turn sequence.
Figure 5: Ring & Barrier Structure for Exclusive/Permissive (E/P) Lead-Lead left turn display
The following rules are applied for a lead left turn phase sequence:
• The default maximum All-Red interval for a leading left turn shall be 1 second. All-Red intervals for leading left turn phases shall be increased by ½-second for each ½-second the calculated All-Red interval exceeds 3 seconds, as outlined in Table 1: Table 1: Leading Left Turn All-Red Interval Adjustments
Calculated AR Interval
Default AR Interval
AR Interval Adjustment
Recommended AR Interval
< 3.0 seconds 1 second 0 seconds 1 second
3.0 to 3.49 seconds 1 second 0.5 seconds 1.5 seconds
3.5 to 3.99 seconds 1 second 1 second 2 seconds
4.0 to 4.49 seconds 1 second 1.5 seconds 2.5 seconds
4.5 to 4.99 seconds 1 second 2 seconds 3 seconds
≥ 5 seconds 1 second 2 seconds 3 seconds • The minimum All-Red interval for a leading left turn shall be 0.5 second.
Lagging Left Turns - The Lead-Lag left turn phase sequence has one of the opposing left turn phases starting and operating concurrent with its respective through movements, and the other left turn phase starting subsequent to the opposing through movement and ending simultaneously with its concurrent through movement6. Figure 6 indicates the ring-barrier structure of a Lead-Lag left turn sequence.
6 Traffic Signal Timing Manual, U.S. Department of Transportation, Washington, D.C., June 2008

January 25, 2013 Page 9 of 14
Figure 6: Ring & Barrier Structure for Lead-Lag left turn display
The following rules are applied for a lag left turn phase sequence:
• The Yellow interval for a lagging left turn movement that terminates concurrently with an adjacent through movement shall be the same as the adjacent through movement.
• The All-Red interval for a lagging left turn movement that terminates concurrently with an adjacent through movement shall be the same as the adjacent through movement.
Dual Lagging Left Turns - The Lag-Lag left turn phase sequence has both opposing left-turn phase sequences starting subsequent to the through movements and ending simultaneously6. Figure 7 illustrates the ring-barrier structure of a Lag-Lag left turn phase sequence.
Figure 7: Ring & Barrier Structure for Lag-Lag left turn display
The following rules are applied for dual left turn lagging sequences:
• The Yellow interval for dual lagging left turn movements that terminate concurrently shall be the maximum of the Yellow intervals calculated for each movement using a speed of 20 MPH.
• The All-Red time for dual lagging left turn movements that terminate concurrently shall be the maximum of the All-Red times calculated for each movement using a speed of 20 MPH.
If a left turn phase is assigned differing sequences in different time of day plans (e.g. leading AM, lagging PM), the maximum calculated Yellow and All-Red intervals for that movement shall be used in all plans.

January 25, 2013 Page 10 of 14 Right Turn Phases Yellow and All-Red intervals for right turning phases shall use the same methodology and rules as for left turning phases, except with a speed (both for the Yellow and All-Red) of 15 MPH.
When a right turn phase is overlapped with a left turn phase and the phases terminate concurrently, the All-Red time for the left turn phase shall apply to the right turn phase. Exceptions to this rule may be made based on engineering judgment on a case by case basis.
Rounding Procedures Table 2 given below provides an outline of the rounding procedures to be adopted while calculating the Yellow and All-Red intervals along with relevant examples for both phase-based and interval-based controllers.
Table 2: Rounding Procedures and Examples:
Clearance Interval
Controller Type
Calculated value (up to
second decimal)
Round Calculated
Value Example
Y and AR Phase Value < 0.25 Down to nearest second
Ycalc = 4.16sec, Yrecommend = 4.0sec
Y and AR Phase 0.25 ≤ Value < 0.50
Up to nearest half-second
ARcalc = 4.42sec, ARrecommend = 4.5sec
Y and AR Phase 0.50 ≤ Value <0.75
Down to nearest half-second
Ycalc = 5.65sec, Yrecommend = 5.5sec
Y and AR Phase Value ≥ 0.75 Up to nearest second
ARcalc = 3.82sec, ARrecommend = 4.0sec
Y and AR Interval Value < 0.50 Down to nearest second
Ycalc = 4.45sec, Yrecommend = 4.0sec
Y and AR Interval Value ≥ 0.50 Up to nearest second
ARcalc = 5.52ec, ARrecommend = 6.0sec
Where, Ycalc = Calculated Yellow interval; Yrecommend = Recommended Yellow interval; ARcalc = Calculated All-Red interval; ARrecommend = Recommended All-Red interval.

January 25, 2013 Page 11 of 14 PEDESTRIAN INTERVALS
The pedestrian interval consists of the Walk (W), Flashing Don’t Walk (FDW) which is also referred to as the Pedestrian Change Interval, and Don’t Walk (DW) signal indications. Figure 8 illustrates the pedestrian intervals and the associated vehicle intervals in which they are permitted to occur at DDOT signals. The equations referenced in the figure are discussed on the following pages.
As shown in Figure 8, a pedestrian clearance time (PCT) must be calculated consisting at minimum of a FDW interval and a buffer interval in which a solid DW indication is displayed. The buffer interval shall be the maximum of the Yellow plus All-Red intervals or 3 seconds.
Figure 8 - Pedestrian Intervals Source: 2009 MUTCD

January 25, 2013 Page 12 of 14
pedestrian
crosswalk
SDPCT =
Calculation methodology for the Flashing Don’t Walk interval In order to determine the FDW interval for the controller, dial sheets (timing plans), and Synchro, the pedestrian clearance time (PCT) must be calculated. The MUTCD states that the “pedestrian clearance time should be sufficient to allow a pedestrian crossing in the crosswalk who left the curb or shoulder at the end of the WALKING PERSON (symbolizing WALK) signal indication to travel at a walking speed of 3.5 feet per second, to at least the far side of the traveled way or to a median of sufficient width for pedestrians to wait.” The requirement is expressed using the following formula:
(3)
Where:
PCT = Pedestrian Clearance Time (sec.); D = Crossing distance, measured from curb to curb along the center of the crosswalk (ft.);
S = Pedestrian walking speed (ft. /sec.);
• The pedestrian walking speed used shall be 3.5 ft. /sec., per MUTCD.
The FDW interval can then be determined using one of the following formulas, based on engineering judgment on a case by case basis:
(4A) FDW = PCT – MAX(Y, 3)
(4B) FDW = PCT – MAX(Y+AR, 3)
(4C) FDW = PCT
Where:
FDW = Flashing Don’t Walk (sec.); PCT = Pedestrian Clearance Time (sec.); Y = Yellow interval; AR = All-Red Interval • Equation 4A is preferred for most intersections while equations 4B or 4C may be considered
if there are capacity constraints or if there are special pedestrian crossing needs, respectively. • MAX (Y, 3) determines the maximum of either the 1) recommended Yellow interval, or 2) 3
seconds – whichever value is greater is utilized in the formula. • MAX (Y+AR, 3) determines the maximum of either the 1) recommended Yellow plus All-
Red intervals, or 2) 3 seconds – whichever value is greater is utilized in the formula. • The minimum FDW interval shall be 4 seconds to account for pedestrian expectancy when
crossing narrow streets. • The recommended FDW shall be rounded up to the nearest integer value. For example, if the
calculated value of FDW is 12.23 seconds, then the recommended value of FDW is rounded up to 13 seconds.
• For exclusive pedestrian phases, 4 seconds shall be subtracted from the calculated PCT to determine the FDW interval. In order to provide a 4-second Steady Don’t Walk buffer interval at the completion of FDW, a 4-second Yellow interval shall be programmed into the controller. An All-Red interval following the pedestrian buffer interval shall not be provided.

January 25, 2013 Page 13 of 14 Total (W + PCT) pedestrian clearance interval The MUTCD states that “the total of the walk interval and pedestrian clearance time should be sufficient to allow a pedestrian crossing in the crosswalk who left the pedestrian detector (or, if no pedestrian detector is present, a location 6 feet from the face of the curb or the edge of the pavement) at the beginning of the WALKING PERSON (symbolizing WALK) signal indication to travel at a walking speed of 3 feet per second to the far side of the traveled way being crossed or to the median if a two-stage pedestrian crossing sequence is used. Any additional time that is required to satisfy the conditions of this paragraph should be added to the walk interval.” The requirement is expressed using the following formula:
(5)
Where:
W = Walk (sec.); PCT = Pedestrian Clearance Time (sec.);
D = crossing distance, measured from curb to curb along the center of the crosswalk (ft.); V = pedestrian walking speed (ft. /sec.)
• Equation (5) determines the maximum of the difference between the pedestrian clearance times for walking speeds of 3.0 feet per second 6 feet from the face of curb and 3.5 feet per second, or 7 seconds.
• The pedestrian walking speed used shall be 3.0 ft. /sec., per MUTCD. • A minimum Walk time of 7 seconds shall be provided for pedestrian intervals where
pedestrian volumes are lower than 1,000 per hour per intersection. Where pedestrian volumes exceed this value, a minimum Walk time of 10 seconds shall be provided. The SWA Team will review downtown area counts and develop a final recommendation.
• The minimum Walk interval may be set to a value lower than 7 seconds (up to 4 seconds minimum, per MUTCD) at locations with capacity issues. However, such recommendations require DDOT approval prior to implementation.
• The recommended Walk interval shall be rounded to the nearest integer value.
The following example illustrates the application of the PCT and total pedestrian interval calculations. The approximate crosswalk measurement was taken using Google Earth© at Benning Road and Minnesota Avenue, NE. Figure 9 shows the intersection and associated measurement.
−
+= 7,
6PCT
VD
MAXWpedestrian
crosswalk

January 25, 2013 Page 14 of 14 PCT Calculation
D = 70 ft. S = 3.5 ft./sec.
205.3
70==PCT sec.
Assume W = 7 sec. sec. 27=+ PCTW
Total Clearance Calculation
D = 70 ft. S = 3.0 ft. /sec.
−
+= 7,20
0.3670
MAX
W
( )7,33.5MAXW = = 7 sec. Total W + PCT = 27 sec.
Solid Don’t Walk interval The solid Don’t Walk (DW) interval shall consist of the buffer interval plus the time during which conflicting traffic movements are being served.
Figure 9 - Benning Road and Minnesota Avenue,