
D:D - Defense Technical Information Center · ELECTE D:D DEC~~~II IT,0J ... mic information of...
14
Final Technical Re ort on FY90 SORP E)-A229 90 q 40 D-A229 902 RandaUl S. Jacobson ONR Code 1125GG Mv FY90 SORP, "Attenuation of compressional waves in oceanic crust", has been fruitful. The proposal was to analyze a high quality seismic refraction data set to obtain compressional wave attenuation models for oceanic crust. The specific tasks and results are: Complete the attenuation analysis and publish the results. Despite the late delivery of the computer to do the analysis, I was able to finish the work and write a manuscript (R. S. Jacobson and B. T. R Lewis, The First Direct Measurements of Compressional Wave Attenuation in the Uppermost Oceanic Crust). This paper has been published in the Journal of Geophysical Research (v. 95, B11, pp. 17,417- 17,429) and is attached. The basic conclusions of this work were: (a) Values of Q (a measure of the attenuation) cluster between 20 and 50, an order of magnitude greater attenuation than estimated by forward modeling by others. (b) Variability of the results strongly implicate heterogeneities within the crust on scales of 100's of meters. (c) The attenuation estimates are considered normal to high, based upon the use of the sonar equation to match signal to noise ratios as a function of frequency of historical data. (d) Values of Q around 50 are sufficient to limit propagation of seismic energy within the crust to be below 20 Hz for typical seismic refraction profiles. Additional work was directed towards joint inversion of travel time and amplitude data for velocity-depth information. I have written software to correct all the seismic data for input into the inversion program. The development of the software for the inversion, testing of the inversion methodology, and the analysis of the results has been completed. The results were somewhat disappointing, perhaps due to errors in location of the shot positions in three dimensions. A further test of this methodology is expected in the future by inversion of another data set, using electrically detonated explosive shots, providing accurate origin times of the source. Other progress relates to the unexpected task of determining the rank of matrices for inversion. A completely objective method has been found to determine which eigenvalues are non-zero using Chi-square analysis and Fisher Tests. This combination of error analysis and statistical analysis has yet to be applied to inversion theory but is often used for other types of problems. I have instituted a literature search for applications, theoretical developments, etc. A software package has been developed to use this methodology, and I am currently using it in inversion applications. DTIC r) T ,- T , ELECTE D:D DEC~~~II IT,0J _ffiai B y.. .... . .. . .. . .. . .. . .. . .. . .. . .. . .. . ..... ... _ j Availability , .... I- .. 3 peclai -- ,'--.a- U~lmt- ~ A Statement "A" per telecon Dr. Randali Jacobson. Office of Naval Research/ code 1125CG. VtIG 12/10/90 4
Transcript of D:D - Defense Technical Information Center · ELECTE D:D DEC~~~II IT,0J ... mic information of...

Final Technical Re ort on FY90 SORPE)-A229 90 q 40D-A229 902 RandaUl S. JacobsonONR Code 1125GG
Mv FY90 SORP, "Attenuation of compressional waves in oceanic crust", has been fruitful. Theproposal was to analyze a high quality seismic refraction data set to obtain compressional wave attenuationmodels for oceanic crust. The specific tasks and results are:
Complete the attenuation analysis and publish the results. Despite the late delivery of the computer todo the analysis, I was able to finish the work and write a manuscript (R. S. Jacobson and B. T. RLewis, The First Direct Measurements of Compressional Wave Attenuation in the Uppermost OceanicCrust). This paper has been published in the Journal of Geophysical Research (v. 95, B11, pp. 17,417-17,429) and is attached. The basic conclusions of this work were:
(a) Values of Q (a measure of the attenuation) cluster between 20 and 50, an order ofmagnitude greater attenuation than estimated by forward modeling by others.(b) Variability of the results strongly implicate heterogeneities within the crust on scales of100's of meters.(c) The attenuation estimates are considered normal to high, based upon the use of the sonarequation to match signal to noise ratios as a function of frequency of historical data.(d) Values of Q around 50 are sufficient to limit propagation of seismic energy within thecrust to be below 20 Hz for typical seismic refraction profiles.
Additional work was directed towards joint inversion of travel time and amplitude data for velocity-depthinformation. I have written software to correct all the seismic data for input into the inversion program. Thedevelopment of the software for the inversion, testing of the inversion methodology, and the analysis of theresults has been completed. The results were somewhat disappointing, perhaps due to errors in location of theshot positions in three dimensions. A further test of this methodology is expected in the future by inversion ofanother data set, using electrically detonated explosive shots, providing accurate origin times of the source.Other progress relates to the unexpected task of determining the rank of matrices for inversion. A completelyobjective method has been found to determine which eigenvalues are non-zero using Chi-square analysis andFisher Tests. This combination of error analysis and statistical analysis has yet to be applied to inversiontheory but is often used for other types of problems. I have instituted a literature search for applications,theoretical developments, etc. A software package has been developed to use this methodology, and I amcurrently using it in inversion applications.
DTIC r) T,- T,
ELECTE D:DDEC~~~II IT,0J _ffiai
B y.. ..... . . . . . . . . . . . . . . . . . . . . . . . . . . . ........_
j Availability ,.... I- . .3 peclai
-- ,'--.a- U~lmt- ~ A
Statement "A" per telecon Dr. RandaliJacobson. Office of Naval Research/
code 1125CG.
VtIG 12/10/90 4

JOLRNAL OF GEOPHtYSIC-AL RESEARCH, VOL. 95. NO. BII, PAGES 17,417-17,429. OCTOBER 10, 1990
The First Direct Measurements of Upper Oceanic CrustalCompressional Wave Attenuation
R. S. JACOBSO.N
Offi.ce of Nova!Research, Ari.gtcn, Virgin'a
B. T. R. Lwis
Sccol of Oceanography, University of Washington, Sea::!e, Washington
Th e rirst direct measurement of compressional wave ar'nuation of the uppermost 650 m of ocazic or-.st wasperformed using data recorded by seafloor hydrephones and large (56-116 kg), deep, explosive sources. The sitewas 13 km east of the southemmost Juan de Fuca Ridge on crust 0.4 m.y. old. Spectral ratios were performedbetwesa bottom refracting waves and direct water waves, adjusted for spreading losses and transmission coefficientlosses. Several tests of the data were performed, denonstrating that attenuation is linearly related to frequencybetween 15 and 140 Hz, but frequency-independent components of attenuation are also evident. Values ofcompressional wave Q cluster between 20 and 50 and do not show any systematic variation with depth over 650m. The attenuation results also indicate the presence of heterogeneities within the crust, as the solutions for eachreceiver's data set are significantly different. No evidence for azimuthal variations of attenuation are supportedby -he data, although the data do not optimally sample a wide variation of azimuths. Our attenuation values arejudged to be normal to higher than expected for the whole oceanic crust, based upon comparisons to results fromsynthetic seismogram modeling by others and by modeling signal to noise ratios of typical seism-c refractionprofiles. The results are consistent with recent laboratory measurements at ultrasonic frequencies for dry andsaturated basalts at seafloor pressures and temperatures. -
LN-.:ODL'C74ON particularly in concert with results from drilling the oceanic crust by
Despite decades of investigations of the oceanic crust and mantle the Deep Sea Drilling Project and the Ocean Drilling Projectusing seismic refraction techi'ques, lenowledge of the velocity and The seismic results to date are entirely in terms of compressionalattenuation structure of the uppermost kilometer is the most deft- wave velocity structures, often showing stcep gradients with depthdent [Spudich and Orcatt, 180a]. Despite the fact that seismic that are a function of crustal age [Purdy, 19871. Other informationenergy must propagate through this portion of the crust to be regarding seismic structures, such as compressional wave attenua-received by either on-bottom, midwater or near-surface sensors, tion, shear velocity, and attenuation structures, are either unavail-nature appears to conspire against investigations of this most acces- able for analysis in existing data sets or have not been investigated.sible portion of oceanic lithosphere. To isolate the effects of the These additional seismic structures can be useful notonly for furtheruprpermost crust upon seismic wave propagation requtres a con- resolving the geologic stratigraphy but arc also crucial to under-comitant isolation of other interfering energy paths. To optimize standing the full impact of upper oceanic crustal structures on
this effort, both sources and receivers should be near the seafloor, seismic wave propagation into and out of the oceanic lithosphere.so that interfering water-bome energy will arrive at times sufficient- In 1985, we conducted a deep source, deep receiver seismicly distinct from those paths traveling within the bottom. Two refraction experiment on 0.4 m.y. old crust 13 km east of thedecades of refraction experiments using surface charges and ocean southernmost Juan de Fuca Ridge (Figure 1). The site was chosenbottom s ismometers have revealed little of the detailed nature of to coincide with a previous experLment that used a deep-towedthe uppermost kilometer of crust, although some gross averages can seismic streamer and air guns along a profile shot parallel to thebe obtained (Ewing and Purdy, 1982]. Recent multichannel studies spreading direction [Lewis and Jung, 1984]. Analysis of those datawith high spatial resolution [e.g., Harding et al., 1989; Vera, 1989] demonstrated that the frequency dependence of attenuation washave revealed details of the uppermost velocity structures and essentially independent of observational range or depth of penetra-seafloor velocites. Vertical or oblique seismic profiling has also tion. Further analysis by Lewis and Jung (1989] found that P waveproved effective for determining upper crustal velocities [e.g., Q between 10 and 50 for the upper I km at this site were consistentStephenetal., 1980;S;ephen and Harding, 1983;LittleandStephen, with the data. They also suggested the possibility of velocity
1985]. Only recently have experimental techniques been tried to structures within thebottom that create"resonances"due toductinguse near-bottom charges for seismic refraction profiling [e.g., of seismic energy that are frequency dependent and modify anyJacobson et al., 1981; Purdy, 1986; Sauter et al., 1986], with attenuation that may occur. The experimental geometry of the
success. There are several disadvantages using deep explosive deep-towed streamer data set was suboptimal to determine the finecharges, including higher frequency content, more complicated structure of attenuation parameters with depth.logistics, more time required to perform the experiment, and in-creased safety concerns. The goal of obtaining more detailed seis- EXPERIMEN-rAL CONTIGUlATION AND DESIGNmic information of seismic layer 2 is closer to being achieved, To test the hypothesis for the anomalous attenuation due to
velocity "resonances" required an unusual experimental configura-
tion. The goals were to determine simultaneously the compres-
sional wave velocity and attenuation structure with depth and to
Paper number 901B00808. examine the azimuthal dependence of attenuation.0148-02279090J13-COS0 05.00 Deep explosive charges were needed with sufficient energy and
17.417

17,413 JACOBSON A.,D LSwLs: OC<aNiC C 'usTA. Q
oI Io I o50 )0 1000 2000
c 'Q SCALE IN METERS
(Vs 01'
Fuc I
R jg ar o l 45oC
4CPo
46' N 6 10 Co
- 4Q0
0 A aA C
Os15
AA
A
44' N
i39 izE 1W 10-E
Fig. I. A 'nap derived frm Sea Beam ba hymery of the expcrimentl site located 13 km east of Lte southernmost Juan de FucaRiJge. "Te solid triangles indicat the locations of the ocean bottom seismoncteT (1-6) and the seafloor hydrophones (7-10); onlythe SFH data were used to invert for attenuation. The solid dots am the shot locations, and the interconnectng lines indicate theshot-receiver combinations used in the analysis. The ray paths am heavily biased to the north and south, a result of experimentalgeometry and possibly propagation effects. The contours an in uncorrected meters.
bandwidth to overcome the high attenuation expected. TNT and C4 All of the instrunents were deployed in a 3-kn-diameter array inplastic explosives were detonated by (SUS) Sound Underwater anareaofflatseafloor,2600mdeep, 13kmeastoftheJuandeFucaSource [Naval Ordnance System Command, 1973] MK 59 devices, Ridge (Figure 1). Box and gravity cores recovered up to 0.39 m ofset to 1829 or 2438 nominal meters (6000 or 8000 feet). Charge fine dark brown silt over heavy grey clay. Shipboard and bottomsizes ranged from 58 to 116 kg. yielding maximum energies at 50-60 pingers were unable to resolve sediment thickness, which is thoughtHz. Bottom charges, designed to excite shear waves, consisted of to be no more than a couple of meters thick. At the seismicapproximately 3 kg of explosives in a "pipe bomb". These charges frequencies of interest (:5 150 Hz), the sedimentary cover shouldwere largely unsuccessful, as the energy needed to release the end have an insignificant impact upon experimental results.cap was insufficient to overcome ambient hydrostatic pressures. Navigation consisted of LORAN C and transit satellites, both
Receivers consisted of digitally recording seafloor hydrophones generally accurate to 100 m when available. Bathymetry consisted[Shor, 1979], with 126 dB of dynamic range, 66 dB of resolution, of 3.5- and 12-kHz-wide beam echo sounders and Sea Beamand 200 Hz effective bandwidth with 1 -ms sampling. Due to power coverage of the area was provided by NOAA.limitations, two hydrophone systems were deployed twice; on the Two separate sequences of shots were deployed in a star patternsecond deployment, one of the seafloor hydrophones (SFH9) was to permit varying azimuths and ranges to the receivers. Correctionsdeployed approximately 700 m above the bottom, so that uncon- to the hydrophone refraction data were reported by Poujol andtaminated source signatures could be recorded. In addition. six Jacobson [1988]. All shots were corrected to the entry point at thetriaxial ocean bottom seismometers were deployed, which recorded seafloor, defined by the Sea Beam bathymetry using the water pathanalog seismic signals on magnetic tape, yielding a bandwidth of correction of Purdy (1982]. A record section was plotted (Figureapproximately 100 Hz and a dynamic range of 80 dB after 2), and travel times were picked manually. The resultant travel timedecompression [Johnson et aL, 1977]. The ocean bottom scis- plot is shown in Figure 3 with a third-order polynomial fit. whichmometer data were not analyzed in this paper due to the limited was later used to facilitate the determination of the velocity depthbandwidth of the instruments. function [Poujol and Jacobson, 1988].

JACOBSON A.\D L.wLs: OQSIc CRUSTAL Q 17,419
Arr'cAoN 1.0
To determine the attenuation parameters from seismic refraction
data, one needs to account for all mechanisms that can modify the .8amplitude and frequency content of the propagating wave. Thereceived signal, A(xco), is affected by spreading losses, reflection,and/or transmission losses, insa-mental response, and attenuation: E
A (,,w) = A,(O. w, o .U= 'a°l R P_( .G x £() 1
G(x)>
where x is the distance, .o is the angular frequency, AO(0,w) is the 0source function. exp[-a(w)x] is the attenuation due to propagation, .2
R(x,co) is the total loss due to reflections and transmissions, G(x)represents the spreading loss, and I(w) is the instrument transfer 0.0 , ,
function. The dLect water wave path can be expressed as 0.0 1.0 2.0 3.0
A. (x,.) =A)(0,)e&e-a ' 1(w) (2) Distance, kmGx)
Fig. 3. Seafloor hydrophcne travel tune data (circles) used for the inversionwhere exp[-c,,.z] is the attenuation through the water (hereafter c , ofthevelocitydepth ;unction, whichintuis usedtoconstrainthespreadingis assumed to be zero), and subscript w represents the direct water losses. A third-order polynomial fit to the data is also shown.wave. Dividing equation (1) by equation (2) and taking logarithms,we obtain
FA(x.1 co)(3) Q can also vary with depth, we will assume for the moment that
AI "'xo)- -c(G))x + lnR(x,t) + (3) Q(F) is constant throughout the bottom. Given these assumptionsL 'and definitions, equation (3) can be rewritten as
We will assume that there are no caustics and that all frequencydependence is in a; that is, beth R(x) and spreading losses are ,FA(x.F)1 - .d F +1(x)
independent of frequency. The term ax can be rewritten several Aw. (x.9 +1 G(x) Jways [e.g. Johnston and Tokso, 19811, including
Considering only those terms that are frequency dependent anda(wo)x = rtFxQ (F)V- (F) = itFT(F)Q (F) (4) further assuming that T(F) is independent of frequency, the specific
quality factor Q" can be found to bewhere T is the travel time through the attenuating medium and F is q fco QrnbAodte F)
the frequency in hertz. Equation (4) allows for velocity dispersion Q- i(F) - ax F (6a)and a frequency-dependent quality factor Q. In general, although
1.2
(n0.8
E
0.4
0.00.0 0.5 1.0 1.5 2.0 2.5
Distance, km
Fig. 2. True amplitude, unreduced, record section of the seafloor hydrophone data with the predicted travel time curve, based upona third-order polynomiaL The traces were terminated at the water wave arrival and equalized for shot size variations by W4/ 3, whereW is the weight in pounds. No clear evidence of converted shear waves is present in the data. The chaotic nature of the intentracecoherence is due to the widely varying shot depths, which affects both the frequency content of the source function and the amplitudes.due to spreading losses.

17,420 JACOBSON AND UWLS: OcHX',Ic C USTAL Q
If the log arithm of the spectral ratio is assumed or found to be Q below the lowest frequency measured or off,.ets of attenuationlinearly dependent upon frequency and if one assumes that the due to interbed multiples or to scattering from heterogeneities.frequency-independent terms of equation (5) do not affect Q- in Provided the data indicate no frequency dependence of Q withinany way, then the measured bandwidth and relaxing the assumption of a depth
I a ('4-,F)'' independent Q, we can solve for Q(z). To do so requires knowledge
nT L-FI (6b) Of thera3ypathgeometry for each shot easily obtained byray tracingI L knowing the velocity depth function. This method allows a direct
where Q1 is now independent of frequency. The assumptions of mapping of total travel time T or total subbottom distancex intoanfrequency-independent Q-, T, and a linear dependence of the equivalent bottoming depth z where the ray turns horizontal [cf.logari,thm of the spectal ratio with frequency violate the principles Dorman and Jacobson, 1981]. Keeping the frequency-independentof causality (cf. Kjar:ensson, 1979 andJacobson, 19871. Equation terms, the more general form of equation (5) becomes(6b), although physically unrealizable, is often used as the spectral A (1ratio meth-d for seisnic refraction profiles [e.g., Jacobson et L, + In() I )
1981, 19841. Equation (6a) is the more appropriate relationship to U -xF) J
investigate attenuation, despite the fact that Jacobson (19871 Assuming anattenuationmodelconsistingofaseriesoflayers, each
demonstrated that velocity dispersion, V(F), or equivalently T(F), with a constant Q-1, and retaining the discretized frequency, Fi.as well as frequency-dependent Q can be measured using seismic equation (11) can be rewritten as
refraction methodologies. Frequency dependence of the attenuation m
coefficient can be tested sim ply, using the form = iXF) Y( -T.1)lR~J~ (12)
a(F) =,%F "TQ- t (7) -1A(xF)J k= 1
lumping the frequency dependence of T and QI into the power of where subscript j denotes a particular shot-receiver pair md sub-
frequency dependence, m. Attenuation due to scattering can also script k denotes the layer number. Tk represents the travel time of
exhibit frequency-independent components, so that abetter test may thejth ray in layer k, similarly, Qxt is the contribution of attenuation
be to the spectral ratio for layer k, equal to
at(Y) = rnF"TQ -' + B (8) QkI = Q-1 +Bk %13)
where B is a term independent of frequency. Jacobson [1987]expanded this definition to where B describes the frequency-independent components of at-
Q1AL ._2 -A3 (9) tenuation c analogous to equation (8).a(F)=itFT (Qt.+-+ ( Once the effects of attenuation are isolated from all other
parameters, the azimuthal dependence of attenuation can be deter-to search for a more complete, empircal, description of the effects mined. An empirical test of azimuthal dependence of attenuationof scattering attenuation. To do so requires the calculation of the can be performed via
R(x) and G(x) termis, which can be Mus'construed as frequency-inde. Q-1 ( = Q;'(Z)Z a,cos(i) + bisin(pi) (14)pendent components of attenuation.
The spreading loss term, G(x), for a fPat earth can be derived fromthe equation for a spherically syrnmetric earth [Aki and Richards, Only even powers of a and b should exist, as the presence of odd
1980, p. 120]: powers would violate reciprocity.
G(x) = -!{cos(Or) cos(es) P()J (10) TanlzprelyVE-LociTY RuLTSTo analyze properly the data for attenuation as a function of depth
where p is the slowness, 0 refers to the angle of the ray with respect it is necessary to determine the velocity depth function. Poujol and
to the vertical and subscripts r and s refer to the receiver and source, Jacobson (1988] reported on the velocity inversion for the seafloorrespectively. The term axap equal to (02tIgx2)' can be obtained hydrophone data only, using the T-; inversion of Dorman and
from the travel time curve or by manipulation of the velocity depth Jacobson [19811. Their results indicate a seafloor velocity of 2.7function to yieia x(p). In a layered media, x must be replaced by x km s' , with high velocity gradients, ranging from 4.6 s" at the
and axxap by Y~xI'p over the layers the wave propagates. surface to 4.1 s' at 679 m depth, the maximum extent of the data.
The reflection and transmission coefficients can be calculated Themaximumvelocityobservedwas5.6kms- 1. Thevelocitydepth
from equations given by Aki and Richards [1980], if one knows or profile (Figure 4) is extremely smooth, showing no sharp velocity
assumes the compressional and shear wave velocities and densities changes usually associated with layer 2A-B stratigraphy. This is
throughout the entire structure of interest. Further assumptions probably not real but is simply the result of oversmoothing of the
include planar waves, smooth boundaries, and no velocity gradients, travel time curve used to invert the velocity depth function.
all of which can modify the reflection and transmission coefficients. Poujol and Jacobson [ 1988 point out, however, that considerable
The appropriate coefficients can only be predicted with reasonable scatter in their waveforms may be due to local crustal
accuracy at the seafloor interface. Since the details of the subbottom heterogeneities. In particular, one seafloor hydrophone (SFH8)
structure are unknown, we are forced to incorporate subbottom recorded an unusual high-frequency, low-amplitude precursor on
losses due to transmissions and reflections into the attenuation several of the records, due to what might be a local high-velocity
coefficients. block of crustal material. Further evidence of crustalEquation (9) can be used to examine the data for frequency-dc- heterogeneities can also be found in the ocean bottom seismometer
pendent quality factors, Q-1 as well as frequency-independent terms data. Although a similar inversion technique for velocity structurethat indicate a "DC" shift in attenuation. Jacobson (1987] has using all available data [Jung, 1988] revealed similar structures to
interpreted these terms to indicate either a frequency dependence of those as reported by Poujol and Jacobson [1988], two of the ocean
JACOBsos ANs) izwLS: Ocw.sc CusTAL Q 17,421
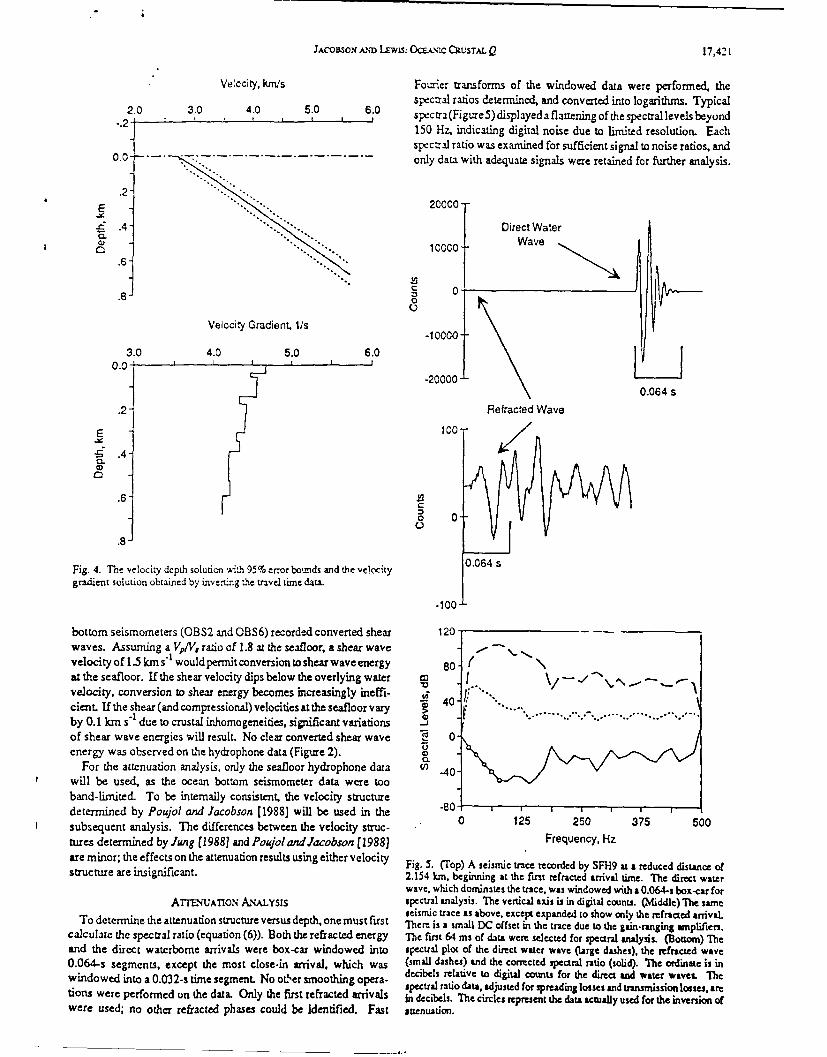
Velocity, km/s FouTier transforms of the windowed data were performed, thespectal ratios determined, and converted into logarithms. Typical
2.0 3.0 4.0 5.0 6.0 spctra(Figure5)displayedaflatteningofhespectrallevelsbeyond150 Hz, indicating digital noise due to limited resolution. Eachspeczal ratio was examined for sufficient signal to noise ratios, and
0.0 .only data with adequate signals were retained for further analysis.
.2-E 200C0 -
.e .4- Direct Water
ICC• W ave
.6-
.8 0
Velocity Gradient. 11s.10000
3.0 4.0 5.0 6.00.0* .200001| 0.064 s
- ~-20000- 0.64
.2 Refracted Wave
E 100-
S .4-
0.0
0 0-
.8Fig. 4. The velocity depth solution 'iuh 95% error bo,.mds and the velocity 0.064s
gradient solution obtained by invertmg the travel time data.
-100
bottom seismometers (OBS2 and OBS6) recorded converted shear 120 / _
waves. Assuming a VpIV, ratio of 1.8 at the seafloor, a shear wavet -velocity of 1.5 km s'. would permit conversion to shear wave energy 80 at the seafloor. If the shear velocity dips below the overlying water /velocity, conversion to shear energy becomes increasingly ineffi- 40cient. If the shear (and comnpressional) velocities at the seafloor vary 0...... . . . .
by 0.1 km s 1 due to crustal inhomogeneities, significant variations ...of shear wave energies will result. No clear converted shear wave 0energy was observed on the hydrophone data (Figure 2).
For the attenuation analysis, only the seafloor hydrophone data n .40will be used, as the ocean bottom seismometer data were tooband-limited. To be internally consistent, the velocity structure ] 0determined by Poujol and Jacobson [1988] will be used in the -80subsequent analysis. The differences between the velocity struc-ures determined by lung (1988) and Poujol andJacobson [1988] Frequency, Hzare minor; the effects on the attenuation results using either velocity Fig. 5. (Top) A seismic trace recorded by SFH9 at a reduced distance ofstructure are insignificant. 2.154 kn, beginning at the first refracted arrival time. The direct water
wave, which dominates the trace, was windowed with a 0.064-s box-car forATTE'UAION ANALYsIs spectral analysis. The vertical axis is in digital counts. (Middle) The sameseismic trace as above, except expanded to show only the refracted arival.
To determine the attenuation structura'e versus depth, one must first There is a small DC offset in the trace due to the gain-ranging arnplifiers.calculate the spectral ratio (equation (6)). Both the refracted energy The first 64 ms of data were selected for spectral analysis. (Bottom) Theand the direct waterbome arrivals were box-car windowed into spectral plot of the direct water wave (large dashes), the refracted wave0.0 64-s segments, except the most close-in arrival, which was (small dashes) and the corrected spectral ratio (solid). The ordinate is in
decibels reative to digital counts for the direct and water waves Thewindowed into a 0.032-s time segment. No ot"er smoothing opera. spectral ratio data, adjusted for spreading losses and transmission losses, aretions were performed on the data. Only the first refracted arrivals in decibels. The circles represent the data actually used for the inversion ofwere used; no other refracted phases could be identified. Fast auenuaion.

1V." 22 JACOBSON A.D LSwis: OCeAofc CtUsTAL Q -.
lost of ".e d, . , e-e confined to the bandwidth 15-94 Hz, although caustics in the tavel time data, which would otherwise produce asome data ex: ndcd to 140 Hz. To examine the existence of fre- pronounced excess of intercept values at range or depth.quencv-[,d.':..t components of attenuation, the raw spectral Statistical tests (e.g., Bartlett's test for homogeneity of varianceratio data wereadusedforspreadL-glossesusingequation(10)and [Ostle and Mensing, 1975]) indicate a significant difference infor xararnissicn . across the water-basemet interface, variances between the individual receiver data sets, implying the
differences in these models are real. Additionally, the four in-
Tests for Fre:.. e.c- Deperderce of Artenua.'ion
The firt exz -."aEcn of t e data was to look for .:rc.='ey Spectral Slopes, dB-izdependence of t'.e atenuation coefficient a(F) by using equation 0 -.3 -.6 -.9 -1.2(9). Various e.-.ua:icrs of the ccefficients were exam;,ne,_ as the 0., ,
coeffcie:.is are not or:hcgonal. F tests were used to detern'.-"e the jsig-ica:.ce o:" va-;nce reducions with the addition of each newcoefficient. Resu.zs of the tests indicate that the combined data set(ALL) shoe,!2 be broken down into individual data sets appropriate F-to each of the fou receivers, as discussed below. In all five cases, E .4the attenuauon c.e:ficient was found to have a linear dependence -CL -of frequency (r3 ofequation (9)) within the bandwidth of available ' J --data (15.625-140.625 Hz). Each data set did exhibit some time-and/or frequency-independent components of attenuation (e.g., At, IA: andA3 of equacn (9)). In three cases (SFH8, SFH10, and ALL) .81
some freouen..-indeendent component of attenuation was ex- . SFH7
hibited CTabe 1). 7hese coefficients can be interpreted as a non- 1.0zero interc,:pt of a Linear fit to the adjusted spectral ratio data foreach shot. B'. ca!c aIring a slope and intercept for each shot, aqualitative fit of the models in Table I to the data can be seen in Spectral Intercepts, dB
Figure 6. In all cases, the predicted slopes increase with bottoming 20 0 -20 -40depth (equiva ent to subbottom travel time or range). For SFHlO 0.0and ALL, the ;ntercepts are largely negative, increasing to slightly -
positive values below 550 m. Negative intercepts for this model .2(equation (9)) imply an excess attenuation at zero frequency, whereattenuation hypothetically should be zero. Anomalous sources of -attenuation (eg.. scattered or apparent attenuation) and/or incorrectadjustments 1speading losses, transmission losses) are likely ex- CLplanatiors fr e inercept offsets. .6
SFH7 and SFi-i9 models exhibit a component of spectral slopeother than zero at the seafloor (Figures 6a and 6c), resulting from .8-the tine-indpzendent component of attenuation A2. Since equation SFH7(9) is simply an empirical description of attenuadion, it is difficuit 1.0.
hypothesize a source for this component of a.All of the models have values of Qo between 23 and 67, much Fig. 6a. Plots of the fit of the solutions using equation (9)uadTable I tothe
lo wer than those values de terminedby synthetic seismogram model- various data sets, after equation (9) was converted to decibeb by multiplica-ing (e.g., Spudich and Orcuit, 1980b]. There is little evidence of tion of 8.686. (Top) The fia ofthe spectral slope component ofequation (9)range (or depth) independent variations of the spectral slope, since as a function of bottoming depth to a regression of each shot's spectral ratiomost of the data custers between -0.4 and -0.8 dB Hz" (Figure 6). dataofSFH7 by a slope and intercept. The circles representthebest fit slope.milarlyomosttofthestrs of the data c a (Figurou6) . and the error bounds correspond to a +la range. The inversion for atenua-Simnilarly, most °f the spectral intercepts of the data cluster around ton uses the data at each frequency for each shot and does not attempt to fitzero, suggest:in"g the adjustments made to the data are largely correct. the slope-intercept combination. (Bosom) The fit of the solution usingThis latter ocserat:on can be construed as evidence for the lack of equation (9) to the spectral intercept of SFH7 data.
TABLE 1. Model Solution of SFH Data Sets to Equation (9), Before Conversion to Decibels (Multiplicative Factor of 8.686).
SFH7 SFH8 SFH9 SFH1O ALLQ. O0215 (0.0052) 0.0307 (0.0067) 0.0150 (0.0174) 0.0444 (0.0052) 0.0423 (0.0025)
A - - -1.4789 (0.4094) -1.9004 (0.2244)
A. 0 CCGS (0.0022) - 0.0147 (0.0091) - -
A - -3.2075 (0.4418) - -2.6350 (0.05617) -3.1754 (0.02930)
Number of d ita 55 18 23 37 133
S6.61 dB 11. 15 dB 5.41 dB 7.87 dB 8.73 dB
The values in parentheses are the one standard deviation values of the solution parameters. The large dashes indicate that these parameten were notstatistically different from zero and therfore were not required to fit the data.

Spectal Slcpes, dB, Hz Spectral Slopes, dB/Hz0 -.3 -.6 -.9 -1.2 0 -.3 -.6 -.9 -1.2
0.0 ' 0.0
.2- .2-
E--E
.4 . .4
.6 i .a
.6- 6
.8"
SFH8 SFH91.0 1.0
Spectral Itrcps, dB Spectral Intrpts, B
20 0 -20 -40 20 0 -20 -400.0 ' 0.0
.2-
.4-. .4-
C .6 c6
.8- .8-
SFH8
SFH9
1.0 1.0
Fig. 6b. Same as Figure 6a, except using only the data from SF113. Fig. 6c. Same as Figure 6a. except using only the dama frt SFH9.
Specral Slopes, dB/Hz Spectral Slopes, dB/-z
0 -.3 -.6 -.9 -1.2 0 -.3 - -0.0 - , 0.0 I ,
.2- .2 -i
.8 .4-
, SFH1O ALL
1.0 1.01 A
Fig 6d z SpecFtrn:al erceputo, ldet SpS]lO ig € ~m iu=6.ectrl uInterc ,et, ~ e y eevr
0.0 0.0
.2-F' .2-
w H- ~.06 06H
-SFH1O ALL
1.0 1.0L-
Fig. 6d. Same as Figure 6a, except using only the data from SF1110. Fig. 6d. Same as Figure 6a. except using &Hl of the data fromn every receiver.

7.-24 JACOBSO. AYD LEWES; OCEANC C USTAL Q
dividual data sets 'nave a combined residual variance significantly DIscusSION
lower tham the rncdz! firting all the data simu!taneously. It apears Perhaps the most intriguing result of this study was the consis-that withLn the 3-k-n ary, d;.fferences of attenuation of the oceanic tently low values of Q. regardless of which model was used to fit
crust exist on th:s spa.al scale. Simi!ar results for spatial thedata. The values of the qualityfaor cluster ightly between 20
heterogeneities Of '.ec:y wi'li 'm the crust have been determine-d and 50, muchlowerthanthosedeterminedbyJacobsonetaL [1981,
by S:ephen [19SS, for DSDP site 504B and by Swift andS;epher 19S4] for sediments but similar to those inferred by Lewis andJung
[19S9] fcr old At!'-c crust. [1989] for oceanic crust at our site. Values of Q obtained by forwardmodeling of synthetic seismograms [cf.Spudich andOrcutt, 1980b;Collins et al., 1989] suggest values of Q closer to 500, an order of
Attenuation V ersus De?:h Resut~rs mapitude less attenuation. Vera [1989] examined multichannelOr.e of the cor, z:.Lsics of fil::,ng the data to equation (9) was that data from the East Pacific Rise and found a Q of about 80 to match
ot var es linearly wki 'equencv, so equations (12 and (13) can be2) amplitude variations as a function of offset- Spudich and Orcunused'° examinee e"-ledasPects ofvaratons ofattenuation with [1930b] admit that their constraints for Qp based upon synthetic
depth. One set of r.dels for the five data sets consisted of a single seismograms are poor, likely the result of the trade-off of amplitudes
layer of attenuation. The results were quite similar to those in Table between the velocitydeph function (which alters the spreading loss)
1 and Figure 6 and hus a:e not shown. One difference, however, is and attenuation. Further. thenarrow band source functions typically
that equations (12) and (13) force the spectral slope and the spectral used in synthetic seismogram modeling to increase computationalintercept components to be zero at the seafloor. Only the model speed and to mimic the resulting energy spectral content of the
fitting SF-IS data rezui-ed a nonzero value of the spectral intercept seismic refraction profiles limits the frequency resolution necessary
at depth. Values of Qo of all the models varied between 20 and 30, to constrain attenuation.cluste.rig around the lcwer vaue. AgaLn. there was a signficant Wepfer and Christensen [1987, this issue] reported the firstreduction of residuas using the individual data sets relative to data laboratory measurements of Q for dry and water-sarurated oceanic
set ALL, and the vari"nces between the four individual data sets basalts under pressure and temperature conditions appropriate for
were again i',orncge.eous. This emphasizes the interpretation ofattenuation heterogeenities wihin the hydrophone array.
The next set of medeis were determined by maxdmizing the depth
resolution of attenua ion. Up to 14 layers, matching the layering of 1/
the velocity depth func::on, were allowed to be fit with a Q and -.05 0.00 .05 .10 .15 .20
the B' parameter (equation (13)). Some of the layers contained 0.0 1 1 1 1 1 1
multiple rays turning horizontally within the layer. The data consist -
of the corrected spectral ratio values as a function of frequency, as .2- ..
shown in Figure 5. A singular value decomposition routine [Wig.igins, 1972] was used :0 search for the mayimumn number of ellen- E ..... ....
values and eigenvecusrs permissible with positive values of Q. F.
tests were used to de:err."ine whether the reduction of variance witlh 'a "
increasing number of ei'cn"alucs was justified. The solutions to b
the five data sets a:2 shown in Figure 7 and the fit to the data inFigure 8. The data and associated errors shown in Figure 8 are theslopes and intercepts found by linear re-ession for each shot's " SFH7spectral ratio values and are used solely for qualitative examinations 1.0
of the model fit to the data. All of the solutions, except that forSFH9, reruired a nonzero intercept term, typically between 15 and-15 dB s . The values of Q. vary between 4 and 275 but cluster Intercept, dB/s
between 20 and 50. F tests again indicate that the individual models -20 -10 0 10are better than the model fitting the ALL data set. Tests for 0.0 -
homogeneity of variance indicates the variances are nowhomogeneous between the various receiver models, suggesting thatportions of the individual solutions may have some degree of .2
commonality. The residual standard deviations for models fittig
data sets SFH7, 8, 9, 10, and ALL are 5.63, 7.07, 5.27, 4.71, and X . ..........
7.77 dB, respectively. These residuals are much lower than those .......
determined by fitting the data to equation (9). not surprising con- a .6
sidering the increased number of parameters used to fit the data.These models, sho,,n in Figures 7 and their fit to the data in Figure 88, are our preferred solutions to the data.
Finally, the residuals from the solutions in Figure 7 were ex- SFH7
amined for azimuthal variations us*rng equation (14). Only SFH7 1.0
residuals had a significant reduction of variance using a 10 term for
the intercept. This result is physically unreasonable, as it implies Fig. 7a. Solutions of the attenuation varying as a function of depth using
reciprocity does not hold. It can be interpreted, however, as indicat- equations (12) and (13). after conversion to decibels, and maximizing the
the data set (as well as all depth rsolution for SFH7. (Top) Plot of Q;1 as a function of depth (solid)ing some degree of heterogeneity, since thdand ±10 error bounds (dashed). (Bottom) Plct of B' . the frequency-inde-of the others) does not truly sample all azimuths and there are no pendent component of attenuation, as a funcion of depth (solid) and ±io
reciprocal paths. error bounds (dashed).

liQ 1O
0.00 .10 ,20 .30 .40 0.00 .05 .10 .15 .200 .0 ,
0 .0 " '
. .2-.2-E .4- ..4-
.4- , -!
.6- .6
.8 .8
101SFH8 10-SFH9
1.0 1.0*
Intercept, dB/s Intercept, dBs
-40 -20 0 20 40 60 -.2 -. 1 0.0 .1 .20.0 0.0
.2- .2-
E .4 E .4"
-CL0-. 0 .
a) (6 .6-
.8- .8
SFH8 SFH9
1.0 1.0
Fig. 7c. Same as Figure 7a, except using only the data from SFH9. TheFig. 7b. Same as Figue 7a, except using only the data from SFH8. solution doesnot require a frequency-indeperdentcomponent of attenuation.
1/0 IQ-.05 0.00 .05 .10 .15 .20
0.0' 0.00 .05 .10 .15 .200 .0 -.. I - I I I
.... 2-- -- .""-":-
.4
CAL
1.01.0
Intercept, dB/s Intercept, dB,'s
-60 -30 0 30 60 -20 0 20 40 600.0' 0.0
.2 '..2E E4!""
,, ..- --. ' .. '.o .6- o . ,.6
.8 -.. 8
SFH 10 ALL
1.0 1.0
Fig. 7d. Same as Figure 7a, except using only the data from SF11lO. Fig. 7e. Same as Figure 7a, except using all of the data from the receivers.

17,426 JAcoasoN A.'D LEws: OhA.sic CRusrTA Q
the oceanic crust. Their results indicate Q between 8 and 100 at experiments where the dynamic range of the recording syste::... iLultrasonic frequencies, depending upon the state of alteration and typically limited to about 20 dB.porosity. Figure 9b shows the effect of changing Q while keeping the shot
There are no direct determinations of values of compressional weight constant at 29.1 kg (64 pounds). Q of 20 for the whole crustwave Q for oceanic crust in the literature that we are aware of. Based would prohibit any recovery of refracted energy. Q of 450 wouldupon the synthetic seismogram results of others, we can ask whether exhibit some refracted energy beyond 20 Hz. Litle if any energy
our results are anomalous or typical for the whole oceanic crust. To was ever seen at these ranges (G. G. Shor, Jr., personal communica-answer this question, we will assume a constant value of Q for the tion, 1989). although some air gun profiles have likely exhibitedentire oceanic crust and apply equation (1) to a typical seismic higher frequency refracted arrivals. A Q of 450 would also yieldrefraction experiment using near-surface sources and receivers. We SNR values close to 35 dB which would be within the range ofwill examine the signal to noise ratio for refracted arrivals turning recorded levels using multiple recording gains.
horizontally within layer 3 at a range where caustics and retrograde Based upon the results of Figure 9, it is probably safe to say thatbranches are unirnportant. Three shot sizes (13.6, 29.1. and 58.2 kg our attenuation results are close to being typical for the wholeor 30, 64, and 128 pounds, respectively) willbemodeled as detonat- oceanic crust, although the lower crust may have lower values ofing at quarter wavelength depths [Shor, 1963) as will receiver attenuation. Further experiments are required to better place our
depths, to maximize the constructive interference of sea surface results in an overall picture of crusal attenuation values.reflections. The crustal velocity profile used will be that of Fanfare Our attenuation results (Figure 7) do not show any systematic4, asreportedbySpud-char.dOrcutt[1980b],modifiedtoeliminate variation with depth, a disappointing result for those interested inthe thin sedimentary cover. Spreading losses and transmission correlating attenuation withgeologic stratigraphy. The dataset usedlosses were calculated for a range of 32.48 km and a slowness of lies entirely within layer 2, the extrusive basalt complex. Neither0.14613 s km*l
. Ambient noise levels were extracted from Urick the attenuation nor velocity profiles show any sublayering within[1986]. The results, assuming a Qo of 50 are shown in Figure 9a. the first 650 m of oceanic crust at this site.No energy beyond 8 Hz can be received due to the ambient noise The solutions of attenuation do indicate the possibility of a largelevels. Maximum signal to noise ratios (SNR) vary between 11 and excess of frequency-independent attenuation within the first 100 m22 dB, depending upon shot size and frequency. These SNR values (Figures 7b and 7d). This may be a real result, due to scatteredare consistent with the practices used in two-ship or sonobuoy attenuation caused by the rough seafloor topography or shallow
Spectral Slopes, dB/Hz Spectral Slopes, dBiHz
0 -.3 -.6 -.9 -1.2 0 -.3 -.6 -.9 -1.20.0 . 0.0-
Et .2
.4- .
QCD.6--.6-
SFH7 SFH81.0 ep1.0
0Spectral Intercepts, dB20 0 -20 ..40 Spectral Intercepts, dB
0.0, 20 0 -20 -400.0,
.2-
.2-2
E .4
CL EX .4
6 f---H
o .6.8
SFH7 .8
1.0 SFH8
Fig. Sa. Fit of the attenuation versus depth solution shown in Figure 7 to the 1.0
spectrd data of SFH7. Sec. Figure 6a for mom information. The predictedcurves of spectral slope and attenuation are only approximately correctbetween data points and interpolation should be avoided. Fig. 8b. Same as Figure &a, except using only the data from SF118.

Sp,c Ia Slopes, dB;Hz Spectral Slopes, dBYHz
0 -.3 -.6 -.9 -1.2 0 -.3 -.6 -.9 -1.20.0-0.0{
E .2 .2_
c .6"
.8.SFH9 SFH1O
1.0 1.0 -
Spect.al Intercepts, dB Spectral Intercepts, dB
20 0 -20 -40 20 0 -20 -400.0 - 0.0j
.2-_ .2-
E E,4 .4 2 .4
l"c .6
.8
SFH9 SFH101 .0 1 .0
Fig. 8c. Same as Figure 8a, except using only the data from SFH9. Fig. 8d. Same as Figure 8a, except using only thct da from SFH10. In thiscase, all eigenvalues and eigenvectors (see text for details) were retained, sothat the fit to the slope and intercepts ame exact.
Spectal Slopes, dB/Hz
0 -.3 -.6 -.9 -1.2 layemplieterogeneities. This interpretation is reinforced by noting0.0 that bothSFHS and SFHl data sets exhibit this anomalous attenua-
ton, and both recivers are located close to one another (Figure 1)..2 Poujolandlacobson [1988] reported anomalous ravel time arivas
for SFH8, suggesting crustal heterogeneities in the immediateE -vicinity of the receiver.
An alternative explanation for the anomalous frequency-inde-4 tpendent attenuation within the first 100 m may be due to inap-6 propriate spreading loss calculations, based upon the velocity depth
function. The zr-; method of Dorman and Jacobson [1981]produces overly smooth velocity depth profiles. due to the averaging
A of the travel time curve by a low-order polynomial. The spreading
ALL loss term (equation (10)) can be simplified for a constant velocitygradient layer. Since
Spectral Intercepts, dB 2cos0 2' "2
20 0 -20 -40 cosO = (1-pV (15)
0.0 , ,zHwhere Vo is the velocity at the top andp't is the velocity at the bottom
.2- of the layer. Solving for the partial derivative of x with respect to
-slowness yields
.4 x 4- (16)
so that the spreading loss term becomes
ALL G(x) - 2cos(0) (17)
1.0 Vop2 (z
Fig. 8. Same as Figure 8a, except using all of the data from the receivers.

17.4> JACOBSON A.ND LUwL. Oa ANC CRSTAL Q
1212
40=450
110 11
Frequ~ency, Hz Frequency, Hz
Fig. 9 z. Plc ofthe ex'c ed rceved seisirc pressure in dB re l .. a HzItr Fig. 9b. Same as Figure 9a, except she charge size was fixed at 29.1 kg (64of a layer 3 arrial and ambient noise levels ss a function of frequency for a pounds) and at"enuation was varied: Q equals 20 (dotted), 50 (dashed) andtyvpical two-ship .eisrrnic re[framon expe.,nnens. The r-ange is 32kmn, using 450 (solid); the latter value is normally assumed for oceanic crust. In allthe velocity depth funcion of Fanf.,are 4[Spud:,ch and Orcutt, 1980b]. "he cases, little energy can be recorded above 20 Hz, in accord with observationsrezeived energy levels differ accrding to shot size: 13.6 kg (30 pounds. over the past three decades [Shot, 1963]. Whie values for Q of 20 aredashed). 29.1 kg (64 pounds, sc~d) and 5.5.2 kg (125 pounds, dotted) of TNT. un"li-kely for the whole oceanic coast,our results ofQ between20Oand50OareAU of the :urves assume a of 50_ for the entire oceanic crust. See text for largely compatible with values expected for the "oceanidc crust.more drNtiss.
To ;.n"crease t.he spreading loss G(x:) at shallow denths, one must reoutre frequency-dependent Q to satisfy the data. Furth er, Lewisdecrease the veloci ty gradiens.., d 'd:, to acoount for the excess and Jung [1989] conclude that the combined effects of the shallowattenu-econ'. It is possibl!e, therefore, to have a more uniform-like }'Jgh"yatenuatinglayer andvlocystrucureLnitstandardseismicshallow layer, assuming that thkere is only intrinsic attenuation. In refraction data to be below 30 Hz. The modeling presented hereth e same vein. thedeftoitof attenuation atdepth (Figures 8a and 8d) (Figure 9) requires only that path-ave'raged 2 of the crust be lessimplies that we have underestimated the velocity gradients. than about 1030 to lmit tue frequency content of typical seismic
Our results also demornsTrate circumstantial evidence for crustal refraction data.heterogeneities within' the 3-kma-wide array. Every attempt to modelthe data statistically reoui-es a separate solution for each receiver. CONCLLStONSSome of the models alsoT recu.ired a .-o.cphysical 18 dependence of T[he results of the first determination of compressional waveat:en'uaton. Anomalous travel 5.im'.e residuals and arrivals have also att.enuati on in the uppermost oceanic crust revealed that attenuationbeeon,"otedbyPoujolandlcacobson [1988]. Tomographic;' version can largely be described by a lincar frequency dependence ofo f attenuation would be the ',ogical next step, but the pauc ,,of data attenuation and a frequency-independent component of attenuation.and the few overlapping pathks would render this exercisea futile. Values of Q vary between 20 and 50 for the uppermost 650 en of the
Examination of the data for azimuthal variations, possibly due to crust. The attenuation is significantly higher than those found byaligned vertical cracks, showed n~o signiJficant correlation. It must modeling data with synthetic seismograms but is in general agree-be pointed out, however, that our data set is heavily biased towards ment with recent laboratory data [Wep/er and Chsristensens, 1987.ray paths in a north-south orientation, due to the position o' thereceivers relative to the shots (Figure 1). Refracted arrivals from
outside the array and thus tao poorly located to be useful [Pousjol Parllearil Jacobson, 1983]. A qualitative comparison of an arrival atSFH3 from the east and from the south at approximately the samerange (Figure 10) show a clear amplitude difference, Thus Perpendicularazimutal variation of attenuationt within the shallow crust cannot ,,,..,,, ,-be ruled out entirely.
Finally, Lewis and Jwsg [ 1989] examined a midwater towed arraydata set using surface o.harges in the same area as our experiment.Their forward modeling of attenuation indicates that a minimum of O0o 0.2attenuation exists at 10 Hz due to the presence of high-velocity .ime, secondsgradients in the uppermost crust, which acts to duct higz-frequencyenergy within the high gradient zone. Tney modeled the attenuation Fig. 10. Equal amplitude plots of shts recorded SF 8 oriented parallel
stlucture with two layers: a 1 km thick upper layer with a Q of 50 a d perpendicular o the ridge crest at about 2 km range. The shot perpen-
overlying a Q half-space of 2C00. By fitting their data from 2 to 28 dicular to the ridge cress lies outside the receiving array and could no bezi-l they round a satisfactory fit, but required a frequency-dependent adequately located for inclusion in the data inversion, The foisparty inamplitudes suggests an azimuthal variation in attenuation, possibly due tototal Q due to the velocity sructure effects. Our data here caot verlically orieted cracks and fissures aligned paralle o he ridge cres. A
be used to confirm or refute these conclusions, as our e dat re frequencyeeedoa uthal varition, largely dueothe paucity ofresolution is too poor at low frequencies. Our solutions do not hos oriented perpt dicular to the e mol cress.

JACOBSON A.D LEws: C(---,C CRLSTAL Q 17,429
this issue]. Based upon mode"lng of tpical seismic refraction data Kja;rensscn, E., Constant Q-wave propagation and attenution, I. Geophys.
using the sonar equation, the resuts idicate that our values may be Res., 84, 4737-4748, 1979.
tyrsical to higher thai normal va,-ues of attenuation for oceanic rst. LeAis, B. T. R., and H. Jung, Attenuation of seismic waves un tie upperoce-ac Mist (abstract), Earthquake .Votes, 55,24, 1984.
It is uni;kel,, however, that values of Q of 20 are present throughout Le.is, B. T. R., and H. Jung, Attenuation of refracted seismic waves inthe whole crust. young ocean crest, Bull. Seismol. Soc. Am., 79, 1070-l088, 1989.
Our data do not cur-resp nd :o .V i3me-scale geological interpreta- Liitte, S. A.,and R. A. Stephen, Costa Rca riftborehole seismic experiment,
ticn of the upperrnost crust, but this may be a result of an overly :ni:u:l Rep. Deep Sea Drill. Proj., 83,517-528, 19S5.
smooth velocity depth func:icn, which affects the attenuation Naval Ordnance S, s ,n Command, NAVORDOP3696.Technical Manual,
models. Our data do indicate a deee of heterogeneity within the Explosives safe:y precaution for research vessels, Washington, D.C.,
oceanic crIUsL T"he magnitudes an":d scales of such heterogeneities 1973.0 Ostle, B., and R. W. Mensing. Statistics in Research, 596 pp., Iowa Statecannot be de:erm,ned, but the s7,al scales are likely to be of the U,.tiversity Press, Ames, 1975.order of hundreds of meters. No anmuthal variation of attenuation Poujol, M., and R. S. Jacobson, Using inverse theory and Seabearnwas evident, although the data se: s somewhat inadequate to con- bathymetrytoirnp-aveseismicrefractiondatacorrecions,Mar.Geophys.
cdude '.his resutuI. Res., 9,311-332, 1988.
sand results will be necessary to determine Purdy. G. M., The correction for the travel time effects of seafloor topog-raphy in the interpretation of marine seismic data, J. Geophys. Res., 87,
whe,.her our results are typical or anomalous for young, upper 8389-8396, 1982.oceanrc cr',-sL Until such tiime, however, a healthy caution to using Purdy, G.M., A determination of the seismic velocity structure of sedimentsthe values of Q determined fom synthetic seismograms is war- usingbothsourcesandreceiverneartheoceanfloor, Mar. Geophys. Res.,ted v o8, 75-91, 1986.ranted. Purdy, G. M., New observations of the shallow seismic structure of young
Ac knowledgmenLr. We appreciate the efforts of all those who helped oceanic crust, I. Geophys. Res., 92.9351-9362, 1987.collect this data, particularly the Master of the RIV Wecoma, Ken Palfrey Sauter, A. W., L M. Dornan, and A. E. Schreiner, A study of sea floorand the rest of Lhe crew. Special thanks are extended to Paul O'Neill and structure using ocean bottom shots and receivers, in Ocean SesmoAcos-Tom Fair~ar.ks, who helped prepare the seafloor hydrophones. ,Michel tics.edited byT. Akalandl.3M. Berkson.pp.673-68S,PlenuM,NewYork,Puujol helped prepare the seisrruc data and transcribe it for us as one of us 1986.(R.S..) made the transition from Oregon State University to the Office of Shor. G. G., Jr., Refraction and reflection techniques and procedures, in TheNaval Research. Special thanks go to Dale Bibee, who provided codes to Sea, vcl. 3. edited by.M. N. Hill, pp. 20-38,Wiley-nterscience,NewYork,coe.r- shot specta. Ellen Kappei londly provided the regional map of the 1963.Juan de Fuca region. This paper was reviewed by R. Stephen and an Shor, G. G., Jr., Cruise report, Mariana Leg 10, SfO Ref. 79-8, Scripps Inst.anonymous reviewer, both of whom provided excellent guidance for of Oceanogr.. La Jolla, Calif., 1979.re,'issons. This work was performed under ONR contract NOC134-84C- Spudich. P.. and J. Orcutt, A new look at the seismic velocity structure of0213 while R.S.J. was at OSU and under ON'R contract N00014- the oceanic crust, Rev. Geophys., 18,627-645, 19SOa.89W,#'X24098 while at ONR. B.T.R.L. was funded under ONR contract Spudich P., and J. Orcutt, Petrology and porosity of an oceanic crustal site:NCI 4-84-C-0111. Results from waveform modeling of seismic refraction data, I. Geophys.
Res., 85, 1409-1433, 1980b.R__ F=R. Stephen, R. A., Lateral heterogeneity in the upper oceanic crust at Deep Sea
Drillng Project site 504, J. Geophys. Res., 93, 6571-6584, 1988.Ak,. K., and P. G. Richards, Qua.:i-ve Seismology. 932 pp., W. H. S::r',,. R. A., and A. J. harding. Travel time analysis of borehole seismic
Freman. New York, 1980. data, I Geophys. Res., 88, 8289-8298, 1983.C 'Lns. JA.. G. M. Purdy, and 7. M. Brocher. Seismic velocity structu-e St-h.h.., R. A., K. E. Louden, and D. H. Matthews, The oblique seismic
at Deep Sea Drilling Project site 504B, Panama Basin: Evidence for thin expe, .nent on DSDP leg 52, Geophys. J. R. Astran. Soc., 60. 289-300,crust, J. Geophys. Res., 94,9283-9302, 1989. 190.
Dorman, L M., and R.. S. Jacobsas, Linear inversion of body wave data, 1, S',ift, S. A., and R. A. Stephen, Lateral heterogeneity in the seismic structureVelocity structure from travel times and ranges, Geophysics, 46, 138-151, of the upper oceanic crust, westem North Atlantic, I. Geophys. Re:.. 94,1981. 9303-9322, 1989.
Ewing, J. I., and G. M. Purdy, Upper crustal velocity structure in the ROSE Urick, R. J., Ambient Noise in the Sea, Peninsula Publishing. Los Altos,area of the East Pacific Rise, I. Geophys. Res., 87,8397-8402, 1982. Calif., 1986.
Harding, A. J., J. A. Orcutt, M. E. Kappus. E. E. Vera, J. C. Mutte- P. Buhl, Vera. E. E., Seismic structure of 0- to 4.5 MY-old oceanic crust betweenR. S. Detrick, and T. M. Brocher. Structure of young oceanic crust at 13?IN 9*N and 13'N on the East Pacific Rise, Ph.D. thesis, 127 pp., Cc!L'-umbiaon the East Pacific Rise from expanding spread profiles, J. Geophys. Res.. Univ., New York, March 1989.94, 12,163-12,196, 1989. Wepfer, W. W., and N. L Christensen. Characterizing microcracks via a
Jaccbson, R. S., An investigation into t e fundamental relationships between velocity-pressure relation (abstract). Eos, Trans. AGU, 58, 1503, 1987.attenuation, phase dispersion and frequency using seismic refraction Wepfer. W. W., and N. I. Christensen, Compressional wave attenuation inprcfiles over sedimentary strc:u,.s, Geophysics, 52, 72-87, 1987. oceanic basalt,, J. Geophys. Res., this issue.
Jaccbson, R. S. G. G. Shor. Jr., ard L M- Dorman, Linear inversion of body Wiggins, R. A., The general linear inverse problem: Implications of surfacewave data, II, Attenuation versus depth using spectral ratios, Geophysics. waves and free oscillations for earth structure, Rev. Geophys., 10,251-285,46, 152-162, 1981. 1972.
Jaccbson, R. S.. G. G. Shor, Jr., and NM. Bee. A comparison of velocity andattenuation between the Nicobar and Bengal Deep Sea FansJ. Geophys. R. S. Jacobson, Office of Naval Research, Marine Geology andRes., d9,61S1-6196, 1984. Geophysics, Code 1125GG, Arlington, VA 22217
Johnson, R. V., II, C. R. B. Lister, and B. T. R. Lewis, A direct recording B. T. R. Lewis, School of Oceanography, University of Washington,ocean bottom seismometer, Mar. Geophys. Res., 3,65-85, 1977. Seattle, WA 98195
Johnston, D. H., and M. N. Toks6z. Definitions and terminology, in SeisrmtcWave Attenuation, edited by M. N. TuksOz ani D. H1. Johnston, pp. 1-5.Society of Exploration Geophysics, Tulsa, Okla., 1981. (Received September 1, I99;
Jung, t., Velocity and attenuatuon in young ocean crust, Ph.D. thesis, 124 revised January 9, 1990;pp., Univ. of Wash., Seattle, May 198S. accepted March 22, 1990.)


![-XUDGRV 0J ,QJ $JXVWtQ %DVVL 'U ,QJ(PDQXHO ,UUD]DEDO 0J ...laboratorios.fi.uba.ar/lse/tesis/LSE-FIUBA-Trabajo... · Microsoft PowerPoint - Presentación Final.pptx Author: MyNotebook](https://static.fdocuments.net/doc/165x107/5fd1bb6e462c8a028528d32f/xudgrv-0j-qj-jxvwtq-dvvl-u-qjpdqxho-uuddedo-0j-microsoft-powerpoint.jpg)


