DCP 2.0 Transformation
31
DCP 2.0 Transformation
Transcript of DCP 2.0 Transformation

DCP 2.0 Transformation

2
Forward-Looking StatementsThis presentation may contain or incorporate by reference forward-looking statements regarding DCP Midstream, LP (the “Partnership” or
“DCP”) and its affiliates, including outlook, guidance, projections, estimates, forecasts, plans, and objectives. All statements in this
presentation, other than statements of historical fact, are forward-looking statements and are typically identified by words such as “target,”
“outlook,” “guidance,” “may,” “could,” “will,” “should,” “intend,” “assume,” “project,” “believe,” “predict,” “anticipate,” “expect,” “scheduled,”
“estimate,” “budget,” “optionality,” “potential,” “plan,” “forecast,” and other similar words and expressions. Although management believes
that expectations reflected in such forward-looking statements are based on reasonable assumptions, no assurance can be given that such
expectations will prove to be correct due to risks, uncertainties, and assumptions that are difficult to predict and that may be beyond our
control. If any of these risks or uncertainties materialize, or if underlying assumptions prove incorrect, the Partnership’s actual results may
vary materially from what management anticipated, expected, projected, estimated, forecasted, planned, or intended. You are cautioned not
to place undue reliance on any forward-looking statements.
Investors are encouraged to consider closely the risks and uncertainties disclosed in the Partnership’s most recent Annual Report on Form
10-K and subsequent Quarterly Reports on Form 10-Q filed with the Securities and Exchange Commission, which risks and uncertainties
include, but are not limited to, the ongoing global economic impacts of the COVID-19 pandemic, pricing and supply actions by oil exporting
countries, the resulting supply of, demand for, and price of oil, natural gas, NGLs, and related products and services, the duration of the
foregoing impacts, and the time period for any recovery in commodity prices and demand. These risks and uncertainties could cause our
actual results to differ materially from the forward-looking statements in this presentation, which may include, but are not limited to, our
expectations on outlook, guidance, and sensitivities, our 2020 mitigating actions and options including distribution, capital, and cost
reductions, our sources and uses of liquidity and sufficiency of financial resources, our projected in-service dates for growth projects, and
our construction costs or capital expenditures in relation to estimated or budgeted amounts. Furthermore, in addition to causing our actual
results to differ, such risks and uncertainties may cause our assumptions and intentions to change at any time and without notice, and any
such changes may also cause our actual results to differ materially from the forward-looking statements in this presentation.
The Partnership undertakes no obligation to publicly update or revise any forward-looking statements, whether as a result of new
information, future events, or otherwise. Information contained in this presentation speaks only as of the date hereof unless otherwise
expressed, is unaudited, and is subject to change.
Regulation G: This document includes non-GAAP financial measures as defined under the rules and regulations of the Securities and
Exchange Commission, such as adjusted EBITDA, distributable cash flow, excess free cash flow, segment adjusted EBITDA, segment
adjusted gross margin, forecasted adjusted EBITDA, forecasted distributable cash flow, and forecasted excess free cash flow. A
reconciliation of these measures to the most directly comparable GAAP measures is included in the Appendix to this presentation.
Note: All presentation statistics and year-to-date numbers are as of September 30, 2020 unless otherwise noted.
3
Leading Midstream Provider
One of the largest NGL producers and gas processors in the United States
Integrated Logistics & Marketing and Gathering & Processing business with competitive footprint and geographic diversity
Unparalleled interconnectivity and access to fractionators on the Gulf Coast, including Mt. Belvieu and Sweeny, with Conway for optionality
Leading industry positions in premier basins, including the DJ Basin, Permian, Eagle Ford, and SCOOP
57KMiles of Pipeline 39Plants 6.0
Bcf/dprocessing capacity (1) 1.7
MMBpd NGLPipeline capacity
(1) Includes only DCP processing plant capacity
Diversified Portfolio of Assets in Premier Basins
2.8Bcf/d Natural Gas Pipeline capacity

4
Digital Adoption Curve
Source: McKinsey & Company

5
45% of employee short term incentives tied to execution of transformation objectives
DCP 2.0 Digital Transformation Journey
People, Process,
Technology
Design Thinking
Agile Product Development
DCP 2020
DCP 2020 People, Process,
Technology & DATA
Design Thinking
Agile Product Development
DCP Tech Ventures
Robotic Process
Automation
HyperAutomation
Enterprise Data
Management
Advanced Predictive Analytics
EnterpriseLean Business
System
ESG Enhancement
Digital Business
Monetization
DCP 2020
People, Process,
Technology
Design Thinking
Agile Product Development
Robotic Process
Automation
Self-service Advanced Analytics
Project based LEAN
DCP Tech Ventures
2016 - 2017 2017 - 2019 2020 - 2023
Transformation
objectives expand from
core team to 25% of
STI across the
company
Transformation Office Led:
Discovery / Experimentation
Transformation Office + Business Driven:
Maturing Practices and Digital Solutions
Employee / SME Led:
End to End – Continuous Improvement
Fully aligned
transformation agenda
throughout DCP,
exploring digitally
enabled lean business
system
6
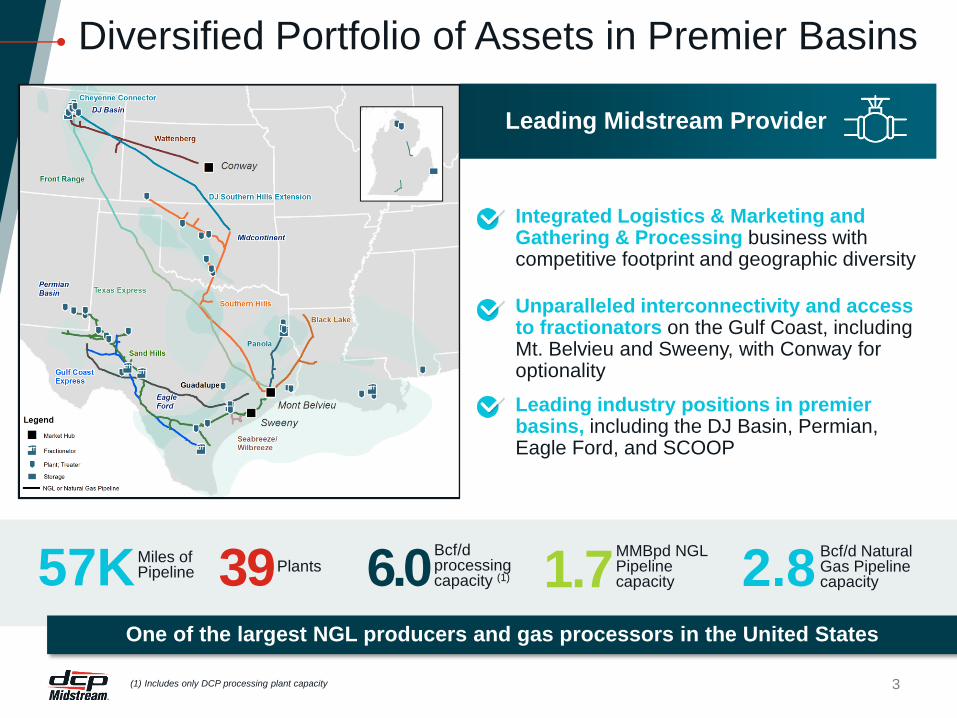
Industry leading transformation through people, process, and technology
DCP 2.0: Driving the Operations of the Future
• Utilize real-time data from a
variety of sources to make the
most strategic business
decisions
• Increase reliability and asset
runtime
• Improve margin by optimizing
the value of every asset and
every molecule
• Drive workforce efficiencies
through automation
• Create digital platforms to
improve employees’ quality of
life and customer experience
• Build high-tech portfolio and
world-class Workforce of Today
• Establish culture of innovation
and agility
• Improve safety and decrease
emissions
• Enhance process and
equipment monitoring
program
• Drive substantial cost
reduction via lean
manufacturing platform
• Utilize predictive analytics to
improve asset maintenance
Achieve Real-Time
Optimization and Decision
Making
Digitally Enable the
Business and WorkforceIncrease Cash Flow While
Diminishing Risk
DCP 2.0 Strategic Objectives
Real-Time
Decisions
Better Reliability
and Safety
AssetOptimization
HigherMargins
Cost
Savings

7
Enhancing DCP’s ability to optimize cash flow and ensure business continuity through technology
ContractsEngineering
DataKPIs
Financial
Data
Real-Time
Prices
SCADA
and DCS
Integrated Collaboration Center (ICC)
Linking Numerous Data Sources
Integrated Collaboration Center
• ICC continues to gain momentum with functionality; now tracking data and optimizing the majority of plants
• Incorporating operations, engineering, commercial, and market data
• Focus expanding to the field, including large infrastructure of pipelines and compressors
• 24/7 monitoring for major field assets
Remote Operations
• 20 facilities incorporated into the ICC for remote operations in 2019; four transitioned YTD 2020
• During COVID-19 lockdowns, facilities are operated from employee homes
• Driving increased cross-functional collaboration among gas controllers, plant and field coordinators, optimizers, and board operators
• Strengthening integration between plants and across regions
• A platform by which plant operation best practices can be identified and quickly replicated
ICC and Remote Operations

8

9
Margin Optimization
Big data insights drive
plant performance & optimization
through digital twin simulation
93%
95%
97%
99%
2018 2019 2020
Recovery-Based Performance
All DCP Plants0
10
20
30
40
50
60
2018 2019 2020
Major Equipment Failure*
*Equipment refers to engines, compressors, motors, and pumps at compressor stations and plants
Decreasing major equipment failures,
equating to less unplanned downtime
through AI driven predictive analytics
65% reduction in major
equipment failures, enabling
better volume management
7B data points processed
each day to optimize every
molecule

10
Leading cost reduction effort to drive excess free cash flow while maintaining OE
2019 to 2020e Industry Cost Reduction
(21%) (21%)
(17%)
(13%)(12%)
(11%) (11%)(10%)
(9%)(8%)
(7%)
(4%)(2%) (2%)
(1%) (1%)
0% 2%
3% 5%
6% 7% 7%
11%
15% 16%
31%
Peer
1
Peer
2
Peer
3
DC
P
Peer
5
Peer
6
Peer
7
Peer
8
Peer
9
Peer
10
Peer
11
Peer
12
Peer
13
Peer
14
Peer
15
Peer
16
Peer
17
Peer
18
Peer
19
Peer
20
Peer
21
Peer
22
Peer
23
Peer
24
Peer
25
Peer
26
Peer
27
Source: UBS Research. Costs include Opex and G&A
Peers include: AM, BPMP, CEQP, CQP, ENBL, ENLC, ET, ETRN, HEP, KMI, LNG, MMP, NGL, NS, OKE, PAA, PBFX, PPL-TSE, RTLR, SHLX, SUN, TCP, TRGP, TRP-TSE, USAC, and WMB
Q3 DCP Results $130MM (17%) YoY
Cost Reduction YTD

11
DCP Technology Ventures
Rapidly Piloting & Adopting Emerging Tech
Safety• Encroachment Tech - Satellites, Drones, Fiber
• Plastic Pipeline Detection
• Smart Wearables
Sustainability• Carbon Capture, Utilization, and Storage (CCUS)
• Methane Detection and Reduction
• Edge Cameras and Analytics
Digital Enablement• Digital Applications for the Workforce of Today
• Artificial Intelligence & Machine Learning
• Industrial Internet of Things (IIoT Edge)
Reliability• Predictive Asset Maintenance
• Smart Sensors & Ultra Capacitors
Other Emerging Technologies• Membranes and Acoustics
• New Energy - Fuel Cells, Hydrogen, Nuclear
Accelerating digital transformation and technology adoption for the
midstream industry to improve sustainability and increase optimization
Startups & Accelerators
Universities & Global Alliances
Venture Capitalists

12
Creating long-term value and driving increased unitholder return
DCP 2.0 Delivering Competitive Advantage
Enhancing our sustainability results via emerging technology
adoption to ensure long-term durability and operational excellence
Enabling best in class cost and capital discipline to increase
sustainable excess FCF generation
Operating scalable, cutting-edge digital platform that positions DCP
well for potential midstream consolidation cycle
Driving margin uplift through Integrated Collaboration Center
optimization and improved reliability to create maximum returns from
existing assets
Technology adoption, including remote operations allows for business
continuity during crisis, including the COVID-19 pandemic

13
Appendix

14
AVG. 52-weekTRADING VOLUME1.6MM
DISTRIBUTION PAYMENT
$.39 / $1.56
2020 GPA Midstream
Association Awards
for Environmental
Excellence and
Energy Conservation
CREDIT RATINGS
Ba2 / BB+ / BB+
UNIT PRICE
$14.71
$17.1B
ANNUALIZED
AVAILABLELIQUIDITY$1.3B
TOTAL ASSET BASE(1)
413
FORTUNE500
NUMBER
COMPETITIVE POSITION
• Fully integrated value chain with
predominantly fee-based assets generating
excess free cash flow through 2021
• Large footprint in advantaged basins across
nine states
• Industry-leading innovation and digital
transformation via DCP 2.0
DCP Midstream Snapshot
Note: Market statistics as of November 9, 2020
(1) Total Asset Base for Q3 2020 = Gross PPE + Intangibles + Investments in Unconsolidated Affiliates
MARKETCAP
$3.1B
DCP $152MMExcessFCF YTD
NYSE TICKER

15
INTEGRATED MIDSTREAM PROVIDER EXCESS FREE CASH FLOW POSITIVE
• Fully integrated midstream business, with strong Logistics portfolio and geographically diverse, premier asset base
• Broad NGL pipeline footprint with unparalleled access to fractionators along the Gulf Coast, including Mont Belvieuand Sweeny, with Conway providing optionality for customers
• Leading industry positions in the DJ Basin, Northern Delaware (Permian), Eagle Ford, and SCOOP (Midcontinent)
• Only 7% of DCP’s dedicated acreage is on Federal lands
FINANCIAL FLEXIBILITY & STABILITY
• 3.9x bank leverage ratio(1) with primary financial focus on long-term delevering
• $1.75B capacity via bank facility and A/R securitization facility; ample liquidity secured with $1.3 billion unutilized
• No common equity offerings since March 2015
• Exceeding 80% fee and hedged target for 2020
• Providing attractive yield for unitholders through the cycle
• Excess free cash flow positive in 2020 and into 2021, increasing liquidity and accelerating delevering
• Early downturn mitigation driving ~$900MM of retained cash through substantial cost and capital savings
• Supply long, capacity short strategy focused on using existing infrastructure, offloads, and strategic asset dispositions to efficiently integrate and harness the earnings power of broad, high-quality footprint
SUSTAINABILITY & TECHNOLOGY LEADERSHIP
• 2020 GPA Midstream Association Awards for Environmental Excellence and Energy Conservation
• DCP 2.0 digital transformation increasing cash flow while minimizing risk via real-time optimization & decision making
• DCP Technology Ventures evaluating emerging technologies to improve sustainability and drive efficiencies
• Recognized by the World Economic Forum as a member of the Global Lighthouse Network, distinguishing the world’s top advanced manufacturing companies
Compelling Investor Value Proposition
(1) Bank leverage ratio calculation = Total debt (excludes $550 million Jr. Subordinated notes which are treated as equity) less cash divided by adjusted EBITDA, plus certain
project EBITDA credits from projects under construction

16
Transformed into a fully integrated midstream provider with a balanced portfolio
DCP Business Evolution
* Consolidated Enterprise
Extended and enhanced Logistics
& Marketing (L&M) value chain
Strategically aligned Gathering &
Processing (G&P) footprint
Opportunistic consolidation,
right-sizing the portfolio
DCP 2.0 transformation through
people, process, and technology
10%
90%
55% 45%
Adjusted EBITDA
by Segment
FY 2010*
FY 2019
Logistics & Marketing
Gathering & Processing
2010* 2020
Optimizing cost structure and
generating excess free cash flow

17
Resiliency and Durability of the DCP Model
Prioritizing Debt
Reduction
$156 million of debt
reduction in Q3;
Bank leverage
improved to 3.9x(2)
Growing Excess
Free Cash Flow
Generated $130 million of
excess free cash flow(1) in
Q3; $152 million YTD
Continued Cost &
Capital Efficiency
Expect to beat YoY $120MM
cost reduction target;
Delivering a 71% reduction
in YTD total capital
Leading on Innovation
& Transformation
Recognized by World
Economic Forum as Global
Lighthouse; Launched largest
industry-led methane survey
Operational
Excellence
Maintaining top safety
performance while driving
emissions reductions and
improved reliability
(1) Excess Free Cash Flow = DCF less distributions to limited partners and the general partner, less distributions to noncontrolling interests, and less expansion capital
expenditures and contributions to equity method investments
(2) Bank leverage ratio calculation = Bank debt (excludes $550 million Jr. Subordinated notes which are treated as equity) less cash, divided by Adjusted EBITDA, plus certain
capital project EBITDA credits
Health and Safety
Priority
Protecting our
employees,
contractors, customers,
and communities

18
Focused on cost and capital management, while maintaining safe and reliable
operations, to drive excess FCF and strengthen the balance sheet
Successfully Navigating 2020PRIORITY ACTION RESULT
Health & Safety • Implemented pandemic response plan to
ensure safety of our employees,
customers, communities, and operations
• Healthy workforce
• Business continuity; safe and reliable
operations
Sustainability • Launched largest industry-led methane
survey
• Established Sustainability Council
• Step change reduction of emissions in the
Permian
• Published inaugural Sustainability report
• Established I&D Committee
Improve Cash Flow
• Established Cost Task Force
• Reduced total capital, including deferral
of Sweeny Fractionator option
• 50% distribution reduction
• Optimized ~$900MM of retained cash flow
• $152MM of excess FCF generated YTD
• $130MM YTD cost reduction YoY
• Total capital down 71% YoY
Increase Liquidity• Issued $500MM of senior notes in Q2;
proceeds used to pay down bank facility• ~$1.3B of available liquidity
Reduce Leverage • Established as top capital allocation
priority
• $175MM of debt reduction YTD
• Bank leverage improved to 3.9x
• Fitch improved to stable outlook
Maintain Utilization
Rates
• Long-term supply long, capacity short
strategy
• Proactive retention of volumes via short-
term optimization of netbacks in Q2
• Overbuild mitigation in advance of downturn
• G&P and L&M volumes meeting expectations

19
Q3 Results Q4 Outlook 2H Expectations
L&M Volumes Q3 volumes
flat to Q2
Expected declines due to
reduced ethane recovery
G&P Volumes Q3 volumes slightly
down to Q2
Slight increase
in volumes
Ethane
Rejection
~50% increase in ethane
recovery from Q2
Maintaining partial
recovery
CostsSlight sequential
increase
Increased costs due to
project deferrals
Sustaining
Capital
Continued discipline driving
spend down meaningfully
Increased capital due to
project deferrals
Growth Capital Slightly exceeded high
end of range in Q3
Minimal
capex
PricesNGL - $0.44/gal
Nat Gas - $1.98/MMBtu
Crude - $40.93/Bbl
Stronger natural gas
prices; NGL and crude flat
Outperformance demonstrating resiliency and durability of DCP business model
Delivering on Commitments

20
Safety & Operational Excellence
(1) Industry average data from GPA Midstream Association
(2) Safety metrics from Bureau of Labor Statistics as of 2018
0.82
0.44
0.300.36
0.93
0.790.87
0.66
2016 2017 2018 2019
DCP Total Recordable Injury RatesIncidents per 200,000 hours worked
GPA Midstream Division 1 Companies
4.5
3.7
3
1.9
1.3
0.4 0.3
Transportation andWarehousing
Educational andHealth Services
Construction Utilities Professional andBusiness Services
Petroleum Refineries DCP
Industry Safety MetricsIncidents per 200,000 hours worked
(1)
(2)

21
Strengthening the balance sheet to ensure stability through continued uncertainty
Solid Financial Position
Enhanced
Efficiencies
17% YoY
Cost
Reduction
Solid
Liquidity
~$1.3B
Improved
Leverage
3.9x
RA
Progress
Fitch
Improved
to Stable
Diversified
Earnings
62%
Logistics
Stable
Cash Flows
83%(1)
Fee +
Hedged
Lowered
Debt
$175MM
Increased
Excess FCF
$152MM
Note: All metrics represent YTD results as of September 30, 2020 except leverage, which is calculated on a TTM basis
(1) 70% fee plus 30% commodity margin x 43% hedged = 83% fee and hedged as of October 31, 2020

22
Long-Term Financial Priorities
$406
Growth Capital Distributions 2020e DCF
Substantial
excess free
cash flow
being
utilized to
delever
2020 Excess FCF Generation
• Excess free cash flow positive in 2020
and 2021, enhancing liquidity and
delevering
• Premier assets, cost and capital
discipline, and DCP 2.0 driving
sustainable excess FCF optimization
• Delevering is top capital allocation
priority
• Current bank leverage at 3.9x, better
than 2020 target of 4.0x
• Targeting 3.5x leverage ratio
• No common equity issued since 2015
Generate Excess Free Cash Flow
Reduce Leverage
Improve Credit
Ratings
• Ba2/BB+/BB+ credit ratings
• Continual drive toward investment
grade to lower cost of capital
(in $MM)

23
DCP joins the World Economic Forum’s Global
Lighthouse Network of companies leading the
world on innovation via Fourth Industrial Revolution
technological adoption at scale
1 of 54COMPANIES
1 of 5COMPANIES
RECOGNIZED IN
NORTH AMERICA
SELECTED INTO
THE GLOBAL
LIGHTHOUSE
NETWORK
1 of 1COMPANIES
IN THE US OIL AND
GAS INDUSTRY
RECOGNIZED
World Economic Forum Designation

24
Coal21%
Oil28%
Natural gas25%
Nuclear5%
Renewables 21%
"Shale output from the United States is set to stay higher for longer than previously projected, reshaping global
markets, trade flows and security. In the Stated Policies Scenario, annual US production growth slows from the
breakneck pace seen in recent years, but the United States still accounts for 85% of the increase in global oil
production to 2030, and for 30% of the increase in gas.”
0
2
4
6
8
10
12
14
16
18
20
2018 2025 2030 2035 2040
Coal Oil Natural gas Nuclear Renewables
Coal27%
Oil31%
Natural gas23%
Nuclear5%
Renewables 14%
World Primary Energy Demand by Fuel (BTOE) Share by Fuel
2018
2040
Source: International Energy Agency, World Energy Outlook 2019, Stated Policies Scenario
Hydrocarbons continue to fuel our global society for decades, with increased demand for natural gas
Long-Term Global Demand for Natural Gas
25
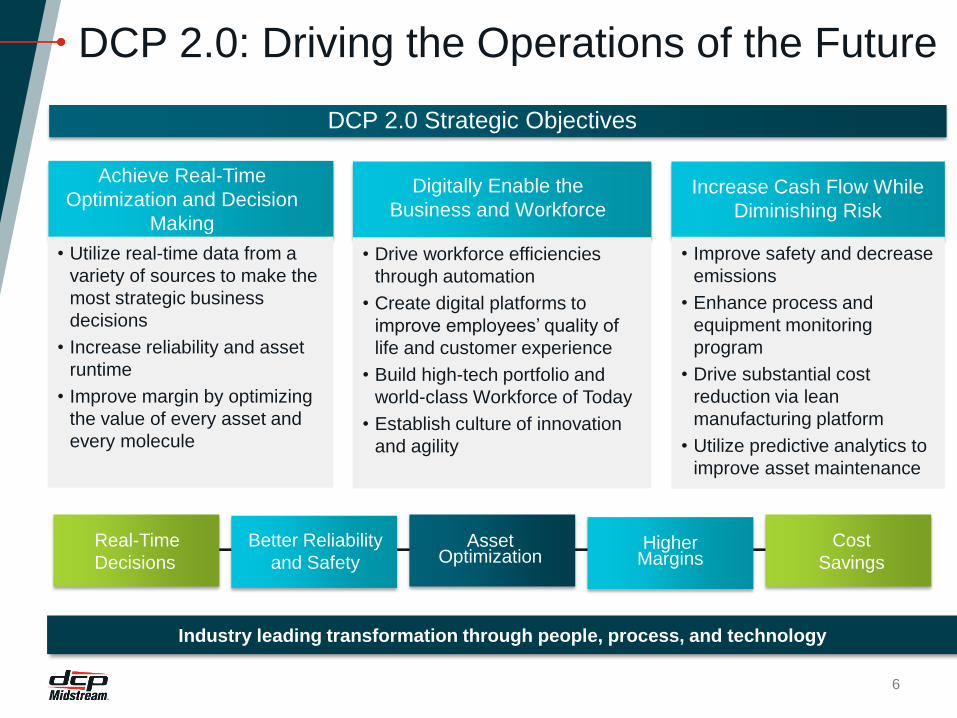
Highlights from the Inaugural DCP
Midstream Sustainability ReportDCP is committed to safety, social responsibility, diversity, environmental leadership,
operational excellence, and ethical business practices to ensure the decisions we make today
are also the right decisions for the future.
Our Purpose & Vision
Our purpose is the lens through which we assess every decision, every action, and
every strategy. From creating the feedstock used for thousands of products and warming
our homes, to fueling our transportation systems and providing reliable and affordable
energy access, we play a critical role in the energy value chain that drives our society. To
achieve our purpose, we must sustainably execute our vision.
Midstream EHS Leader
The safety of our employees, contractors, and
communities is top of mind in everything we do,
every day, and is prioritized at all levels of the
organization as our top value.
Our Purpose: Building Connections to Enable Better Lives
2018 & 2019
recordable injury
rates represent
best safety
records in
company history
2020 GPA
Midstream
Association
Energy
Conservation
Award
2020 GPA
Midstream
Association
Environmental
Excellence Award
2019 GPA
Midstream
Association
Division I
Safety Award
Our Vision: To be the safest, most reliable, low-cost midstream service provider
Read our full report at:
DCPMidstream.com/Sustainability

26
DCP 2.0
Transformation
We are leading the
industry in innovation and
digital adoption with a
focus on transformation
through people, process,
and technology.
Highlights include:
Integrated Collaboration
Center (ICC)Enhancing our digitized central
nervous system which processes
seven billion data points daily to fully
optimize our operations
Remote Operations at 24
FacilitiesResulting in volume, reliability, and
recovery improvements
DCP Technology VenturesWorking with start-ups to help
develop groundbreaking energy
technologies that improve safety,
efficiency, and sustainability
Decision Support System
(DSS)Utilizing software that allows the
company’s real-time operational
statistics to be available to every
employee
Environmental Management
We recognize our critical responsibility to provide safe, affordable, reliable
energy, while reducing our contribution to, and mitigating the impacts of climate
change. In addition to strong environmental compliance and reporting, our
efforts include:
• Monitoring our facilities with innovative technologies, such as infrared cameras to find and repairs leaks
• Participating in iPIPE, a nationally recognized coalition focused on leak detection and prevention
• Actively supporting nationwide Ecosystem Conservation Partnerships
• Supporting public awareness programs on pipeline safety
• Implementing regular emergency management training and asset drills
Culture & Community
We take pride in our dedicated efforts to create a safe, vibrant culture that
enables and provides opportunities for our employees and communities to thrive.
• Established Cultural Hallmarks: Trust, Connect, Inspire, Solve, and Achieve
• Supporting a variety of internal employee groups, including: Young Professionals Network, DCP
Veterans, the Leadership Development Network, and the Business Women’s Network
• Formed Community Connections Committee to drive local engagement, directing over $75,000 to new,
grassroots charitable efforts in 2019
• Raised and contributed over $1.4 million for nonprofit causes in 2019
• Top national corporate fundraiser for 2018 American Heart Association (AHA) Heart Walk, with nearly
$9 million contributed to the AHA since 2007
• Recognized as a Forbes Best Midsize Employer for 2018 and 2019
Governance
The Board of Directors and our Executive Committee are committed to ethical
business practices and effective risk and performance management.
• The Audit Committee, comprised of all independent directors, assists the Board in oversight of financial
statements, audits, legal, and regulatory compliance
• Eliminated Incentive Distribution Rights in 2019, exemplifying our owners’ support and positioning DCP
and all stakeholders for long-term success
• Relevant to sustainability, we have identified our material issues, risks, and opportunities for our
business and put a governance structure in place that includes an Sustainability Council. We have set
ambitions for continuous transparency and accountability and we look forward to discussing our
progress 26

27
Non-GAAP Reconciliations

28
Non-GAAP Reconciliations
28
** We define adjusted gross margin as total operating revenues, less purchases and related costs, and we define segment adjusted gross margin for each segment
as total operating revenues for that segment less purchases and related costs for that segment. Our adjusted gross margin equals the sum of our segment adjusted
gross margins. Adjusted gross margin and segment adjusted gross margin are primary performance measures used by management, as these measures represent
the results of product sales and purchases, a key component of our operations. As an indicator of our operating performance, adjusted gross margin and segment
adjusted gross margin should not be considered an alternative to, or more meaningful than, operating revenues, gross margin, segment gross margin, net income or
loss, net income or loss attributable to partners, operating income, net cash provided by operating activities or any other measure of financial performance presented
in accordance with GAAP.

29
Non-GAAP Reconciliations
29

30
Non-GAAP Reconciliations
30

31
Non-GAAP Reconciliations