DC Public Education Reform Amendment Act … This report supplants Report No. 3, Part I, submitted...
42
020:14:LP:fs:AD:LP DC Public Education Reform Amendment Act (PERAA) Report No. 3 * August 22, 2014 The Education Consortium for Research and Evaluation (EdCORE) * This report supplants Report No. 3, Part I, submitted June 30, 2014.
Transcript of DC Public Education Reform Amendment Act … This report supplants Report No. 3, Part I, submitted...

020:14:LP:fs:AD:LP
DC Public Education Reform Amendment Act (PERAA) Report No. 3* August 22, 2014 The Education Consortium for Research and Evaluation (EdCORE)
* This report supplants Report No. 3, Part I, submitted June 30, 2014.

DC Public Education Reform Amendment Act (PERAA) Report No. 3
TRENDS IN TEACHER EFFECTIVENESS IN THE
DISTRICT OF COLUMBIA PUBLIC SCHOOLS (DCPS) School Years 2008-2009 — 2012-2013
Submitted to the
August 22, 2014
In collaboration with
The Education Consortium for Research and Evaluation (EdCORE) is led by the Graduate School of Education and Human Development at the George Washington University, in partnership with American Institutes for Research, Mathematica Policy Research, Policy Studies Associates, Quill
Research Associates, RAND, and SRI.

i
Foreword
This is the third in a series of interim reports on the 2007 Public Education Reform
Amendment Act (PERAA) prepared by EdCORE at the George Washington University, under
contract with the National Academy of Sciences (NAS). The reports provide analysis to inform
the work of the NAS Committee on the Five Year Summative Evaluation of the District of
Columbia Public Schools, in response to the mandate for independent evaluation included in
PERAA. The interim reports provide updates by school year, highlight trends across years in
selected evaluation topic areas, and provide additional data collected for longer term analysis.
With guidance from the Office of the District of Columbia Auditor and adherence to the PERAA
legislation, four broad topics have been the focus of EdCORE’s inquiry:
• Business practices and strategies, including organizational structure and roles, financial
management, operations management, facilities and maintenance; resource
allocations; public accountability; interagency collaboration; and stakeholder
engagement and responsiveness.
• Human resources operations and human capital strategies, including the number (and
percentage) of highly qualified teachers; retention rates for effective teachers; schools
and wards served by effective teachers; length of time principals and administrators
serve; types of leadership strategies used; and responsibilities of central office versus
school level leadership.
• Academic plans, including integration of curriculum and program specific focus into
schools and grade progression and credit accumulation.
• Student achievement, including a description of student achievement that includes
academic growth; proficiency; and other (non-academic) educational outcomes.
The previous EdCORE reports provided annual snapshots of each topic and preliminary trend
analysis in the areas of business practices and academic planning. This third report addresses
human resources and includes two parts. Part I (originally released June 30, 2014), focuses on
teacher effectiveness (as measured by IMPACT) and retention in District of Columbia Public
Schools (DCPS). Part II provides information on trends in teacher effectiveness by ward and
socioeconomic status (SES) of schools in DCPS.
Part I was written by a team at Mathematica Policy Research with editorial contributions from
the EdCORE professional staff. The Mathematica team included Elias Wash and Dallas Dotter
with Steven Glazerman as project lead. Part II was written by EdCORE staff based on analyses
provided by Dr. Cathy Trapani of WestEd.

ii
As noted in our previous reports, we caution readers about findings and implications of these
analyses. Though informative, the data presented here are not sufficient to fully describe PERAA
implementation across the entire citywide education landscape or infer causes of observed
trends. It would be imprudent to attribute observed differences to the enactment and
implementation of PERAA. Causal inferences of this sort cannot be established without
substantially more information and analysis. Although the validity of the IMPACT evaluation
system has been debated nationally and locally, it still remains to be the current measure of
teacher performance in the D.C. Public Schools (DCPS). Therefore, we have accepted this
measure as the basis for the analysis described in this report.
As requested by the D.C. Auditor, the final two reports will follow the pattern established here
and focus on trend analysis in the remaining topic areas of student achievement (Report 4)
and the public accountability and stakeholder engagement and responsiveness section of
business practices (Report 5).
In addition, to the support provided by the D.C. government through NAS, the work reported
here was supported indirectly by funds from a combination of public and private organizations
that have helped create and build EdCORE. Acknowledgments go to the National Science
Foundation (NSF), American Institutes for Research (AIR), CityBridge Foundation, and Judy and
Peter Kovler for their generous support of EdCORE. We also wish to thank GW Vice President
for Research Leo Chalupa and Provost Steven Lerman for their institutional support, without
which it would not have been possible to fulfill the demands of the PERAA evaluation and
related activities.
We are grateful to our colleagues at the NAS – Robert Hauser, Stuart Elliott, Natalie Nielsen,
Alix Beatty, and committee co-chairs Lorraine McDonnell and Carl Cohn along with the
members of their committee – for their confidence in EdCORE and for their wise counsel on
matters technical and stylistic. We wish also to thank Acting D.C. Auditor, Lawrence Perry, for
his consummate professionalism and gracious management of the budget and contracting
process.
Dr. Heather Harding and Sahar D. Sattarzadeh provided conceptual, technical, and logistical
support at all phases of the work. We are grateful to Dr. Trapani for first-rate assistance with
complex data analysis, and to Nancy Kober and Amy Berman for superb editing and research
assistance. The deft handling of contractual matters by Viola Horek (NAS) and Maxine Freund,
Christine Tomasik, and Vinnie Mitchell (GWU) was also greatly appreciated.
Heather Harding, Ed.D.
Executive Director, EdCORE, Graduate School of Education and Human Development
The George Washington University
Michael J Feuer, Ph.D.
Dean, Graduate School of Education and Human Development
The George Washington University

iii
CONTENTS
FOREWORD ....................................................................................................................................... I
PART I: TRENDS IN TEACHER EFFECTIVENESS, RETENTION, AND MOBILITY, DCPS ........................ 1
A. INTRODUCTION ........................................................................................................................... 1
B. THE DCPS IMPACT EVALUATION SYSTEM ................................................................................... 4
C. TRENDS IN RETENTION RATES .................................................................................................... 6
How dismissals of teachers vary over time ........................................................................ 6
How retention rates of teachers vary over time ................................................................ 8
How retention rates of teachers vary across schools ....................................................... 10
D. TRENDS IN EFFECTIVENESS OF ENTERING AND EXITING TEACHER COHORTS ......................... 13
E. TRENDS IN EFFECTIVENESS OF NOVICE TEACHERS RELATIVE TO VETERAN TEACHERS ........... 17
F. CONCLUSIONS ........................................................................................................................... 21
PART II: TRENDS IN DCPS TEACHER EFFECTIVENESS BY LOCATION AND SOCIOECONOMIC STATUS ............................................................................................................................. 23
A. INTRODUCTION ......................................................................................................................... 23
B. ANALYSIS OF IMPACT SCORES BY DC WARD ............................................................................ 24
C. ANALYSIS OF IMPACT SCORES BY SES ....................................................................................... 25
D. ANALYSIS BY WARD AND SES ................................................................................................... 27
E. CONCLUSIONS ........................................................................................................................... 32
REFERENCES .................................................................................................................................. 33
iv
TABLES
Table I-1. Components and features of the DCPS IMPACT system, by school year ....................... 5
Table I-2. Dismissals of teachers in DCPS, by school year .............................................................. 7
Table I-3. Trends in effectiveness of teachers who entered or left DCPS .................................... 15
Table I-4. Trends in effectiveness of novice DCPS teachers relative to veteran teachers ........... 19
Table II-1. Number of teacher IMPACT scores examined by ward ………………………………………….. 24
Table II-2. Categories of schools by SES …………………………………………………………………………………. 26
Table A.1. Retention rates of teachers in DCPS, by school year ................................................... 35
Table A.2. Trends in effectiveness of novice DCPS teachers who remained in DCPS for at least
two years, relative to veteran teachers ………………..……………………………………………………. 36
FIGURES
Figure I-A. Percentage of teachers who left DCPS, by dismissal criteria eligibility and
school year .......................................................................................................................... 7
Figure I-B. Retention rates of teachers in DCPS, by effectiveness category and school
year ..................................................................................................................................... 9
Figure I-C. Numbers of teachers retained and not retained in DCPS, by effectiveness
category and school year .................................................................................................... 9
Figure I-D. Number of schools by school-wide retention rate of all DCPS teachers and
school year ........................................................................................................................ 11
Figure I-E. Number of schools by school-wide retention rate of effective and highly
effective DCPS teachers and school year .......................................................................... 12
Figure II-A. Mean impact scores, DCPS, school years 2009-10 through 2012-13……………………. 24
Figure II-B. Trends in IMPACT scores across DC wards, 2009-10 through 2012-13………………… 25
Figure II-C. Impact scores by school-level SES……………………………………………………………………….. 27
Figure II-D — Ward 1……………………………………………………………………………………………………………… 28
Figure II-E — Ward 2………………………………………………………………………………………………………………. 28
Figure II-F — Ward 3………………………………………………………………………………………………………………. 29
Figure II-G — Ward 4……………………………………………………………………………………………………………… 29
Figure II-H — Ward 5……………………………………………………………………………………………………………… 30
Figure II-I — Ward 6………………………………………………………………………………………………………………. 30
Figure II-J — Ward 7 ……………………………………………………………………………………………………………… 31
Figure II-K — Ward 8……………………………………………………………………………………………………………… 31
1
PART I: TRENDS IN TEACHER EFFECTIVENESS, RETENTION, AND
MOBILITY, DCPS
A. Introduction
The enactment of the Public Education Reform Amendment Act (PERAA), coupled with
changes in the leadership of the DC Public Schools (DCPS)—principally the appointment of
Michelle Rhee to the newly created post of chancellor—resulted in reforms in the governance
structures, human capital policies, and resource management of DCPS and DC charter schools.
PERAA also required periodic reports describing the impact of these reforms on DCPS business
practices and strategies, human resources and human capital strategies, academic plans, and
student achievement. The first two reports written for PERAA chronicled outcomes for the
2010–2011 and 2011–2012 school years (Education Consortium for Research and Evaluation
2013a and 2013b). Both enumerated outcomes and strategies for a single school year and did
not address trends over time. In contrast, this report describes trends in outcomes related to
human resources and human capital strategies between the 2008–2009 and 2012–2013 school
years.
The major human resources/human capital change in DCPS after the enactment of PERAA
was the creation of the IMPACT system for teacher performance evaluation. In this report, we
focus on how teacher retention rates and teacher effectiveness—as measured by IMPACT
scores—have evolved since DCPS implemented the IMPACT system for the 2009–2010 school
year. DCPS has used IMPACT to evaluate teachers and make decisions about teacher retention
and pay. Our work informs the following questions about policies aimed at improving teacher
effectiveness:
• Have DCPS teacher retention and dismissal policies successfully retained the most effective
teachers and removed the least effective teachers?
• Given the number and effectiveness of teachers who left DCPS each year and the need to
hire replacements, have hiring practices in DCPS led to more effective teachers in the
district?
• Have DCPS practices to support teachers early in their career helped teachers improve?
Because PERAA and IMPACT introduced multiple new policies to DCPS, and also because
other changes and trends in DCPS may have affected the outcomes in our analysis, no specific
outcomes or trends can be attributed to PERAA or IMPACT alone. The research questions
examined here aim at helping education policymakers and practitioners understand how
teacher retention and teacher effectiveness have changed over time in DCPS.
The measures of teacher effectiveness used in this analysis are based on DCPS teachers’
IMPACT scores. A key challenge for our analysis of trends in the effectiveness of DCPS teachers
is that year-to-year comparisons of IMPACT scores may not be meaningful because of changes

2
in how the scores were calculated over time, such as changes to the weights given to the
components used in the calculation of the scores (we describe the changes to IMPACT in
section B). Our main approach to address this issue is to examine changes in the gaps in
average IMPACT scores between groups rather than to directly compare IMPACT scores across
years. For example, to examine trends in the effectiveness of new teachers to DCPS, we
compare the average IMPACT scores of the new teachers to the scores for a benchmark group
of “core teachers” whose identity is consistent over time. Whereas the average IMPACT scores
of new teachers could change over time only because of changes to the calculation of IMPACT
scores, changes to IMPACT are less likely to affect the gap in scores between new teachers and
the benchmark group. This is because using a consistent comparison group removes the
consequences of year-to-year changes to IMPACT if the changes affected scores for both groups
in the same way. For example, after the first year of IMPACT, DCPS reduced the weight given to
the classroom observation component in the calculation of IMPACT scores. Our approach
accounts for this change if the IMPACT scores of new teachers changed similarly compared to
those of core teachers.
Using administrative data from DCPS, our study addresses the following research
questions:
1. Have retention rates of effective teachers changed since the first year of IMPACT?
Because teachers who earn an ineffective rating in one year or a minimally effective rating
for two consecutive years are dismissed under IMPACT, overall retention rates may fall even
as effective teachers are retained at higher rates. We first examine how many teachers met
IMPACT criteria for dismissal and were dismissed. We then compare the overall retention
rate for teachers in the 2008–2009 school year, before IMPACT scores were calculated, to
the overall retention rates in each of the first three years of IMPACT (the 2009–2010 to
2011–2012 school years). We also compare the rate at which DCPS retained its most
effective teachers (measured by IMPACT) in the first year of IMPACT in 2009–2010 to the
same rates in 2010–2011 and 2011–2012. Finally, we examine whether the rate at which
individual schools retained teachers changed over time.
2. How effective are teachers who leave DCPS and teachers who are hired to replace them?
Whether the average DCPS teacher was more effective four years after IMPACT began
depends in part on whether DCPS retained its most effective teachers and hired new
effective teachers to replace its least effective teachers. We examine the effectiveness of
teachers who entered and exited DCPS since IMPACT was initiated compared to those
“core teachers” who remained in DCPS from the 2008–2009 through the 2012–2013 school
years. We calculate the gap between the average IMPACT scores of teachers who left DCPS
in a given year and the core teachers in each year. We also calculate the gaps between the
average IMPACT scores of teachers who were new to DCPS each year and the average
IMPACT scores of core teachers.
3. How does the effectiveness of novice teachers change with experience? We measure
changes in effectiveness for novice teachers as they become more experienced relative to
the change in effectiveness for veteran teachers. Teachers typically become more effective

3
as they gain experience, which is why novice teachers are usually less effective than
veteran teachers. The success of IMPACT in improving teacher effectiveness may depend in
part on whether and how much novice teachers improve over time compared to veteran
teachers.
As in the previous reports for the 2010–2011 and 2011–2012 school years, this study uses
administrative data from DCPS on teachers. To answer questions about trends in teacher
effectiveness over time, we examine data provided by DCPS that include: (1) IMPACT scores for
all DCPS teachers in the 2009–2010 to 2012–2013 school years and (2) a list of teachers
teaching in the 2008–2009 school year.1,2 Although there are limitations to using IMPACT scores
to measure teacher effectiveness, the IMPACT score was specifically designed to evaluate DCPS
teachers. Three main limitations could affect the interpretation of our results. First, IMPACT
scores are not guaranteed to be comparable year to year, so the actual effectiveness of
teachers classified as highly effective could change. We address this first limitation by
examining changes in the effectiveness of key groups of teachers using a consistent comparison
group of teachers to remove year-to-year differences in how IMPACT scores are calculated.
Second, the effectiveness of the teachers in our comparison group may change over time,
leading to findings about improvements in teacher effectiveness that are too large or too small.
For example, we would find too little improvement in a cohort of novice DCPS teachers if
performance pay or other features of IMPACT improve the effectiveness of veteran DCPS
teachers—our comparison group for the novice teachers. Third, even if IMPACT scores provide
highly accurate measures of teacher effectiveness, no measure can provide a perfect
evaluation. Misclassification errors in IMPACT could affect the interpretation of some of our
results.
In section B, we describe the details of the IMPACT evaluation system. In section C, we
present the results of our analysis of teacher retention, in section D, we examine the
effectiveness of DCPS leavers and new hires and in section E, and we examine how the
effectiveness of novice teachers changes with experience. We present conclusions in section F.
1 The IMPACT data provided by DCPS included some teachers with an incomplete IMPACT rating in one or more
years. Teachers who received incomplete ratings were not subject to consequences under IMPACT. In preparing
the data for analysis, we excluded all records for 281 teachers with incomplete ratings.
2 The best available information did not always allow DCPS to distinguish classroom personnel from other DCPS
personnel in the 2008–2009 school year. Consequently, the list of 2008–2009 teachers we used in the analysis may
include some personnel who were not classroom teachers and may exclude some who were.

4
B. The DCPS Impact Evaluation System
During the years of our study, IMPACT evaluation scores in DC were based on the following
components: (1) evaluations by school administrators and other trained observers using a
classroom-observation rubric (Teaching and Learning Framework); (2) an individual value-added
(IVA) measure of student achievement growth;3 (3) an alternative measure of student
achievement growth based on achievement targets determined by the teacher and principal
(Teacher-Assessed Student Achievement Data); (4) a principal-assessed measure of the
teacher’s collaboration with colleagues and support of school initiatives and programs
(Commitment to the School Community); (5) a principal-assessed measure of the teacher’s
attendance, adherence to school policies, and professionalism (Core Professionalism); and (6) a
school value-added score (SVA).4
The composition of a teacher’s IMPACT evaluation score is based on that teacher’s IMPACT
group. Group 1 consists of general education teachers of math and reading/English language
arts (ELA) in grades 4 through 8—the grades and subjects for which test score data needed to
calculate teacher value added are available. DCPS expanded group 1 to include reading/ELA
teachers in grades 9 and 10 for the 2012–2013 school year. Group 2 includes all other general
education teachers. Groups 3 through 7 (or 8 in the 2009–2010 school year) include other
teachers, such as those with special education or English language learner (ELL) students. Over
75 percent of DCPS teachers are included in groups 1 and 2.
In addition to the teachers’ IMPACT group, the weights for each component in the total
score depended on the school year. We describe these weights by school year in Table I-1 for
group 1 teachers (top panel) and group 2 teachers (middle panel). For example, prior to the
2012–2013 school year, the IVA score constituted 50 percent of the total evaluation score for
group 1 teachers. The weight on the IVA score was reduced to 35 percent for the 2012–2013
school year. The components used for teachers in groups 3 through 8 vary too widely to include
in the table. For example, in the 2009–2010 school year, the TLF score constituted 50 to
100 percent of the weight for these teachers; the remaining weight was given to a variety of
components that included some of the same measures used for group 1 and 2 teachers and/or
measures that are specific to the teacher’s role, such as measures of the quality and timeliness
of individualized education plans for special education teachers. For all groups, the total
evaluation score ranged from 100 to 400 points. Based on this score, a teacher received one of
four possible effectiveness ratings: highly effective (350 to 400 points), effective (250 to 349
points), minimally effective (175 to 249 points), or ineffective (100 to 174 points). For the 2012–
2013 school year, DCPS teachers could receive a new rating of developing (250 to 299 points).
Under IMPACT, teachers who earn a highly effective rating receive performance pay; those
who earn an ineffective rating one year or a minimally effective rating for two consecutive
3 Value added is a measure of teacher effectiveness that seeks to isolate a teacher’s contribution to student
achievement from any confounding factors outside the teacher’s control (Isenberg and Hock 2012).
4 The SVA component was not used in teachers’ evaluations for the 2012–2013 school year.

5
years are dismissed.5 The amount of performance pay highly effective teachers receive is higher
for teachers in schools where at least 60 percent of students are eligible for free or reduced-
price lunch (FRL); bonuses in the years studied were as large as $25,000 for group 1 teachers
and $20,000 for teachers in other groups. Additionally, teachers with consecutive highly
effective ratings received an increase in base pay. For the 2012–2013 school year, DCPS
introduced a more extensive career-ladder system: advances were based on receiving effective
and highly effective ratings. The performance pay features of IMPACT by school year are shown
in the bottom panel of Table I-1.
The DCPS IMPACT guidebooks for these school years provide additional details about the
IMPACT components, weights, and features.
Table I-1. Components and features of the DCPS IMPACT system, by school year
Weight on component in school year (percentage)
2009–2010 2010–2011 2011–2012 2012–2013
Components for group 1
Teaching and learning framework 40 35 35 40
Individual value-added score 50 50 50 35
Commitment to the school community 5 10 10 10
Teacher-assessed student achievement data 0 0 0 15
School value-added score 5 5 5 0
Core professionalism Adjustment Adjustment Adjustment Adjustment
Components for group 2
Teaching and learning framework 80 75 75 75
Teacher-assessed student achievement data 10 10 10 15
Commitment to the school community 5 10 10 10
School value-added score 5 5 5 n.a...
Core professionalism Adjustment Adjustment Adjustment Adjustment
Feature
Performance bonus pay n.a... Included Included Included
Performance base pay increase n.a... Included Included n.a...
Career ladder n.a... n.a... n.a... Included
Source: DCPS IMPACT guidebooks for the 2009–2010 through 2012–2013 school years.
Notes: The components are scored on a continuous scale from 1.0 to 4.0, except for the core professionalism
component, which is scored on a scale of 0 (best) to -40 (worst). The total IMPACT score is calculated by
multiplying the teacher’s score on each component (except core professionalism) by its weight and summing the
results. A teacher’s core professionalism score is applied as an adjustment after all other components have been
combined.
The teacher-assessed student achievement component was called “non-value-added student achievement
growth” in the 2009–2010 school year.
n.a... = not applicable
5 Starting with ratings given in the 2012–2013 school year, teachers who earn a developing rating for three
consecutive years will be dismissed.

6
C. Trends in Retention Rates
New policies relating to dismissal and performance pay may have affected the retention of
teachers in DCPS. As a result of dismissals under IMPACT, overall retention rates may have
fallen and the additional exits may have been concentrated among less-effective teachers.
Additionally, retention rates of more-effective teachers may also have fallen if the possibility of
dismissal or other aspects of IMPACT that teachers view unfavorably led teachers to exit DCPS.
On the other hand, performance pay could have provided incentives for highly effective
teachers to remain in DCPS. Previous research has found evidence that performance pay
incentives may have led to higher retention of the most effective teachers and that the threat
of dismissal under IMPACT may have led more low performing teachers to leave DCPS even
though they were eligible to remain (Dee and Wyckoff 2013).6
How dismissals of teachers vary over time
We can identify the teachers who were dismissed under IMPACT for low IMPACT ratings,
although some of these teachers might have left DCPS even in the absence of IMPACT. Under
IMPACT, teachers in the minimally effective category for two years or in the ineffective
category for a single year are subject to dismissal.
The proportion of teachers dismissed under IMPACT was higher in year 2 of IMPACT
compared to year 1. According to Table I-2, DCPS dismissed 1.8 percent of teachers at the end
of year 1 of IMPACT and 5.5 percent at the end of year 2 (row 1, columns 1 and 2). In year 1,
DCPS only dismissed teachers with ineffective ratings. Teachers received their second rating in
year 2 of IMPACT, so DCPS could base its retention decisions on two years of IMPACT data for
the first time at the end of that school year. Thus, the higher rate of dismissals at the end of
year 2 of IMPACT reflects additional separations among this first cohort of teachers who could
have received IMPACT scores in the minimally effective category for two consecutive years. The
126 teachers with consecutive minimally effective ratings in year 2 represent over two-thirds of
the dismissals in that year. Excluding those teachers would result in a rate similar to the rate
from year 1 (row 2, columns 1 and 2).
The proportion of teachers dismissed under IMPACT was lower in years 3 and 4 of
IMPACT compared to year 2. DCPS dismissed 2.5 percent of teachers at the end of year 3 for
having two consecutive years of minimally effective ratings or an ineffective rating (row 1,
column 3), just over half the rate of dismissals at the end of year 2. The proportion of teachers
who were eligible for dismissal under IMPACT at the end of year 4 (row 1, column 4) was also
smaller than in year 2. This is reflected in the lower percentages from years 3 and 4 of both
6 Dee and Wyckoff (2013) focused only on teachers with IMPACT scores near the boundaries of effectiveness
categories because doing so allowed them to infer that the changes in retention rates were caused by IMPACT. In
contrast, our focus is on describing overall trends in the retention of DCPS teachers rather than on attributing
changes in retention rates to IMPACT policy.

7
teachers who were rated as minimally effective in two consecutive years (row 3) and those who
were rated as ineffective (row 2), compared to the same percentages in year 2.
The proportion of DCPS teachers dismissed under IMPACT was smaller than the
proportion of teachers leaving DCPS for other reasons. In addition to being dismissed on the
basis of IMPACT ratings, teachers also left DCPS for other reasons. Teachers who left DCPS
despite being eligible to remain represented 15.5 percent of DCPS teachers at the end of year 1
and increased to 16.9 percent by the end of year 3. As shown in Figure I-A, even at the end of
year 2, when the dismissal rate peaked at 5.5 percent, there were nearly three times as many
leavers who did not meet IMPACT criteria for dismissal as there were teachers who met the
criteria.
Table I-2. Dismissals of teachers in DCPS, by school year
Category Year 1 Year 2 Year 3 Year 4a
Percent dismissed 1.8 5.5 2.5 2.3
Percent ineffective 1.8 1.7 1.0 1.3
Percent minimally effective in consecutive years 0.0 3.8 1.5 1.0
Number of teachers dismissed 62 182 83 76
Total number of teachers 3,378 3,315 3,270 3,264
Source: Mathematica calculations based on administrative data from DCPS.
Notes: Under IMPACT, teachers who earn an ineffective rating in one year or a minimally effective rating for two
consecutive years are dismissed. Teachers could be dismissed for consecutive minimally effective ratings
beginning in year 2.
a Whereas the percentages and counts in the columns for years 1 through 3 reflect teachers who were actually dismissed by
DCPS, those in year 4 reflect only teachers’ eligibility for dismissal. In years 1 through 3, DCPS dismissed all eligible teachers.
Figure I-A. Percentage of teachers who left DCPS, by dismissal criteria eligibility and school year
Source: Mathematica calculations based on administrative data from DCPS.
05
10
15
20
Perc
enta
ge o
f A
ll D
CP
S T
each
ers
1 2 3
IMPACT Year
Met IMPACT criteria for dismissal
Did not meet IMPACT criteria for dismissal

8
Notes: Under IMPACT, teachers who earn an ineffective rating in one year or a minimally effective rating for two
consecutive years are dismissed. Teachers could be dismissed for earning consecutive minimally effective ratings
beginning in year 2.
How retention rates of teachers vary over time
The overall rate of retention for DCPS teachers was 71 percent in the year before IMPACT
(the 2008–2009 school year).7 The average rate of retention in the first three years of IMPACT
(the 2009–2010 through 2011–2012 school years) was 80 percent, an increase of 12 percent
(9 percentage points) pre- and post-IMPACT. However, this result should be interpreted with
caution for two reasons. First, DCPS indicated that, as a result of limitations in the available
data, the list of teachers teaching in the 2008–2009 school year may include some personnel
who were not classroom teachers and may exclude some who were. This could result in a pre-
IMPACT retention rate that is too low or too high. Second, even if the difference reflects actual
differences in retention rates of teachers between these years, it could be due to other policies
or trends in DCPS and cannot be attributed solely to IMPACT.
Although we cannot examine retention by effectiveness prior to IMPACT, we can examine
whether trends for more- or less-effective teachers are responsible for changes in retention
rates since IMPACT. To do so, we compare the proportion of teachers who were retained in
each IMPACT effectiveness category in 2009–2010—the first school year of IMPACT—to the
same proportions in 2010–2011 and 2011–2012.
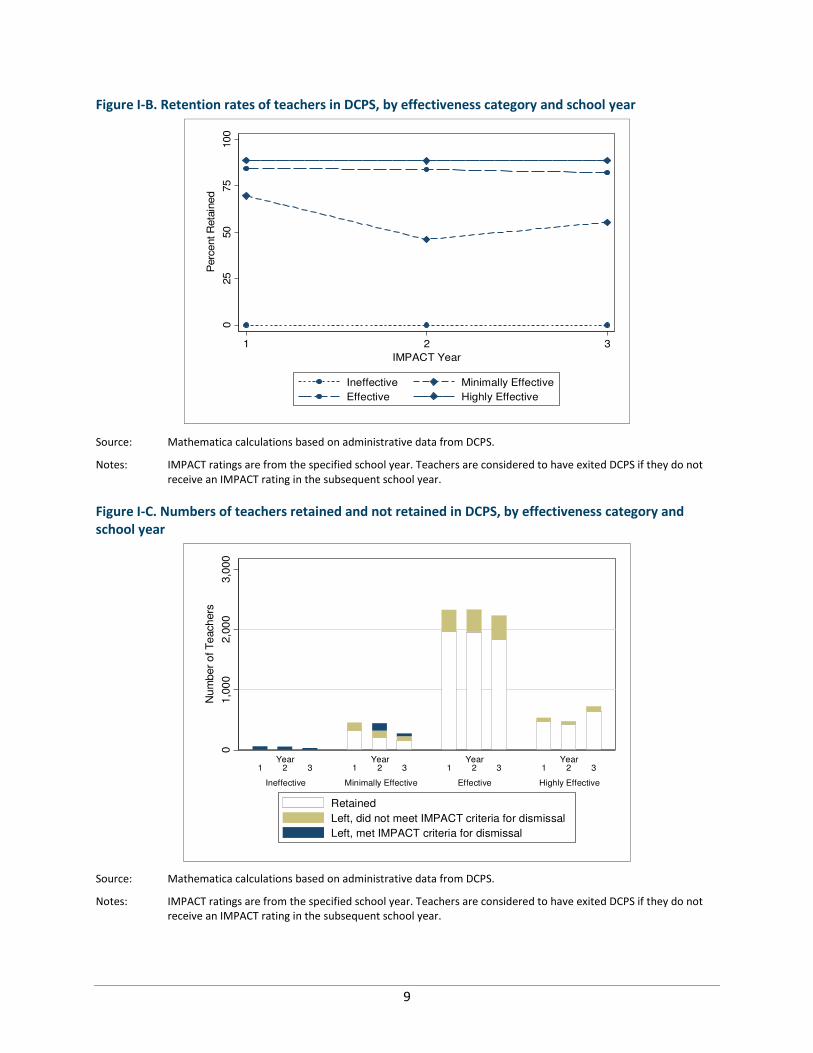
DCPS retained over 80 percent of teachers classified as effective or highly effective by
IMPACT, and these retention rates did not change over the first three years of IMPACT. Figure
I-B shows retention rates for all DCPS teachers by IMPACT rating.8 DCPS retained 89 percent of
teachers in the highly effective category in each of years 1, 2, and 3 of IMPACT (solid line). Of
teachers in the effective category, DCPS retained between 82 and 84 percent in these years
(dashed line with circles). Figure I-C shows how many teachers were retained (white), left DCPS
despite being eligible to remain (khaki), and left DCPS after meeting IMPACT dismissal criteria
(blue) in each effectiveness category by year. Although the retention rates for the effective and
highly effective groups of teachers were similar, the number of teachers classified as effective
who left DCPS is substantially larger than the number classified as highly effective who left. This
is because teachers in the effective category represented between 68 and 71 percent of all
DCPS teachers during these years, whereas less than a quarter of teachers were classified as
highly effective.
7 Retention rates do not distinguish between teachers dismissed under IMPACT and teachers who exited
voluntarily.
8 Appendix Table A.1 shows retention rates by IMPACT group. Because there are relatively few group 1 teachers—
for example, 459 in year 1 of IMPACT compared to 2,919 teachers in groups 2 through 8—some differences in
retention rates between these groups that appear substantive are not statistically significant.
9
Figure I-B. Retention rates of teachers in DCPS, by effectiveness category and school year
Source: Mathematica calculations based on administrative data from DCPS.
Notes: IMPACT ratings are from the specified school year. Teachers are considered to have exited DCPS if they do not
receive an IMPACT rating in the subsequent school year.
Figure I-C. Numbers of teachers retained and not retained in DCPS, by effectiveness category and
school year
Source: Mathematica calculations based on administrative data from DCPS.
Notes: IMPACT ratings are from the specified school year. Teachers are considered to have exited DCPS if they do not
receive an IMPACT rating in the subsequent school year.
025
50
75
100
Perc
ent R
eta
ined
1 2 3
IMPACT Year
Ineffective Minimally Effective
Effective Highly Effective
01,0
00
2,0
00
3,0
00
Nu
mber
of T
each
ers
Ineffective Minimally Effective Effective Highly Effective
1
Year2
3
1
Year2
3
1
Year2
3
1
Year2
3
Retained
Left, did not meet IMPACT criteria for dismissal
Left, met IMPACT criteria for dismissal

10
Retention of teachers classified as minimally effective was lower in years 2 and 3 of
IMPACT than in year 1. DCPS retained 70 percent of teachers in the minimally effective
category in year 1 of IMPACT, but only 46 percent in year 2, a statistically significant drop.9 The
lower rate of retention for minimally effective teachers in year 2 of IMPACT reflects additional
dismissals among this first cohort of teachers who could have received IMPACT scores in the
minimally effective category for a second consecutive year. The retention rate for teachers
rated minimally effective in year 3 of IMPACT was 55 percent, significantly lower than the rate
in year 1, but not significantly different from the rate in year 2.
One possible limitation of the analysis of retention rates in this section is that IMPACT
effectiveness categories are not guaranteed to be comparable year to year, so the actual
effectiveness of teachers classified as highly effective could change. Changes could result from
differences in the calculation of the total IMPACT score or in the scoring of the components, so
rescaling IMPACT scores to be comparable across years is not straightforward. Although the
effectiveness categories may not be consistent across years, our analysis provides information
about how teachers are retained based on how they are classified into effectiveness categories
by DCPS.
How retention rates of teachers vary across schools
In addition to examining the retention of teachers in all DCPS schools, we also examined
how retention rates differed between DCPS schools and whether those differences changed
over time. Some schools may have retained a smaller proportion of teachers than others, and
the number of schools with low retention rates may change over time. Additionally, schools
may differ in how they retain the most effective teachers. Figure I-D shows how retention rates
of all teachers differed across schools and over time, and Figure I-E shows how retention rates
of teachers classified as effective and highly effective differed.
In years 1 through 3 of IMPACT, more DCPS schools retained at least 80 percent of
teachers than was the case pre-IMPACT. In the year before IMPACT, 34 percent of DCPS
schools retained at least 80 percent of teachers. These schools are shown in the white bar of
Figure I-D for the 2008–2009 school year. In contrast, more schools retained at least 80 percent
of teachers in the three post-IMPACT years (the height of the white bar for the post-IMPACT
school years is taller): 65 percent of schools retained at least 80 percent of teachers in year 1 of
IMPACT, 48 percent did so in year 2, and 55 percent did so in year 3. However, we again caution
that the pre-IMPACT retention rates may be too low or too high as a result of limitations in the
quality of the pre-IMPACT data available from DCPS. Additionally, differences in retention rates
pre- and post-IMPACT could be due to other policies or trends in DCPS and cannot be attributed
solely to IMPACT.
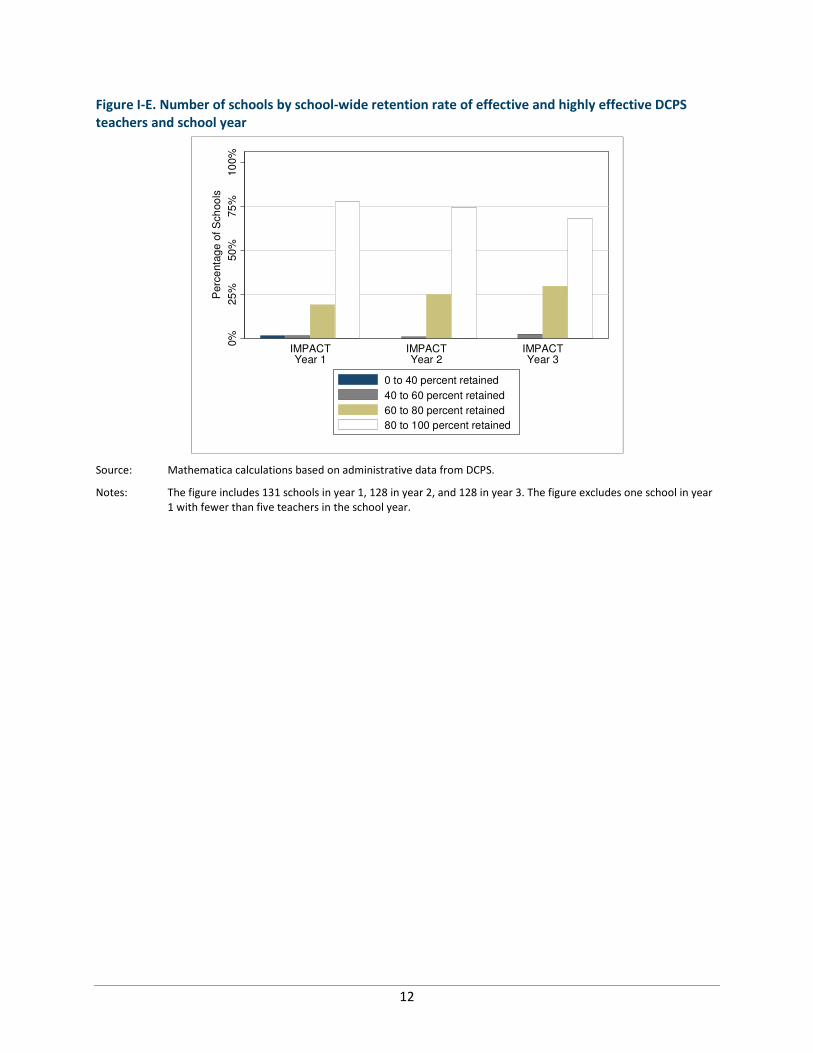
In each of years 1 through 3 of IMPACT, over two-thirds of schools retained at least
80 percent of teachers classified as effective or highly effective. According to Figure I-E,
school-wide retention rates of effective or highly effective teachers were similar in the first
9 We estimated standard errors assuming that retention decisions are uncorrelated across years.

11
three years of IMPACT, although the number of schools that retained at least 80 percent of the
most effective teachers gradually declined. In year 1 of IMPACT, 78 percent of schools retained
at least 80 percent of teachers classified as effective or highly effective, 74 percent did so in
year 2, and 68 percent did so in year 3. In contrast, a small number of schools retained fewer
than 40 percent of the most effective teachers in the school in year 1 of IMPACT, whereas all
schools retained at least 40 percent of these teachers in years 2 and 3.
Figure I-D. Number of schools by school-wide retention rate of all DCPS teachers and school year
Source: Mathematica calculations based on administrative data from DCPS.
Notes: The figure includes 124 schools in the pre-IMPACT year, 131 in year 1 of IMPACT, 128 in year 2 of IMPACT, and
128 in year 3 of IMPACT. The figure excludes seven schools in the pre-IMPACT year and one school in year 1 of
IMPACT with fewer than five teachers in the school year.
0%
25
%50
%75
%10
0%
Perc
enta
ge
of S
ch
oo
ls
2008-2009(Pre-IMPACT)
IMPACTYear 1
IMPACTYear 2
IMPACTYear 3
0 to 40 percent retained
40 to 60 percent retained
60 to 80 percent retained
80 to 100 percent retained
12
Figure I-E. Number of schools by school-wide retention rate of effective and highly effective DCPS
teachers and school year
Source: Mathematica calculations based on administrative data from DCPS.
Notes: The figure includes 131 schools in year 1, 128 in year 2, and 128 in year 3. The figure excludes one school in year
1 with fewer than five teachers in the school year.
0%
25
%50
%75
%10
0%
Perc
enta
ge
of S
ch
oo
ls
IMPACTYear 1
IMPACTYear 2
IMPACTYear 3
0 to 40 percent retained
40 to 60 percent retained
60 to 80 percent retained
80 to 100 percent retained

13
D. Trends in Effectiveness of Entering and Exiting Teacher Cohorts
This section investigates the extent to which the effectiveness of teachers in DCPS has
changed since the introduction of dismissal and performance pay policies under IMPACT. To
describe trends in the effectiveness of entry and exit cohorts since IMPACT went into effect, we
examine the gap between the effectiveness of teachers who transitioned into or out of DCPS
and the core group of 1,342 teachers who remained in DCPS from 2008–2009 through 2012–
2013. The comparison group is necessary because year-to-year comparisons of IMPACT scores
may not be meaningful. Using a consistent comparison group removes the consequences of
year-to-year changes to IMPACT if the changes affected scores for both groups in the same
way. We included the same teachers in the comparison group in each year so that changes in
the gaps over time are more likely to reflect changes in the effectiveness of entry and exit
cohorts rather than changes in the identity of teachers in the comparison group.10
In addition to examining teachers who left DCPS as a group, we distinguish between
teachers who did and did not meet IMPACT criteria for dismissal. Teachers who met IMPACT
criteria for dismissal will be among the least effective teachers based on IMPACT scores,
because the criteria are based on these scores. However, the gap between teachers in this
group and core teachers may change over time. For example, if DCPS dismissed the least
effective teachers after the first year of IMPACT, the teachers dismissed in subsequent years
may be relatively more effective, on average. We also compare teachers who left despite
having IMPACT scores high enough to allow them to stay to core DCPS teachers. It might be
difficult for DCPS to develop and maintain an effective teaching workforce if teachers who leave
are relatively effective compared to core teachers.
As a group, new hires to DCPS were less effective than core teachers by a similar amount
in all four years of IMPACT. According to Table I-3, across the four years of IMPACT, new
teachers to DCPS were between 26 and 33 IMPACT points less effective than core DCPS
teachers (row 1).11 Although these within-year gaps are statistically significant, none of the
changes over time are significant, implying that new teachers in each of these years were
similarly effective if there was no change in the effectiveness of core teachers.12 The gaps
remain similar despite substantial differences in the size of the new teacher cohorts over time.
The first year of IMPACT (2009–2010) coincided with the entry of 1,135 new teachers, or 34
percent of all 2009–2010 teachers, whereas only 525 teachers, or 16 percent, were in their first
year during year 4 of IMPACT.
10 To address concerns that changes in the amount of dispersion in IMPACT scores over time could affect the
results of our analysis using the raw IMPACT scores, we also conducted analysis based on IMPACT scores that were
standardized to have the same mean and standard deviation in each year. The results from this alternative analysis
did not substantively affect our main findings.
11 The standard deviation of IMPACT scores ranges from 44 to 50 points across the four years in the analysis.
12 Our standard error estimates in this section do not account for repeated observations of teachers across years.

14
Compared to core teachers, the teachers who left DCPS at the end of year 3 of IMPACT
were relatively more effective than the teachers who left at the end of year 1, and this was
true for leavers who both did and did not meet IMPACT criteria for dismissal. Teachers who
left DCPS at the end of year 1 of IMPACT were less effective than the core teachers by 47
IMPACT points (Table I-3, column 1, row 2). Teachers who left DCPS at the end of year 3 were
less effective than the core teachers by 36 IMPACT points (column 3, row 2), implying that they
were relatively more effective than the teachers who left at the end of year 1 by 11 IMPACT
points if the effectiveness of core teachers did not change.13 Table I-3 indicates that all three
within-year gaps between leavers and core teachers are statistically significant. In addition, the
decline in the gap from year 1 to year 3 is statistically significant.
The third and fourth rows of Table I-3 present gaps relative to the core group of teachers
separately for the two types of leavers. Both groups of leavers were significantly less effective
than core teachers during the first three years of IMPACT. Leavers who did not meet IMPACT
criteria for dismissal were between 23 and 34 IMPACT points less effective than core teachers,
whereas those who met the criteria were between 115 and 165 points less effective than core
teachers. Between years 1 and 2, the gaps relative to core teachers for both groups declined;
teachers in year 2 who met IMPACT criteria for dismissal were relatively more effective by
50 IMPACT points than those in year 1, and those who left DCPS but did not meet the criteria
were relatively more effective by 6 points, although this second change is not statistically
significant.14 Between years 1 and 3, these same increases are 39 points for leavers who met
dismissal criteria and 11 points for leavers who did not, and both increases are statistically
significant. In part, the lower relative effectiveness of leavers who met dismissal criteria in year
1 is due to the fact that the year 1 dismissals included only teachers classified as ineffective by
IMPACT, whereas the dismissals in years 2 and 3 included teachers classified as minimally
effective.
New hires to DCPS in years 1 and 2 of IMPACT were more effective relative to teachers
who left DCPS at the end of those years, but more similar to them in year 3. In all years, both
new hires and teachers who left DCPS at the end of the year were less effective than core DCPS
teachers. For example, teachers new to DCPS were less effective than core teachers by 30
IMPACT points in years 1 and 2 (row 1 of Table I-3). Also, teachers who left DCPS at the end of
year 1 of IMPACT were less effective than core teachers by 47 IMPACT points (column 1, row 2).
Thus, new hires were 17 points more effective than leavers in year 1; although, both groups
13 If changes to IMPACT components and weights between school years affected the measurement of scores
differently for leavers and core teachers, the change in the gap could, in part, reflect these differences rather than
changes in the effectiveness between cohorts.
14 Although both groups of leavers were more effective relative to core teachers in year 2, compared to year 1,
leavers as a group were relatively less effective in year 2 than in year 1. This is possible because relatively more
leavers met IMPACT dismissal criteria in year 2 compared to leavers in year 1.

15
were less effective than core teachers. In year 2, this difference was 20 points. By year 3, this
difference was only 3 points and not statistically significant.15
Table I-3. Trends in effectiveness of teachers who entered or left DCPS
Gap in effectiveness relative to core teachers (IMPACT points)
Subgroup Year 1 Year 2 Year 3 Year 4
Entering teachers (in their first year in DCPS) -30* -30* -33* -26*
Leavers (in their last year in DCPS) -47* -50* -36* n.a...
Met IMPACT criteria for dismissal -165* -115* -126* n.a...
Did not meet IMPACT criteria for dismissal -34* -28* -23* n.a...
Number of core teachers 1,342 1,342 1,342 1,342
Number of entering teachers 1,135 521 640 525
Number of leavers 585 713 637 n.a...
Source: Mathematica calculations based on administrative data from DCPS.
Notes: A positive gap indicates that teachers in the subgroup had higher IMPACT scores on average than core teachers.
Core teachers are teachers in DCPS for all five school years from 2008–2009 through 2012–2013.
Under IMPACT, teachers who earn an ineffective rating in one year or a minimally effective rating for two
consecutive years are dismissed. Teachers could be dismissed for consecutive minimally effective ratings
beginning in year 2.
*Statistically significant at the 5 percent level.
n.a... = not applicable
Although DCPS has not experienced a decline in the effectiveness of new hires relative to
core teachers, these results suggest that the increase in the relative effectiveness of leavers
over time is not offset by increases in the relative effectiveness of new hires. However, even in
year 3 of IMPACT, the new hires were similarly effective compared to the leavers. Even if the
new hires were less effective, this would not necessarily imply that the DCPS teacher workforce
is becoming less effective over time, because the core teachers may be more effective in year 4
than in year 1, and new hires may become more effective over time. This first issue is one of
two limitations of this analysis we discuss below. The second issue we explore in the next
section.
Limitations. Although the gaps shown in Table I-3 indicate that the leavers became
relatively more effective compared to both core and new DCPS teachers, the analysis has two
limitations. First, the effectiveness on exits and entries is measured relative to the effectiveness
of a core group of DCPS teachers. If these core teachers became more effective on average over
the four years—as might be expected as they gain more experience or are positively affected by
15 The differences within a column reflect the performance of leavers in the year before they left to new teachers
during the same year. An alternative comparison is between leavers in the year before they left and new teachers
in the following year, although these differences could only be interpreted as gaps in effectiveness between these
groups if there were no change in the effectiveness of core teachers. These alternative gaps are 18, 17, and
10 points in years 1, 2, and 3.
16
professional development through IMPACT16—the change in the gap for leavers from -47
to -36 IMPACT points from year 1 to year 4 could reflect an actual increase in the effectiveness
of exiting teachers of more than 11 IMPACT points. We cannot directly measure changes in the
effectiveness of core teachers, because year-to-year comparisons of IMPACT scores may not be
meaningful.17
A second limitation arises because DCPS uses the IMPACT score to make retention
decisions about teachers. Even if IMPACT scores provide highly accurate measures of teacher
effectiveness, no measure can provide a perfect evaluation. Due to misclassification errors in
IMPACT, comparisons based on IMPACT can overstate improvements in DCPS teacher
effectiveness. For example, it is possible that an effective teacher was misclassified as
ineffective in year 1, subsequently dismissed, and then replaced by an equally effective teacher
in year 2. Even though such turnover would not change the overall effectiveness of DCPS
teachers, a comparison of IMPACT scores would suggest that DCPS has improved its teaching
staff based on the erroneous rating of minimally effective for the dismissed teacher. If there is
misclassification, the gaps for leavers who met DCPS criteria in all years may indicate they are
less effective than they actually are. This concern about mismeasurement is less likely to affect
gaps for entering teachers and for those who left despite having IMPACT scores that would
have allowed them to stay if they chose.
16 Dee and Wyckoff (2013) find evidence that performance pay incentives under IMPACT led to improvements in
the effectiveness of teachers who might receive them. However, because their results could be explained by
changes in the identity of DCPS teachers over time (for example, the financial incentives could have led to
relatively higher retention of highly effective teachers) rather than responses to the incentives for teachers who
remain in DCPS, this has uncertain implications for our research design.
17 The average IMPACT score of the core group of DCPS teachers ranges from 314 to 328 IMPACT points over the
first four years of IMPACT.

17
E. Trends in Effectiveness of Novice Teachers Relative to Veteran
Teachers
Previous research has demonstrated that teacher effectiveness tends to improve during a
teacher’s first few years of teaching and then remain roughly constant afterwards (Rockoff
2004; Hanushek et al. 2005; Harris and Sass 2010). In DCPS, more-experienced teachers
received higher IMPACT scores on average than less-experienced teachers in the 2010–2011
and 2011–2012 school years (EdCORE 2013a, 2013b). In the previous section, we found that the
IMPACT scores of teachers in their first year in DCPS were about 30 points lower on average
than a group of core DCPS teachers with more experience. Novice teachers may be less
effective than veteran teachers, but they could become more effective over time. Nevertheless,
a simple comparison of IMPACT scores for new teachers in one school year to more
experienced teachers in another school year could be misleading, because there is no
guarantee that the scores are comparable year to year.
This section investigates how the effectiveness of novice teachers changed with teaching
experience since the introduction of IMPACT in DCPS. To identify the growth in effectiveness
attributable to increased experience for novice teachers, we describe the change in
effectiveness of novice teachers as they gain experience relative to the typical change in
effectiveness of veteran DCPS teachers with experience. We calculate teacher experience in
DCPS by linking teachers across consecutive years in the data. For example, first-year teachers
are those who did not teach during the previous school year, and second-year teachers are
those who taught during the previous school year but not during the school year two years
previous.18
The group of veteran teachers used for comparison with each novice teacher cohort
consists of more-experienced DCPS teachers in the same school year. In all school years, we
include only teachers who remained in DCPS through 2012–2013 for the calculation of the gap,
in order to produce samples of novice and veteran teachers that are consistent over time. For
example, we compare novice teachers in their first year to veteran teachers in their second or
higher year. Then we compare the same second-year novice teachers to the same veteran
teachers in their third or higher year, and so on.19 Thus, the changes in the gaps reflect
improvements in the effectiveness of the novice teachers with gained experience relative to the
same group of veteran teachers, rather than differences in which teachers DCPS retains.
18 Our approach to calculating teacher experience reflects the best data available to us; we recognize, however,
that any teachers on leave for one or more school years were misclassified as new or second-year teachers.
19 Our definition of veteran teachers results in using a different group of veteran teachers for each cohort of
novice teachers. To test the sensitivity of our results to our definition of veteran teachers, we repeated our
analyses using an alternative definition that compared all cohorts of novice teachers to the same veteran teachers.
We achieved this by using the same core group of 1,342 veteran teachers who remained in DCPS from the 2008–
2009 through the 2012–2013 school years that we used in the analysis from the previous section. The results from
this alternative analysis did not substantively affect our main findings.

18
To describe changes in the relative effectiveness of novice teachers as they gain additional
years of experience, we first calculate the gaps in IMPACT scores between the veteran and
novice teachers for each novice teacher cohort’s first year in DCPS and for all subsequent
school years through 2012–2013.20 We then calculate the changes over time in this initial
effectiveness gap between veteran and novice teachers for each novice teacher cohort.
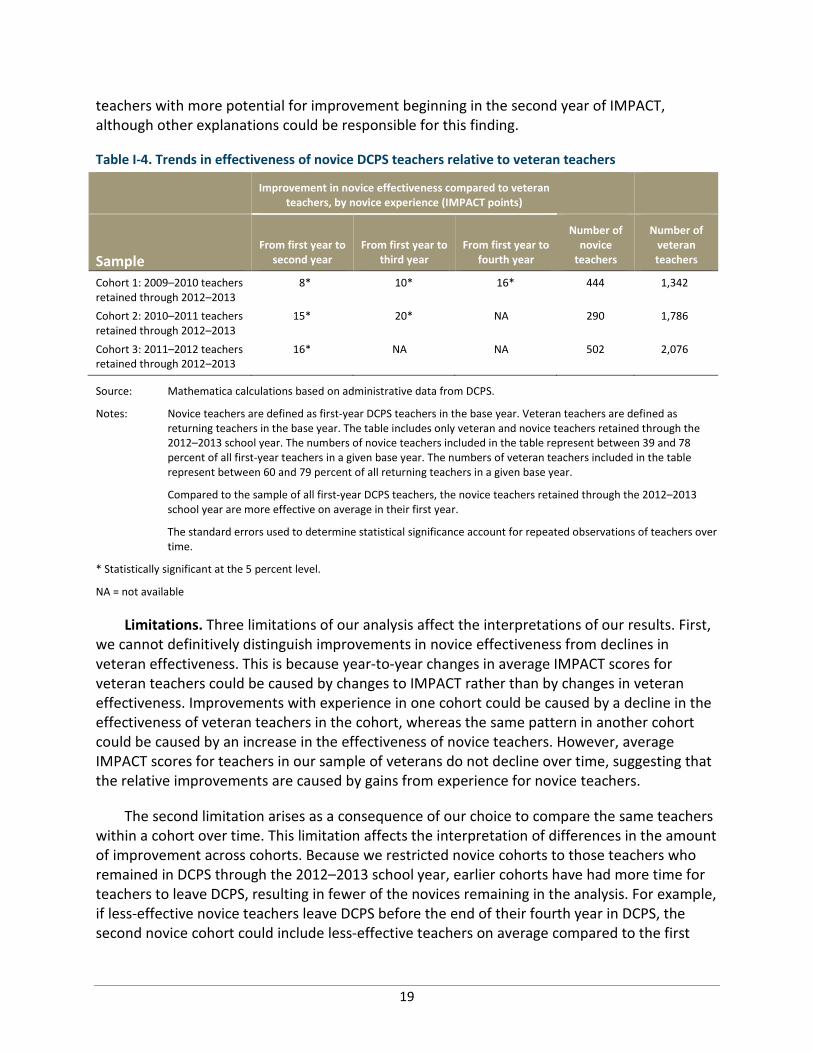
Although novice teachers in DCPS were less effective relative to veteran teachers in their
first year, this gap decreased significantly with an additional year of teaching experience.
Compared to veteran teachers, the cohort of novice teachers who were in their first year during
the 2009–2010 school year (cohort 1) improved by 8 IMPACT points between the end of their
first and second years in DCPS (row 1, column 1 of Table I-4). Novice teachers entering DCPS in
the 2010–2011 school year (cohort 2) improved by 15 IMPACT points between the end of their
first and second years compared to veteran teachers; the analogous change for novice teachers
entering in the 2011–2012 school year (cohort 3) was 16 points (rows 2 and 3, column 1).
Novice teachers continued to improve relative to veteran teachers during their third and
fourth year in DCPS. Compared to veteran teachers, the first cohort of novice teachers
improved by an additional 2 IMPACT points between the end of the novices’ second year and
the end of their third year, resulting in a total of 10 points by the end of their third year (row 1,
column 2 of Table I-4). The same cohort improved by an additional 6 points by the end of their
fourth year in DCPS, for a total of 16 points over the three years in DCPS following their first
year (row 1, column 3 of Table I-4). Similarly, the second novice cohort improved by a total of
20 points compared to veterans between the end of their first year in DCPS and the end of their
third year (row 2, column 2). Although the annual improvements in novice effectiveness
compared to veterans were smaller after the novices’ second year in DCPS, the novices did
continue to improve. These improvements reflect changes in the effectiveness of the same
teachers, rather than changes in the teachers who remained in DCPS, because the identity of
the novices and veterans in the comparison for a cohort do not change over time.
Teachers hired in the second and third years of IMPACT may have improved more
quickly relative to veteran teachers than teachers hired in the first year of IMPACT. The
results in the first column of Table I-4 suggest that the second and third cohorts of novice
teachers improved almost twice as much as the first cohort between the end of their first and
second year in DCPS. This difference persists through the end of the third year in DCPS for the
first and second novice cohorts. We obtain this result despite evidence in the previous sections
that the new hires in their first year were similarly effective compared to core DCPS teachers. If
the recent cohorts have improved more quickly, these results could suggest that more recent
policies under IMPACT have aided the development of new teachers, or that DCPS hired
20 As in the previous section, we also conducted analysis based on IMPACT scores that were standardized to have
the same mean and standard deviation in each year to address concerns that changes in the amount of dispersion
in IMPACT scores over time could affect the results of our analysis using the raw IMPACT scores. The results from
this alternative analysis did not substantively affect our main findings.
19
teachers with more potential for improvement beginning in the second year of IMPACT,
although other explanations could be responsible for this finding.
Table I-4. Trends in effectiveness of novice DCPS teachers relative to veteran teachers
Improvement in novice effectiveness compared to veteran
teachers, by novice experience (IMPACT points)
Sample
From first year to
second year
From first year to
third year
From first year to
fourth year
Number of
novice
teachers
Number of
veteran
teachers
Cohort 1: 2009–2010 teachers
retained through 2012–2013
8* 10* 16* 444 1,342
Cohort 2: 2010–2011 teachers
retained through 2012–2013
15* 20* NA 290 1,786
Cohort 3: 2011–2012 teachers
retained through 2012–2013 16* NA NA 502 2,076
Source: Mathematica calculations based on administrative data from DCPS.
Notes: Novice teachers are defined as first-year DCPS teachers in the base year. Veteran teachers are defined as
returning teachers in the base year. The table includes only veteran and novice teachers retained through the
2012–2013 school year. The numbers of novice teachers included in the table represent between 39 and 78
percent of all first-year teachers in a given base year. The numbers of veteran teachers included in the table
represent between 60 and 79 percent of all returning teachers in a given base year.
Compared to the sample of all first-year DCPS teachers, the novice teachers retained through the 2012–2013
school year are more effective on average in their first year.
The standard errors used to determine statistical significance account for repeated observations of teachers over
time.
* Statistically significant at the 5 percent level.
NA = not available
Limitations. Three limitations of our analysis affect the interpretations of our results. First,
we cannot definitively distinguish improvements in novice effectiveness from declines in
veteran effectiveness. This is because year-to-year changes in average IMPACT scores for
veteran teachers could be caused by changes to IMPACT rather than by changes in veteran
effectiveness. Improvements with experience in one cohort could be caused by a decline in the
effectiveness of veteran teachers in the cohort, whereas the same pattern in another cohort
could be caused by an increase in the effectiveness of novice teachers. However, average
IMPACT scores for teachers in our sample of veterans do not decline over time, suggesting that
the relative improvements are caused by gains from experience for novice teachers.
The second limitation arises as a consequence of our choice to compare the same teachers
within a cohort over time. This limitation affects the interpretation of differences in the amount
of improvement across cohorts. Because we restricted novice cohorts to those teachers who
remained in DCPS through the 2012–2013 school year, earlier cohorts have had more time for
teachers to leave DCPS, resulting in fewer of the novices remaining in the analysis. For example,
if less-effective novice teachers leave DCPS before the end of their fourth year in DCPS, the
second novice cohort could include less-effective teachers on average compared to the first

20
novice cohort. Thus, the effectiveness one cohort of novice teachers may not be comparable to
the effectiveness of the novices in the other two cohorts. This selection of teachers out of the
analysis sample based on their tenure in DCPS could also lead to differences in the amount of
improvement for novices relative to veterans.
To address this concern, we examined novice cohorts defined a different way, by requiring
that novices in all three cohorts remain in DCPS for a minimum of one year after their first
year.21 Defining novice cohorts in this way means that teachers we include in all three cohorts
had the same amount of time to leave DCPS. Appendix Table A.2 reports both the gaps in
effectiveness between novices and veterans and improvements over the first two years for
these groups of teachers. The improvements for these novice teachers support the finding that
the first cohort may have improved more slowly than the second and third cohorts. The first
cohort defined this way improved by 5 IMPACT points compared to veterans between the end
of their first and second years in DCPS (row 1, column 3 of Appendix Table A.2). The same
improvements for the second and third novice cohorts defined this way were more than three
times larger (rows 2 and 3, column 3).
Finally, our findings are also limited by the available data. We have IMPACT scores over
four years for the first cohort of novice teachers, but over only two years for the third cohort.
As additional years of data become available in the future, revisiting the changes in the novice-
veteran gaps will provide important information about whether these improvements continue
for the first three novice cohorts since IMPACT was implemented and whether improvements
for subsequent cohorts are similar.
21 It is not possible to require that teachers in all three cohorts remain in DCPS for additional years after the base
year because we only have two years of IMPACT scores for teachers in cohort 3.
21
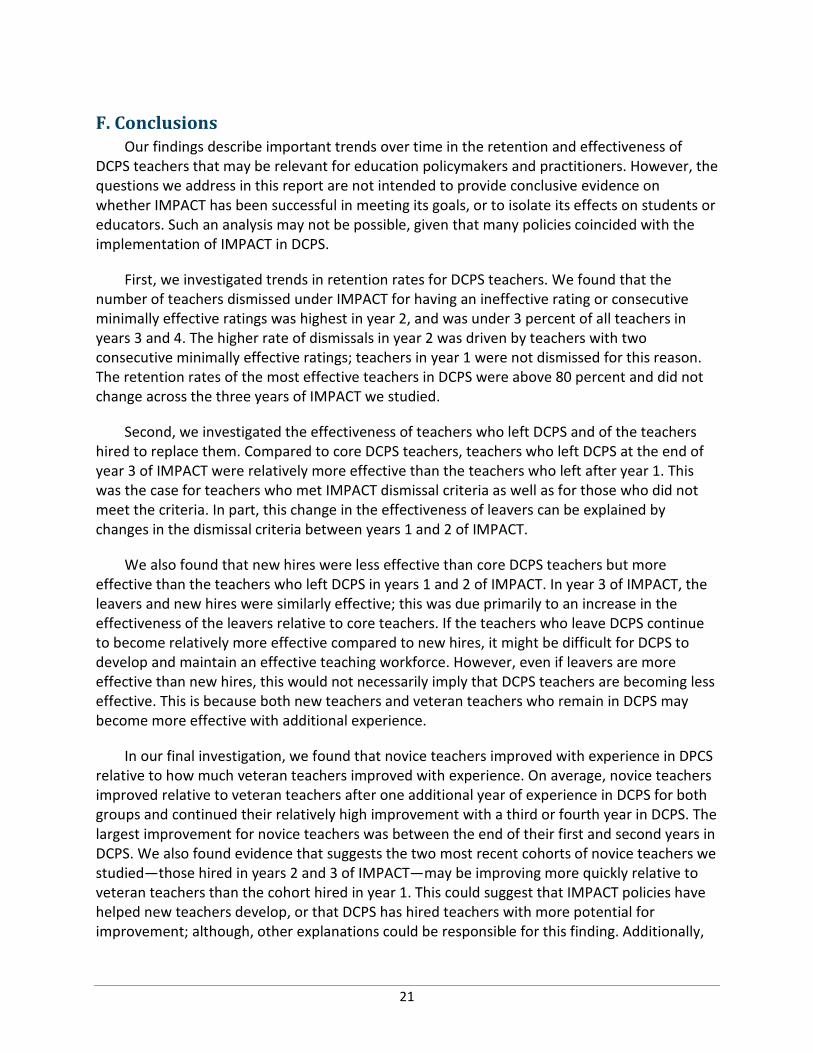
F. Conclusions
Our findings describe important trends over time in the retention and effectiveness of
DCPS teachers that may be relevant for education policymakers and practitioners. However, the
questions we address in this report are not intended to provide conclusive evidence on
whether IMPACT has been successful in meeting its goals, or to isolate its effects on students or
educators. Such an analysis may not be possible, given that many policies coincided with the
implementation of IMPACT in DCPS.
First, we investigated trends in retention rates for DCPS teachers. We found that the
number of teachers dismissed under IMPACT for having an ineffective rating or consecutive
minimally effective ratings was highest in year 2, and was under 3 percent of all teachers in
years 3 and 4. The higher rate of dismissals in year 2 was driven by teachers with two
consecutive minimally effective ratings; teachers in year 1 were not dismissed for this reason.
The retention rates of the most effective teachers in DCPS were above 80 percent and did not
change across the three years of IMPACT we studied.
Second, we investigated the effectiveness of teachers who left DCPS and of the teachers
hired to replace them. Compared to core DCPS teachers, teachers who left DCPS at the end of
year 3 of IMPACT were relatively more effective than the teachers who left after year 1. This
was the case for teachers who met IMPACT dismissal criteria as well as for those who did not
meet the criteria. In part, this change in the effectiveness of leavers can be explained by
changes in the dismissal criteria between years 1 and 2 of IMPACT.
We also found that new hires were less effective than core DCPS teachers but more
effective than the teachers who left DCPS in years 1 and 2 of IMPACT. In year 3 of IMPACT, the
leavers and new hires were similarly effective; this was due primarily to an increase in the
effectiveness of the leavers relative to core teachers. If the teachers who leave DCPS continue
to become relatively more effective compared to new hires, it might be difficult for DCPS to
develop and maintain an effective teaching workforce. However, even if leavers are more
effective than new hires, this would not necessarily imply that DCPS teachers are becoming less
effective. This is because both new teachers and veteran teachers who remain in DCPS may
become more effective with additional experience.
In our final investigation, we found that novice teachers improved with experience in DPCS
relative to how much veteran teachers improved with experience. On average, novice teachers
improved relative to veteran teachers after one additional year of experience in DCPS for both
groups and continued their relatively high improvement with a third or fourth year in DCPS. The
largest improvement for novice teachers was between the end of their first and second years in
DCPS. We also found evidence that suggests the two most recent cohorts of novice teachers we
studied—those hired in years 2 and 3 of IMPACT—may be improving more quickly relative to
veteran teachers than the cohort hired in year 1. This could suggest that IMPACT policies have
helped new teachers develop, or that DCPS has hired teachers with more potential for
improvement; although, other explanations could be responsible for this finding. Additionally,

22
we can only measure teacher effectiveness over three years for new teachers hired in year 2,
and over just two years for those hired in year 3, so it remains to be seen whether the higher
levels of effectiveness can be sustained and if the novice cohorts continue to improve.
Based on our analysis, we cannot say whether teachers in DCPS are more or less effective
on average four years after IMPACT. This is primarily because we cannot measure changes in
the effectiveness of core DCPS teachers—those who were teaching in DCPS prior to IMPACT
and continued to teach through the 2012–2013 school year. We do find evidence that DCPS has
retained many of its most effective teachers and has hired new teachers that are at least
similarly effective to the teachers they replaced. These new teachers have improved over time
with additional experience more than veteran teachers improved with experience. However,
teachers who leave DCPS have become more effective over time relative to the comparison
group used in this analysis. Perhaps offsetting the increased effectiveness of leavers, the most
recent cohorts of teachers hired to replace teachers who leave appear to have improved more
quickly with experience. Given this evidence of the evolving trends in the effectiveness of DCPS
teachers since IMPACT, it will be important to continue to monitor these trends as DCPS
continues to implement IMPACT.

23
PART II: TRENDS IN DCPS TEACHER EFFECTIVENESS BY LOCATION AND
SOCIOECONOMIC STATUS
A. Introduction
The District of Columbia has a long and difficult history of racial, economic, and geographical
disparity (National Research Council, 2011). Efforts to evaluate education reforms, such as PERAA,
must therefore be attentive not only to overall trends but to how those trends might differ by
location and characteristics of schools and the students who attend them.
As noted above, one of the major changes in human resources/human capital policy in DCPS
after the enactment of PERAA was the creation of the IMPACT system for evaluating teacher
performance. This part of the report analyzes trends in IMPACT scores between school year 2009-
2010 (the first year IMPACT was used) and school year 2012-13, by examining the following three
questions:
1. Did the average DCPS teacher IMPACT scores differ by ward and if so, how have those
differences changed over time?
2. For schools across the District with different concentrations of relatively poor students—
referred to as high-, medium-, and low-socioeconomic status (SES) schools—did they have
different average IMPACT scores and if so, how have those differences changed over time?
3. What variation in IMPACT scores existed within each ward at their high-, medium-, and low-
SES schools?
As was done in Part I of this report, we examined IMPACT scores because that is how DCPS
measures teacher effectiveness. We then looked for patterns in these scores. We were interested
in the disparities among neighborhoods across the city, and sought to detect differences in mean
IMPACT scores by ward over the time period of this study. Additionally, we were interested in the
relationship between teacher effectiveness and school poverty level. Our analysis is intended to
address the issues of whether differences in teacher effectiveness have widened or narrowed
since IMPACT was introduced, and whether trends vary among wards and school SES. As noted
earlier, this analysis is descriptive only and does not provide a basis for attributing the trends
described below to the passage and implementation of PERAA.
Our analysis was based on 13,488 teacher IMPACT scores across all eight wards over four
years, merged with an annual measure of school SES, described later in this part. Table II-1 shows
the number of IMPACT scores by ward that were examined for each of the four school years
analyzed and in total. These numbers were fairly consistent across the four years.
24
Table II-1. Number of teacher IMPACT scores examined by ward
Ward 2009-10 2010-11 2011-12 2012-13
1 417 425 419 394
2 221 216 203 203
3 397 403 426 438
4 502 501 491 497
5 481 464 421 398
6 401 387 409 437
7 452 449 410 410
8 572 557 558 529
Total 3443 3402 3337 3306
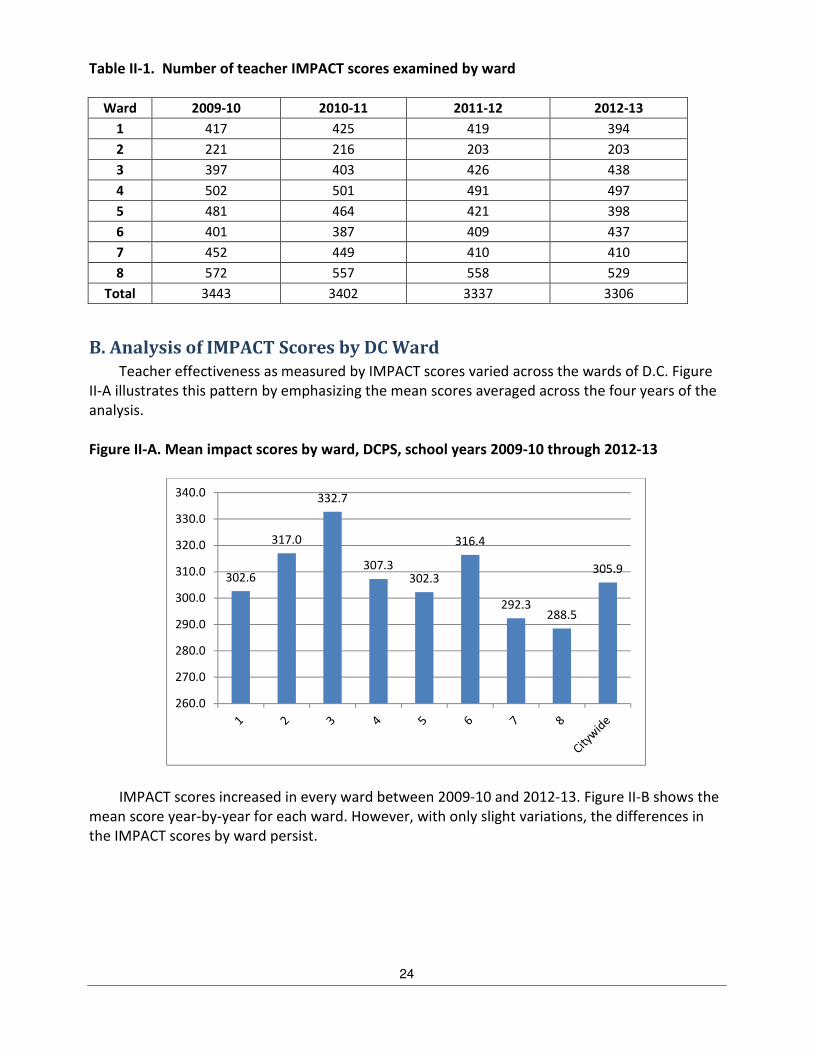
B. Analysis of IMPACT Scores by DC Ward
Teacher effectiveness as measured by IMPACT scores varied across the wards of D.C. Figure
II-A illustrates this pattern by emphasizing the mean scores averaged across the four years of the
analysis.
Figure II-A. Mean impact scores by ward, DCPS, school years 2009-10 through 2012-13
IMPACT scores increased in every ward between 2009-10 and 2012-13. Figure II-B shows the
mean score year-by-year for each ward. However, with only slight variations, the differences in
the IMPACT scores by ward persist.
302.6
317.0
332.7
307.3302.3
316.4
292.3288.5
305.9
260.0
270.0
280.0
290.0
300.0
310.0
320.0
330.0
340.0

25
Figure II-B. Trends in IMPACT scores across DC wards, 2009-10 through 2012-13
C. Analysis of IMPACT Scores by SES
Considerable research has demonstrated that students in schools with concentrations of
students from low-income families are more likely than their more advantaged peers to be taught
by teachers with fewer years of experience and lesser qualifications. (For further reading on the
general topic of teacher effectiveness measures and socioeconomic status, see, e.g., Boyd,
Lankford, Loeb, & Wyckoff 2005; Clotfelter, Ladd, & Vigdor, 2005; Feng, 2009; Hanushek, Kain, &
Rivkin 2004; Imazeki, 2005; Lankford, Loeb, & Wyckoff, 2002; Sass, Hannaway, Xu, Figlio, and
Feng (2010); Scafidi, Sjoquist, & Stinebrickner, 2007.) In this section we present data on the
observed correlation between IMPACT scores and a commonly used indicator of the
socioeconomic status of students in schools.
As a proxy for SES, we used the percentage of students in each school eligible for free and
reduced-price lunch (FRPL). Although imperfect (Cowan et al., 2012), FRPL is used in many
studies, e.g., the National Assessment of Educational Progress (NAEP) (U.S. Department of
Education, 2011).
To facilitate comparisons across wards and over time, we divided the schools of the DCPS
into three categories of SES, shown in Table II-2. Each category was constructed to include an
approximately similar number of schools, or roughly one-third of the district’s schools. Setting the

26
lower threshold at 75% poverty and the upper one at 85% makes it possible to better distinguish
the three categories by ward. Still, it should be noted that a large majority of DCPS are low-SES
compared with schools across the nation. For example, the 2011 NAEP data for grade 4 indicate
that only 28% of the nation’s schools, and 61% of the large city schools in the nation, enroll 76%
or more students who qualify for FRPL; but 68% of the DCPS fall into this category (U.S.
Department of Education, 2011).
Table II-2. Categories of schools by SES
Category SES Percentage of FRPL students Number of schools
1 High SES Less than 75% 35
2 Medium SES 75-85% 42
3 Low SES Greater than 85% 40
Total 117
Teacher IMPACT scores and low SES are moderately and negatively correlated (r = -.323); as
the percentage of low-income students increases, the associated teacher IMPACT score
decreases. As Figure II-C makes clear, IMPACT scores rose over time for all three SES categories
of schools. However, scores for schools in the low and medium SES categories were often 24 to
30 points lower than those in the highest SES category, and similar to the data above of IMPACT
scores by ward, these gaps did not close over time. These data suggest that the lower the
concentration of low-SES students, the higher the mean teacher IMPACT scores tend to be.
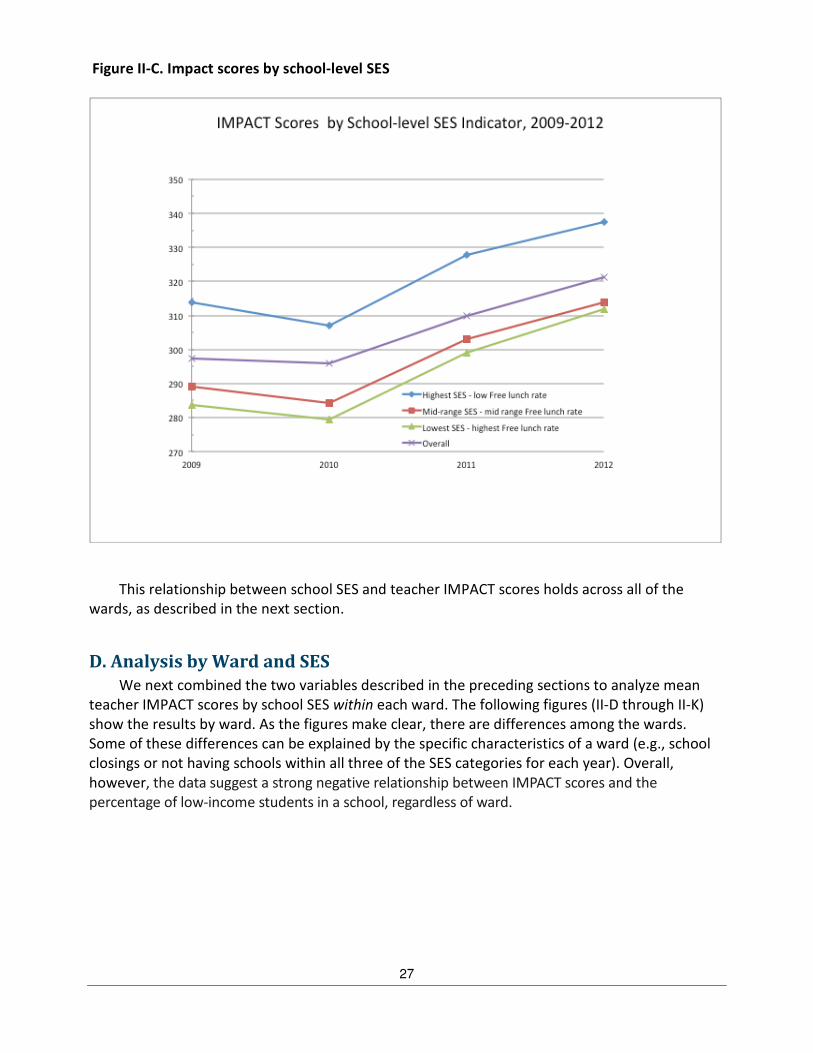
27
Figure II-C. Impact scores by school-level SES
This relationship between school SES and teacher IMPACT scores holds across all of the
wards, as described in the next section.
D. Analysis by Ward and SES
We next combined the two variables described in the preceding sections to analyze mean
teacher IMPACT scores by school SES within each ward. The following figures (II-D through II-K)
show the results by ward. As the figures make clear, there are differences among the wards.
Some of these differences can be explained by the specific characteristics of a ward (e.g., school
closings or not having schools within all three of the SES categories for each year). Overall,
however, the data suggest a strong negative relationship between IMPACT scores and the
percentage of low-income students in a school, regardless of ward.

28

29
270
280
290
300
310
320
330
340
350
2010 2011 2012 2013
FRPL=1
Figure II-F — Ward 3

30

31
32
E. Conclusions
Our findings describe trends over time in the average school-level IMPACT scores by ward, by
SES, and by SES within each ward. As noted above, while these data may be informative for
education policymakers and practitioners, they do not provide conclusive evidence on whether
IMPACT has been successful in meeting its goals.
First, we examined the average DCPS teacher IMPACT score by ward over time. Teacher IMPACT
scores increased in all wards over the years analyzed. However, the differences in the IMPACT
scores by ward persisted throughout the years covered in this study.
Second, we examined schools across DCPS with different concentrations of students in poverty,
as measured by FRPL. There was a negative relationship between teacher IMPACT scores and the
percentage of students who qualify for free and reduced-price lunch. In other words, during the
period studied, as school poverty increased, average IMPACT scores decreased. This is a
correlational finding, not a causal one. In most of the years analyzed, IMPACT scores in schools with
low and medium SES years have consistently been 24 to 30 points lower than those for teachers in
schools with the highest SES, demonstrating that over time, the disparities were not decreasing.
Finally, we examined the differences among schools by SES within each ward. Here, while each
ward has its own unique story to tell, the data continue to demonstrate a negative relationship
between IMPACT scores and the percentage of low-income students in a school.

33
REFERENCES
Boyd, Donald J., Hamilton Lankford, Susanna Loeb, and James H. Wyckoff. “The Draw of Home:
How Teachers’ Preferences for Proximity Disadvantage Urban Schools.” Journal of Policy
Analysis and Management 24(1):113–32, 2005.
Clotfelter, Charles T., Helen F. Ladd, and Jacob L. Vigdor. “Who Teaches Whom? Race and the
Distribution of Novice Teachers.” Economics of Education Review 24(4):377–92, 2005.
Cowan, Charles. D. et al. (2012). Improving the Measurement of Socioeconomic Status for the
National Assessment of Educational Progress. National Assessment Governing Board.
http://nces.ed.gov/nationsreportcard/pdf/researchcenter/Socioeconomic_Factors.pdf
Dee, Thomas and James Wyckoff. “Incentives, Selection, and Teacher Performance: Evidence
from IMPACT.” Working paper # 19529. Cambridge, MA: National Bureau of Economic
Research, 2013.
Education Consortium for Research and Evaluation. Evaluation of the DC Public Education Reform
Amendment Act: Report No. 1, School Year 2010–2011. July 2013a.
Education Consortium for Research and Evaluation. Evaluation of the DC Public Education Reform
Amendment Act: Report No. 2, School Year 2011–2012. September 2013b.
Feng, Li. “Opportunity Wages, Classroom Characteristics, and Teacher Mobility." Southern
Economic Journal 75(4):1165–90, 2009.
Hanushek, Eric A., John F. Kain, and Steven G. Rivkin. “Why Public Schools Lose Teachers.” Journal
of Human Resources, 39(2): 326–54, 2004.
Hanushek, Eric A., John F. Kain, Daniel M. O’Brien, and Steven G. Rivkin. “The Market for Teacher
Quality.” Working paper # 11154. Cambridge, MA: National Bureau of Economic Research,
2005.
Harris, Doug N., and Tim R. Sass. “What Makes for a Good Teacher and Who Can Tell?”
Unpublished manuscript, 2010.
Imazeki, Jennifer. “Teacher Salaries and Teacher Attrition.” Economics of Education Review
24(4):431– 49, 2005.
Isenberg, Eric, and Heinrich Hock. Measuring School and Teacher Value Added in DC, 2011–2012
School Year. Washington, DC: Mathematica Policy Research, August 2012.
Lankford, Hamilton, Susanna Loeb, and James H. Wyckoff. “Teacher Sorting and the Plight of
Urban Schools: A Descriptive Analysis.” Educational Evaluation and Policy Analysis
24(1):37–62, 2002.
National Research Council. A Plan for Evaluating the District of Columbia's Public Schools: From
Impressions to Evidence. Washington, DC: National Academies Press, 2011.

34
Rockoff, Jonah E. “The Impact of Individual Teachers on Student Achievement: Evidence from
Panel Data.” American Economic Review, vol. 94, no. 2, 2004, pp. 247–252.
Scafidi, Benjamin, David L. Sjoquist, and Todd R. Stinebrickner. “Race, Poverty, and Teacher
Mobility.” Economics of Education Review 26(2):145–59, 2007.
U.S. Department of Education, National Assessment of Educational Progress. (2011). The Nation’s
Report Card: Reading 2011. (Washington, DC: NAEP).

35
Appendix: Supplemental Information
Table A.1. Retention rates of teachers in DCPS, by school year
2008–2009
(pre-IMPACT)
2009–2010
(IMPACT year 1)
2010–2011
(IMPACT year 2)
2011–2012
(IMPACT year 3)
IMPACT Rating
Percent
retained
Number of
teachers
Percent
retained
Number
of
teachers
Percent
retained
Number
of
teachers
Percent
retained
Number
of
teachers
Groups 1 Through 8 (all
teachers)
Highly effective (350 to
400 points)
89 536 89 480 89 725
Effective (250 to 349
points)
84 2,327 84 2,331 82 2,235
Minimally effective (175
to 249 points)
70 453 46 448 55 276
Ineffective (100 to 174
points)
0 62 0 56 0 34
All IMPACT ratings 71 3,142 82 3,378 78 3,315 81 3,270
Group 1 (teachers with
IVA scores)
Highly effective (350 to
400 points)
97 37 76 17 91 82
Effective (250 to 349
points)
87 289 83 301 79 251
Minimally effective (175
to 249 points)
76 123 50 127 69 96
Ineffective (100 to 174
points)
0 10 0 12 0 15
All IMPACT ratings n.a... n.a... 83 459 72 457 76 444
Groups 2 Through 8
(teachers without IVA
scores)
Highly effective (350 to
400 points)
88 499 89 463 88 643
Effective (250 to 349
points)
84 2,038 84 2,030 83 1,984
Minimally effective (175
to 249 points)
68 330 45 321 48 180
Ineffective (100 to 174
points)
0 52 0 44 0 19
All IMPACT ratings n.a.. n.a.. 81 2,919 79 2,858 81 2,836
Source: Mathematica calculations based on administrative data from DCPS.
Notes: The table excludes all records for 281 teachers with incomplete IMPACT ratings in one or more years. Overall
retention rates that instead include these teachers are similar to those reported in the table. Otherwise, the table
includes all group 1 through 8 teachers in each specified school year. IMPACT ratings are from the specified school
year.
Teachers are considered to have exited DCPS if they do not have an IMPACT rating in the subsequent school year.
n.a... = not applicable
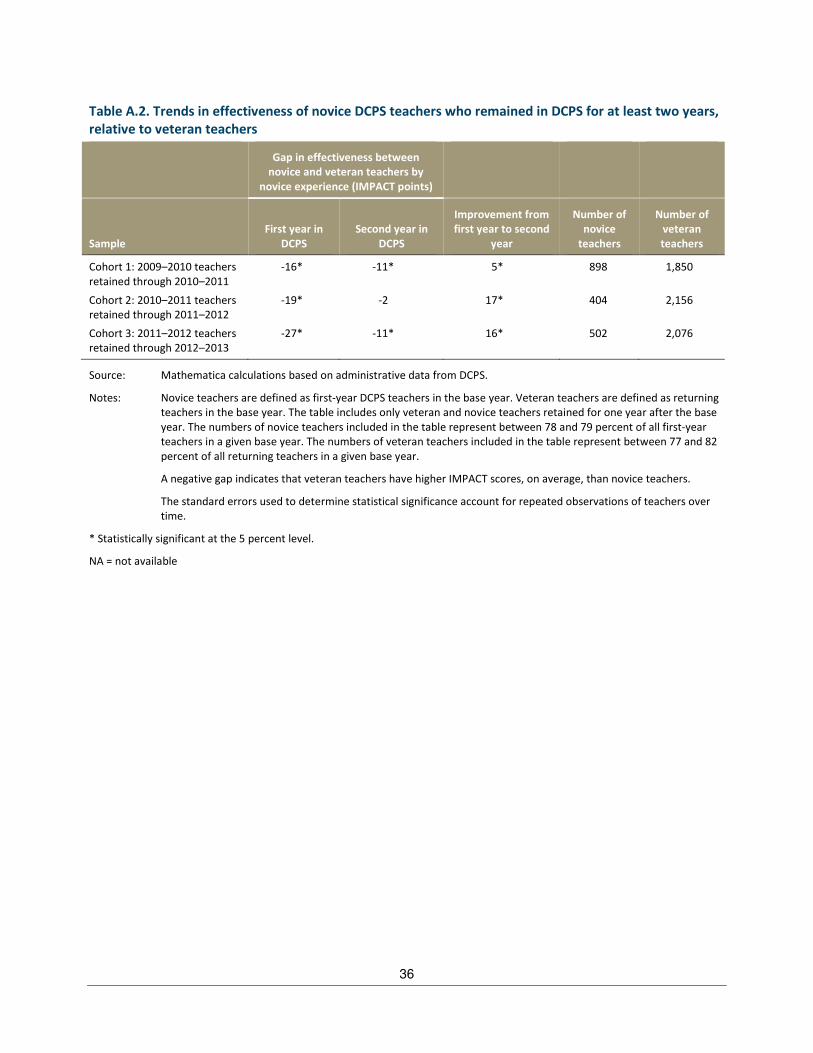
36
Table A.2. Trends in effectiveness of novice DCPS teachers who remained in DCPS for at least two years,
relative to veteran teachers
Gap in effectiveness between
novice and veteran teachers by
novice experience (IMPACT points)
Sample
First year in
DCPS
Second year in
DCPS
Improvement from
first year to second
year
Number of
novice
teachers
Number of
veteran
teachers
Cohort 1: 2009–2010 teachers
retained through 2010–2011 -16* -11* 5* 898 1,850
Cohort 2: 2010–2011 teachers
retained through 2011–2012 -19* -2 17* 404 2,156
Cohort 3: 2011–2012 teachers
retained through 2012–2013 -27* -11* 16* 502 2,076
Source: Mathematica calculations based on administrative data from DCPS.
Notes: Novice teachers are defined as first-year DCPS teachers in the base year. Veteran teachers are defined as returning
teachers in the base year. The table includes only veteran and novice teachers retained for one year after the base
year. The numbers of novice teachers included in the table represent between 78 and 79 percent of all first-year
teachers in a given base year. The numbers of veteran teachers included in the table represent between 77 and 82
percent of all returning teachers in a given base year.
A negative gap indicates that veteran teachers have higher IMPACT scores, on average, than novice teachers.
The standard errors used to determine statistical significance account for repeated observations of teachers over
time.
* Statistically significant at the 5 percent level.
NA = not available