DBS Bank Ltd., India · DBS Bank Ltd., India Basel III: Pillar 3 Disclosures as at 31 March 2015...
25
DBS Bank Ltd., India Basel III: Pillar 3 Disclosures as at 31 March 2015 (Currency: Indian rupees in million) 1. Scope of application Qualitative Disclosures DBS Bank Ltd., India (‘the Bank’) operates in India as a branch of DBS Bank Ltd., Singapore a banking entity incorporated in Singapore with limited liability. As at 31 March 2015, the Bank has a presence of 12 branches across 12 cities. The Bank does not have any subsidiaries in India nor any interest in Insurance Entities. Thus, the disclosures contained herein only pertain to the Bank. a. List of group entities considered for consolidation Name of the entity / Country of incorpo- ration Whether the entity is included under accounting scope of consolidation (yes / no) Explain the method of consolidation Whether the entity is included under regulatory scope of consolidation15 (yes / no) Explain the method of consolidation Explain the reasons for difference in the method of consolidation Not Applicable b. List of group entities not considered for consolidation both under the accounting and regulatory scope of consolidation Name of the entity / country of incorporation Principle activity of the entity Total balance sheet equity (as stated in the accounting balance sheet of the legal entity) % of bank’s holding in the total equity Regulatory treatment of bank’s investments in the capital instruments of the entity Total balance sheet assets (as stated in the accounting balance sheet of the legal entity) Not Applicable c. List of group entities considered for consolidation Name of the entity / country of incorporation (as indicated in (i)a. above) Principle activity of the entity Total balance sheet equity (as stated in the accounting balance sheet of the legal entity) Total balance sheet assets (as stated in the accounting balance sheet of the legal entity) Not Applicable
Transcript of DBS Bank Ltd., India · DBS Bank Ltd., India Basel III: Pillar 3 Disclosures as at 31 March 2015...

DBS Bank Ltd., India
Basel III: Pillar 3 Disclosures as at 31 March 2015
(Currency: Indian rupees in million)
1. Scope of application
Qualitative Disclosures
DBS Bank Ltd., India (‘the Bank’) operates in India as a branch of DBS Bank Ltd.,
Singapore a banking entity incorporated in Singapore with limited liability. As at
31 March 2015, the Bank has a presence of 12 branches across 12 cities. The Bank does
not have any subsidiaries in India nor any interest in Insurance Entities. Thus, the
disclosures contained herein only pertain to the Bank.
a. List of group entities considered for consolidation
Name of
the
entity /
Country
of
incorpo-
ration
Whether the
entity is
included
under
accounting
scope of
consolidation
(yes / no)
Explain the
method of
consolidation
Whether the
entity is
included under
regulatory
scope of
consolidation15
(yes / no)
Explain the
method of
consolidation
Explain the
reasons for
difference in
the method
of
consolidation
Not Applicable
b. List of group entities not considered for consolidation both under the accounting
and regulatory scope of consolidation
Name of the entity /
country of
incorporation
Principle
activity of
the entity
Total balance
sheet equity
(as stated in
the accounting
balance sheet
of the legal
entity)
% of
bank’s
holding
in the
total
equity
Regulatory
treatment of
bank’s
investments
in the capital
instruments
of the entity
Total
balance
sheet assets
(as stated in
the
accounting
balance
sheet of the
legal entity)
Not Applicable
c. List of group entities considered for consolidation
Name of the entity /
country of
incorporation (as
indicated in (i)a.
above)
Principle activity of the entity Total balance
sheet equity (as
stated in the
accounting
balance sheet
of the legal
entity)
Total balance
sheet assets (as
stated in the
accounting
balance sheet of
the legal entity)
Not Applicable

DBS Bank Ltd., India
Basel III: Pillar 3 Disclosures (Continued) as at 31 March 2015
(Currency: Indian rupees in million)
1. Scope of application (Continued)
Quantitative Disclosures (Continued)
d. The aggregate amount of capital deficiencies in all subsidiaries which are not
included in the regulatory scope of consolidation i.e. that are deducted:
Name of the
subsidiaries /
country of
incorporation
Principle activity of the
entity
Total balance sheet equity
(as stated in the accounting
balance sheet of the legal
entity)
% of bank’s
holding in the
total equity
Capital
deficiencies
Not Applicable
e. The aggregate amounts (e.g. current book value) of the bank’s total interests in
insurance entities, which are risk-weighted:
Name of the
insurance
entities /
country of
incorporation
Principle activity of the
entity
Total balance sheet
equity (as stated in
the accounting
balance sheet of the
legal entity)
% of bank’s
holding in the
total equity /
proportion of
voting power
Quantitative impact
on regulatory
capital of using risk
weighting method
versus using the full
deduction method
Not Applicable
f. Any restrictions or impediments on transfer of funds or regulatory capital within the
banking group:
There are no restrictions or impediments on transfer of funds or regulatory capital
within the banking group.
2. Capital Adequacy
Qualitative disclosures
The CRAR of the Bank is 17.01% as computed under Basel III norms, which is higher
than the minimum regulatory CRAR requirement of 9%.
The Bank’s capital management framework is guided by the existing capital position,
proposed growth and strategic direction. Growth opportunities have resulted in an
increasing and continuing need to focus on the effective management of risk, and
commensurate capital to bear that risk. The Bank carefully assesses its growth
opportunities relative to the capital available to support them, particularly in the light of the
economic environment and capital requirements under Basel III. The Bank maintains a
strong discipline over capital allocation and ensuring that returns on investment cover
capital costs.

DBS Bank Ltd., India
Basel III: Pillar 3 Disclosures (Continued) as at 31 March 2015
(Currency: Indian rupees in million)
2. Capital Adequacy (Continued)
Quantitative disclosures
Particulars 31 March 15
A Capital requirements for Credit Risk (Standardised Approach) 19,717
B Capital requirements for Market Risk (Standardised Duration Approach)
- Interest rate risk 3,735
- Foreign exchange risk 360
- Equity risk 6
C Capital requirements for Operational risk (Basic Indicator Approach) 1,630
D CET1 Capital Ratio (%) 10.79%
E Tier1 Capital Ratio (%) 10.79%
F Total Capital Ratio (%) 17.01%
3. General Disclosures
As part of overall corporate governance, the Group Board has approved a comprehensive
Integrated Risk Framework covering risk governance for all risk types and for all entities
within the Group, including India. This framework defines authority levels, oversight
responsibilities, policy structures and risk appetite limits to manage the risks that arise in
connection with the use of financial instruments. On a day-to-day basis, business units
have primary responsibility for managing specific risk exposures while Risk Management
Group (RMG) exercises independent risk oversight on the Group as a whole. RMG is the
central resource for quantifying and managing the portfolio of risks taken by the Group as
a whole.
A) General Disclosures for Credit Risk
Qualitative Disclosures
Credit Risk Management Policy
The credit policies and basic procedures of the Bank relating to its lending activities are
contained in the Local Credit / Loan Policy of the Bank, Core Credit Policy at Singapore
and the Credit Manual. These are based on the general credit principles, directives /
guidelines issued by the RBI from time to time as well as instructions and guidelines of
DBS Bank Ltd, Singapore (hereinafter referred to as ‘the Head Office’). In the unlikely
event of any conflict amongst the RBI guidelines and Head Office Guidelines, the more
conservative policy / guideline is followed.
.
DBS Bank Ltd., India
Basel III: Pillar 3 Disclosures (Continued) as at 31 March 2015
(Currency: Indian rupees in million)
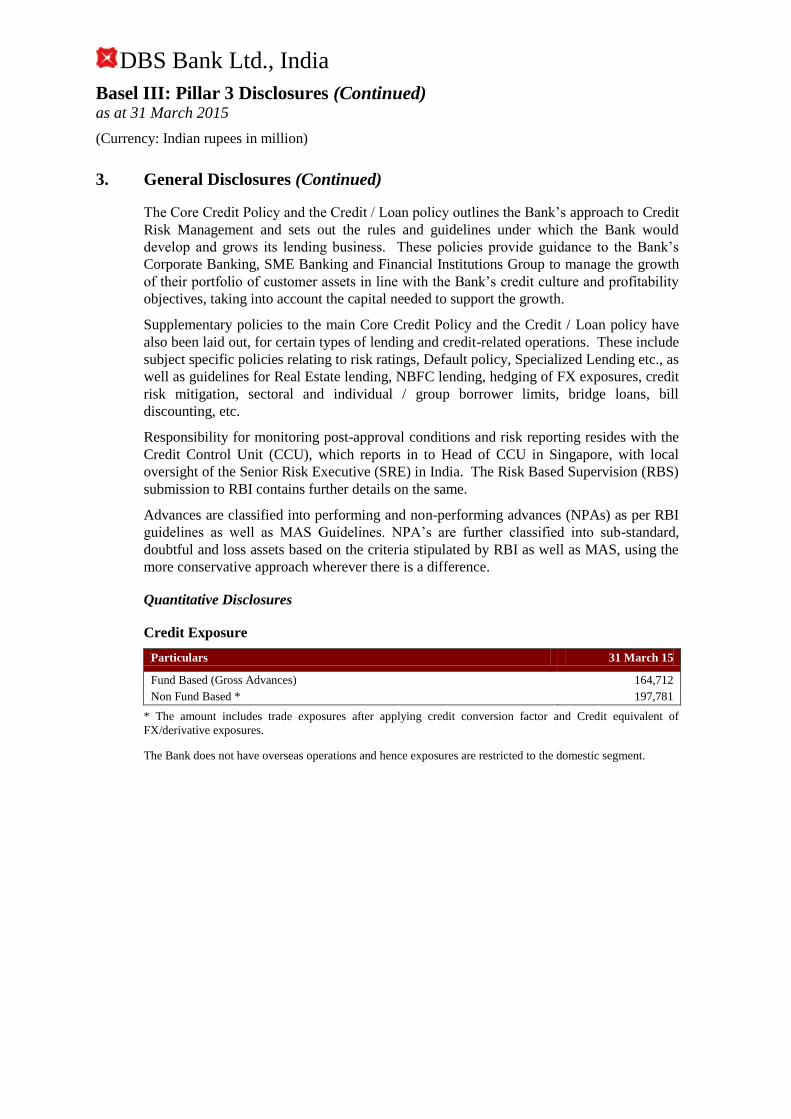
3. General Disclosures (Continued)
The Core Credit Policy and the Credit / Loan policy outlines the Bank’s approach to Credit
Risk Management and sets out the rules and guidelines under which the Bank would
develop and grows its lending business. These policies provide guidance to the Bank’s
Corporate Banking, SME Banking and Financial Institutions Group to manage the growth
of their portfolio of customer assets in line with the Bank’s credit culture and profitability
objectives, taking into account the capital needed to support the growth.
Supplementary policies to the main Core Credit Policy and the Credit / Loan policy have
also been laid out, for certain types of lending and credit-related operations. These include
subject specific policies relating to risk ratings, Default policy, Specialized Lending etc., as
well as guidelines for Real Estate lending, NBFC lending, hedging of FX exposures, credit
risk mitigation, sectoral and individual / group borrower limits, bridge loans, bill
discounting, etc.
Responsibility for monitoring post-approval conditions and risk reporting resides with the
Credit Control Unit (CCU), which reports in to Head of CCU in Singapore, with local
oversight of the Senior Risk Executive (SRE) in India. The Risk Based Supervision (RBS)
submission to RBI contains further details on the same.
Advances are classified into performing and non-performing advances (NPAs) as per RBI
guidelines as well as MAS Guidelines. NPA’s are further classified into sub-standard,
doubtful and loss assets based on the criteria stipulated by RBI as well as MAS, using the
more conservative approach wherever there is a difference.
Quantitative Disclosures
Credit Exposure
Particulars 31 March 15
Fund Based (Gross Advances) 164,712
Non Fund Based * 197,781
* The amount includes trade exposures after applying credit conversion factor and Credit equivalent of
FX/derivative exposures.
The Bank does not have overseas operations and hence exposures are restricted to the domestic segment.
DBS Bank Ltd., India
Basel III: Pillar 3 Disclosures (Continued) as at 31 March 2015
(Currency: Indian rupees in million)
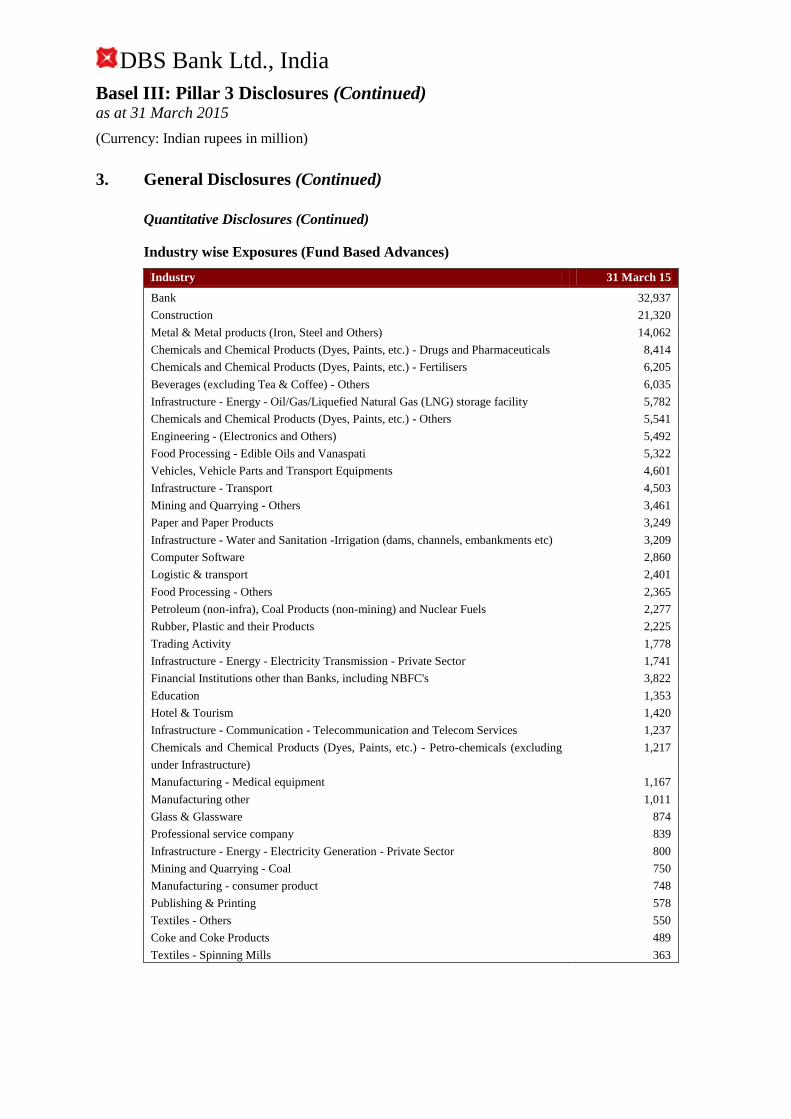
3. General Disclosures (Continued)
Quantitative Disclosures (Continued)
Industry wise Exposures (Fund Based Advances)
Industry 31 March 15
Bank 32,937
Construction 21,320
Metal & Metal products (Iron, Steel and Others) 14,062
Chemicals and Chemical Products (Dyes, Paints, etc.) - Drugs and Pharmaceuticals 8,414
Chemicals and Chemical Products (Dyes, Paints, etc.) - Fertilisers 6,205
Beverages (excluding Tea & Coffee) - Others 6,035
Infrastructure - Energy - Oil/Gas/Liquefied Natural Gas (LNG) storage facility 5,782
Chemicals and Chemical Products (Dyes, Paints, etc.) - Others 5,541
Engineering - (Electronics and Others) 5,492
Food Processing - Edible Oils and Vanaspati 5,322
Vehicles, Vehicle Parts and Transport Equipments 4,601
Infrastructure - Transport 4,503
Mining and Quarrying - Others 3,461
Paper and Paper Products 3,249
Infrastructure - Water and Sanitation -Irrigation (dams, channels, embankments etc) 3,209
Computer Software 2,860
Logistic & transport 2,401
Food Processing - Others 2,365
Petroleum (non-infra), Coal Products (non-mining) and Nuclear Fuels 2,277
Rubber, Plastic and their Products 2,225
Trading Activity 1,778
Infrastructure - Energy - Electricity Transmission - Private Sector 1,741
Financial Institutions other than Banks, including NBFC's 3,822
Education 1,353
Hotel & Tourism 1,420
Infrastructure - Communication - Telecommunication and Telecom Services 1,237
Chemicals and Chemical Products (Dyes, Paints, etc.) - Petro-chemicals (excluding
under Infrastructure)
1,217
Manufacturing - Medical equipment 1,167
Manufacturing other 1,011
Glass & Glassware 874
Professional service company 839
Infrastructure - Energy - Electricity Generation - Private Sector 800
Mining and Quarrying - Coal 750
Manufacturing - consumer product 748
Publishing & Printing 578
Textiles - Others 550
Coke and Coke Products 489
Textiles - Spinning Mills 363

DBS Bank Ltd., India
Basel III: Pillar 3 Disclosures (Continued) as at 31 March 2015
(Currency: Indian rupees in million)
Quantitative Disclosures (Continued)
Industry wise Exposures (Fund Based Advances) (Continued)
Industry 31 March 15
Wood and Wood Products 262
Textiles - Cotton 247
Automobiles 240
Entertainment 206
Retail Others 159
Residuary Other Advances 159
Leather and Leather products 150
Cement and Cement Products 99
Food Processing - Tea 75
Retail 53
Computer Hardware 51
Gems and Jewelery 13
Total Credit Exposure 164,712

DBS Bank Ltd., India
Basel III: Pillar 3 Disclosures (Continued) as at 31 March 2015
(Currency: Indian rupees in million)
3. General Disclosures (Continued)
Quantitative Disclosures (Continued)
Industry wise Exposures (Non - Fund Based)*
Industry 31 March 15
Bank 121,537
Residuary Other Advances 9,221
Infrastructure - Energy - Oil/Gas/Liquefied Natural Gas (LNG) storage facility 6,394
Metal & Metal products (Iron, Steel and Others) 6,255
Infrastructure - Energy - Electricity Generation - Private Sector 5,527
Retail Others 4,793
Chemicals and Chemical Products (Dyes, Paints, etc.) - Fertilisers 4,738
Chemicals and Chemical Products (Dyes, Paints, etc.) - Others 4,219
Petroleum (non-infra), Coal Products (non-mining) and Nuclear Fuels 3,395
Vehicles, Vehicle Parts and Transport Equipments 3,250
Trading Activity 2,848
Engineering - (Electronics and Others) 2,767
Infrastructure - Energy - Gas Pipelines 2,572
Financial Institutions other than Banks, including NBFC's 1,953
Construction 1,865
Infrastructure - Transport 2,329
Cement and Cement Products 1,667
Rubber, Plastic and their Products 1,205
Infrastructure - Communication - Telecommunication and Telecom Services 1,180
Computer Software 1,135
Chemicals and Chemical Products (Dyes, Paints, etc.) - Drugs and Pharmaceuticals 1,069
Hotel & Toursim 982
Publishing & Printing 902
Logistic & transport 830
Food Processing - Edible Oils and Vanaspati 829
Infrastructure - Communication - Telecommunication Towers 784
Paper and Paper Products 742
Other Industries 604
Mining and Quarrying - Others 568
Chemicals and Chemical Products (Dyes, Paints, etc.) - Petro-chemicals (excluding
under Infrastructure) 393
Beverages (excluding Tea & Coffee) - Others 246
Food Processing - Others 215
Textiles - Others 155
Computer Hardware 131
Glass & Glassware 112
Food Processing - Coffee 76
Infrastructure - Energy - Electricity Transmission - Private Sector 68
Food Processing - Tea 57
Mining and Quarrying - Coal 46
Entertainment 39
Manufacturing other 34
Textiles - Spinning Mills 30
Professional service company 9
Wood and Wood Products 9
Tobacco and Tobacco products 1
Total Credit Exposure 197,781
* The amount includes trade exposures after applying credit conversion factor and Credit equivalent
of FX/derivative exposures.

DBS Bank Ltd., India
Basel III: Pillar 3 Disclosures (Continued) as at 31 March 2015
(Currency: Indian rupees in million)
3. General Disclosures (Continued)
Maturity of Assets as at 31 March 2015
Particulars Cash Balance with RBI Balance with Banks Investments Loans & Advances
(net of provisions)
Fixed Assets Other Assets
1 day 48 188 1,224 85,230 15,819 - 1,231
2–7 days - 837 - 4,932 1,915 - 59
8–14 Days - 352 - 2,679 5,150 - 51
15–28 Days - 1,367 - 4,214 15,043 - 121
29 Days–3 Months - 1,079 - 8,596 51,342 - 392
3–6 Months - 547 - 2,632 30,712 - 242
6 Months – 1 Year - 379 - 8,062 7,486 - 246
1–3 Years - 405 - 4,021 9,713 - 411
3–5Years - 16 - 1,706 9,646 - 145
Over 5Years - 2,306 - 13,094 11,623 529 53,571
Total 48 7,476 1,224 135,166 158,449 529 56,469

DBS Bank Ltd., India
Basel III: Pillar 3 Disclosures (Continued) as at 31 March 2015
(Currency: Indian rupees in million)
3. General Disclosures (Continued)
Classification of NPA’s
Particulars 31 March 15
Amount of NPAs (Gross) 12,839
Substandard 2,428
Doubtful 1 8,915
Doubtful 2 1,313
Doubtful 3 -
Loss 183
Movement of NPAs and Provision for NPAs
Particulars 31 March 15
A Amount of NPAs (Gross) 12,839
B Net NPAs 6,576
C NPA Ratios
- Gross NPAs to gross advances (%) 7.79%
- Net NPAs to net advances (%) 4.15%
D Movement of NPAs (Gross)
- Opening balance as of the beginning of the financial year 21,156
- Additions 2,927
- Reductions on account of recoveries/ write - offs 11,244
- Closing balance 12,839
E Movement of Provision for NPAs
- Opening balance as of the beginning of the financial year 5,716
- Provision made during the year 6,542
- Write – offs / Write – back of excess provision 5,995
- Closing balance 6,263
Amount of Non-Performing Investments and Provision for NPIs
Particulars 31 March 15
A Amount of Non-Performing Investments (Gross) 45
B Amount of provisions held for non-performing investments 16
Movement in Provisions Held towards Depreciation on Investments
Particulars 31 March 15
Opening Balance 191
Add: Provisions Made During the Year -
Less: Write off / Write back of Excess provisions during the Year 169
Closing Balance 22

DBS Bank Ltd., India
Basel III: Pillar 3 Disclosures (Continued) as at 31 March 2015
(Currency: Indian rupees in million)
4. Disclosures for Credit Risk: Portfolios subject to Standardised
approach
Qualitative Disclosures
Currently based on our clientele, ratings of the following agencies have been used i.e.
CARE, CRISIL, India Ratings and Research Private Ltd., ICRA, Brickwork, SME Rating
Agency Pvt Ltd (SMERA), Standards & Poors, Moody’s and Fitch for all exposures. The
Bank assigns Long term credit ratings accorded by the chosen credit rating agencies for
assets which have a contractual maturity of more than one year. However, in accordance
with RBI guidelines, the Bank classifies all cash credit exposures as long term exposures
and accordingly the long term ratings accorded by the chosen credit rating agencies are
assigned. Currently the Bank uses issuer ratings. In accordance with RBI guidelines, for
risk-weighting purposes, short-term ratings are deemed to be issue-specific.
Quantitative Disclosures
Categorization of Advances (outstanding net of provisions) classified on the basis of Risk
Weightage is provided below:
Particulars 31 March 15
< 100 % Risk Weight 85,293
100 % Risk Weight 52,005
> 100 % Risk Weight 21,151
Total 158,449
5. Disclosures for Credit Risk Mitigation on Standardised approach
Qualitative Disclosures
This is detailed in our policy on Credit Risk Mitigation techniques and Collateral
Management.
Quantitative Disclosures
Currently, eligible financial collateral in the form of fixed deposits under lien and
guarantees issued by eligible guarantor as specified in RBI guidelines have been used as
credit risk mitigants. In the case of fixed deposits under lien, the Bank reduces its credit
exposure to counterparty by the value of the fixed deposits.
The details of exposures wherein the bank has used credit risk mitigants (CRM) are as
under:
Product Amount of CRM
Derivatives 3,001
Fund based exposure 13
Total 3,014
DBS Bank Ltd., India
Basel III: Pillar 3 Disclosures (Continued) as at 31 March 2015
(Currency: Indian rupees in million)
6. Disclosure on Securitisation for Standardised approach
The Bank has not undertaken any securitisation and hence this disclosure is not applicable.
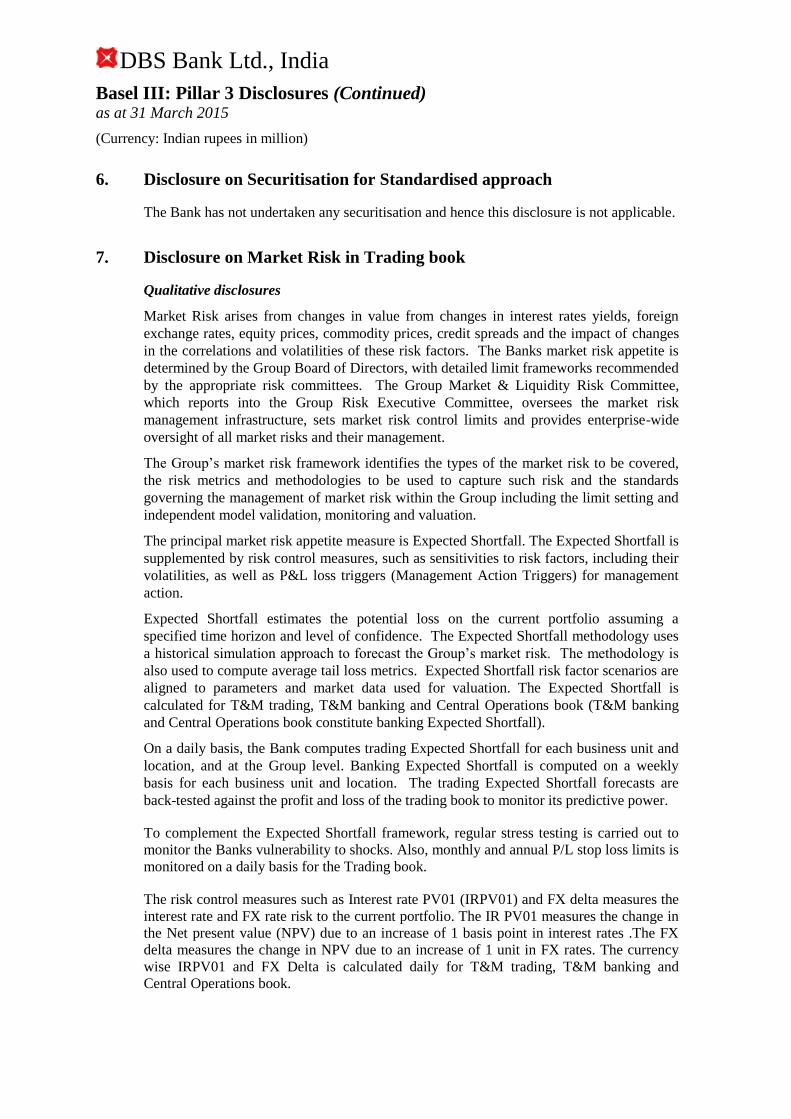
7. Disclosure on Market Risk in Trading book
Qualitative disclosures
Market Risk arises from changes in value from changes in interest rates yields, foreign
exchange rates, equity prices, commodity prices, credit spreads and the impact of changes
in the correlations and volatilities of these risk factors. The Banks market risk appetite is
determined by the Group Board of Directors, with detailed limit frameworks recommended
by the appropriate risk committees. The Group Market & Liquidity Risk Committee,
which reports into the Group Risk Executive Committee, oversees the market risk
management infrastructure, sets market risk control limits and provides enterprise-wide
oversight of all market risks and their management.
The Group’s market risk framework identifies the types of the market risk to be covered,
the risk metrics and methodologies to be used to capture such risk and the standards
governing the management of market risk within the Group including the limit setting and
independent model validation, monitoring and valuation.
The principal market risk appetite measure is Expected Shortfall. The Expected Shortfall is
supplemented by risk control measures, such as sensitivities to risk factors, including their
volatilities, as well as P&L loss triggers (Management Action Triggers) for management
action.
Expected Shortfall estimates the potential loss on the current portfolio assuming a
specified time horizon and level of confidence. The Expected Shortfall methodology uses
a historical simulation approach to forecast the Group’s market risk. The methodology is
also used to compute average tail loss metrics. Expected Shortfall risk factor scenarios are
aligned to parameters and market data used for valuation. The Expected Shortfall is
calculated for T&M trading, T&M banking and Central Operations book (T&M banking
and Central Operations book constitute banking Expected Shortfall).
On a daily basis, the Bank computes trading Expected Shortfall for each business unit and
location, and at the Group level. Banking Expected Shortfall is computed on a weekly
basis for each business unit and location. The trading Expected Shortfall forecasts are
back-tested against the profit and loss of the trading book to monitor its predictive power.
To complement the Expected Shortfall framework, regular stress testing is carried out to
monitor the Banks vulnerability to shocks. Also, monthly and annual P/L stop loss limits is
monitored on a daily basis for the Trading book.
The risk control measures such as Interest rate PV01 (IRPV01) and FX delta measures the
interest rate and FX rate risk to the current portfolio. The IR PV01 measures the change in
the Net present value (NPV) due to an increase of 1 basis point in interest rates .The FX
delta measures the change in NPV due to an increase of 1 unit in FX rates. The currency
wise IRPV01 and FX Delta is calculated daily for T&M trading, T&M banking and
Central Operations book.
DBS Bank Ltd., India
Basel III: Pillar 3 Disclosures (Continued) as at 31 March 2015
(Currency: Indian rupees in million)
7. Disclosure on Market Risk in Trading book (Continued)
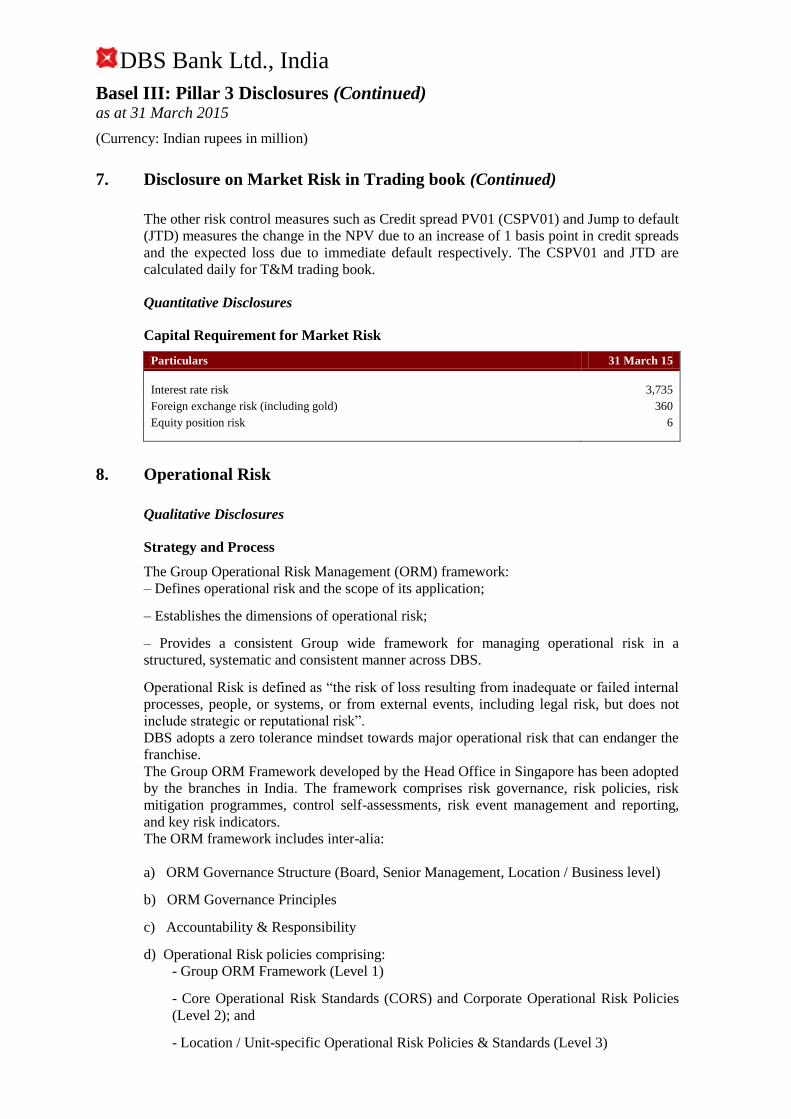
The other risk control measures such as Credit spread PV01 (CSPV01) and Jump to default
(JTD) measures the change in the NPV due to an increase of 1 basis point in credit spreads
and the expected loss due to immediate default respectively. The CSPV01 and JTD are
calculated daily for T&M trading book.
Quantitative Disclosures
Capital Requirement for Market Risk
Particulars 31 March 15
Interest rate risk 3,735
Foreign exchange risk (including gold) 360
Equity position risk 6
8. Operational Risk
Qualitative Disclosures
Strategy and Process
The Group Operational Risk Management (ORM) framework:
– Defines operational risk and the scope of its application;
– Establishes the dimensions of operational risk;
– Provides a consistent Group wide framework for managing operational risk in a
structured, systematic and consistent manner across DBS.
Operational Risk is defined as “the risk of loss resulting from inadequate or failed internal
processes, people, or systems, or from external events, including legal risk, but does not
include strategic or reputational risk”.
DBS adopts a zero tolerance mindset towards major operational risk that can endanger the
franchise.
The Group ORM Framework developed by the Head Office in Singapore has been adopted
by the branches in India. The framework comprises risk governance, risk policies, risk
mitigation programmes, control self-assessments, risk event management and reporting,
and key risk indicators.
The ORM framework includes inter-alia:
a) ORM Governance Structure (Board, Senior Management, Location / Business level)
b) ORM Governance Principles
c) Accountability & Responsibility
d) Operational Risk policies comprising:
- Group ORM Framework (Level 1)
- Core Operational Risk Standards (CORS) and Corporate Operational Risk Policies
(Level 2); and
- Location / Unit-specific Operational Risk Policies & Standards (Level 3)

DBS Bank Ltd., India
Basel III: Pillar 3 Disclosures (Continued) as at 31 March 2015
(Currency: Indian rupees in million)
8. Operational Risk (Continued)
e) Risk Mitigation Programmes comprising:
- Internal controls
- Global Insurance Programme; and
- Business Continuity Management
f) Risk Tools and Mechanisms comprising:
- Risk & Control Self Assessment (RCSA) *
- Operational Risk Event Management & Reporting (OREM&R)
- Key Risk Indicators (KRI)
- Issue Management & Action Tracking
- Risk Analysis, Reporting and Profiling
g) Risk Quantification & Disclosure
– Loss Provisioning / Capital Allocation
* RCSA implementation on phased approach and will fully replace CSA upon completion
of roll out.
Structure and Organisation The Bank also has in place an India Operational Risk Committee (IORC) which meets on a
monthly basis to discuss operational risk issues. This committee is managed by the Head -
Operational Risk and reports to the IMC. This ensures appropriate management oversight
of operational risks facing the Bank.
The IORC comprises the CEO and the heads (delegates) of the Institutional Banking
Group, Consumer Banking Group, Global Transaction Services, Treasury & Markets,
Technology & Operations, Risk Management Group, Finance, Legal & Compliance,
Internal Audit and Operational Risk.
As part of the Bank’s ORM structure, an independent Operational Risk function is in place
led by the local Head of Operational Risk, who reports to the Senior Risk Executive, India
and functionally to the Group Head of Operational Risk at the Head Office in Singapore.
Coverage includes identifying, assessing, controlling / mitigating risk, monitoring and
reporting risk and also ensuring compliance with DBS Group standards and regulatory
requirements relating to Operational Risk.
In addition to the independent Operational Risk resources, Unit Operational Risk
Managers (UORM) are appointed within key Business Units (BU) and Support Units (SU)
to support operationalisation of the risk management policy & process and to ensure
maintenance of adequate controls on an ongoing basis. Regular training / orientations are
conducted to keep UORM updated with key developments.

DBS Bank Ltd., India
Basel III: Pillar 3 Disclosures (Continued) as at 31 March 2015
(Currency: Indian rupees in million)
8. Operational Risk (Continued)
Risk Mitigation Programs
Internal Controls The day-to-day management of Operational Risk within the Bank is through maintenance
of a comprehensive system of internal controls. An effective internal control system is a
combination of a strong control environment and appropriate internal control procedures.
These internal controls comprise preventive, detective, escalation and corrective controls.
Global Insurance Programme (GIP) The key objective of the GIP is to reduce financial loss of risk events via transfer of loss to
external funding sources (insurers).
The GIP provides cover for low-frequency high-impact loss incidents. In line with DBS
ORM philosophy, high frequency low impact operational losses are managed through
establishment of strong internal controls.
Business Continuity Management (BCM) is a key Operational Risk programme of DBS
to minimize the impact of a business disruption, irrespective of cause, and to provide an
acceptable level of business until normal business operations are resumed.
BU/SUs are to comply with the BCM Policies and Standards established by Group
Business Continuity Management (GBCM).
BCM includes the following:
– Establishment of ownership, roles and responsibilities
– Risk analysis
– Business impact analysis
– Recovery strategies
– Familiarisation of emergency response and crisis management plans
– Regular review and maintenance
– Regular, complete and meaningful testing
Risk Reporting and Measurement
Operational Risk related MIS is reported through the central ORM system (ROR -
Reveleus Operational Risk), as follows:
– Incident Management (IM) Module - for reporting of Risk Events
– Issue and Action Management (IAM) Module - for tracking of Issues and Actions
emanating from Risk Events, Audit Issues, Regulatory Issues and other risk related issues
– Key Indicator (KI) Module - for reporting of Key Risk Indicators (KRI)

DBS Bank Ltd., India
Basel III: Pillar 3 Disclosures (Continued) as at 31 March 2015
(Currency: Indian rupees in million)
8. Operational Risk (Continued)
– Control Self Assessment (CSA) Module - to facilitate the half-yearly Control Self
Assessment process.
RCSA implementation is on phased approach and will fully replace CSA upon completion
of roll out.
The Operational Risk Profile including MIS relating to the above is placed at the monthly
meetings of the India Operational Risk Committee (IORC).
Approach for operational risk capital assessment
The Bank currently adopts the Basic Indicator Approach to calculate capital for operational
risk.
9. Interest rate risk in the banking book (IRRBB)
Qualitative Disclosures
The Asset and Liability Committee (“ALCO”) oversees the structural interest rate risk and
funding liquidity risk in the Bank. The ALCO ensures that the exposures are within
prudent levels. Structural interest rate risk arises from mismatches in the interest rate
profile of customer loans and deposits. This interest rate risk has several aspects: basis risk
arising from different interest rate benchmarks, interest rate re-pricing risk, yield curve
risks and embedded optionality. To monitor the structural interest rate risk, the tools used
by DBS include re-pricing gap reports based on traditional as well as duration gap
approach, sensitivity analysis and income simulations under various scenarios.
Quantitative Disclosures
The Bank uses the Duration Gap approach to measure the impact of Market Value of
Equity (MVE) for upward and downward rate shocks. This measures the potential change
in MVE of the Bank for a 200 bps change in interest rates. The change in MVE due to a
200 change in interest rates are:-
Change in MVE due to a 200 bps change in interest rates INR Million
31 March 2015 (4,613.15)
The impact on Earnings is computed as per the definition laid down in the ALM Policy of
the Bank. Per the policy, Earnings-at-Risk (EaR) measures the interest rate risk from the
earnings perspective. It is computed as an impact (over a 1-year horizon) of a 1% parallel
shift in the yield curve on the Bank’s earning. This is computed using the net IRS gaps for
each bucket up to 1 year and the mark-to-market impact of 1% rise in interest rates on the
AFS and HFT portfolio is to this. The aggregate of these approximates the net revenue
impact of a 1% parallel shift (increase in interest rates) in the yield curve over a 1 year
horizon and acts as a useful tool in the hands of the ALCO to monitor and assess the
impact of Interest rate risk exposure of the Bank on its revenue.
DBS Bank Ltd., India
Basel III: Pillar 3 Disclosures (Continued) as at 31 March 2015
(Currency: Indian rupees in million)
9. Interest rate risk in the banking book (IRRBB) (Continued)
Quantitative Disclosures (Continued)
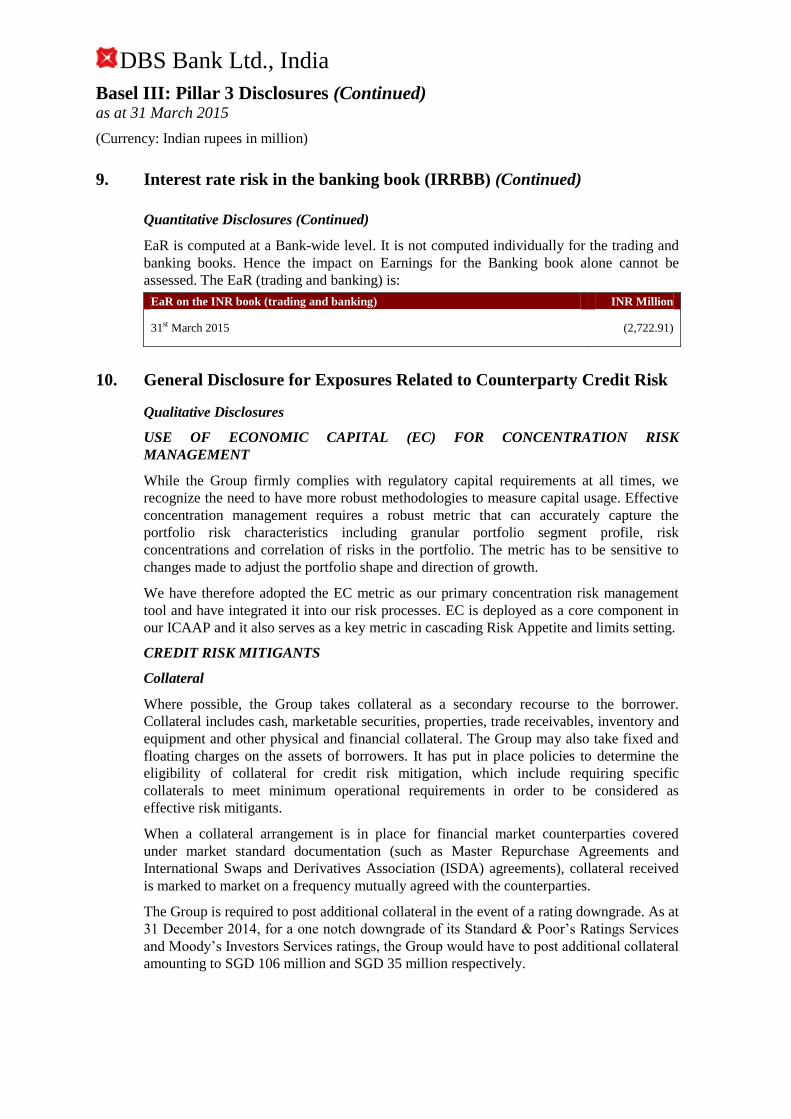
EaR is computed at a Bank-wide level. It is not computed individually for the trading and
banking books. Hence the impact on Earnings for the Banking book alone cannot be
assessed. The EaR (trading and banking) is:
EaR on the INR book (trading and banking) INR Million
31st March 2015 (2,722.91)
10. General Disclosure for Exposures Related to Counterparty Credit Risk
Qualitative Disclosures
USE OF ECONOMIC CAPITAL (EC) FOR CONCENTRATION RISK
MANAGEMENT
While the Group firmly complies with regulatory capital requirements at all times, we
recognize the need to have more robust methodologies to measure capital usage. Effective
concentration management requires a robust metric that can accurately capture the
portfolio risk characteristics including granular portfolio segment profile, risk
concentrations and correlation of risks in the portfolio. The metric has to be sensitive to
changes made to adjust the portfolio shape and direction of growth.
We have therefore adopted the EC metric as our primary concentration risk management
tool and have integrated it into our risk processes. EC is deployed as a core component in
our ICAAP and it also serves as a key metric in cascading Risk Appetite and limits setting.
CREDIT RISK MITIGANTS
Collateral
Where possible, the Group takes collateral as a secondary recourse to the borrower.
Collateral includes cash, marketable securities, properties, trade receivables, inventory and
equipment and other physical and financial collateral. The Group may also take fixed and
floating charges on the assets of borrowers. It has put in place policies to determine the
eligibility of collateral for credit risk mitigation, which include requiring specific
collaterals to meet minimum operational requirements in order to be considered as
effective risk mitigants.
When a collateral arrangement is in place for financial market counterparties covered
under market standard documentation (such as Master Repurchase Agreements and
International Swaps and Derivatives Association (ISDA) agreements), collateral received
is marked to market on a frequency mutually agreed with the counterparties.
The Group is required to post additional collateral in the event of a rating downgrade. As at
31 December 2014, for a one notch downgrade of its Standard & Poor’s Ratings Services
and Moody’s Investors Services ratings, the Group would have to post additional collateral
amounting to SGD 106 million and SGD 35 million respectively.
DBS Bank Ltd., India
Basel III: Pillar 3 Disclosures (Continued) as at 31 March 2015
(Currency: Indian rupees in million)
10 General Disclosure for Exposures Related to Counterparty Credit Risk
(Continued)
Other Risk Mitigants
The Group manages its credit exposure from derivatives, repo and other repo-style
transactions by entering into netting and collateral arrangements with counterparties where
it is appropriate and feasible to do so. The credit risk associated with outstanding contracts
with positive mark to market is reduced by master netting arrangements to the extent that if
an event of default occurs, all amounts with a single counterparty in a netting-eligible
jurisdiction are settled on a net basis.
The Group may also enter into agreements which govern the posting of collateral with
derivative counterparties for credit risk mitigation (e.g. Credit Support Annexes under
ISDA master agreements). These are governed by internal guidelines with respect to the
eligibility of collateral types and the frequency of collateral calls.
In addition, the Group also uses guarantees as credit risk mitigants. While the Group may
accept guarantees from any counterparty, it sets internal thresholds for considering
guarantors to be eligible for credit risk mitigation.
COUNTER PARTY RISK MANAGEMENT
Counterparty risk that may arise from traded products and securities is measured on a loan
equivalent basis and included under the Group’s overall credit limits to counterparties.
Issuer Default Risk that may arise from traded products and securities are generally
measured based on jump-to-default computations.
The Group actively monitors and manages its exposure to counterparties in over-the-
counter (OTC) derivative trades to protect its balance sheet in the event of counterparty
default. Counterparty risk exposures which may be materially and adversely affected by
market risk events are identified, reviewed and acted upon by management and highlighted
to the appropriate risk committees. In addition, the Group’s risk measurement
methodology takes into account the higher risks associated with transactions that exhibit a
strong relationship between the creditworthiness of a counterparty and the expected future
replacement value of a relevant transaction (so called wrong-way risk) as identified during
the trade booking process. The current exposure method is used for calculating the Group’s
net credit exposure and regulatory capital for counterparty exposures, using the mark-to-
market exposures with an appropriate add-on factor for potential future exposures.
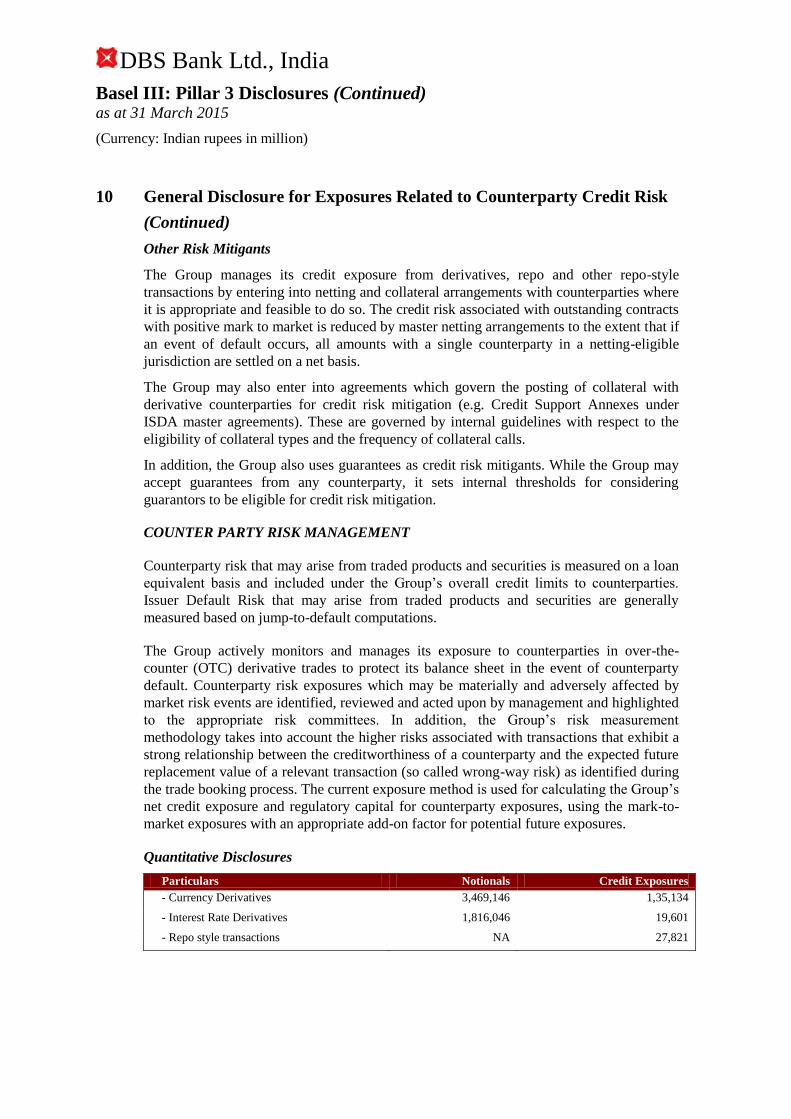
Quantitative Disclosures
Particulars Notionals Credit Exposures
- Currency Derivatives 3,469,146 1,35,134
- Interest Rate Derivatives 1,816,046 19,601
- Repo style transactions NA 27,821
DBS Bank Ltd., India
Basel III: Pillar 3 Disclosures (Continued) as at 31 March 2015
(Currency: Indian rupees in million)
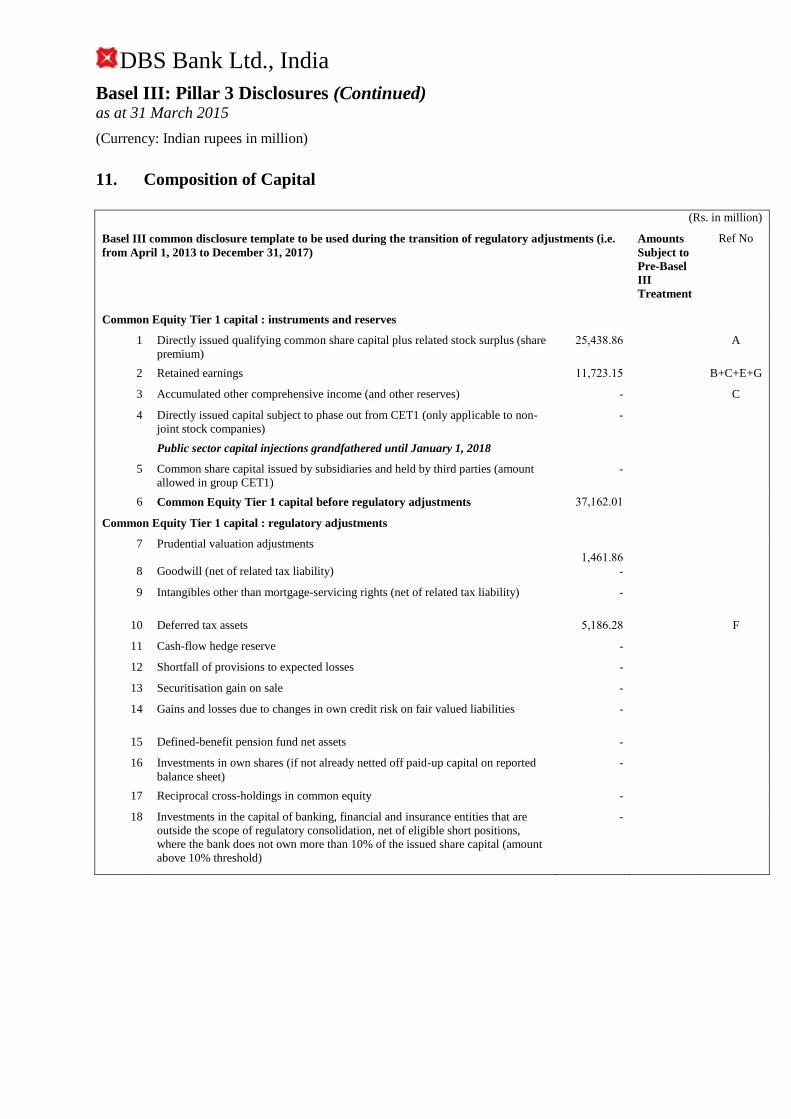
11. Composition of Capital
(Rs. in million)
Basel III common disclosure template to be used during the transition of regulatory adjustments (i.e.
from April 1, 2013 to December 31, 2017)
Amounts
Subject to
Pre-Basel
III
Treatment
Ref No
Common Equity Tier 1 capital : instruments and reserves
1 Directly issued qualifying common share capital plus related stock surplus (share
premium)
25,438.86 A
2 Retained earnings 11,723.15 B+C+E+G
3 Accumulated other comprehensive income (and other reserves) - C
4 Directly issued capital subject to phase out from CET1 (only applicable to non-
joint stock companies)
-
Public sector capital injections grandfathered until January 1, 2018
5 Common share capital issued by subsidiaries and held by third parties (amount
allowed in group CET1)
-
6 Common Equity Tier 1 capital before regulatory adjustments 37,162.01
Common Equity Tier 1 capital : regulatory adjustments
7 Prudential valuation adjustments
1,461.86
8 Goodwill (net of related tax liability) -
9 Intangibles other than mortgage-servicing rights (net of related tax liability) -
10 Deferred tax assets 5,186.28 F
11 Cash-flow hedge reserve -
12 Shortfall of provisions to expected losses -
13 Securitisation gain on sale -
14 Gains and losses due to changes in own credit risk on fair valued liabilities -
15 Defined-benefit pension fund net assets -
16 Investments in own shares (if not already netted off paid-up capital on reported
balance sheet)
-
17 Reciprocal cross-holdings in common equity -
18 Investments in the capital of banking, financial and insurance entities that are
outside the scope of regulatory consolidation, net of eligible short positions,
where the bank does not own more than 10% of the issued share capital (amount
above 10% threshold)
-

DBS Bank Ltd., India
Basel III: Pillar 3 Disclosures (Continued) as at 31 March 2015
(Currency: Indian rupees in million)
11. Composition of Capital (Continued)
(Rs. in million)
Basel III common disclosure template to be used during the transition of regulatory adjustments (i.e.
from April 1, 2013 to December 31, 2017)
Amounts
Subject to
Pre-Basel
III
Treatment
Ref No
Common Equity Tier 1 capital : regulatory adjustments
19 Significant investments in the common stock of banking, financial and
insurance entities that are outside the scope of regulatory consolidation, net of
eligible short positions (amount above 10% threshold)
-
20 Mortgage servicing rights (amount above 10% threshold) -
21 Deferred tax assets arising from temporary differences (amount above 10%
threshold, net of related tax liability)
-
22 Amount exceeding the 15% threshold -
23 of which: significant investments in the common stock of financial entities -
24 of which : mortgage servicing rights -
25 of which : deferred tax assets arising from temporary differences -
26 National specific regulatory adjustments (26a+26b+26c+26d)
-
a.of which : Investments in the equity capital of unconsolidated insurance
subsidiaries
-
b.of which : Investments in the equity capital of unconsolidated non-financial
subsidiaries
-
c.of which : Shortfall in the equity capital of majority owned financial entities
which have not been consolidated with the bank
-
d.of which : Unamortised pension funds expenditures -
27 Regulatory adjustments applied to Common Equity Tier 1 due to insufficient
Additional Tier 1 and Tier 2 to cover deductions
-
28 Total regulatory adjustments to Common equity Tier 1 6,648.14
29 Common Equity Tier 1 capital (CET1) 30,513.87
Additional Tier 1 capital : instruments
30 Directly issued qualifying Additional Tier 1 instruments plus related stock
surplus (share premium) (31+32)
-
31 of which : classified as equity under applicable accounting standards
(Perpetual Non-Cumulative Preference Shares)
-
32 of which: classified as liabilities under applicable accounting standards
(Perpetual debt Instruments)
-
33 Directly issued capital instruments subject to phase out from Additional Tier 1 -
34 Additional Tier 1 instruments (and CET1 instruments not included in row 5)
issued by subsidiaries and held by third parties (amount allowed in group AT1)
-
35 of which : instruments issued by subsidiaries subject to phase out -
36 Additional Tier 1 capital before regulatory adjustments -

DBS Bank Ltd., India
Basel III: Pillar 3 Disclosures (Continued) as at 31 March 2015
(Currency: Indian rupees in million)
11. Composition of Capital (Continued)
(Rs. in million)
Basel III common disclosure template to be used during the transition of regulatory adjustments (i.e.
from April 1, 2013 to December 31, 2017)
Amounts
Subject to
Pre-Basel
III
Treatment
Ref No
Additional Tier 1 capital : regulatory adjustments
37 Investments in own Additional Tier 1 instruments -
38 Reciprocal cross-holdings in Additional Tier 1 instruments -
39 Investments in the capital of banking, financial and insurance entities that are
outside the scope of regulatory consolidation, net of eligible short positions, where
the bank does not own more than 10% of the issued common share capital of the
entity (amount above 10% threshold)
-
40 Significant investments in the capital of banking, financial and insurance entities
that are outside the scope of regulatory consolidation (net of eligible short
positions)
-
41 National specific regulatory adjustments (41a+41b) -
a. of which : Investments in the Additional Tier 1 capital of unconsolidated
insurance subsidiaries
-
b. of which : Shortfall in the Additional Tier 1 capital of majority owned financial
entities which have not been consolidated with the bank
-
Regulatory Adjustments Applied to Additional Tier 1 in respect of Amounts
Subject to Pre-Basel III Treatment
-
of which: -
of which: -
of which:
42 Regulatory adjustments applied to Additional Tier 1 due to insufficient Tier 2 to
cover deductions
-
43 Total regulatory adjustments to Additional Tier 1 capital -
44 Additional Tier 1 capital (AT1) -
a. Additional Tier 1 capital reckoned for capital adequacy -
45 Tier 1 capital (T1 = CET1 + Admissible AT1) (29 + 44a) 30,513.87
Tier 2 capital: instruments and provisions
46 Directly issued qualifying Tier 2 instruments plus related stock surplus
-
47 Directly issued capital instruments subject to phase out from Tier 2 16,250.00 I
48 Tier 2 instruments (and CET1 and AT1 instruments not included in rows 5 or 34)
issued by subsidiaries and held by third parties (amount allowed in group Tier 2)
-
49 of which: instruments issued by subsidiaries subject to phase out -
50 Provisions 1,346.70 D+J
DBS Bank Ltd., India
Basel III: Pillar 3 Disclosures (Continued) as at 31 March 2015
(Currency: Indian rupees in million)
11. Composition of Capital (Continued)
(Rs. in million)
Basel III common disclosure template to be used during the transition of regulatory adjustments (i.e.
from April 1, 2013 to December 31, 2017)
Amounts
Subject to
Pre-Basel
III
Treatment
Ref No
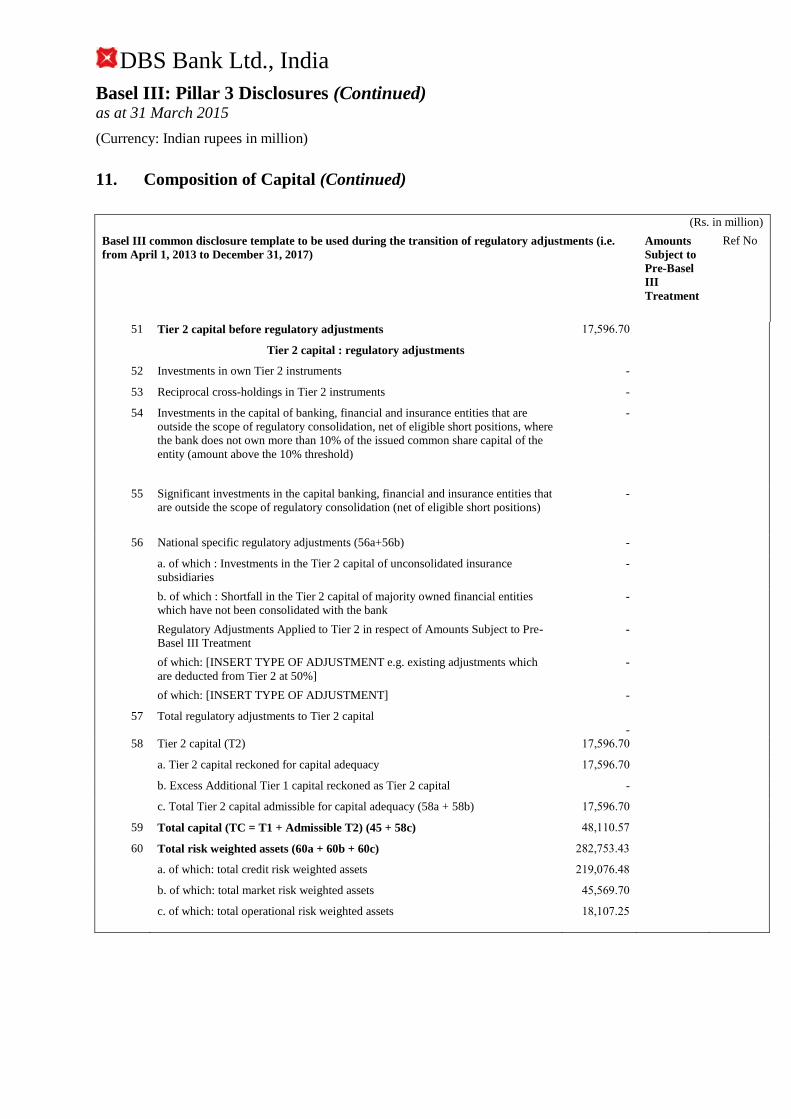
51 Tier 2 capital before regulatory adjustments 17,596.70
Tier 2 capital : regulatory adjustments
52 Investments in own Tier 2 instruments -
53 Reciprocal cross-holdings in Tier 2 instruments -
54 Investments in the capital of banking, financial and insurance entities that are
outside the scope of regulatory consolidation, net of eligible short positions, where
the bank does not own more than 10% of the issued common share capital of the
entity (amount above the 10% threshold)
-
55 Significant investments in the capital banking, financial and insurance entities that
are outside the scope of regulatory consolidation (net of eligible short positions)
-
56 National specific regulatory adjustments (56a+56b) -
a. of which : Investments in the Tier 2 capital of unconsolidated insurance
subsidiaries
-
b. of which : Shortfall in the Tier 2 capital of majority owned financial entities
which have not been consolidated with the bank
-
Regulatory Adjustments Applied to Tier 2 in respect of Amounts Subject to Pre-
Basel III Treatment
-
of which: [INSERT TYPE OF ADJUSTMENT e.g. existing adjustments which
are deducted from Tier 2 at 50%]
-
of which: [INSERT TYPE OF ADJUSTMENT] -
57 Total regulatory adjustments to Tier 2 capital
-
58 Tier 2 capital (T2) 17,596.70
a. Tier 2 capital reckoned for capital adequacy 17,596.70
b. Excess Additional Tier 1 capital reckoned as Tier 2 capital -
c. Total Tier 2 capital admissible for capital adequacy (58a + 58b) 17,596.70
59 Total capital (TC = T1 + Admissible T2) (45 + 58c) 48,110.57
60 Total risk weighted assets (60a + 60b + 60c) 282,753.43
a. of which: total credit risk weighted assets 219,076.48
b. of which: total market risk weighted assets 45,569.70
c. of which: total operational risk weighted assets 18,107.25
DBS Bank Ltd., India
Basel III: Pillar 3 Disclosures (Continued) as at 31 March 2015
(Currency: Indian rupees in million)
11. Composition of Capital (Continued)
(Rs. in million)
Basel III common disclosure template to be used during the transition of regulatory adjustments (i.e.
from April 1, 2013 to December 31, 2017)
Amounts
Subject to
Pre-Basel
III
Treatment
Ref No
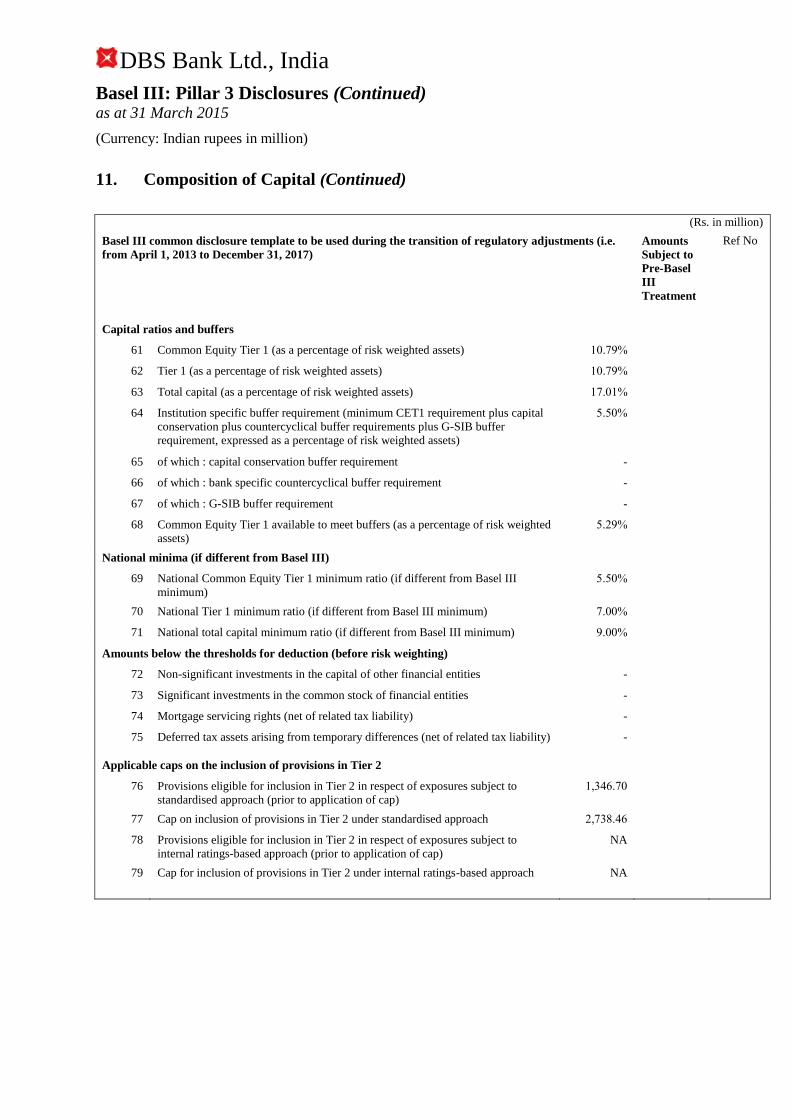
Capital ratios and buffers
61 Common Equity Tier 1 (as a percentage of risk weighted assets) 10.79%
62 Tier 1 (as a percentage of risk weighted assets) 10.79%
63 Total capital (as a percentage of risk weighted assets) 17.01%
64 Institution specific buffer requirement (minimum CET1 requirement plus capital
conservation plus countercyclical buffer requirements plus G-SIB buffer
requirement, expressed as a percentage of risk weighted assets)
5.50%
65 of which : capital conservation buffer requirement -
66 of which : bank specific countercyclical buffer requirement -
67 of which : G-SIB buffer requirement -
68 Common Equity Tier 1 available to meet buffers (as a percentage of risk weighted
assets)
5.29%
National minima (if different from Basel III)
69 National Common Equity Tier 1 minimum ratio (if different from Basel III
minimum)
5.50%
70 National Tier 1 minimum ratio (if different from Basel III minimum) 7.00%
71 National total capital minimum ratio (if different from Basel III minimum) 9.00%
Amounts below the thresholds for deduction (before risk weighting)
72 Non-significant investments in the capital of other financial entities -
73 Significant investments in the common stock of financial entities -
74 Mortgage servicing rights (net of related tax liability) -
75 Deferred tax assets arising from temporary differences (net of related tax liability) -
Applicable caps on the inclusion of provisions in Tier 2
76 Provisions eligible for inclusion in Tier 2 in respect of exposures subject to
standardised approach (prior to application of cap)
1,346.70
77 Cap on inclusion of provisions in Tier 2 under standardised approach 2,738.46
78 Provisions eligible for inclusion in Tier 2 in respect of exposures subject to
internal ratings-based approach (prior to application of cap)
NA
79 Cap for inclusion of provisions in Tier 2 under internal ratings-based approach NA

DBS Bank Ltd., India
Basel III: Pillar 3 Disclosures (Continued) as at 31 March 2015
(Currency: Indian rupees in million)
11. Composition of Capital (Continued)
(Rs. in million)
Basel III common disclosure template to be used during the transition of regulatory adjustments (i.e.
from April 1, 2013 to December 31, 2017)
Amounts
Subject to
Pre-Basel
III
Treatment
Ref No
(only applicable between March 31, 2017 and March 31, 2022)
80 Current cap on CET1 instruments subject to phase out arrangements NA
81 Amount excluded from CET1 due to cap (excess over cap after redemptions and
maturities)
NA
82 Current cap on AT1 instruments subject to phase out arrangements NA
83 Amount excluded from AT1 due to cap (excess over cap after redemptions and
maturities)
NA
84 Current cap on T2 instruments subject to phase out arrangements NA
85 Amount excluded from T2 due to cap (excess over cap after redemptions and
maturities)
NA
Notes to the above Template
Row No.
of the
template
Particular (Rs. in
million)
10 Deferred tax assets associated with accumulated losses -
Deferred tax assets (excluding those associated with accumulated losses) net of
Deferred tax liability
5,186.28
Total as indicated in row 10 5,186.28
19 If investments in insurance subsidiaries are not deducted fully from capital and
instead considered under 10% threshold for deduction, the resultant increase in
the capital of bank
-
of which : Increase in Common Equity Tier 1 capital -
of which : Increase in Additional Tier 1 capital -
of which : Increase in Tier 2 capital -
26b If investments in the equity capital of unconsolidated non-financial subsidiaries
are not deducted and hence, risk weighted then :
-
i) Increase in Common Equity Tier 1 capital -
ii) Increase in risk weighted assets -
44a Excess Additional Tier 1 capital not reckoned for capital adequacy (difference
between Additional Tier 1 capital as reported in row 44 and admissible
Additional Tier 1 capital as reported in 44a)
-
of which : Excess Additional Tier 1 capital which is considered as Tier 2 capital
under row 58b
-
50 Eligible Provisions included in Tier 2 capital
1,346.70
Eligible Revaluation Reserves included in Tier 2 capital -
Total of row 50
1,346.70
58a Excess Tier 2 capital not reckoned for capital adequacy (difference between Tier
2 capital as reported in row 58 and T2 as reported in 58a)
-
DBS Bank Ltd., India
Basel III: Pillar 3 Disclosures (Continued) as at 31 March 2015
(Currency: Indian rupees in million)
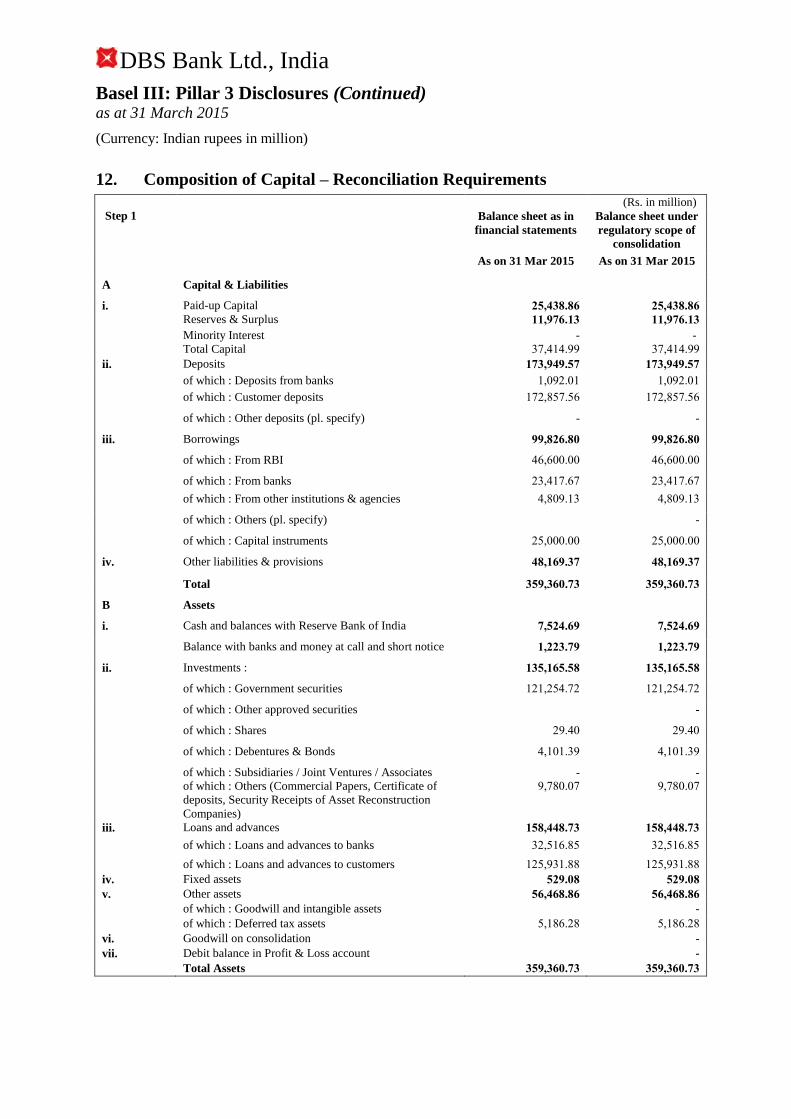
12. Composition of Capital – Reconciliation Requirements
(Rs. in million)
Step 1 Balance sheet as in
financial statements
Balance sheet under
regulatory scope of
consolidation
As on 31 Mar 2015 As on 31 Mar 2015
A Capital & Liabilities
i. Paid-up Capital 25,438.86 25,438.86
Reserves & Surplus 11,976.13 11,976.13
Minority Interest - -
Total Capital 37,414.99 37,414.99
ii. Deposits 173,949.57 173,949.57
of which : Deposits from banks 1,092.01 1,092.01
of which : Customer deposits 172,857.56 172,857.56
of which : Other deposits (pl. specify) - -
iii. Borrowings 99,826.80 99,826.80
of which : From RBI 46,600.00 46,600.00
of which : From banks 23,417.67 23,417.67
of which : From other institutions & agencies 4,809.13 4,809.13
of which : Others (pl. specify) -
of which : Capital instruments 25,000.00 25,000.00
iv. Other liabilities & provisions 48,169.37 48,169.37
Total 359,360.73 359,360.73
B Assets
i. Cash and balances with Reserve Bank of India 7,524.69 7,524.69
Balance with banks and money at call and short notice 1,223.79 1,223.79
ii. Investments : 135,165.58 135,165.58
of which : Government securities 121,254.72 121,254.72
of which : Other approved securities -
of which : Shares 29.40 29.40
of which : Debentures & Bonds 4,101.39 4,101.39
of which : Subsidiaries / Joint Ventures / Associates - -
of which : Others (Commercial Papers, Certificate of
deposits, Security Receipts of Asset Reconstruction
Companies)
9,780.07 9,780.07
iii. Loans and advances 158,448.73 158,448.73
of which : Loans and advances to banks 32,516.85 32,516.85
of which : Loans and advances to customers 125,931.88 125,931.88
iv. Fixed assets 529.08 529.08
v. Other assets 56,468.86 56,468.86
of which : Goodwill and intangible assets -
of which : Deferred tax assets 5,186.28 5,186.28
vi. Goodwill on consolidation -
vii. Debit balance in Profit & Loss account -
Total Assets 359,360.73 359,360.73
DBS Bank Ltd., India
Basel III: Pillar 3 Disclosures (Continued) as at 31 March 2015
(Currency: Indian rupees in million)
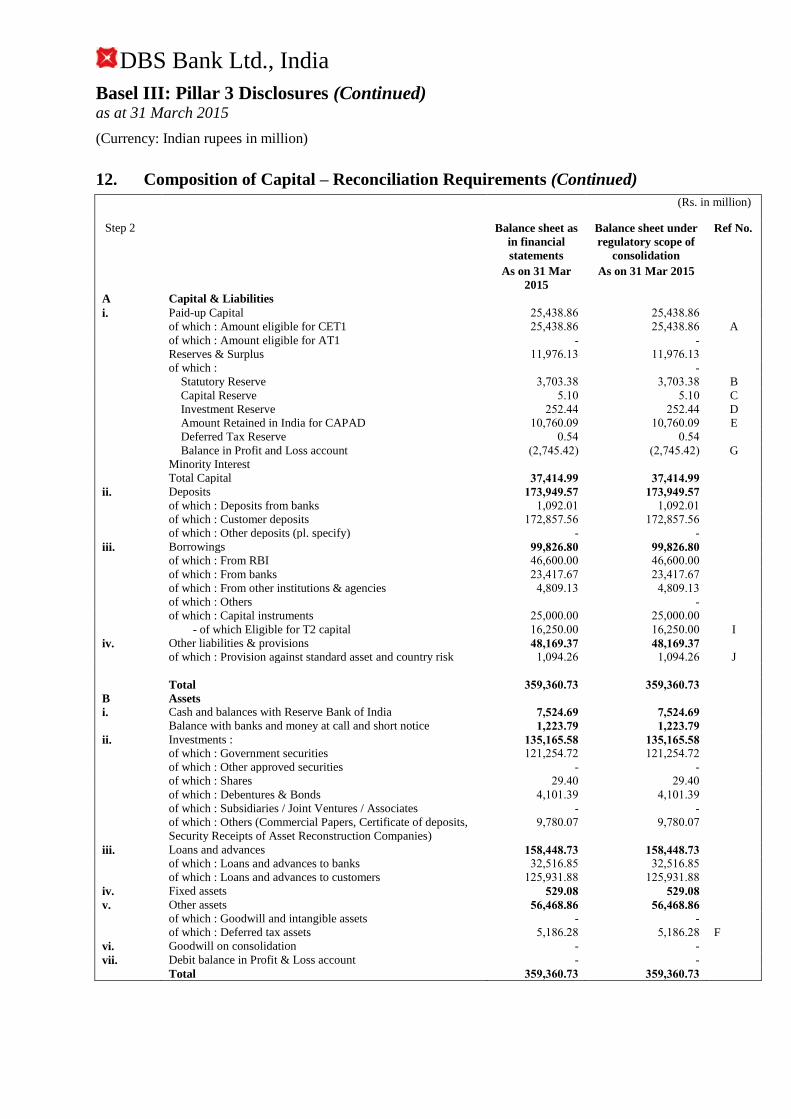
12. Composition of Capital – Reconciliation Requirements (Continued)
(Rs. in million)
Step 2 Balance sheet as
in financial
statements
Balance sheet under
regulatory scope of
consolidation
Ref No.
As on 31 Mar
2015
As on 31 Mar 2015
A Capital & Liabilities
i. Paid-up Capital 25,438.86 25,438.86
of which : Amount eligible for CET1 25,438.86 25,438.86 A
of which : Amount eligible for AT1 - -
Reserves & Surplus 11,976.13 11,976.13
of which : -
Statutory Reserve 3,703.38 3,703.38 B
Capital Reserve 5.10 5.10 C
Investment Reserve 252.44 252.44 D
Amount Retained in India for CAPAD 10,760.09 10,760.09 E
Deferred Tax Reserve 0.54 0.54
Balance in Profit and Loss account (2,745.42) (2,745.42) G
Minority Interest
Total Capital 37,414.99 37,414.99
ii. Deposits 173,949.57 173,949.57
of which : Deposits from banks 1,092.01 1,092.01
of which : Customer deposits 172,857.56 172,857.56
of which : Other deposits (pl. specify) - -
iii. Borrowings 99,826.80 99,826.80
of which : From RBI 46,600.00 46,600.00
of which : From banks 23,417.67 23,417.67
of which : From other institutions & agencies 4,809.13 4,809.13
of which : Others -
of which : Capital instruments 25,000.00 25,000.00
- of which Eligible for T2 capital 16,250.00 16,250.00 I
iv. Other liabilities & provisions 48,169.37 48,169.37
of which : Provision against standard asset and country risk 1,094.26 1,094.26 J
Total 359,360.73 359,360.73
B Assets
i. Cash and balances with Reserve Bank of India 7,524.69 7,524.69
Balance with banks and money at call and short notice 1,223.79 1,223.79
ii. Investments : 135,165.58 135,165.58
of which : Government securities 121,254.72 121,254.72
of which : Other approved securities - -
of which : Shares 29.40 29.40
of which : Debentures & Bonds 4,101.39 4,101.39
of which : Subsidiaries / Joint Ventures / Associates - -
of which : Others (Commercial Papers, Certificate of deposits,
Security Receipts of Asset Reconstruction Companies)
9,780.07 9,780.07
iii. Loans and advances 158,448.73 158,448.73
of which : Loans and advances to banks 32,516.85 32,516.85
of which : Loans and advances to customers 125,931.88 125,931.88
iv. Fixed assets 529.08 529.08
v. Other assets 56,468.86 56,468.86
of which : Goodwill and intangible assets - -
of which : Deferred tax assets 5,186.28 5,186.28 F
vi. Goodwill on consolidation - -
vii. Debit balance in Profit & Loss account - -
Total 359,360.73 359,360.73