
dbauer/manuscripts/sterba-baldasaro-bauer-MBR-201… · .001 .220.071 .003.408 ... .390 500: 1.706...
19
_________________________________________________________________________________ Online Appendix to accompany "Factors affecting the adequacy and preferability of semiparametric groups-based approximations of continuous growth trajectories" _________________________________________________________________________________ Part I. Tables of Results from the Correlated Random Effects Conditions in the Original Simulation (Online Appendix Tables A-E)................................................................................p. 2-6 Part II. Generalizability Checks (Online Appendix Tables F-G; Online Appendix Figure A) ..................................................................................................................................p. 7-9 Part III. Externalizing Behavior Empirical Illustration: SPGM Indirect Approximation and HLM/HGLM Results for Implied Random Effect Covariances (Online Appendix Table H)....p. 10 Part IV. Literature Review of Semiparametric Groups-Based Modeling (SPGM) Applications in Psychology........................................................................................................p. 11-18 Part V. Calculating SPGM-approximated means and variances of underlying random effects: K=6 class empirical example SAS code.....................................................................................p. 19
Transcript of dbauer/manuscripts/sterba-baldasaro-bauer-MBR-201… · .001 .220.071 .003.408 ... .390 500: 1.706...

_________________________________________________________________________________
Online Appendix to accompany "Factors affecting the adequacy and preferability of semiparametric groups-based approximations of continuous growth trajectories"
_________________________________________________________________________________
Part I. Tables of Results from the Correlated Random Effects Conditions in the Original Simulation (Online Appendix Tables A-E)................................................................................p. 2-6 Part II. Generalizability Checks (Online Appendix Tables F-G; Online Appendix Figure A) ..................................................................................................................................p. 7-9 Part III. Externalizing Behavior Empirical Illustration: SPGM Indirect Approximation and HLM/HGLM Results for Implied Random Effect Covariances (Online Appendix Table H)....p. 10 Part IV. Literature Review of Semiparametric Groups-Based Modeling (SPGM) Applications in Psychology........................................................................................................p. 11-18 Part V. Calculating SPGM-approximated means and variances of underlying random effects: K=6 class empirical example SAS code.....................................................................................p. 19

Online Appendix Table A. SPGM-approximated random effect variances: Continuous outcomes
BestDist Samp BIC Estimate MSE ARB Estimate MSE ARB Estimate MSE ARB2 REs, Correlated
N 250 4 .955 .015 .045 .070 .007 .534500 6 .972 .007 .028 .109 .002 .271
1000 7 .982 .003 .018 .122 .001 .184S 250 5 .968 .026 .033 .968 .003 .309
500 6 .981 .016 .020 .114 .002 .2411000 7 .990 .006 .010 .125 .001 .167
B 250 4 .965 .011 .035 .083 .005 .448500 5 .971 .006 .017 .104 .006 .304
1000 6 .979 .003 .021 .121 .001 .1913 REs, Correlated
N 250 5 .903 .023 .097 .104 .003 .306 .068 .003 .437500 6 .913 .014 .087 .112 .002 .253 .069 .003 .423
1000 7 .922 .009 .078 .116 .001 .224 .071 .003 .405S 250 5 .905 .033 .095 .107 .003 .289 .017 .003 .416
500 6 .917 .022 .083 .111 .002 .262 .074 .002 .3801000 7 .936 .011 .064 .117 .001 .223 .078 .002 .353
B 250 4 .888 .022 .112 .089 .004 .408 .058 .004 .513500 5 .910 .013 .090 .107 .002 .285 .068 .003 .432
1000 6 .921 .009 .079 .117 .001 .220 .071 .003 .408Notes. Dist=Random effect distribution condition: (N=normal, S=skewed, or B=bimodal); RE=random effect;Samp=Sample size; MSE=mean squared error; ARB=absolute relative bias; BIC=Bayesian Information Criteria.
Quadratic variance (.12)Intercept variance (1.0) Linear variance (.15)
2
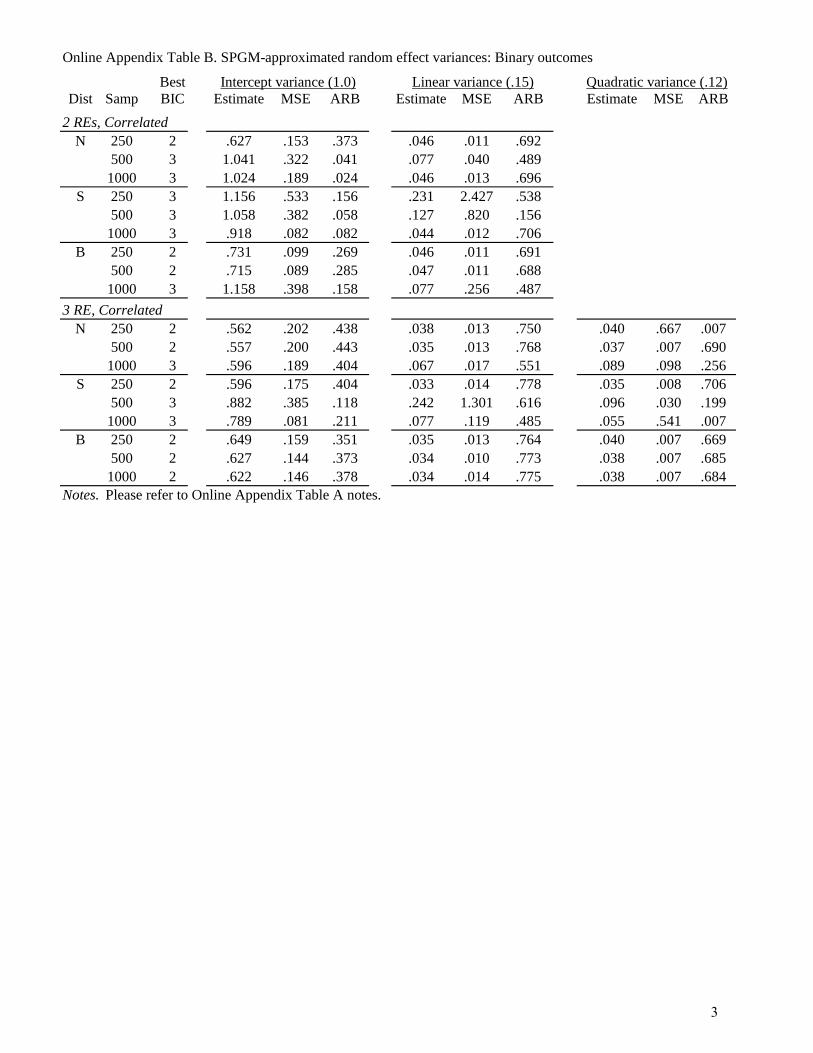
Online Appendix Table B. SPGM-approximated random effect variances: Binary outcomes
BestDist Samp BIC Estimate MSE ARB Estimate MSE ARB Estimate MSE ARB
2 REs, CorrelatedN 250 2 .627 .153 .373 .046 .011 .692
500 3 1.041 .322 .041 .077 .040 .4891000 3 1.024 .189 .024 .046 .013 .696
S 250 3 1.156 .533 .156 .231 2.427 .538500 3 1.058 .382 .058 .127 .820 .156
1000 3 .918 .082 .082 .044 .012 .706B 250 2 .731 .099 .269 .046 .011 .691
500 2 .715 .089 .285 .047 .011 .6881000 3 1.158 .398 .158 .077 .256 .487
3 RE, CorrelatedN 250 2 .562 .202 .438 .038 .013 .750 .040 .667 .007
500 2 .557 .200 .443 .035 .013 .768 .037 .007 .6901000 3 .596 .189 .404 .067 .017 .551 .089 .098 .256
S 250 2 .596 .175 .404 .033 .014 .778 .035 .008 .706500 3 .882 .385 .118 .242 1.301 .616 .096 .030 .199
1000 3 .789 .081 .211 .077 .119 .485 .055 .541 .007B 250 2 .649 .159 .351 .035 .013 .764 .040 .007 .669
500 2 .627 .144 .373 .034 .010 .773 .038 .007 .6851000 2 .622 .146 .378 .034 .014 .775 .038 .007 .684
Notes. Please refer to Online Appendix Table A notes.
Intercept variance (1.0) Linear variance (.15) Quadratic variance (.12)
3

Online Appendix Table C. SPGM-approximated fixed effects: Binary outcomes
BestDist Samp BIC Estimate MSE ARB Estimate MSE ARB Estimate MSE ARB
2 REs, CorrelatedN 250 2 -1.216 .008 .027 -.135 .005 .327 -.088 .046 .705
500 3 -1.295 .045 .036 -.208 .003 .042 -.170 .022 .4331000 3 -1.299 .026 .039 -.193 .026 .036 -.153 .023 .489
S 250 3 -1.345 .009 .020 -.221 .012 .105 -.163 .037 .457500 3 -1.340 .040 .072 -.196 .004 .020 -.141 .030 .5311000 3 -1.310 .019 .048 -.186 .002 .069 -.143 .027 .522
B 250 2 -1.214 .010 .029 -.156 .003 .218 -.107 .038 .644500 2 -1.204 .006 .036 -.157 .002 .215 -.107 .038 .6431000 3 -1.321 .048 .057 -.206 .003 .031 -.172 .021 .426
3 REs, CorrelatedN 250 2 -1.179 .012 .057 -.119 .008 .405 -.124 .033 .588
500 3 -1.181 .007 .055 -.116 .008 .422 -.120 .033 .6021000 3 -1.185 .022 .052 -.130 .012 .351 -.132 .052 .561
S 250 3 -1.252 .006 .002 -.083 .014 .583 -.086 .047 .715500 3 -1.234 .007 .013 -.165 .012 .174 -.153 .032 .4901000 3 -1.239 .002 .009 -.136 .005 .319 -.135 .028 .551
B 250 2 -1.178 .015 .057 -.134 .005 .328 -.143 .026 .524500 2 -1.172 .009 .062 -.132 .005 .340 -.139 .026 .5361000 3 -1.176 .007 .060 -.131 .005 .343 -.139 .026 .536
Notes. Please refer to Online Appendix Table A notes.
Intercept mean (-1.25) Linear mean (-.2) Quadratic mean (-.3)
4

Online Appendix Table D. HGLM random effect variances: Binary outcomes
Dist Samp Estimate MSE ARB Estimate MSE ARB Estimate MSE ARB2 RE, Correlated
N 250 1.026 .043 .026 .163 .007 .090500 1.012 .025 .012 .157 .004 .049
1000 1.002 .011 .002 .151 .001 .005S 250 1.751 .714 .751 .135 .007 .102
500 1.739 .630 .739 .134 .004 .1071000 1.731 .572 .731 .132 .002 .120
B 250 .969 .035 .031 .173 .009 .156500 .956 .019 .044 .175 .004 .169
1000 .943 .012 .057 .167 .002 .1153 RE, Correlated
N 250 1.029 .084 .029 .175 .009 .168 .138 .006 .151500 1.004 .038 .004 .155 .004 .034 .127 .003 .060
1000 .998 .019 .002 .151 .002 .006 .125 .002 .041S 250 1.743 .791 .743 .195 .012 .301 .167 .013 .390
500 1.706 .621 .706 .177 .006 .182 .156 .006 .2981000 1.687 .533 .687 .167 .003 .112 .146 .003 .219
B 250 .968 .069 .032 .164 .008 .093 .139 .007 .159500 .958 .033 .042 .162 .004 .083 .129 .003 .079
1000 .949 .017 .051 .153 .002 .019 .122 .002 .013Notes. Please refer to Online Appendix Table A notes. HGLM= Hierarchical Generalized Linear Model.
Linear variance (.15) Quadratic variance (.12)Intercept variance (1.0)
5
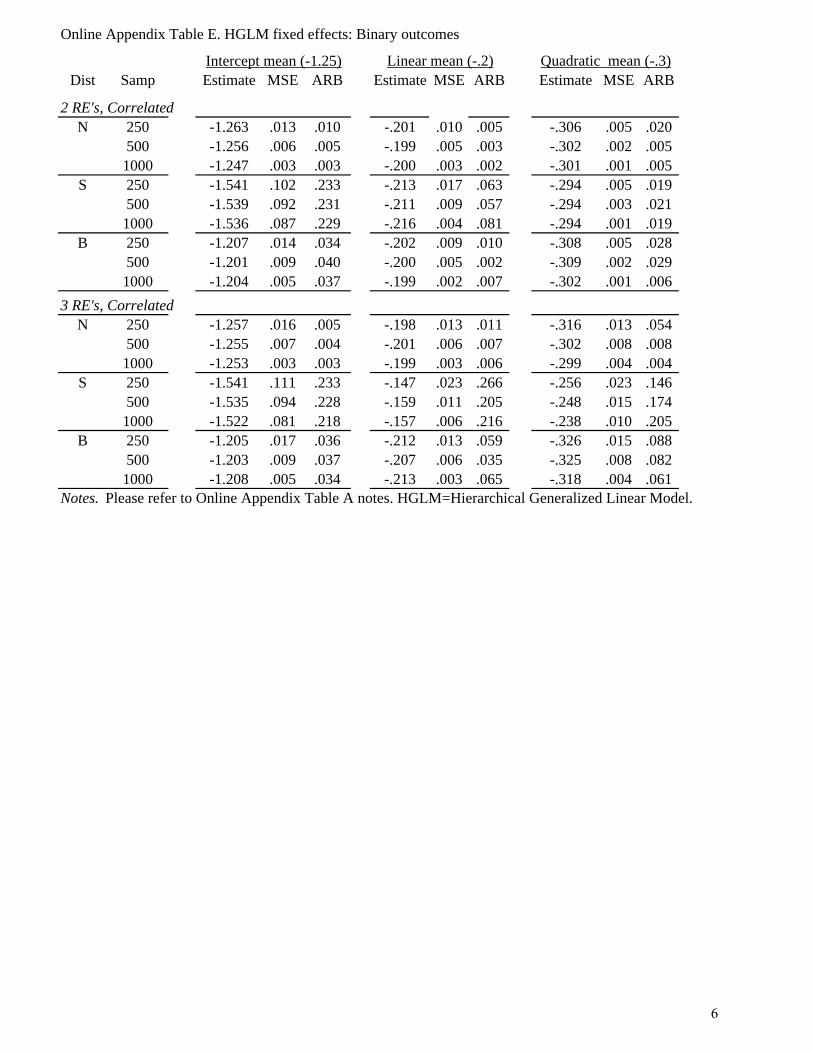
Online Appendix Table E. HGLM fixed effects: Binary outcomes
Dist Samp Estimate MSE ARB Estimate MSE ARB Estimate MSE ARB
2 RE's, CorrelatedN 250 -1.263 .013 .010 -.201 .010 .005 -.306 .005 .020
500 -1.256 .006 .005 -.199 .005 .003 -.302 .002 .0051000 -1.247 .003 .003 -.200 .003 .002 -.301 .001 .005
S 250 -1.541 .102 .233 -.213 .017 .063 -.294 .005 .019500 -1.539 .092 .231 -.211 .009 .057 -.294 .003 .021
1000 -1.536 .087 .229 -.216 .004 .081 -.294 .001 .019B 250 -1.207 .014 .034 -.202 .009 .010 -.308 .005 .028
500 -1.201 .009 .040 -.200 .005 .002 -.309 .002 .0291000 -1.204 .005 .037 -.199 .002 .007 -.302 .001 .006
3 RE's, CorrelatedN 250 -1.257 .016 .005 -.198 .013 .011 -.316 .013 .054
500 -1.255 .007 .004 -.201 .006 .007 -.302 .008 .0081000 -1.253 .003 .003 -.199 .003 .006 -.299 .004 .004
S 250 -1.541 .111 .233 -.147 .023 .266 -.256 .023 .146500 -1.535 .094 .228 -.159 .011 .205 -.248 .015 .174
1000 -1.522 .081 .218 -.157 .006 .216 -.238 .010 .205B 250 -1.205 .017 .036 -.212 .013 .059 -.326 .015 .088
500 -1.203 .009 .037 -.207 .006 .035 -.325 .008 .0821000 -1.208 .005 .034 -.213 .003 .065 -.318 .004 .061
Notes. Please refer to Online Appendix Table A notes. HGLM=Hierarchical Generalized Linear Model.
Intercept mean (-1.25) Linear mean (-.2) Quadratic mean (-.3)
6

Online Appendix Table F. Generalizability checks.SPGM-approximated vs. HGLM fixed effects and random effect variances: Less-sparse binary outcomes, N=1000
Fitted BestDist. Model BIC Estimate MSE ARB Estimate MSE ARB Estimate MSE ARB Estimate MSE ARB Estimate MSE ARB Estimate MSE ARB
1 REN SPGM 3 .015 .002 .015 -.199 .003 .006 -.299 .002 .004 .813 .045 .187N HGLM .001 .002 .001 -.202 .000 .012 -.299 .000 .003 .998 .006 .002S SPGM 3 -.024 .004 .024 -.210 .007 .051 -.291 .002 .028 .804 .135 .196S HGLM -.099 .011 .079 -.197 .000 .015 -.298 .000 .007 .911 .013 .089B SPGM 3 .008 .002 .008 -.204 .005 .021 -.302 .003 .006 .901 .024 .099B HGLM -.005 .002 .004 -.204 .000 .018 -.303 .000 .010 1.198 .045 .198
2 RE, UncorrelatedN SPGM 4 .014 .002 .014 -.189 .005 .053 -.288 .005 .041 .820 .044 .180 .118 .045 .216N HGLM .002 .002 .002 -.199 .001 .005 -.300 .001 .001 1.004 .006 .004 .151 .001 .006S SPGM 4 -.024 .007 .024 -.200 .011 .002 -.276 .004 .080 .834 .450 .166 .206 1.093 .373S HGLM -.101 .010 .081 -.186 .000 .073 -.267 .001 .110 .822 .032 .178 .119 .001 .210B SPGM 4 .014 .005 .014 -.208 .016 .038 -.276 .006 .082 .962 .401 .038 .251 1.980 .673B HGLM -.003 .002 .002 -.203 .001 .015 -.304 .001 .012 1.192 .046 .192 .154 .001 .029
3 RE, UncorrelatedN SPGM 4 -.006 .003 .006 -.177 .004 .114 -.255 .007 .150 .771 .096 .229 .104 .119 .310 .062 .123 .487N HGLM -.001 .002 .001 -.200 .001 .000 -.301 .001 .002 .998 .007 .002 .150 .001 .001 .123 .001 .023S SPGM 4 -.047 .005 .047 -.187 .006 .066 -.245 .008 .182 .714 .156 .286 .132 .295 .119 .053 .052 .555S HGLM -.103 .012 .082 -.199 .001 .005 -.283 .001 .057 .869 .023 .131 .147 .001 .022 .134 .002 .115B SPGM 4 -.004 .003 .004 -.179 .015 .105 -.249 .021 .171 .875 .111 .125 .184 1.423 .224 .146 1.715 .215B HGLM -.001 .002 .001 -.202 .001 .011 -.303 .001 .010 1.188 .044 .188 .152 .001 .012 .118 .001 .021
Notes. Dist=Random effect distribution condition: (N=normal, S=skewed, or B=bimodal); RE=random effect; MSE=mean squared error; ARB=absolute relative bias;BIC=Bayesian Information Criteria; HGLM=hierarchical generalized linear model; SPGM=semiparametric groups-based trajectory model.
Linear variance (.15) Quadratic var. (.12)Intercept mean (0) Linear mean (-.2) Quadratic mean (-.3) Intercept variance (1.0)
7

Online Appendix Table G. Generalizability checks.HLM and HGLM fixed effects and random effect variances: All nonnormal random effects (3 uncorrelated random effect condition)
Dist. Samp Estimate MSE ARB Estimate MSE ARB Estimate MSE ARB Estimate MSE ARB Estimate MSE ARB Estimate MSE ARB
Continuous Repeated MeasuresSSS 250 -1.254 .005 .003 -.199 .001 .006 -.302 .001 .007 .988 .026 .012 .150 .001 .001 .117 .001 .029
500 -1.248 .002 .002 -.198 .001 .008 -.299 .001 .003 .997 .014 .003 .150 .001 .001 .120 .000 .0031000 -1.250 .001 .000 -.200 .000 .001 -.300 .000 .001 .994 .006 .006 .149 .000 .008 .121 .000 .005
BBB 250 -1.249 .006 .000 -.197 .001 .013 -.301 .001 .004 .993 .008 .007 .150 .001 .003 .119 .001 .010500 -1.246 .006 .004 -.200 .001 .001 -.301 .001 .005 .993 .006 .007 .149 .000 .009 .120 .000 .0011000 -1.248 .001 .002 -.200 .000 .000 -.300 .000 .001 .999 .002 .001 .149 .000 .003 .120 .000 .002
Binary Repeated MeasuresSSS 250 -1.514 .090 .211 -.192 .004 .040 -.324 .015 .080 1.645 .585 .645 .149 .008 .006 .192 .022 .601
500 -1.505 .074 .204 -.196 .002 .018 -.317 .006 .058 1.641 .489 .641 .148 .004 .011 .190 .013 .5811000 -1.506 .070 .204 -.198 .001 .008 -.314 .003 .048 1.633 .438 .633 .144 .002 .043 .184 .008 .530
BBB 250 -1.208 .014 .033 -.198 .004 .009 -.317 .010 .058 .978 .044 .022 .161 .007 .075 .123 .008 .025500 -1.213 .008 .030 -.197 .002 .014 -.308 .006 .027 .979 .019 .021 .159 .003 .059 .125 .004 .0431000 -1.207 .005 .034 -.200 .001 .001 -.302 .003 .006 .962 .011 .038 .157 .002 .048 .117 .002 .022
Notes. Dist=Random effect distribution condition: (SSS=skewed, skewed, skewed, or BBB=bimodal, bimodal, bimodal); RE=random effect; error; ARB=absolute relativebias; MSE=mean squared error; HGLM=hierarchical generalized linear model; HLM=hierarchical linear model.
Linear variance (.15) Quadratic var. (.12)Intercept mean (-1.25) Linear mean (-.2) Quadratic mean (-.3) Intercept variance (1.0)
8

Online Appendix Figure A. Generalizability checks. SPGM approximation: PDF of a single dimension random effect distribution for binary repeated measures: N=1000, intercept mean=0.
1 Normal random effect (mean=0) 1 Skewed random effect (mean=0) 1 Bimodal random effect (mean=0)
Notes. Grey line= theoretical (true) random effect distribution. Black bars= SPGM discrete approximation. The number of bars corresponds with the best-BIC number of classes. The height of each bar is the across-samples average class probability for that class, and the location of each bar is the across-samples average growth coefficient for that class.
Con
tinu
ous
Out
com
e L
ess-
Spa
rse
Bin
ary
Out
com
es c
ondi
tion
9
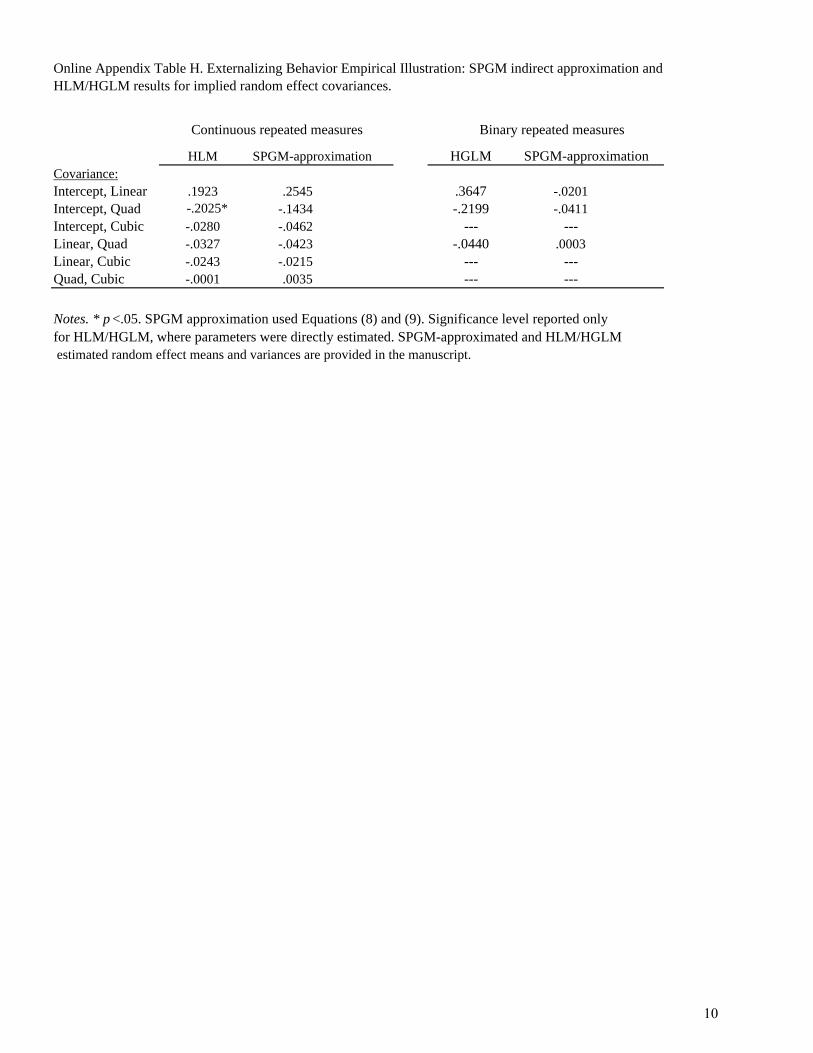
Online Appendix Table H. Externalizing Behavior Empirical Illustration: SPGM indirect approximation and HLM/HGLM results for implied random effect covariances.
HLM HGLM SPGM-approximationCovariance:Intercept, Linear .1923 .2545 .3647 -.0201Intercept, Quad '-.2025* -.1434 -.2199 -.0411Intercept, Cubic -.0280 -.0462 --- ---Linear, Quad -.0327 -.0423 -.0440 .0003Linear, Cubic -.0243 -.0215 --- ---Quad, Cubic -.0001 .0035 --- ---
Notes. * p <.05. SPGM approximation used Equations (8) and (9). Significance level reported only for HLM/HGLM, where parameters were directly estimated. SPGM-approximated and HLM/HGLM estimated random effect means and variances are provided in the manuscript.
Continuous repeated measures
SPGM-approximation
Binary repeated measures
10
Reference
BIC to select
K?
Conditional response
distribution N
1
Anderson, K., Ramob, D., Cumminsc, K. and Brown, S. (2010). Alcohol and drug involvement after adolescent treatment and functioning during emerging adulthood. Drug and Alcohol Dependence, 107, 171-181.
no count 171
2
Barker, E.D., Seguin, J.R., White, H.R., Bates, M.E., Lacourse, E., Carbonneau, R., & Tremblay, R.E. (2007). Developmental trajectories of male physical violence and theft relations to neurocognitive performance. Archives of General Psychiatry, 64 , 592-599. yes count 698
3Bauer, D.J. & McNaughton Reyes, H.L. (2010). Modeling variability in individual development: Differences of degree or kind? Child Development Perspectives, 4, 114–122. no normal 893
4
Beyers, W., Seiffge-Krenke, I. (2007). Are friends and romantic partners the “best medicine”? How the quality of other close relations mediates the impact of changing family relationships on adjustment. International Journal of Behavioral Development , 31 , 559–568. no normal 228
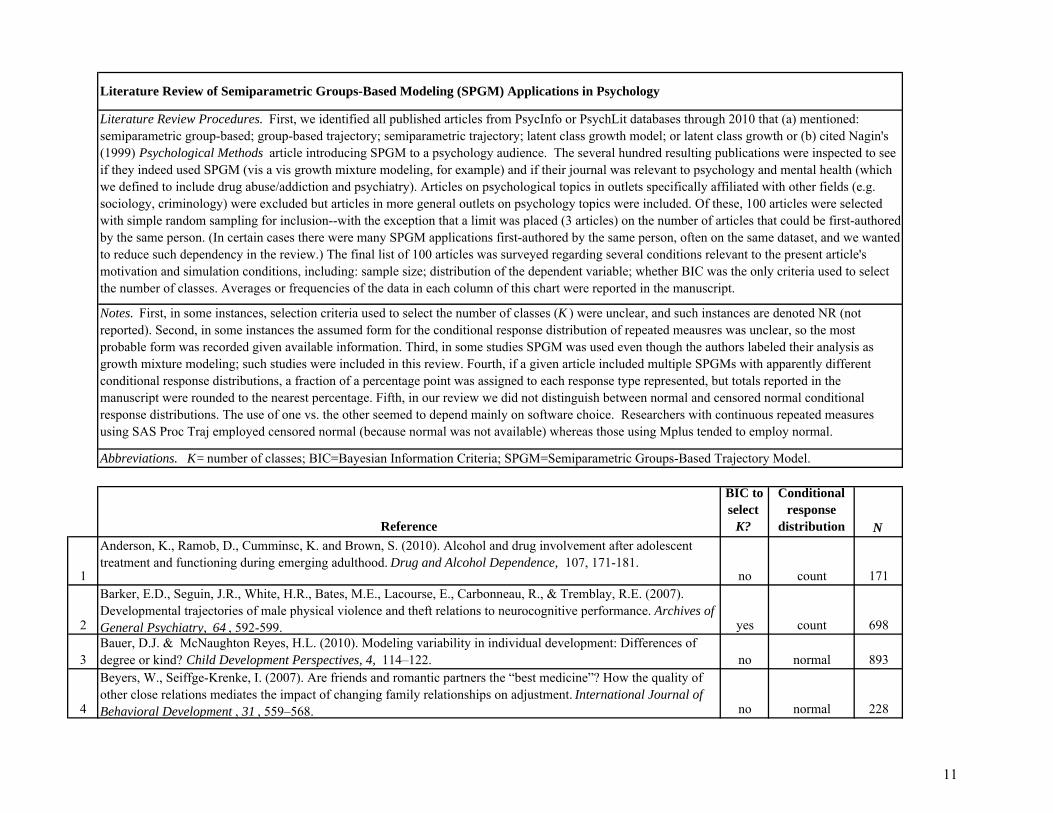
Literature Review of Semiparametric Groups-Based Modeling (SPGM) Applications in Psychology
Literature Review Procedures. First, we identified all published articles from PsycInfo or PsychLit databases through 2010 that (a) mentioned: semiparametric group-based; group-based trajectory; semiparametric trajectory; latent class growth model; or latent class growth or (b) cited Nagin's (1999) Psychological Methods article introducing SPGM to a psychology audience. The several hundred resulting publications were inspected to see if they indeed used SPGM (vis a vis growth mixture modeling, for example) and if their journal was relevant to psychology and mental health (which we defined to include drug abuse/addiction and psychiatry). Articles on psychological topics in outlets specifically affiliated with other fields (e.g. sociology, criminology) were excluded but articles in more general outlets on psychology topics were included. Of these, 100 articles were selected with simple random sampling for inclusion--with the exception that a limit was placed (3 articles) on the number of articles that could be first-authored by the same person. (In certain cases there were many SPGM applications first-authored by the same person, often on the same dataset, and we wanted to reduce such dependency in the review.) The final list of 100 articles was surveyed regarding several conditions relevant to the present article's motivation and simulation conditions, including: sample size; distribution of the dependent variable; whether BIC was the only criteria used to select the number of classes. Averages or frequencies of the data in each column of this chart were reported in the manuscript.
Abbreviations. K= number of classes; BIC=Bayesian Information Criteria; SPGM=Semiparametric Groups-Based Trajectory Model.
Notes. First, in some instances, selection criteria used to select the number of classes (K ) were unclear, and such instances are denoted NR (not reported). Second, in some instances the assumed form for the conditional response distribution of repeated meausres was unclear, so the most probable form was recorded given available information. Third, in some studies SPGM was used even though the authors labeled their analysis as growth mixture modeling; such studies were included in this review. Fourth, if a given article included multiple SPGMs with apparently different conditional response distributions, a fraction of a percentage point was assigned to each response type represented, but totals reported in the manuscript were rounded to the nearest percentage. Fifth, in our review we did not distinguish between normal and censored normal conditional response distributions. The use of one vs. the other seemed to depend mainly on software choice. Researchers with continuous repeated measures using SAS Proc Traj employed censored normal (because normal was not available) whereas those using Mplus tended to employ normal.
11

5
Biggs, B.K., Vernberg, E., Little, T.D., Dill, E.J., Fonagy, P. & Twemlow, S.W. (2010). Peer victimization trajectories and their association with children's affect in late elementary school. International Journal of Behavioral Development , 34, 136-146. NR normal 1528
6Bobo, J.K., Klepinger, D.H., Dong, F.B. (2007). Identifying social drinkers likely to consume alcohol during pregnancy: Findings from a prospective cohort study. Psychological Reports , 101, 857-870. yes binary 754
7
Boivin, M., Petitclerc, A., Feng, B. & Barker, E. (2010). The developmental trajectories of peer victimization in middle to late childhood and the changing nature of their behaviroal correlates. Merrill-Palmer Quarterly , 56, 231-260 no normal 727
8Bongers, I., Koot, H., van der Ende, J., Verhulst, F.C. (2004) Developmental trajectories of externalizing behaviors in childhood and adolescence. Child Development , 75, 1523-1537. yes count 2076
9Brame, B., Nagin, D.S. & Tremblay, R.E. (2001). Developmental trajectories of physical aggression from school entry to late adolescence. Journal of Child Psychology and Psychiatry , 42, 503-512. yes count 926
10
Brendgen, M., Vitaro, F., Bukowski, W.M., Doyle, A.B., & Markiewicz, D. (2001). Developmental profiles of peer social preference over the course of elementary school: Associations with trajectories of externalizing and internalizing behavior. Developmental Psychology, 37, 308-320. yes normal 299
11
Le Brocque, R.M., Hendrikz, J. & Kenardy, J.A. (2010). The course of posttraumatic stress in children: Examination of recovery trajectories following traumatic injury. Journal of Pediatric Psychology, 35, 637–645.
yes normal 190
12
Broidy, L.M., Nagin, D.S., Tremblay, R.E., Bates, J.E., Brame, B., Dodge, K.A., Fergusson, D., Horwood, J.L., Loeber, R., Laird, R., Lynam, D.R., Moffitt, T.E., Pettit, G.S., & Vitaro, F. (2003). Developmental trajectories of childhood disruptive behaviors and adolescent delinquency: A six-site cross-national study. Developmental Psychology , 39, 222-245. yes count
range: 585- 2000
13Buchy, L., Bodnar, M., Malla, A., Joober, R. & Lepage, M. (2010) A 12-month outcome study of insight and symptom change in first-episode psychosis, Early Intervention in Psychiatry , 4, 79-88. yes normal 165
14
Campbell, S.B., Matestic, P., von Stauffenberg, C., Mohan, R. & Kirchner, T. (2007). Trajectories of maternal depressive symptoms, maternal sensitivity, and children’s functioning at school entry. Developmental Psychology, 43, 1202-1215. yes normal 1261
15
Campbell, S.B., Spieker, S., Vandergrift, N., Belsky, J., Burchinal, M. & The NICHD Early Child Care Research Network. (2000). Predictors and sequelae of trajectories of physical aggression in school-age boys and girls. Development and Psychopathology , 22, 133-150. yes count 1,081
16
Carrasco, M., Barker, E.D., Tremblay, R.E. & Vitaro, F. (2006). Eysenck’s personality dimensions as predictors of male adolescent trajectories of physical aggression, theft and vandalism. Personality and Individual Differences, 41, 1309-1320. yes normal 868
17
Chassin, L., Pitts, S.C., Prost, J. (2002). Binge Drinking Trajectories From Adolescence to Emerging Adulthood in a High-Risk Sample: Predictors and Substance Abuse Outcomes. Journal of Consulting and Clinical Psychology, 70 , 67-78. yes count 446
18Chi, F. & Weisner, C. (2008). Nine-year psychiatric trajectories and substance use outcomes an application of the group-based modeling approach. Evaluation Review, 32, 39-58. yes normal 934
19Constantino, M. & Smith-Hansen, L. (2008) Patient interpersonal factors and the therapeutic alliance in two treatments for bulimia nervosa. Psychotherapy Research, 18, 683-698. yes normal 207
12

20Costello, D.M. Dierker, L.C., Jones, B.J., & Rose, J.S. (2008). Trajectories of smoking from adolescence to early adulthood and their psychosocial risk factors. Health Psychology, 27 , 811-818. yes count 5,789
21
Cote, S.M., Boivin, M., Liu, X., Nagin, D.S., Zoccolillo, M., & Tremblay, R.E. (2009). Depression and anxiety symptoms: onset, developmental course and risk factors during early childhood. Journal of Child Psychology and Psychiatry, 50 , 1201-1208. yes normal 1759
22
Cote, S., Tremblay, R.E., Nagin, D., Zoccolillo, M. & Vitaro, F.(2002). The development of impulsivity, fearfulness, and helpfulness during childhood: patterns of consistency and change in the trajectories of boys and girls. Journal of Child Psychology and Psychiatry, 43 , 609–618. yes normal 1865
23
Dekker, M.C., Ferdinand, R.F., van Lang, N., Bongers, I., van der Ende, J., Verhulst, F.C. (2007). Developmental trajectories of depressive symptoms from early childhood to late adolescence: gender differences and adult outcome. Journal of Child Psychology and Psychiatry, 48, 657–666. yes normal 2076
24Delucchi, K.L., Matzger, H. & Weisner, C. (2004). Dependent and problem drinking over 5 years: A latent class analysis. Drug and Alcohol Dependence, 74 , 235-244. yes normal 1094
25
Duchesne, S., Ratelle, C.F., Larose, S., Guay, F. (2007). Adjustment trajectories in college science programs: Perceptions of qualities of parents’ and college teachers’ relationships. Journal of Counseling Psychology, 54 , 62-71 . yes normal 498
26Falck, R.S., Wang, J. & Carlson, R.G. (2007).Crack cocaine trajectories among users in a midwestern American city. Addiction, 102 , 1421–1431. yes binary 401
27
Feldman, B.J., Masyn, K.E. & Conger, R.D. (2009). New approaches to studying problem behaviors: A comparison of methods for modeling longitudinal, categorical adolescent drinking data. Developmental Psychology, 45 , 652–676. no
binary; ordinal discussed 451
28Feng, X., Shaw, D.S., and Silk, J.S. (2008). Developmental trajectories of anxiety symptoms among boys across early and middle childhood. Journal of Abnormal Psychology,117 , 32–47. yes normal 290
29
Flory, K., Lynam, D., Milich, R., Leukefeld, C., Clayton, R. (2004). Early adolescent through young adult alcohol and marijuana use trajectories: Early predictors, young adult outcomes, and predictive utility. Development and Psychopathology, 16 , 193–213. yes normal 481
30Gaudreau, P., Amiot, C.E., & Vallerand, R.J. (2009). Trajectories of affective states in adolescent hockey players: Turning point and motivational antecedents. Developmental Psychology, 45 , 307-319. yes normal 265
31
Gross, H.E., Shaw, D.S., Burwell, R.A., & Nagin, D.S.(2009). Transactional processes in child disruptive behavior and maternal depression: A longitudinal study from early childhood to adolescence. Development and Psychopathology, 21 , 139–156. yes normal 289
32
Halliday-Boykins, C.A., Henggeler, S.W., Rowland, M.D., & DeLucia, C. (2004). Heterogeneity in youth symptom trajectories following psychiatric crisis: Predictors and placement outcomes. Journal of Consulting and Clinical Psychology, 72 , 993–1003. yes normal 156
33
Harachi, T.W., Fleming, C.B., White, H.R., Ensminger, M.E., Abbott, R.D., Catalano, R.F., Haggerty, K.P. (2006). Aggressive behavior among girls and boys during middle childhood: Predictors and sequelae of trajectory group membership. Aggressive Behavior , 32, 279-293. yes normal
523; 461
34
Haviland, A., Nagin, D.S., Rosenbaum, P.R., & Tremblay, R.E. (2008).Combining group-based trajectory modeling and propensity score matching for causal inferences in nonexperimental longitudinal data. Developmental Psychology, 44 , 422-436. yes count 1037
13

35Higgins, G.E., Jennings, W.G., & Mahoney, M. (2010). Developmental trajectories of maternal and paternal attachment and delinquency in adolescence. Deviant Behavior, 31, 655–677. yes normal 383
36
Hill, K.G., White, H.R., Chung, I., Hawkins, J.D. & Catalano, R.F. (2000). Early adult outcomes of adolescent binge drinking: Person- and variable-centered analyses of binge drinking trajectories. Alcoholism: Clinical and Experimental Research, 24, 892-901. yes count 808
37
Huijbregts, S., Seguin, J.R., Zoccolillo, M., Boivin, M. & Tremblay, R.E. (2008). Maternal prenatal smoking, parental antisocial behavior, and early childhood physical aggression. Development and Psychopathology, 20 , 437–453. yes count 1,745
38Hynes, K. & Clarkberg, M. (2005). Women’s employment patterns during early parenthood: A group-based trajectory analysis. Journal of Marriage and Famil y, 67, 222–239. yes binary 2,093
39
Jackson, K.M. & Sher, K.J. (2008). Comparison of longitudinal phenotypes based on alternate heavy drinking cut Scores: A systematic comparison of trajectory approaches III. Psychology of Addictive Behaviors, 22 , 198–209.
no binary 3,720
40Johnsson, K.O., Leifman, A., Berglund, M. (2008). College students’ drinking patterns: Trajectories of AUDIT scores during the first four years. European Addiction Research, 14 , 11–18. yes normal 359
41
Jones, D.J., Runyan, D.K., Lewis, T., Litrownik, Black, M.M., Wiley, T., English, D.E. Proctor, L.J., Jones, B.L., Nagin, D.S. (2010). Trajectories of childhood sexual abuse and early adolescent HIV/AIDS risk behaviors: The role of other maltreatment, witnessed violence, and child gender. Journal of Clinical Child & Adolescent Psychology, 39 , 667–680. yes binary; count 844
42
Kaskutas, L.A., Ammon, L., Delucchi, K., Room, R., Bond, J., and Weisner, C. (2005). Alcoholics anonymous careers: Patterns of AA involvement five years after treatment entry. Alcoholism: Clinical and Experimental Research, 29 , 1983-1990. yes count 349
43Klimstra, T.A., Hale, W.W., Raaijmakers, Q., Branje, S., & Meeus, W. (2010). A developmental typology of adolescent personality. European Journal of Personality, 24 , 309–323. no normal 923
44
Kokko, K., Tremblay, R.E., Lacourse, E., Nagin, D.S. & Vitaro, F. (2006) Trajectories of prosocial behavior and physical aggression in middle childhood: Links to adolescent school dropout and physical violence. Journal of Research on Adolescence, 16 , 403-428. yes normal 1,037
45Lacourse, E., Cote, S., Nagin, D., Vitaro, F., Brendgen, M. & Tremblay, R. (2002). A longitudinal–experimental approach to testing theories of antisocial behavior development. Development and Psychopathology , 14, 909–924. yes count 909
46
Lacourse, E., Nagin, D., Tremblay, R.E., Vitaro, F. & Claes, M. (2003). Developmental trajectories of boys’ delinquent group membership and facilitation of violent behaviors during adolescence. Development and Psychopathology , 15, 183–197. yes binary 969
47
Lahey, B.B., Van Hulle, C.A., Waldman, I.D., Rogers, J.L., D'Onofrio, B.M., Pedlow, S., Rathouz, P. & Keenan, K. (2006). Testing descriptive hypotheses regarding sex differences in the development of conduct problems and delinquency. Journal of Abnormal Child Psychology, 34, 737–755. yes count 4,572
48
Laird, R.D., Criss, M.M. Pettit, G.S., Dodge, K.A., & Bates, J.E. (2008). Parents’ monitoring knowledge attenuates the link between antisocial friends and adolescent delinquent behavior. Journal of Abnormal Child Psychology, 36 , 299–310. yes normal 504
14

49
Lansford, J.E., Criss, M.M., Dodge, K.A., Shaw, D.S., Pettit, G.S. & Bates, J.E. (2009). Trajectories of physical discipline: Early childhood antecedents and developmental outcomes. Child Development, 80 , 1385–1402.
yes normal499; 258
50
Leblanc, N., Boivin, M., Dionne, G., Brendgen, M., Vitaro, F., Tremblay, R.E., & Perusse, D. (2008). The development of hyperactive–impulsive behaviors during the preschool years: The predictive validity of parental assessments. Journal of Abnormal Child Psychology, 36, 977–987. yes normal 1,112
51
Lee, B.R. & Thompson, R. (2009). Examining externalizing behavior trajectories of youthin group homes: Is there evidence for peer contagion? Journal of Abnormal Child Psychology, 37, 31–44. no count 744
52Letcher, P., Smart, D., Sanson, A., & Toumbourou, J.W. (2009). Psychosocial precursors and correlates of differing internalizing trajectories from 3 to 15 Years. Social Development, 18 , 618-646. yes normal
874; 810
53
Losoya, S.H., Knight, G.P., Chassin, L., Little, M., Vargas-Chanes, O., Mauricio, A., & Piquero, A. (2008) Trajectories of acculturation and enculturation in relation to heavy episodic drinking and marijuana use in a sample of Mexican American serious juvenile offenders. Journal of Drug Issues, 1 , 171-198. no normal 332
54
Louvet, B., Gaudreau, P., Menaut, A., Genty, J., & Deneuve, P. (2007). Longitudinal patterns of stability and change in coping across three competitions: A latent class growth analysis. Journal of Sport & Exercise Psychology, 29 , 100-117. yes normal 107
55
Luyckx, K., Schwartz, S.J., Goossens, L., Soenens, B. & Beyers, W. (2008). Developmental typologies of identity formation and adjustment in female emerging adults: A latent class growth analysis approach. Journal of Research on Adolescence, 18 , 595–619. no normal 428
56
Lynne-Landsman, S.D., Graber, J.A., Andrews, J.A., (2010). Do trajectories of household risk in childhood moderate pubertal timing effects on substance initiation in middle school? Developmental Psychology,46, 853–868.
yes normal 1070
57
Maggi, S., Hertzman, C., Vaillancourt, T. (2007) Changes in smoking behaviors from late childhood to adolescence: Insights from the Canadian national longitudinal survey of children and youth. Health Psychology, 26, 232-240. yes binary; count
260; 280; 2886
58
Marmorstein, N.R., White, H., Chung, T., Hipwell, A. Stouthamer-Loeber, M. and Loeber, R. (2010). Associations between first use of substances and change in internalizing symptoms among girls: Differences by symptom trajectory and substance use type. Journal of Clinical Child & Adolescent Psychology, 39 , 545–558.
no normal 2299
59
Mazza, J.J., Fleming, C.B., Abbott, R.D., Haggerty, K.P. & Catalano. (2010) Identifying trajectories of adolescents’ depressive phenomena: An examination of early risk factors. Journal of Youth and Adolescence, 39 , 579-593.
yes normal440; 511
60
McDevitt-Murphy, M.E., Parra, G.R., Shea, M.R., & Yen, S., Grilo, C.M., Sanislow, C.A., McGlashan, T.H., Gunderson, J.G., Skodol, A.E., Markowitz, J.C. (2009). Trajectories of PTSD and substance use disorders in a longitudinal study of personality disorders. Psychological Trauma: Theory, Research, Practice, and Policy, 1 , 269–281. no binary 668
61Moilanen, K.L., Crockett, L.J., Raffaelli, M., & Jones, B.L. (2010). Trajectories of sexual risk from middle adolescence to early adulthood. Journal of Research on Adolescence, 20 , 114–139. no normal 1121
15

62
Morgan-Lopez, A.A., Cluff, L.A., Fals-Stewart, W. (2009). Capturing the impact of membership turnover in small groups via latent class growth analysis: Modeling the rise of the New York Knicks of the 1960s and 1970s. Group Dynamics, 13 , 120-132. yes normal 118
63
Mulvey, E.P., Steinberg, L., Piquero, A.R., Besana, M., Fagan, J., Schubert, C. & Cauffman, E. (2010). Trajectories of desistance and continuity in antisocial behavior following court adjudication among serious adolescent offenders. Development and Psychopathology, 22 , 453–475. yes count 1119
64
Murphy, D.A., Brecht, M.L., Herbeck, D.M., Huang, D. (2009). Trajectories of HIV risk behavior from age 15 to 25 in the National Longitudinal Survey of Youth sample. Journal of Youth Adolescence, 38 , 1226–1239.
yes normal4169; 4039
65Mustillo, S., Worthman, S., Erkanli, A., Keeler, G. Angold, A., Costello, E.J. (2003). Obesity and Psychiatric Disorder: Developmental Trajectories. Pediatrics, 111 , 851-859. yes binary 991
66Nagin, D.S. & Odgers, C.L. (2010). Group-based trajectory modeling in clinical research. Annual Review of Clinical Psychology, 6 , 109–138. no count 1037
67
Nagin, D. & Tremblay, R.E (1999). Trajectories of boys' physical aggression, opposition, and hyperactivity on the path to physically violent and nonviolent juvenile delinquency. Child Development, 70 , 1181-1196.
yes normal 1037
68
Nagin, D.S. & Tremblay, R.E. (2005). What has been learned from group-based trajectory modeling? Examples from physical aggression and other problem behaviors. The Annals of the American Academy of Political and Social Science, 602 , 82-117. no
binary; count; normal various
69
Nash, J.K. & Kim, J.S. (2007). Patterns of change over time in beliefs legitimizing aggression in adolescents and young adults: Risk trajectories and their relationship with serious aggression. Social Work Research, 31 , 231-240.
yes normal 1227
70Nash, J.K., Thompson, S., & Kim, J.S. (2006). Residential trajectories of participants in North Carolina's Willie-M. Program. Journal of Social Service Research, 33, 53-68. yes normal 611
71
Oberlander, S.E., Agostini, W., Houston, A., Black, W. (2010). A seven-year investigation of marital expectations and marriage among urban, low-Income, African American adolescent mothers. Journal of Family Psychology, 24 , 31–40. yes normal 181
72Obradovic, J., Burt, K.B., & Masten, A.S. (2006). Pathways of adaptation from adolescence to young adulthood antecedents and correlates. Annals of the New York Academy of Sciences, 1094 , 340–344. yes normal 205
73
Odgers, C.L., Moffitt, T.E., Broadbent, J.M., Dickson, N., Hancox, R.J., Harrington, H., Poulton, R., Sears, M.R., Thomson, W. & Caspi, A. (2008). Female and male antisocial trajectories: From childhood origins to adult outcomes. Development and Psychopathology, 20, 673–716. no normal
494; 526
74
Otten, R., Wanner, B., Vitaro, F., & Engels, R. (2008). Own and friends’ smoking attitudes and social preference as early predictors of adolescent smoking. Journal of Clinical Child & Adolescent Psychology , 37, 808–819.
yes count 203
75
Paciello, M., Fida, R., Tramontano, C., Lupinetti, C. & Caprara, G. (2008). Stability and change of moral disengagement and its impact on aggression and violence in late adolescence. Child Development, 79 , 1288 – 1309.
yes normal 366
76 Pepler, D., Jiang, D., Craig, W., Connolly, J. (2008). Developmental trajectories of bullying and associated factors. Child Development,79 , 325 – 338. yes normal 871
16

77
Petitclerc, A., Boivin, M. Dionne, G. Zoccolillo, M. & Tremblay, R. (2009). Disregard for rules: the early development and predictors of a specific dimension of disruptive behavior disorders. Journal of Child Psychology and Psychiatry, 50 , 1477–1484. yes normal 1942
78
Piquero, A.R., Blumstein, A., Brame, R., Haapanen, R., Mulvey, E.P., & Nagin, D.S. (2001). Assessing the impact of exposure time and incapacitation on longitudinal trajectories of criminal offending. Journal of Adolescent Research, 16, 154-174. yes count 277
79
Ramos-Marcusea, F., Oberlanderb, S.E., Papasb, M.A., McNaryc, S.W., Hurleyb, S. and Blackb, M.M. (2010). Stability of maternal depressive symptoms among urban, low-income, African American adolescent mothers. Journal of Affective Disorders, 122 , 68-75. yes normal 181
80
Ratelle, C.F., Guay, F., Larose, S. & Seneca, C. (2004). Family correlates of trajectories of academic motivation during a school transition: A semiparametric group-based approach. Journal of Educational Psychology, 96 , 743–754. yes normal 729
81Reinecke, J. (2006). Longitudinal analysis of adolescents’ deviant and delinquent behavior: applications of latent class growth curves and growth mixture models, Methodology 2, 100-112. no count 813
82Romens, S.E., Abramson, L.Y., & Alloy, L.B. (2009). High and low cognitive risk for depression: Stability from late adolescence to early adulthood. Cognitive Therapy and Research, 33 , 480–498. yes normal 345
83
Sablonniere, R., Taylor, D., Perozzo, C. & sadykova, N. (2009). Reconceptualizing relative deprivation in the context of dramatic social change: the challenge confronting the people of Kyrgyzstan. European Journal of Social Psychology, 39 , 325–345. NR normal 565
84
Sallinen, M., Ronka, A., Kinnunen, U. & Kokko, K. (2007). Trajectories of depressive mood in adolescents: Does parental work or parent–adolescent relationship matter? A follow-up study through junior high school in Finland. International Journal of Behavioral Development , 31, 181–190. yes normal 116
85
Segawa, E., Ngwe, J.E., Li, Y., Flay, B. & Aban Aya Coinvestigators. (2005). Evaluation of the effects of the Aban Aya Youth Project in reducing violence among African American adolescent males using latent class growth mixture modeling techniques, Evaluation Review, 29, 128-148. yes normal 552
86Shaw, D.S., Lacourse, E. & Nagin, D.S. (2005). Developmental trajectories of conduct problems and hyperactivity from ages 2 to 10, Journal of Child Psychology and Psychiatry, 46, 931–942. yes normal 284
87Shaw, D.S., Gilliom, M. Ingoldsby, E. & Nagin, D.S. (2003). Trajectories leading to school-age conduct problems. Developmental Psychology, 39 , 189–200. yes normal 284
88Sher, K.J., Gotham, H.J. & Watson, A.L. (2004). Trajectories of dynamic predictors ofdisorder: Their meanings and implications. Development and Psychopathology, 16 , 825–856. no binary 336
89
Suarez-Orozco, C., Gaytan, F., Bang, H., Pakes, J., O'Connor, E., Rhodes, J. (2010). Academic trajectories of newcomer youth. Developmental Psychology, 46 , 602-618. yes normal 407
90
Torppa, M., Poikkeus, A., Laakso, M., Eklund, K., Lyytinen, H. (2006). Predicting delayed letter knowledge development and its relation to grade 1 reading achievement among children with and without familial risk for dyslexia. Developmental Psychology, 42 , 1128-1142. yes count 186
91
Tucker, J.S., Ellickson, P., Orlando, M., Martino, S. & Klein, D. (2005). Substance use trajectories from early adolescence to emerging adulthood: A comparison of smoking, binge drinking, and marijuana use. Journal of Drug Use, 2 , 307-332. yes count 6,527
17

92Tucker, J.S., Orlando, M., Ellickson, P.L. (2003). Patterns and correlates of binge drinking trajectories from early adolescence to young adulthood. Health Psychology, 22 , 79–87. yes normal 5,694
93Underwood, M.K., Beron, K.J., and Rosen, L. (2009). Continuity and change in social and physical aggression from middle childhood through early adolescence. Aggressive Behavior, 35 , 357–375. yes normal 281
94
Vaillancourt, T., Miller, J.L., Fagbemi, J., Cote, S. & Tremblay, R. (2007). Trajectories and predictors of indirect aggression: Results from a nationally representative longitudinal study of canadian children aged 2–10. Aggressive Behavior, 33, 314–326. yes normal 1,401
95
Van Der Vorst, H., Vermulst, A., Meeus, W., Dekovic, M., & Engels, R. (2009). Identification and prediction of drinking trajectories in early and mid-adolescence. Journal of Clinical Child & Adolescent Psychology, 38 , 329–341. no count 428
96
Vermote, R., Fonagy, P., Vertommen, H., Fonagy, P., Vertommen, H., Verhaest, Y., Stroobants, R., Vandeneede, B., Corveleyn, J., Lowyck, B., Luyten, P., & Peuskens, J. (2009). Outcome and outcome trajectories of personality disordered patients during and after a psychoanalytic hospitalization-based treatment. Journal of Personality Disorders, 23, 294–307. no normal 70
97Vitaro, F., Brendgen, M., Wanner, B. (2005). Patterns of affiliation with delinquent friends during late childhood and early adolescence: Correlates and consequences. Social Development, 14 , 82-108. yes count 376
98Wiesner, M. & Kim, H. (2006). Co-Occurring delinquency and depressive symptoms of adolescent boys and girls: A dual trajectory modeling approach. Developmental Psychology, 42 , 1220–1235. yes normal; count 985
99Xie, H., McHugo, G., He, X., & Drake, R. (2010). Using the group-based dual trajectory model to analyze two related longitudinal outcomes. Journal of Drug Issues, 1 , 45-62. yes normal 223
100
Zhou, Q., Hofer, C. Eisenberg, N., Reiser, M., Spinrad, T., and Fabes, R. (2007). The developmental trajectories of attention focusing, attentional and behavioral persistence, and externalizing problems during school-age years. Developmental Psychology , 43 , 369–385. yes normal 356
18

Calculating SPGM-approximated means and variances of underlying random effects: K=6 class empirical example SAS code %MACRO PALL(K=6); proc iml; alpha_1={5.1853639 -1.4321252 0.25801088 0.11413666}; alpha_2={1.6987561 -.096339802 .037193793 -.013339989}; alpha_3={14.430648 1.0015364 -0.17040364 -0.13718840}; alpha_4={4.1738782 -0.64797717 .0078335891 .010642704}; alpha_5={7.0980349 -1.6577085 0.13105988 .027797890}; alpha_6={9.2412841 0.17286687 -0.16417953 -.039763760}; /*input K vectors of SPGM's class-specific fixed effects*/ prob_c1=0.06582; prob_c2=0.34718; prob_c3=0.03522; prob_c4=0.38566; prob_c5=0.06263; prob_c6=0.10348; /*input K class probabilities*/ alpha=alpha_1//alpha_2//alpha_3//alpha_4//alpha_5//alpha_6; prob=prob_c1||prob_c2||prob_c3||prob_c4||prob_c5||prob_c6; lambda={ 1 -3.5 12.25 -42.875, 1 -2.5 6.25 -15.625, 1 -1 1 -1 , 1 .5 .25 .125, 1 1.5 2.25 3.375, 1 3.5 12.25 42.875}; /*Equation (8) in manuscript*/ mu_growth=prob*alpha; print mu_growth; /*Equation (9) in manuscript*/ VARi=J(4,4,0); /* <--put your implied dimension of u (# underlying random effects) in place of 4*/ %do i= 1 %to &k.; %do j=(&i.+1) %to &k.; q1=(alpha_&i.`); q2=(alpha_&j.`); q3=(q1-q2); q4=(q1-q2)`; vari = vari` +(prob_c&i.*prob_c&j.*(q3*q4)); %end; %end; var_growth_only=(vecdiag(vari))`; covar_growth=vari; print var_growth_only; print covar_growth; QUIT; %mend; %pall(K=6); /*put # of SPGM classes here*/
19