Daylight Glare Probability Measurements And Correlation With ...
14
Purdue University Purdue e-Pubs International High Performance Buildings Conference School of Mechanical Engineering 2014 Daylight Glare Probability Measurements And Correlation With Indoor Illuminances In A Full- Scale Office With Dynamic Shading Controls Iason Konstantzos School of Civil Engineering, Purdue University, 550 Stadium Mall Dr., West Lafayee, IN 47907 USA / Ray W. Herrick Laboratories, School of Mechanical Engineering, Purdue University, 140 S. Martin Jischke Dr., West Lafayee, IN 47907, USA, [email protected] Athanasios Tzempelikos [email protected] Follow this and additional works at: hp://docs.lib.purdue.edu/ihpbc is document has been made available through Purdue e-Pubs, a service of the Purdue University Libraries. Please contact [email protected] for additional information. Complete proceedings may be acquired in print and on CD-ROM directly from the Ray W. Herrick Laboratories at hps://engineering.purdue.edu/ Herrick/Events/orderlit.html Konstantzos, Iason and Tzempelikos, Athanasios, "Daylight Glare Probability Measurements And Correlation With Indoor Illuminances In A Full-Scale Office With Dynamic Shading Controls" (2014). International High Performance Buildings Conference. Paper 147. hp://docs.lib.purdue.edu/ihpbc/147
Transcript of Daylight Glare Probability Measurements And Correlation With ...

Purdue UniversityPurdue e-PubsInternational High Performance BuildingsConference School of Mechanical Engineering
2014
Daylight Glare Probability Measurements AndCorrelation With Indoor Illuminances In A Full-Scale Office With Dynamic Shading ControlsIason KonstantzosSchool of Civil Engineering, Purdue University, 550 Stadium Mall Dr., West Lafayette, IN 47907 USA / Ray W. HerrickLaboratories, School of Mechanical Engineering, Purdue University, 140 S. Martin Jischke Dr., West Lafayette, IN 47907, USA,[email protected]
Athanasios [email protected]
Follow this and additional works at: http://docs.lib.purdue.edu/ihpbc
This document has been made available through Purdue e-Pubs, a service of the Purdue University Libraries. Please contact [email protected] foradditional information.Complete proceedings may be acquired in print and on CD-ROM directly from the Ray W. Herrick Laboratories at https://engineering.purdue.edu/Herrick/Events/orderlit.html
Konstantzos, Iason and Tzempelikos, Athanasios, "Daylight Glare Probability Measurements And Correlation With IndoorIlluminances In A Full-Scale Office With Dynamic Shading Controls" (2014). International High Performance Buildings Conference.Paper 147.http://docs.lib.purdue.edu/ihpbc/147

3575, Page 1
3rd International High Performance Buildings Conference at Purdue, July 14-17, 2014
Daylight Glare Probability measurements and correlation with indoor illuminance in a
full-scale office with dynamic shading controls
Iason Konstantzos1,2*, Athanasios Tzempelikos1,2
1Purdue University, School of Civil Engineering,
West Lafayette, IN, USA 2Ray W. Herrick Laboratories, School of Mechanical Engineering,
West Lafayette, IN, USA
* Corresponding Author
ABSTRACT
Daylight glare evaluation has been the recent focus of research on visual comfort since newer office buildings have
large glass facades offering daylight provision and outdoor views. Available glare indices are related to source
luminance size and location, view direction and background luminance. The Daylight Glare Probability index that
considers vertical illuminance at the eye level, has been identified as one of the reliable metrics, since it was based on
experiments with real human subjects. In this study, extensive experiments were conducted in a full-scale private
office environment with dynamic shading controls, to measure interior luminance and illuminance conditions under
variable sky conditions and shading control strategies. A high dynamic range camera with a fish eye lens was used to
capture the luminance in the field of view, while horizontal and vertical illuminance was measured at different
positions. The images were processed for calculating DGP values based on the “evalglare” method. The results are
used to evaluate the efficiency of control strategies in terms of glare probability, while correlations between indoor
illuminances, sky conditions and DGP may lead to simplified criteria and guidelines for controlling daylight glare in
office spaces. Finally, the experimental results can be used for daylight model validation for spaces with dynamic
facades.
1. INTRODUCTION
The utilization of large glass areas following the architectural trends of the 20th century has increased daylight
availability in office spaces, leading thus to significant advantages in terms of energy savings and occupant satisfaction
However, more daylight is accompanied by increased solar gains and visual discomfort (glare). Glare, defined as the
contrast lowering effect within a visual field due to the presence of bright light sources, has been studied for the past
decades from various scopes and has been quantified using several indices. Daylight Glare Probability or DGP
(Wienold and Christoffersen, 2006) is the most recent index used to evaluate glare from daylight, and it was extracted
by experimental data in private office spaces involving human test subjects. DGP is considered part of the main
climate-based daylight metrics for assessing daylight quality (Cantin and Dubois, 2011) and establishing adaptive
zones (Jakubiec and Reinhart, 2012), although more research is needed to establish appropriate criteria for acceptable
luminance ratios. There has been an extensive amount of literature involving glare, with the majority of studies related
to simulation, usually utilizing Radiance renderings to simulate the visual field. A computational analysis of DGP and
its simplified versions (Kleindienst and Andersen, 2009), with discussion on vertical illuminance and contrast-based
terms, showed that the contrast terms need more detailed analysis, especially under low illuminance conditions.
Mardaljevic et al. (2012) conducted an initial study to relate DGP with a daylight metric such as the useful daylight
illuminances (Nabil and Mardaljevic, 2006), while Araji and Boubekri (2008) linked window size with vertical
illuminance and glare. Fewer studies actually involved experimental glare measurements, investigating the impact of
large area sources (Rodriguez and Pattini, 2014), luminance variation (Kim and Kim, 2012), non-uniform luminance
distributions (Kim and Kim, 2011), identifying modifications in existing glare indices (Fisekis et al., 2003, Nazzal,
2005), or performing case studies using translucent facades (Matusiak, 2013), anidolic daylighting systems with
electric lighting operation (Borisuit et al., 2010) or photovoltaic windows (Cannavalle et al., 2013, Piccolo and
Simone, 2009). The potential effect of different window views on the subjective assessment of discomfort glare can
be significant (Yun et al., 2011, Tuaycharoen and Tregenza, 2007, Shin et al., 2012, Aries et al., 2010). Post-

3575, Page 2
3rd International High Performance Buildings Conference at Purdue, July 14-17, 2014
occupancy studies with measurements and surveys under different sky conditions and façade configurations
emphasize the complexity of assessing glare including occupant preferences (Konis, 2013). As stated by Clear (2013),
more research is needed since evaluating glare in complex scenes may require fundamental changes to the form of the
glare models.
The initial DGP study (Wienold and Christoffersen, 2006) compared discomfort opinions from subjects with
measurements using a CCD luminance camera, recording their field of view in order to extract the DGP index. In a
recent study (Suk and Schiler, 2012), experiments were combined with Radiance simulations in order to investigate
the validation of simulated DGP and illuminance results to the actual measured quantities using an HDR camera, and
to compare different glare indices. Suk et al (2013) also utilized HDR camera measurements to investigate and support
their introduction of the terms of absolute and relative glare factors. Van Den Wymelenberg et al. (2010) performed
a study involving HDR imaging and a survey to investigate details as the appropriate luminance threshold selection
and the correlation of observations to DGP and DGI. Hirning et al. (2014) provided a detailed glare measurement
methodology aiming to explore the differences among glare indexes, in the first large scale survey performed in an
open plan office using camera measurements. Reinhart et al. (2012) provided enlightening methodology details for
glare evaluation using cameras. Inanici and Galvin (2004) and Inanici (2006) extensively studied luminance extraction
from HDR cameras, analyzing related terms as the camera response curve, the vignetting effect and the point spread
functions and evaluated the use of HDR imaging as luminance measurement. HDR photogrammetry protocols are also
discussed by Cai (2013), along with the impact of settings and vignetting effects.
This study presents DGP experimental measurements in full-scale test offices using a HDR camera, including
measurement procedures and HDR image creation and processing. Experimental data were used to develop
correlations between indoor illuminances and DGP parameters, for different shading control strategies. The effects of
the contrast term and vertical illuminance are discussed in this context. Finally, validated models are presented to
assist in model-based glare and luminance mapping, for different façade controls.
2. EXPERIMENTAL METHODOLOGY
2.1 Experimental Facilities description The experiments were conducted in the facade engineering laboratories of Purdue University in West Lafayette,
Indiana. This research facility was particularly designed for quantifying the impact of façade design options and related
controls on indoor environmental conditions and energy use. Two identical, side-by-side test office spaces with
reconfigurable facades (Fig. 1a) are used to compare between different glazing, shading and control options under real
weather conditions. The dimensions of each room are 5m wide by 5.2m deep by 3.4m high, with a glass façade (60%
window-to-wall ratio) facing south.
A Solaban70XL-clear, a high performance glazing unit with a selective low-e coating (τv=65%) was used for the
measurements. The façade is equipped with motorized grey roller shades, with 5% total visible transmittance (beam-
beam transmittance =4.2%), 74.5% exterior reflectance and 28% interior reflectance. The shading system can be
controlled automatically (through customized software) and manually, and is connected to the lighting control system
and to the data acquisition and monitoring system. This way shading operation and shade position at any time is fully
monitored. Several photometers (Fig.1b) are used to measure light levels, both exterior (horizontal and vertical
illuminance) and interior (transmitted through window, horizontal work plane illuminance at 6 points in each room,
and at variable positions at the observer’s eye height level for vertical illuminance measurements). A vertical exterior
solar pyranometer provides information about the direct and diffuse portions of solar radiation and illuminance. All
sensors are connected to a data acquisition and control system, controllable through remote access in order to run
experiments without interfering with human presence. In this way, we can conduct comparative experiments using
custom shading and lighting controls and study the impact on daylighting conditions, energy use, and visual comfort.
Illuminance, solar radiation, electric light levels and shading operation were recorded every 1 minute for different
measurement periods of March and April 2014 for the needs of this study.
2.2 Experimental Setup for Glare Measurements A calibrated Canon 550D camera, equipped with a Sigma 4.5mm fisheye lens was used for luminance mapping and
glare measurements. The fisheye lens is recommended since it better resembles the human visual field. Hirning et al.
(2014) suggests a modified human visual field according to the total field of Guth (1966), which is also an option in
evalglare since version 1.0 (Wienold, 2012). Although this approach is reasonable for human involved studies, due to
the fact that this study is purely experimental, and includes correlations with measurements extracted by photometers
having 180o field of view, the original 180o wide visual field was assumed. The camera was mounted on a tripod at

3575, Page 3
3rd International High Performance Buildings Conference at Purdue, July 14-17, 2014
1.20m height, simulating an average seated occupant’s eye level, and was facing a laptop screen running typical office
to maintain the screen luminous exittance at normal office levels (Fig. 1c).
Figure 1: (a) Exterior view of the twin labs – (b) Sensors placement in the experimental room – (c) Interior view
The placement of the camera is of great importance, as both of the dynamic parts of the DGP equation can be
influenced by it: The first term based on vertical illuminance (Ev) can be significantly smaller when a table and/or a
computer screen are present, either blocking part of the view and the projected light on the floor/other surfaces, or
adding a relatively constant amount of light (and luminance) in the case of a screen; the second term that considers
contrast is also directly influenced by the luminous exittance of the area of focus. A photometer was vertically mounted
on the camera, to validate the vertical illuminance results extracted by camera measurements. Alternatively, the sensor
can be also used for overriding the Ev values extracted from the photographs, providing more accurate DGP results,
as suggested by Evalglare (Wienold, 2012).
For the creation of HDR photographs, the typical approach described in related literature of “Evalglare” (Wienold,
2012) was followed: The camera is set to shoot for every measured instance three pictures of different exposures. The
exposure of a photograph describes the quantity of light reaching the digital sensor; it is influenced by three different
factors set directly on the camera: the aperture, the shutter speed, and the ISO level. The aperture setting modulates
the amount of light let into the lens by modifying the area of the shutter opening; the shutter speed is defined as the
time duration of open shutter; and the ISO is the light sensitivity of the sensor. These three factors influence the results,
therefore an acceptable combination for reliable measurements is required. Both over- and under-exposed photographs
will result in poor luminance mapping, as part of the information will be either “burnt” or dark. Smaller apertures
usually lead to less bright images but with greater depth of field (amount of visual field that is on focus), and are
preferred for many reasons, such as the more limited effect of vignetting distortion (Inanici and Galvin 2004). To
balance the light cost due to the higher aperture, a slower baseline shutter speed needs to be selected. The ISO level
should be always set in the baseline setting of 100, as a possible sensitivity increase of the sensor could alternate the
results. A representative set of the settings used were aperture of f/11, shutter speed of 1/100-1/200 and ISO 100.
In winter time, when the sun is low and clearly visible through the window, many of the photographs were
“overdriven”. This is a term used by the camera’s software to describe overexposed images, where what should be
discrete mapping is transformed to a uniform white blob, or where there is a luminance part of the photograph so high,
that it is impossible for the sensor to handle such an extreme contrast correctly. The overexposed images can be
unpredictable in terms of measuring; while they usually overestimate luminance in certain areas, lower values may
appear when it comes to contrast glare. A symptom of this problem can be found in literature (Suk and Schiler, 2012)
where, in case of direct sun within the field of view, DGP is significantly underestimated compared to similar
RADIANCE simulations. Usually, this kind of problems is solved by adding specific ND filters on the lens and of
course repeating the calibration process for the new setup. However, due to the fisheye lens geometry, an addition of
such filters would lead to a severe narrowing of the visual field, as well as a significant increase of vignetting distortion.
Therefore, the only possible option is to reduce the base exposure, using significantly faster shutter speeds as a
baseline. Nonetheless, the problem remained in several cases. For such cases, a criterion for storing (or rejecting) the
measurements was used; if the vertical illuminance calculated by the luminance mapping was in good agreement with
the one measured by the vertical photometer, the image was kept; otherwise it was rejected as unreliable. It turned out
however that only few of the overdriven images were actually rejected by this filtering process, proving so that the
error message appeared even in cases where the issue is negligible.
3575, Page 4
3rd International High Performance Buildings Conference at Purdue, July 14-17, 2014
2.3 HDR image creation and processing Three different software solutions were investigated for HDR image creation and processing, in order to select the
most efficient method. The luminance camera used in this study was custom designed for research use, so it was
already calibrated by the manufacturer, with detailed data sets and corrections for response curves, vignetting, point
source errors, etc. Therefore the luminance mapping created by the camera’s software Labsoft 14.3.6 (Technoteam,
2014) was considered to be the baseline for comparing with other software. The calibration and correction data sets
cannot be used by other software, thus for comparison purposes the images had to be calibrated in other ways. The
camera’s software is capable of calculating DGP, but as Evalglare is the “standard” procedure for this task, a validation
was first conducted. The three methods studied for HDR image creation and processing are described below:
Based on the main trend found in related literature, Photosphere (Ward, 2014) was initially selected to run
the process. Photosphere is a Mac OS only freeware program which has the advantages of performing most
of the essential steps for glare evaluation under a fairly user friendly graphical interface. However,
Photosphere is not able to directly input the Canon’s .CR2 RAW files. This was a complication that didn’t
allow us to follow the planned procedure of using RAW files for maximum accuracy, as using another
software to convert the images would slow down the process; however we tried using JPEG files at the least
compression possible instead to investigate the results. After the image creation, a calibration data set was
created within Photosphere for our current setup. After calibrating the pictures, they were appropriately
cropped and resized to meet the Evalglare restrictions and then used in Evalglare for DGP and other
calculations. The results from Photosphere were compared with the camera’s software readings in terms of
average luminance. It has been found that the accuracy of the procedure was very sensitive to the selection
of the baseline surface of the calibration. It is suggested for a small grey surface to be chosen, uniform in
luminance and neither very dark nor directly lit by sunlight.
To overcome the .CR2 incompatibility of Photosphere, Adobe Photoshop CC was also used, since it can
directly handle Canon RAW data. However, Photoshop did not include a calibration function. Therefore, the
“hdrscope” tool (Kumaragurubaran and Inanici, 2013) was used for this task. Hdrscope is a free software
created by the University of Washington which implements the complete operation of Evalglare, combined
with some convenient tools for luminance statistical analysis. It also implements a similar calibration function
with Photosphere, using a “linear” calibration factor created by the measured value of a grey target within
the visual field and the respective luminance value of the input HDR image. Sane suggestions for the selection
of the calibration surface apply here. After created in Photoshop, images were calibrated in hdrscope and
then appropriately formatted for Evalglare. The results were a very good match with our baseline, indicating
that this process, although intensive, can be reliable for HDR creation.
The third software investigated was Labsoft (Technoteam, 2014), the solution that accompanied the
luminance camera. The software merges the HDR photographs and does not require any calibration as the
calibration data set including all corrections is directly embedded in the software. The images created were
extracted to use in evalglare. As mentioned before, the luminance mapping was considered as reliable due to
the manufacturer performed calibration, so for this solution a validation of the Evalglare operations was
needed (Fig. 2). Overall, very good agreement was observed, and the small differences are assumed to be an
effect of resizing the photographs (to 800x800) for use with Evalglare. An issue of Labsoft was that it does
not correct the DGP values for low light conditions (Ev<320lux) according to the suggested method of
Wienold (2012), resulting to the addition of the 0.16 constant for DGP values below 0.2 for these cases.
The HDR images can also be used to calculate vertical illuminance from the visual field by integrating the total pixels’
contribution to the vertical illuminance at eye level, as a product of the pixel’s measured luminance multiplied by the
respective “configuration” factor. The vertical illuminance values (at the eye level) extracted by the HDR images were
compared to measured values using a vertical photometer, demonstrating a good fit (Fig. 3), a fact that proves the
reliability of HDR luminance measurements.
To identify the glare sources within the field of view, a rule of 4 times the task luminance was used as suggested in
the initial DGP study (Wienold and Christoffersen, 2006). The task area in our case is a circular area contained in the
computer screen, based on our assumption that the focus area of importance in an office environment is contained in
the screen and not a larger area that contains it. Since there were no people involved in the experiment, this assumption
allowed better control of the task area luminance. Evalglare, except for the information mentioned above, can also
output a modified image where it marks the task area as a blue circle and the glare sources identified with other colors.

3575, Page 5
3rd International High Performance Buildings Conference at Purdue, July 14-17, 2014
Using this methodology in Labsoft leads to identical glare sources identification (Fig. 4). Based on the above
validation, and to avoid extensive image processing and calibrations, Labsoft was selected for HDR processing and
glare evaluation. Due to the experimental scope of the study and the need to observe correlations, values of DGP for
Ev<320lux were not corrected according to Wienold (2012), neither did values for DGP lower than 0.2. For comfort
related studies, these corrections should be applied to comply with occupants’ impressions.
Figure 2: Validation for Labsoft’s (a) DGP, (b) average luminance and (c) vertical illuminance using Evalglare as a
baseline.
Figure 3: Validation of Labsoft’s vertical illuminance using a camera-mounted illuminance meter for the case of
controlled shades. (R2=0.9817)
Figure 4: Glare sources identification through (a) Evalglare and (b) Labsoft (sunny conditions, employed shades
(DGP=0.23).
2.4 Shading control and operation The scope of this study includes glare evaluation and correlation with illuminance in spaces with dynamic shading
controls. For this purpose, three different control schemes were applied.
First, a fully closed shades strategy (Case I) was utilized; as closed shades are the most effective method of
minimizing glare (with the obvious disadvantages of low daylight availability or view quality), this scheme
provides an ideal baseline for comparisons, while it is also a realistic setting in cases of manual shading especially
for instances of high direct transmitted illuminance.
Second, a typical shading control industry standard was utilized, aiming to maximize the use of daylight. In this
case (Case II), shades move automatically to a position that just prevents direct sunlight from falling on the work
plane assuming a certain distance between the working area and the façade. Therefore shading position at any
R² = 0.9563
0.2
0.22
0.24
0.26
0.28
0.3
0.32
0.34
0.36
0.2 0.25 0.3 0.35
DG
P f
rom
Lab
soft
DGP from evalglare
R² = 0.9963
100
200
300
400
500
600
700
800
100 300 500 700 900
Aver
age
lum
inan
ce f
rom
Lab
soft
(cd
/m2)
Average luminance from evalglare (cd/m2)
R² = 0.9981
300
800
1300
1800
2300
2800
300 800 1300 1800 2300 2800Ver
tica
l il
lum
inan
ce f
rom
Lab
soft
(lu
x)
Vertical illuminance from evalglare (lux)
(a) (b) (c)
0
500
1000
1500
2000
2500
3000
0 500 1000 1500 2000 2500 3000
Ver
tica
l il
lum
inan
ce e
xtr
acte
d b
y H
DR
ph
oto
s (
lux
)
Vertical illuminance measured by photometer (lux)

3575, Page 6
3rd International High Performance Buildings Conference at Purdue, July 14-17, 2014
time during the day is a function of solar geometry (profile angle) and distance between the seated occupant and
the window (Tzempelikos and Shen, 2013).
Finally, an advanced shading algorithm (Case III) was studied, aiming to protect the work area from direct
sunlight, while adjusting the shade height to prevent high illuminances (> 2000 lux) at all times and maximize
daylight provision under cloudy sky conditions. Using a window-mounted sensor, the total transmitted “effective”
illuminance is defined (Eq. (1))
𝐸𝑒𝑓𝑓 =∑ (𝐸𝑔∙𝐴𝑔+𝐸𝑠ℎ∙𝐴𝑠ℎ)
𝑖
∑ (𝐴𝑔+𝐴𝑠ℎ)𝑖
(1)
where Eg and Esh are the illuminance transmitted through the unshaded and shaded window parts and Ag and Ash are
the areas of the unshaded and shaded window parts2 respectively. Eeff is plotted against work plane illuminance (for
the entire year using simulation) to determine a threshold (Tzempelikos and Shen, 2013). If the effective transmitted
illuminance is below this threshold (Eesp), shading position is determined by the control described in Case II (work
plane protection); otherwise, the shades will move to a lower position to avoid excessive amounts of daylight on the
work plane. The lowest shade position hsh (portion of unshaded window) to avoid high illuminances is obtained by:
𝐸𝑠ℎ ∙ (𝐻 − ℎ𝑠ℎ) + 𝐸𝑔 ∙ ℎ𝑠ℎ = 𝐸𝑒𝑠𝑝 ∙ 𝐻 (2)
where H is the entire window height. For the experimental facilities described above, the effective illuminance
threshold is 7000 lux.
2.5 Real time measurement-aided simulation Most glare evaluation experiments involve human subjects to record their perception of discomfort. While in the case
of private offices the placement of measuring equipment can be configured without problems, for open plan offices
(where many different positions are being evaluated), the procedure is getting bottlenecked by the need to use
luminance cameras and illuminance meters at different positions on several times. Even without considering financial
aspects, there remains the fact that in a real working environment (e.g., an open plan office or a classroom), the
placement of numerous sensors for every seating position could distract the subjects, creating bias influences to the
results. For that reason, simulation has been used to evaluate possible daylight glare scenarios (Jakubiec and Reinhart
2013). However, uncertainty in typical weather data and sky conditions might cause errors and deviations from real-
time perceived visual discomfort. Therefore, in our case, real-time measured transmitted illuminance (sensor not
noticeable by occupants) can be used as an input to simulation of interior illuminance and luminance mapping. Real-
time measurements allow solar geometry calculations, while an external pyranometer is used to measure direct and
diffuse portions of incoming daylight. The shading position is recorded through the building automation and controls
system.
The simulation uses a hybrid ray tracing and radiosity model (Chan and Tzempelikos, 2012) for rapid calculations
without sacrificing accuracy of results.
Figure 5: Validation of the model for (a) vertical illuminance; (b) work plane illuminance and (c) DGP (MSE=0.03)

3575, Page 7
3rd International High Performance Buildings Conference at Purdue, July 14-17, 2014
The roller shades properties were modeled using a semi-empirical method (Kotey et al., 2009) in order to simulate
their off-normal properties and beam-diffuse transmission. The ray tracing method was used to calculate the sun’s
projection areas in the interior of the room, the direct light hitting the eye, as well as the direct illuminance distribution
on surfaces; this information was used to extract the initial luminous exittance mapping of surfaces, as input to the
radiosity method. A dense grid was used for all surfaces, to take into account glare sources due to sun projections,
while a coarser grid was used for the floor to create multiple possible positions for the observer within the room, for
work plane and vertical illuminance calculation purposes. The model was validated in terms of measured work plane
and vertical illuminance in the test offices, and in terms of DGP measured values directly obtained by the luminance
camera (Chan et al. 2014). Fig. 5 presents sample validation results for two successive days, using the advanced
shading control (Case III). Horizontal and vertical illuminance values are in good agreement; DGP values show more
dispersion, with MSE=0.03.
This approach also provides flexibility for other evaluations, such as the comparison of two shading control strategies
without the need of using two cameras, or processing thousands of pictures to obtain continuous DGP fluctuation.
3. EXPERIMENTAL RESULTS
3.1 General correlations and observations Experimental measurements in the test offices were performed for several months (different seasons and sky
conditions), with all three different shading controls. The camera was placed at a distance of 2.20m from the glass and
1.60m of the right wall, at a height of 1.20m. Each test case was studied for several days, in order to observe the
fluctuation of design values such as work plane illuminance compared to restrain factors such as discomfort glare.
Horizontal and vertical illuminance values were recorded every minute, while luminance pictures were taken every
hour. More frequent glare measurements were not necessary since the purpose of experiments is (i) to validate the
models that can be used towards an integrated daylighting and glare module using hybrid ray-tracing and radiosity
techniques and (ii) to derive correlations between DGP and interior illuminance using a large enough set of measured
data. Having a variety of measured data (transmitted, work plane and vertical illuminance, shade position and
luminance mapping) under different conditions and shading controls provides the opportunity to study potential
correlations between measured parameters.
An interesting opportunity for creating guidelines would be a correlation between a design value such as work
plane illuminance (or a daylight metric, e.g., UDI, as suggested by Mardaljevic et al., 2012) and glare probability.
Representative experimental results for March and April using the SB70XL glazing are shown in Fig.6a. Work plane
illuminance is related to DGP, although the correlation is not strong. This is expected for several reasons, the most
important being the direct sunlight entering the space and altering the distribution of work plane illuminance with
different controls –in several cases, the window is identified as a potential glare source and DGP can vary depending
on window luminance and contrast between the unshaded portion and other surfaces in the field of view (more details
in section 3.2). Nevertheless, even with closed shades, there is a fraction of direct light entering the space since the
fabrics have a direct-direct component (4.2%) that affects interior illuminances (Kotey et al., 2009). Related modeling
performed by the authors suggests that the smaller the direct-direct component (more diffusing fabrics), the better the
correlation between DGP and vertical or work plane illuminance. However, the current setup was not suitable to prove
that. Case II control (work plane protection) results in higher interior illuminance since the shades open for a
significant amount of time. A more detailed comparison between the shading control strategies is presented in section
3.3.
3.2 Vertical illuminance and contrast influence on DGP
Vertical illuminance on the eye and DGP (Fig. 6b) have a strong correlation but the relationship is not linear for the
reasons mentioned above. By definition, DGP (Eq. 3) is mainly influenced by the vertical illuminance term (Eq. 4),
and that was the trigger for introducing DGPs, the simplified glare evaluation measure (Wienold, 2007). However, its
relative weight to the equation remains unclear, especially in terms of whether and when it can be possible for the
second (contrast) term (Eq. 5) to become significant or even outweigh the vertical illuminance term. This is a
discussion that involves many different parameters, such as orientation, time of year for the measurements (solar path),
ground reflectance, as well as window and shading properties and controls. The perceived contrast for a person facing
a partially shaded window can be significantly higher for dark-colored fabrics if the openness factor is relatively small.
In addition, orientations or climates exposed to lower vertical illuminance values are more prone to be directly
influenced by contrast with regards to glare, since the first term is reduced and Ev appears in the denominator of the
contrast term.

3575, Page 8
3rd International High Performance Buildings Conference at Purdue, July 14-17, 2014
Figure 6: Correlation between measured DGP and (a) work plane illuminance and (b) vertical (eye) illuminance
𝐷𝐺𝑃 = 5.87 ∙ 10−5𝐸𝑣 + 9.18 ∙ 10−2𝑙𝑜𝑔(1 + ∑𝐿𝑠,𝑖2 ∙𝜔𝑖
𝐸𝑣1.87∙𝑃𝑖
2) + 0.16𝑖 (3)
ET=5.87 ∙ 10−5 ∙ 𝐸𝑣 (4)
CT=9.18 ∙ 10−2 ∙ 𝑙𝑜𝑔(1 + ∑𝐿𝑠,𝑖2 ∙𝜔𝑖
𝐸𝑣1.87∙𝑃𝑖
2)𝑖 (5)
This study’s experimental setting involved a relatively dark (grey) fabric, and due to the south orientation, high values
of vertical illuminance were present. Therefore this was an opportunity to study the relative effect of each term in
more detail. Figures 7a,b,c present the contribution of each term to DGP for each of the three shading controls (variable
shade positions and sunlit projections) over the period of three representative days in spring. Note that total DGP also
includes a constant term (equal to 0.16) which is not shown in Fig. 7 for simplicity. The resulting measured work
plane illuminance reading of the sensor in front of the camera is also shown in Fig. 7d for reference.
Closed shades naturally reduce illuminance levels –in this case to lower than 500 lux since the shade transmittance is
small. The contrast term is important for several hours, with this however not providing useful insight, as DGP levels
are minimized (Fig. 7a) since light levels are quite low (and for most cases below the DGP definition threshold). Case
II control results in peaks of work plane illuminance, since a significant amount of light can enter the space for this
type of control, and even though no direct light reaches the work plane, the overall illuminance can be high; therefore
the Ev term dominates in terms of DGP contribution (Fig. 7b). The advanced control (Case III) reduces the peaks and
the contrast term becomes more significant (Fig. 7c) since Ev is lower (shades move to a lower position).
However, lower vertical illuminance does not necessarily translate to a higher contrast term in the case of controlled
shades (variable shade positions and sunlit projections). The luminance of identified glare sources (numerator of
contrast term), source sizes and position factors also affect vertical illuminance. Therefore the type of control affects
the Ev and the contrast terms in different ways, and their complex interactions are difficult to analyze. This is shown
in Fig. 8, where the contrast term for all cases is plotted against vertical illuminance. The small contrast term with
closed shades still remains due to some direct-direct transmission even under low illuminances; however, it is not a
linear function of Ev. For controlled shades, there is a dispersion of results with only Case III showing higher contrast
term trends for vertical illuminances between 800-1000 lux (and not lower or much higher).
As mentioned before, relationships between DGP and simple design (or measurable) parameters are of interest. For
relatively high values of vertical illuminance, discomfort glare could be described by an equation based only on
vertical illuminance (Wienold, 2007), namely simplified DGP (DGPs), introduced by Wienold which was in good
agreement with experimental results when there is no direct sunlight in the field of view. Otherwise, errors up to 20%
were estimated using modeling (Kleindienst and Andersen, 2009).
𝐷𝐺𝑃𝑠 = 6.22 × 10⁻⁵ ∙ 𝐸𝑣 + 0.184 (6)
The flexibility of using only vertical illuminance as a glare input is useful, especially for real-time glare-based shading
controls using a sensor input. Therefore it is interesting to estimate the validity of DGPs in the case of controlled roller
shades, with portions of the window unshaded and variable sunlit projections on the floor or on side walls within the
field of view. For this reason, measured DGP values were compared to corresponding DGPs values obtained from
vertical illuminance measurements (Fig. 9a) for the three cases considered. The correlation is strong but not linear, as
equivalently described in Fig. 9b. The differences are due to the contrast term effects (Fig. 7), and differ with variable
patterns as briefly explained in the results of Fig. 8.
0.15
0.2
0.25
0.3
0.35
0.4
0 500 1000 1500 2000 2500 3000
DG
P
Measured work plane Illuminance (lux)
Case I (closed shades)
Case II (work plane protection)
Case III (advanced)
0.15
0.2
0.25
0.3
0.35
0.4
0 500 1000 1500 2000 2500 3000
DG
P
Vertical illuminance (lux)
Case I (closed shades)
Case II (work plane protection)
Case III (advanced)
(a) (b)
3575, Page 9
3rd International High Performance Buildings Conference at Purdue, July 14-17, 2014
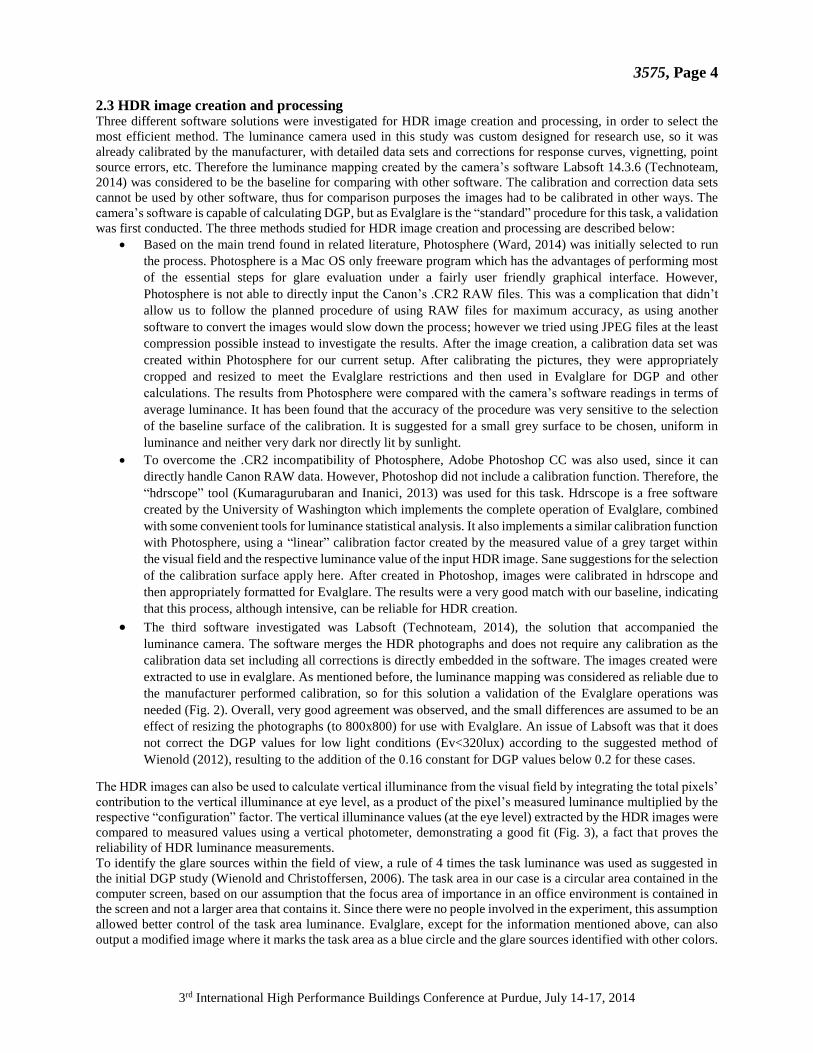
The relative errors in DGPs distribution should be normally reduced for higher values of vertical illuminance, for all
control schemes. This is shown in Fig. 9b, where the DGPs relative error (Eq. 7) is plotted against vertical illuminance.
𝑒 = |𝐷𝐺𝑃𝑠−𝐷𝐺𝑃
𝐷𝐺𝑃| (7)
Figure 7: Contribution of vertical illuminance and contrast term for the three control cases: (a) Case I; (b) Case II;
(c) Case III and (d) Work plane illuminance using the three shading control strategies for representative days used to
study the effect of vertical illuminance and contrast terms.
Figure 8: DGP contrast term as a function of vertical illuminance: (a) absolute value – (b) relative value (divided by
the vertical illuminance term
Figure 9: (a) Comparison between DGP and DGPs for all cases considered. – (b) DGPs relative error as a function
of vertical illuminance for all studied cases
0
0.01
0.02
0.03
0.04
0.05
0.06
8:0
0
10
:00
12
:00
14
:00
16
:00
18
:00
20
:00
9:0
0
11
:00
13
:00
15
:00
17
:00
19
:00
8:0
0
10
:00
12
:00
14
:00
16
:00
18
:00
20
:00
DG
P
Time (hrs)
Contrast Term
Ev Term
0
0.05
0.1
0.15
0.2
0.25
8:0
0
10:0
0
12:0
0
14:0
0
16:0
0
18
:00
20:0
0
9:0
0
11:0
0
13:0
0
15
:00
17:0
0
19:0
0
8:0
0
10:0
0
12
:00
14:0
0
16:0
0
18:0
0
20:0
0
DG
P
Time (hrs)
Contrast Term
Ev Term
0
0.05
0.1
0.15
0.2
8:0
0
10:0
0
12
:00
14:0
0
16:0
0
18:0
0
20
:00
9:0
0
11:0
0
13:0
0
15
:00
17:0
0
19:0
0
8:0
0
10:0
0
12:0
0
14:0
0
16
:00
18:0
0
20:0
0
DG
P
Time (hrs)
Contrast Term
Ev Term
(a) (b)
(c)
0
500
1000
1500
2000
2500
3000
3500
8:0
0
10
:00
12:0
0
14:0
0
16:0
0
18:0
0
20:0
0
9:0
0
11:0
0
13:0
0
15:0
0
17:0
0
19:0
0
8:0
0
10
:00
12
:00
14:0
0
16:0
0
18:0
0
20:0
0
Work
pla
ne
illu
min
ance
(lu
x)
Time (hrs)
Case I (closed shades)
Case II (work plane protection)
Case III (advanced)
(d)
0
0.01
0.02
0.03
0.04
0.05
0.06
0.07
0 500 1000 1500 2000 2500 3000 3500
Contr
ast
term
Vertical illuminance on eye (lux)
Case I (closed shades)
Case II (work plane protection)
Case III (advanced)
0
0.5
1
1.5
2
2.5
3
3.5
4
4.5
5
0 500 1000 1500 2000 2500 3000 3500
CT
/ET
Vertical illuminance on eye (lux)
Case I (closed shades)
Case II (work plane protection)
Case III (advanced)
Ev s
ugg
este
d lo
wer
lim
it (
Wie
no
ld, 2
01
2)
Ev s
ugg
este
d lo
wer
lim
it (
Wie
no
ld, 2
01
2) (a)
0.15
0.2
0.25
0.3
0.35
0.4
0.15 0.2 0.25 0.3 0.35 0.4
DG
P
DGPs
Case I (closed shades)
Case II (work plane protection)
Case III (advanced)
0%
5%
10%
15%
20%
0 500 1000 1500 2000 2500 3000
Rel
ativ
e er
ror
e (%
)
Vertical illuminance (lux)
Case I (controlled shades)
Case II (work plane protection)
Case III (advanced)
Ev s
ugg
este
d lo
wer
lim
it (
Wie
no
ld, 2
01
2)
(a)

3575, Page 10
3rd International High Performance Buildings Conference at Purdue, July 14-17, 2014
For closed shades, the scattering is continuous, as no high values of vertical illuminance are met during the
experiments. For controlled shades, the relative error is reduced for vertical illuminance higher than 1500 lux, which
according to Fig. 6 corresponds to a DGP level below the 0.35 “perceptible” limit (same for lower illuminance values);
therefore the contrast term will not cause glare for the studied cases, and DGPs might be used to predict glare. Future
experimental and modeling studies should further investigate more cases, since the results might be different for other
types of shading devices and different direct-diffuse transmission characteristics.
3.3 Shading control performance in terms of glare protection and outside view The last part of the experimental study included a comparison of shading control strategies with respect to glare
performance. Case II shading control was used in one office, while Case III control was used in the second office. The
analysis is presented for three successive representative days (March 29-April 1) with variable sky conditions: a mixed
first day, a clear second day and a mostly cloudy third day –to ensure capturing as many presentable cases as possible.
Direct and diffuse transmitted illuminance through the windows (SolarBan70XL) is shown in Fig. 10a. Shade position
was recorded every minute, along with illuminance measurements for certain positions in both rooms. The
methodology described above allowed the use of measured values for direct and diffuse transmitted illuminance and
shade positions as inputs for the lighting model, generating this way detailed luminance and illuminance and DGP
mapping and allowing direct comparison of DGP values and efficiency of shading controls.
Figure 10: (a) Transmitted direct and diffuse illuminance during the comparative experiments. (b) Sample
simultaneous luminance mapping for the two shading control strategies (first day, 4:30pm)
Sample images were also taken with the luminance camera for validating purposes. A snapshot of luminance images
with DGP values is presented in Fig. 10b. Case II results in higher vertical illuminance and surface luminance and
therefore higher DGP.
The variation of DGP as a function of time is shown in Fig. 11a for both offices. Work plane protection control (Case
II) is not efficient in terms of glare protection since the portion of unshaded window allow excessive amounts of
daylight into the space, causing Ev to reach high values, consequently affecting DGP. The advanced shading control
performs better, since it can protect from glare (DGP>0.35) for most of the daytime. Higher values during early
morning and late afternoon (due to the shading operation in order to maximize daylight) are not of concern because
during these times the office is not likely to be occupied. An important result is observed for the third (cloudy) day.
The shades open to allow enough diffuse daylight into the space (work plane illuminances up to 1500 lux in this case),
but this is enough to cause “noticeable” glare –note that although the day is cloudy, it is not heavily overcast. Different
shading control algorithms also have an effect of outside view. As shown in Fig. 11b, the advanced control algorithm
reduces outside view (even down to 15%) when transmitted illuminance exceeds the pre-defined threshold to protect
from high work plane illuminance values and glare. This mostly happens when direct sunlight is present and it is
expected that occupants would tend to close the shades at these times. The work plane protection strategy allows at
least 40% open view; however this comes with a discomfort penalty and would not be acceptable by occupants.
DGP=0.31
Case III
(a) (b)
Case II
DGP=0.28
0
5000
10000
15000
20000
25000
30000
35000
40000
45000
1
20
1
40
1
60
1
80
1
10
01
12
01
14
01
16
01
18
01
20
01
22
01
24
01
26
01
28
01
30
01
32
01
34
01
3601
38
01
40
01
42
01
Tra
nsm
itte
d i
llu
min
ance
(lu
x)
Time (minutes)
Transmitted Beam
Trasmitted Diffuse

3575, Page 11
3rd International High Performance Buildings Conference at Purdue, July 14-17, 2014
Figure 11: (a) DGP variation during comparative shading control experiments – (b) Percent of unshaded window
area (unobstructed outside view during the comparative shading control experiments).
4. CONCLUSIONS – FUTURE WORK
This study was focused on the methodology of obtaining DGP measurements with HDR imaging equipment in a room
with automatically controlled roller shades, and presenting correlations between indoor illuminance and DGP that
leads to future modeling work about glare and visual comfort. In addition, a new methodology of integrating sensor
readings and modeling to calculate interior luminance and illuminance mapping has been presented to demonstrate
the flexibility of calculating DGP fluctuation throughout the room and making comparisons of different shading
control strategies using limited measured data for exterior conditions. The following conclusions can be summarized
from this study.
HDR photography is found to be a convenient and adequately reliable method of luminance and illuminance
mapping measurement. The variety of tools and methodologies available gives researchers plenty of ways to
choose from, ranging from free software to expensive integrated hardware and software solutions.
DGP shows only a fair correlation with the workplane illuminance. The correlation is not strong enough to
extract a reliable equation, but it shows the potential of correlating a discomfort factor like DGP with a design
factor like workplane illuminance in the future. Modeling work suggests higher correlation for more diffuse
fabrics, but this has yet to be validated. For the case of vertical illuminance, the correlation is stronger, still
influenced however by the contrast effect, especially for lower values.
The influence of the contrast related term of the DGP equation has yet to be studied in detail; the results show
that for control schemes with higher unshaded fractions, DGP is mostly dominated by the vertical illuminance
term, while for controls with more closed positions the contrast term becomes significant. However, for the
latter, when the vertical illuminance rises after a certain critical value, the contrast can be also negligible.
These results cannot be generalized, as they reflect the specific settings used in the experiment and further
modeling and measurements are needed in future studies.
For vertical illuminance values higher than the critical value described above, the scattering of DGPs in the
correlation with DGP minimizes. For the controlled schemes, this minimizing starts to take place at a point
which is related to a DGP value well below the 0.35 threshold. This could mean that for higher values of
vertical illuminance, but still below the design glare threshold of 0.35, a simplified index would be adequate
to evaluate glare. The advantages of a simplified index are obvious considering the difficulties of detailed
luminance mapping in real time using adaptive control strategies.
Among the cases presented, the advanced control (case III) offers better protection from glare, with the cost
of reducing the view quality due to the decrease of the unshaded fraction of the window. However the target
work plane illuminance continues to satisfy the desired levels (Fig.7d). Shading control strategies need to be
carefully designed using annual simulation results taking into account the balance between visual comfort,
daylight provision and view. Nevertheless, priority should be always given to protection from glare. Model-
based controls that include glare evaluation are possible, however dynamic roller shades are a complex case,
even compared to venetian blinds –which can redirect daylight, eliminating some of the problems.
0.15
0.2
0.25
0.3
0.35
0.4
0.45
0.5
0.55
1
20
1
40
1
60
1
80
1
10
01
12
01
14
01
16
01
18
01
20
01
22
01
24
01
26
01
28
01
30
01
32
01
34
01
36
01
38
01
40
01
42
01
DG
P
Time (minutes)
Case II (work plane protection)
Case III (advanced)
0
10
20
30
40
50
60
70
80
90
100
1
20
1
40
1
60
1
80
1
10
01
12
01
14
01
16
01
18
01
20
01
22
01
24
01
26
01
28
01
30
01
32
01
34
01
36
01
38
01
40
01
42
01
% u
no
bst
ruct
ed o
uts
ide
vie
w
Time (minutes)
Case II (work plane protection)
Case III (advanced)
(a) (b)

3575, Page 12
3rd International High Performance Buildings Conference at Purdue, July 14-17, 2014
The integrated simulation and measurements methodology proves to be very useful as it allows detailed
mapping for DGP using simple measured inputs. In this way, it is possible to perform experiments in open
plan offices without creating obstructions to the subject while maintaining a realistic working environment.
Also, parametric or optimization studies with a minimum error are possible, avoiding the expensive and time
consuming processes of utilizing luminance cameras.
Future work includes a more detailed modeling oriented investigation of the main conclusions of this study in terms
of work plane illuminance correlation and contrast investigation, as well as a full survey with combined experiments
in occupied open plan offices, to expand the studied cases and develop generic daylight discomfort guidelines.
REFERENCES
Araji M.T., Boubekri M., 2008, Window Sizing Procedures based on Vertical Illuminance and Degree of Discomfort
Glare in Buildings Interiors. Architectural Science Review, 51.3, pp 252-262.
Aries M.B.C.. Veitch J.A., Newsham G.R., 2010, Windows, view, and office characteristics predict physical and
psychological discomfort. Journal of Environmental Psychology 30, pp. 533–541
Borisuit A.,Scartezzini J-L., Thanachareonkit A., 2010, Visual discomfort and glare rating assessment of integrated
daylighting and electric lighting systems using HDR imaging techniques. Architectural Science Review 53:4, 359-
373.
Cai H., 2013, High dynamic range photogrammetry for synchronous luminance and geometry measurement. Lighting
Research and Technology, 45, pp. 230-257.
Cannavale A., Fiorito F., Resta D., Gigli G., 2013, Visual comfort assessment of smart photovoltachromic windows.
Energy and Buildings 65, pp. 137–145.
Cantin F., Dubois F.C., 2011, Daylighting metrics based on illuminance, distribution, glare and directivity. Lighting
Research and Technology, 43, pp. 291-307.
Chan, Y.-C., Konstantzos, I., Tzempelikos, A., 2014, Annual Daylight Glare Evaluation for Typical Perimeter
OFfices: Simulation Models versus Full-Scale Experiments Including Shading Controls. 2014 ASHRAE Annual
Conference. Seattle.
Chan, Y.-C. and Tzempelikos A., 2012, A hybrid ray-tracing and radiosity method for calculating radiation transport
and illuminance distribution in spaces with venetian blinds. Solar energy 86(11): 3109-3124.
Chan Y-C., Tzempelikos A., 2013, Efficient venetian blind control strategies considering daylight utilization and glare
protection. Solar Energy, Vol. 98, pp. 241-254, 2013.
Clear R.D., 2013, Dinscomfort glare: what do we actually know? Lighting Research and Technology, 45, pp. 141-
158.
Fisekis K., Davies M., Kolokotroni M., Langford P., 2003, Prediction of discomfort glare from windows. Lighting
Research and Technology, 35(4), pp. 360-371.
Guth, S. K., 1966, Computing visual comfort ratings for a specific interior lighting installation. Illuminating
Engineering, pp. 634-642.
Hirning, M., G. Isoardi, Cowling I., 2014, Discomfort glare in open plan green buildings. Energy and Buildings 70:
427-440.
Inanici, M.,2006, Evaluation of high dynamic range photography as a luminance data acquisition system. Lighting
Research and Technology 38(2): 123-134.
Inanici, M. and J. Galvin, 2004, Evaluation of high dynamic range photography as a luminance mapping technique.
LNBL report.
Jakubiec, J. A. and C. F. Reinhart, 2013, Predicting Visual Comfort Conditions in a Large Daylit Space Basedd on
Long-term Occupant Evaluations: A Field Study. Proceedings of BS2013: 13th Conference of International
Building Performance Simulation Association, Chambéry, France
Jakubiec J.A., Reinhart C.F., 2012, The ‘adaptive zone’ – A concept for assessing discomfort glare throughout daylit
spaces. Lighting Research and Technology 44(2), pp. 149-170.
Kim W., Kim J.T., 2011, The Scope of the Glare Light Source of the Window with Non-uniform Luminance
Distribution. Indoor and Built Environment 20(1), pp. 54–64.
Kim W., Kim J.T., 2012, The Variation of the Glare Source Luminance According to the Average Luminance of
Visual Field. Indoor and Built Environment 21(1), pp. 98–108
Kleindienst S.A., Andersen M., 2009, The adaptation of daylight glare probability to dynamic metrics in a
computational setting. Proceedings of Lux Europa 2009 – 11th European Lighting Conference, Istanbul, Turkey.

3575, Page 13
3rd International High Performance Buildings Conference at Purdue, July 14-17, 2014
Konis K., 2013, Evaluating daylighting effectiveness and occupant visual comfort in a side-lit open-plan office
building in San Francisco, California. Building and Environment 59, pp. 662-677.
Kotey, N. A., J. Wright, Collins, M.R., 2009, Determining off-normal solar optical properties of roller blinds. ASHRAE
Transactions 117(1).
Kumaragurubaran, V. and M. Inanici, 2013, Hdrscope: high dynamic range image processing toolkit for lighting
simulations and analysis. International building performance simulation association (IBPSA) 2013 conference,
Chambery, France.
Mardaljevic J., Andersen M., Roy N., Christoffersen J., 2012, Daylighting metrics: is there a relation between useful
daylight illuminance and daylight glare probability? Proceedings of the Building Simulation and Optimization
Conference BSO12, Loughborough, UK.
Matusiak B.S., 2013, Glare from a translucent facade, evaluation with an experimental method. Solar Energy 97, pp.
230-237.
Nabil A., Mardaljevic J., 2006, Useful daylight illuminances: a replacement for daylight factors. Energy and Buildings
38, pp. 905–913.
Nazzal A. A., 2005, A new evaluation method for daylight discomfort glare. International Journal of Industrial
Ergonomics 35, pp. 295–306
Piccolo A., Simone F., 2009, Effect of switchable glazing on discomfort glare from windows. Building and
Environment 44, pp. 1171–1180.
Reinhart, C. F., Doyle, S., Jakubiec, J.A., Mogri, R., 2012, Glare Analysis of Daylit Spaces: Recommendations for
Practice. from http://web.mit.edu/tito_/www/Projects/Glare/GlareRecommendationsForPractice.html. Last
accessed April 2014
Rodriguez R.G., Pattini A., 2014, Tolerance of discomfort glare from a large area source for work on a visual
display. Lighting Research and Technology, 46(2), pp. 157-170.
Shin J.Y., Yun G.Y., Kim J.T., 2012, View types and luminance effects on discomfort glare assessment from windows.
Energy and Buildings 46, pp. 139–145
Suk, J.-Y., Schiler, M., Kensek, K., 2013, Development of New Daylight Glare Analysis Methodology using Absolute
Glare Factor and Relative Glare Factor. Energy and Buildings,64, pp.113-122
Suk, J. and Schiler M., 2012, Investigation of Evalglare software, daylight glare probability and high dynamic range
imaging for daylight glare analysis. Lighting Research and Technology 45, pp. 450-463.
Technoteam, LMK Labsoft 14.3.6
http://www.technoteam.de/product_overview/lmk/software/lmk_labsoft/index_eng.html. Last accessed May
2014
Tuaycharoen N.,Tregenza P.R., 2007, View and discomfort glare from windows. Lighting Research and Technology,
39(2), pp. 185-200.
Tzempelikos, A. and Shen, H., 2013, Comparative control strategies for roller shades with respect to daylighting and
energy performance. Building and Environment 67: 179-192.
Van Den Wymelenberg, K., Inanici, M. , Johnson, Pr., 2010, The effect of luminance distribution patterns on occupant
preference in a daylit office environment. Leukos 7(2): 103-122.
Ward, G. "Anyhere Software." Photosphere v1 8. http://www.anyhere.com. Last accessed April 2014.
Wienold, J.,2007, Dynamic simulation of blind control strategies for visual comfort and energy balance analysis.
Proceedings from Building Simulation 2007. pp. 1197-1204
Wienold, J., 2012, EvalGlare. Version 1.0, Fraunhofer Institute for Solar Energy Systems Freiburg (Germany).
Wienold, J. and Christoffersen, J., 2006, Evaluation methods and development of a new glare prediction model for
daylight environments with the use of CCD cameras. Energy and Buildings 38(7): 743-757.
Yun G.Y., Shin J.Y., Kim J.T., 2011, Influence of Window Views on the Subjective Evaluation of Discomfort Glare.
Indoor and Built Environment 20(1), pp.65–74.
ACKNOWLEDGEMENT The authors would like to thank the Alcoa Foundation and Architecture for Humanity for sponsoring this research
through the Pillars of Sustainable Education program. Thanks also to Lutron Electronics Co Inc., Kawneer Inc., and
PPG Industries for supporting the experimental work.


![Balancing daylight, glare, and energy- efficiency goals ... · external shading systems such as EN 13363 [2] which calculates an overall solar heat gain coefficient for slat shading](https://static.fdocuments.net/doc/165x107/5ed3ca697ac79b44002010c3/balancing-daylight-glare-and-energy-efficiency-goals-external-shading-systems.jpg)