Inventory Management Systems Developing a National System for GHG Inventories
Upload
sustainable-food-labCategory
view
225download
1description
DAYCENT Model Description, Testing, and Application for GHG Emission Inventories
S.J Del Grosso, W.J. Parton, S.M. Ogle
Outline
• DAYCENT Description• DAYCENT Testing• Model Application: US GHG Inventory• Model Application: Biofuel LCA• COMET VR Tool for Farmers/Land
Owners
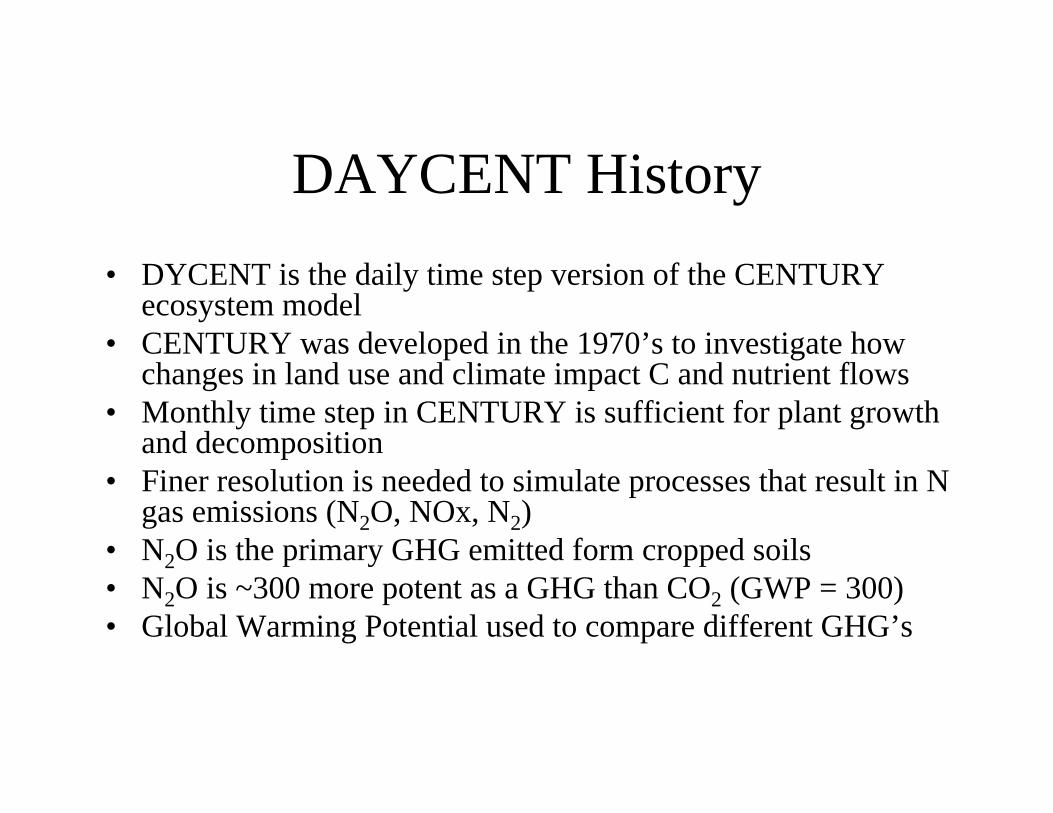
DAYCENT History• DYCENT is the daily time step version of the CENTURY
ecosystem model• CENTURY was developed in the 1970’s to investigate how
changes in land use and climate impact C and nutrient flows• Monthly time step in CENTURY is sufficient for plant growth
and decomposition• Finer resolution is needed to simulate processes that result in N
gas emissions (N2O, NOx, N2)• N2O is the primary GHG emitted form cropped soils• N2O is ~300 more potent as a GHG than CO2 (GWP = 300)• Global Warming Potential used to compare different GHG’s
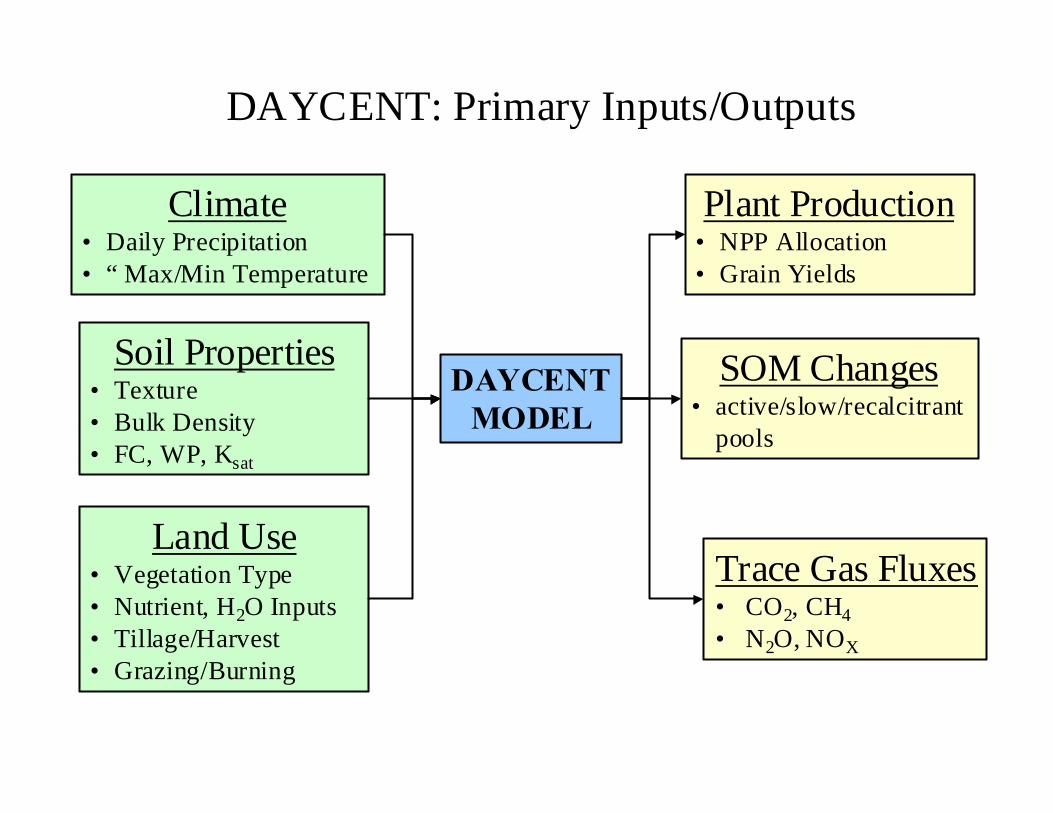
DAYCENTMODEL
Land Use• Vegetation Type• Nutrient, H2O Inputs• Tillage/Harvest• Grazing/Burning
Climate• Daily Precipitation• “ Max/Min Temperature
Soil Properties• Texture• Bulk Density• FC, WP, Ksat
Trace Gas Fluxes• CO2, CH4• N2O, NOX
Plant Production• NPP Allocation• Grain Yields
SOM Changes• active/slow/recalcitrant
pools
DAYCENT: Primary Inputs/Outputs
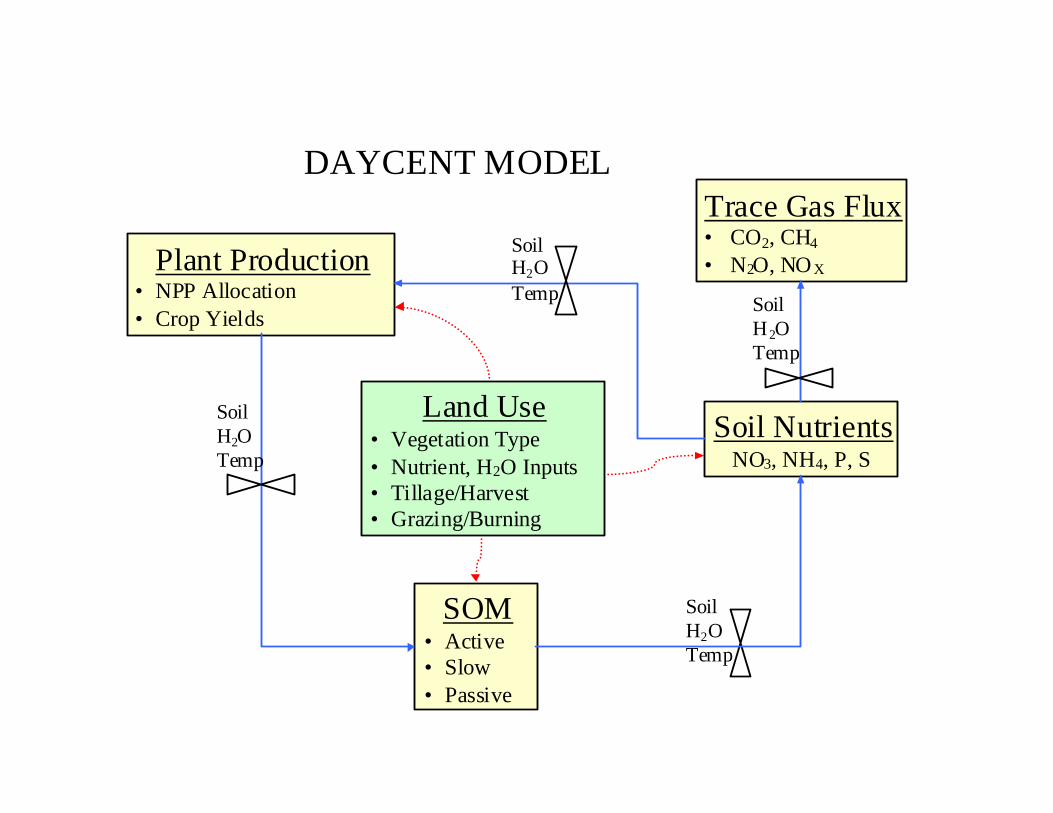
DAYCENT MODEL
Plant Production• NPP Allocation• Crop Yields
Trace Gas Flux• CO2, CH4• N2O, NO X
SOM• Active• Slow• Passive
Soil NutrientsNO3, NH4, P, S
Land Use• Vegetation Type• Nutrient, H2O Inputs• Tillage/Harvest• Grazing/Burning
SoilH2OTemp
SoilH2OTemp
SoilH2OTemp
SoilH2OTemp
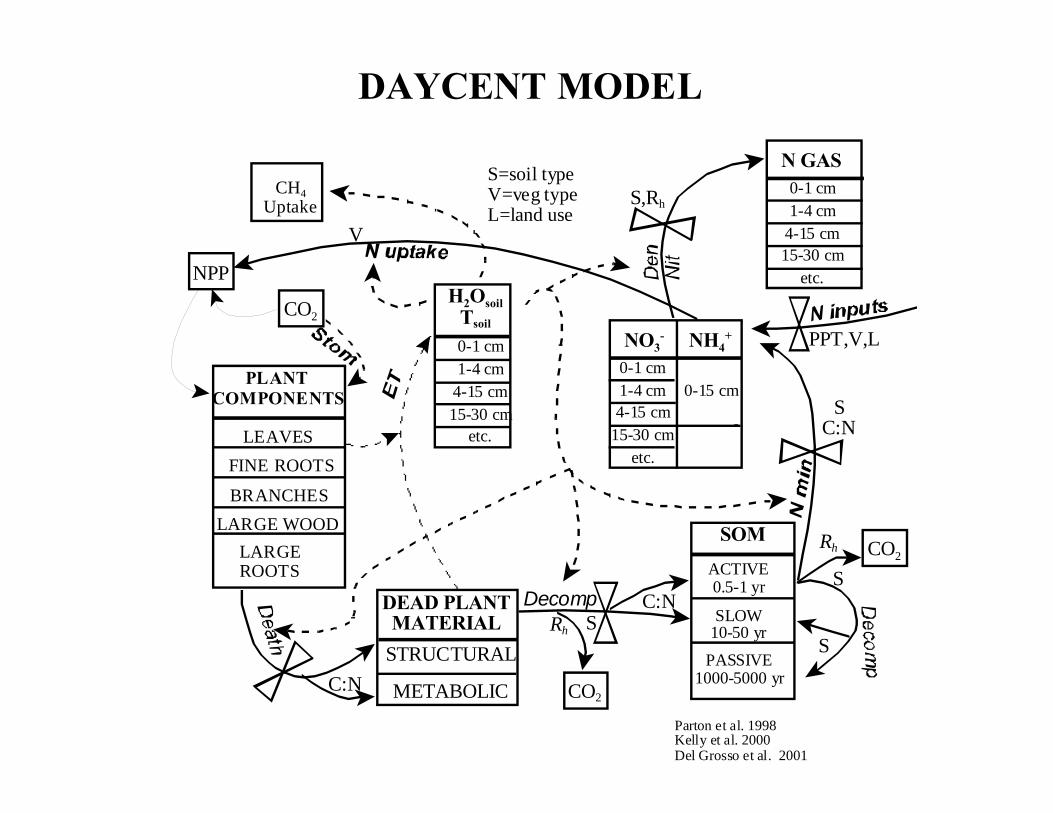
DEAD PLANTMATERIAL
METABOLIC
STRUCTURAL
PLANT COMPONENTS
LEAVES FINE ROOTS
BRANCHESLARGE WOOD
LARGEROOTS
NO3- NH4
+
0-1 cm1-4 cm4-15 cm
15-30 cmetc.
0-15 cm
SOM
ACTIVE0.5-1 yr
SLOW10-50 yr
PASSIVE1000-5000 yr
H2OsoilTsoil
0-1 cm1-4 cm
4-15 cm15-30 cm
etc.
N GAS0-1 cm1-4 cm
4-15 cm15-30 cm
etc.
C:N
CO2
S,Rh
PPT,V,L
C:N
V
SC:N
CO2
CO2
CH4Uptake
DecompRh S
Rh
S
S
NPP
DAYCENT MODEL
Parton et al. 1998Kelly et al. 2000Del Grosso et al. 2001
S=soil typeV=veg typeL=land use
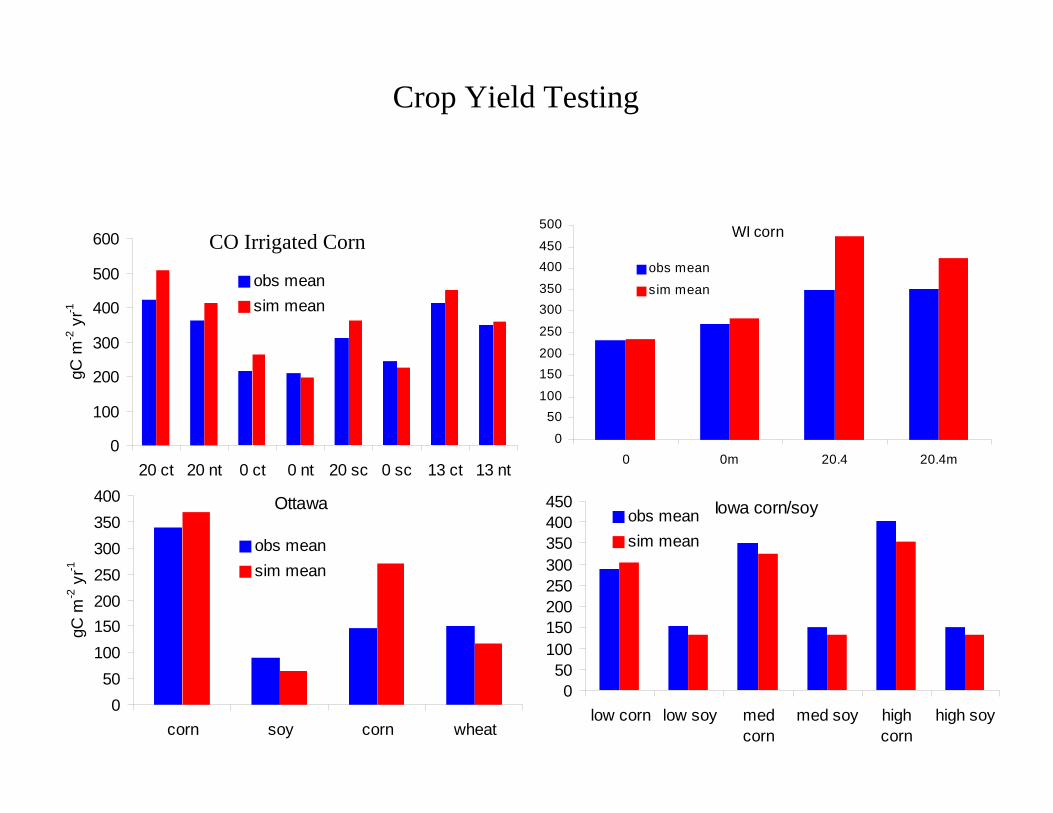
ARDEC corn or corn/soy
0
100
200
300
400
500
600
20 ct 20 nt 0 ct 0 nt 20 sc 0 sc 13 ct 13 nt
gC m
-2 y
r-1
obs meansim mean
WI corn
0
50100
150200
250
300350
400450
500
0 0m 20.4 20.4m
obs mean
sim mean
Ottawa
050
100150200250300350400
corn soy corn wheat
gC m
-2 y
r-1
obs meansim mean
Iowa corn/soy
050
100150200250300350400450
low corn low soy medcorn
med soy highcorn
high soy
obs meansim mean
Crop Yield Testing
CO Irrigated Corn
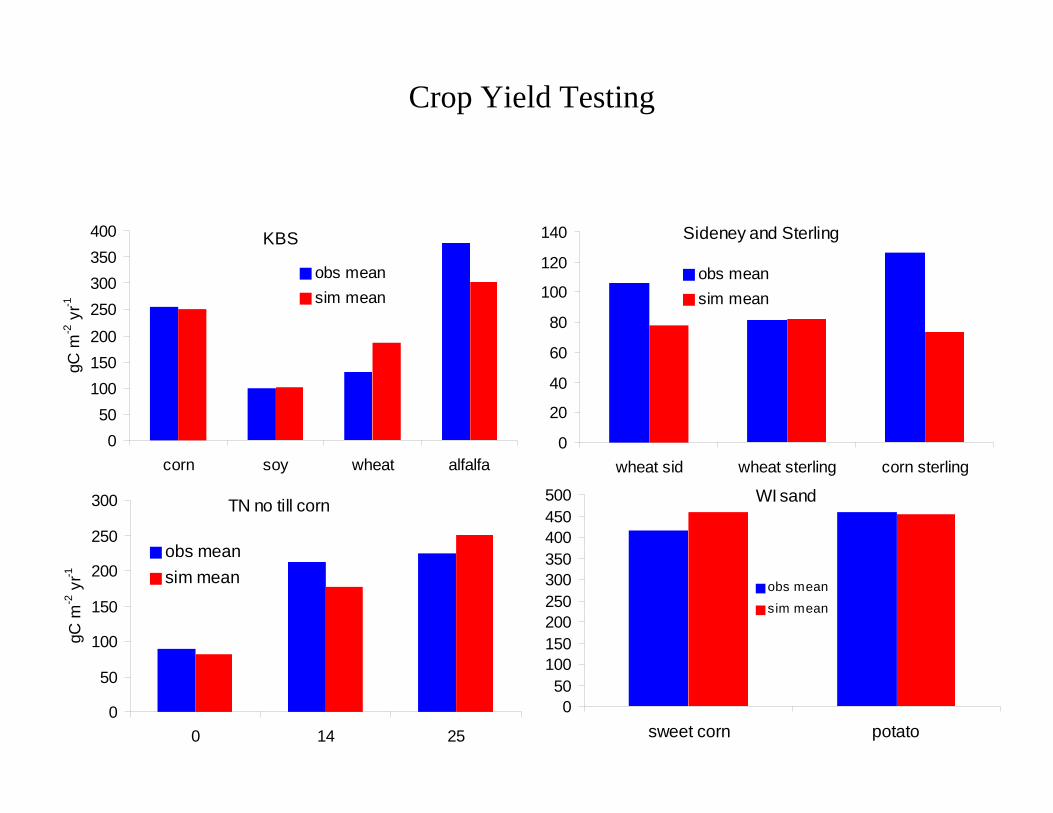
KBS
050
100150200
250300350400
corn soy wheat alfalfa
gC m
-2 y
r-1
obs meansim mean
Sideney and Sterling
0
20
40
60
80
100
120
140
wheat sid wheat sterling corn sterling
obs meansim mean
TN no till corn
0
50
100
150
200
250
300
0 14 25
gC m
-2 y
r-1
obs meansim mean
WI sand
050
100150200250300350400450500
sweet corn potato
obs mean
sim mean
Crop Yield Testing
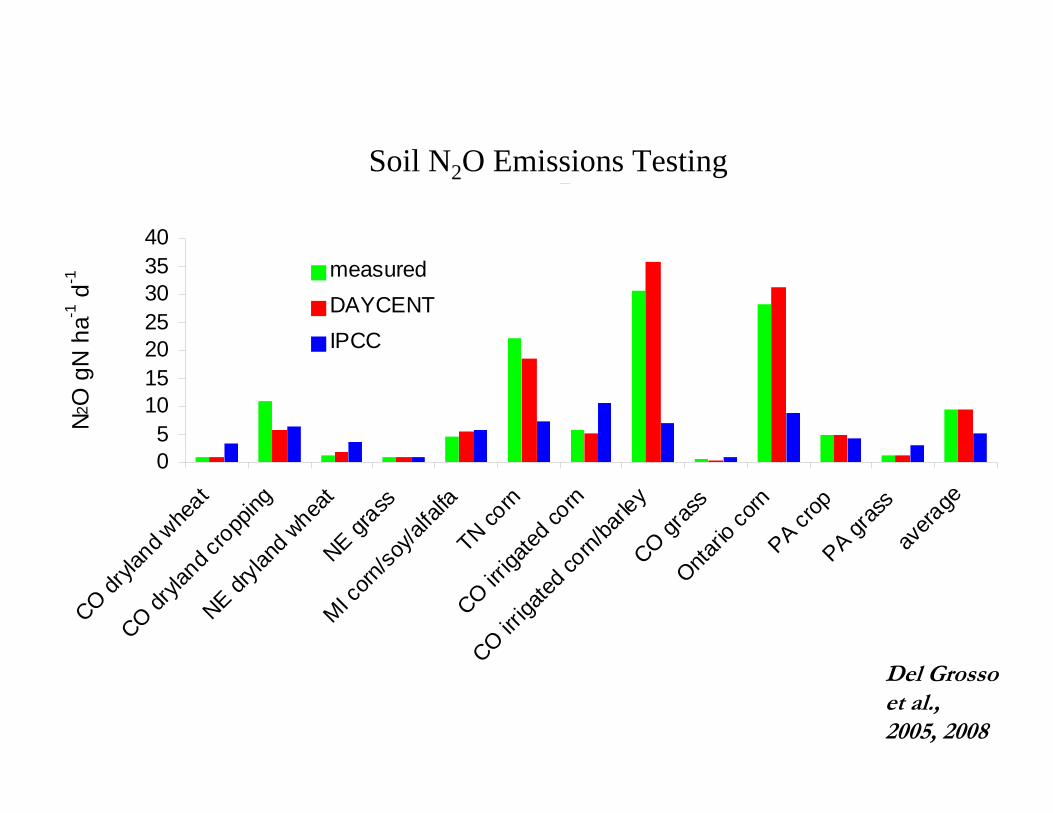
Site Level Mean N2O Emissions
05
10152025303540
CO dryla
nd whe
at
CO dryla
nd cropp
ing
NE dryla
nd w
heat
NE grass
MI corn
/soy/a
lfalfa
TN corn
CO irriga
ted co
rn
CO irriga
ted co
rn/ba
rley
CO gras
sOnta
rio co
rnPA cr
opPA gr
ass
avera
geN2
O g
N h
a-1 d
-1 measuredDAYCENTIPCC
Soil N2O Emissions Testing
Del Grossoet al.,2005, 2008
WI loam
0
0.5
1
1.5
2
2.5
3
3.5
4
4.5
0 0m 20.4 20.4m
gN m
-2 y
r-1
mean obs
mean sim
IO loam
0
0.5
1
1.5
2
2.53
3.5
4
4.5
5
low corn low soy med corn med soy high corn high soy
gN m
-2 y
r-1
mean obs
mean sim
WI sand
0
5
10
15
20
25
sw eet corn potato
gN m
-2 y
r-1
mean obs
mean sim
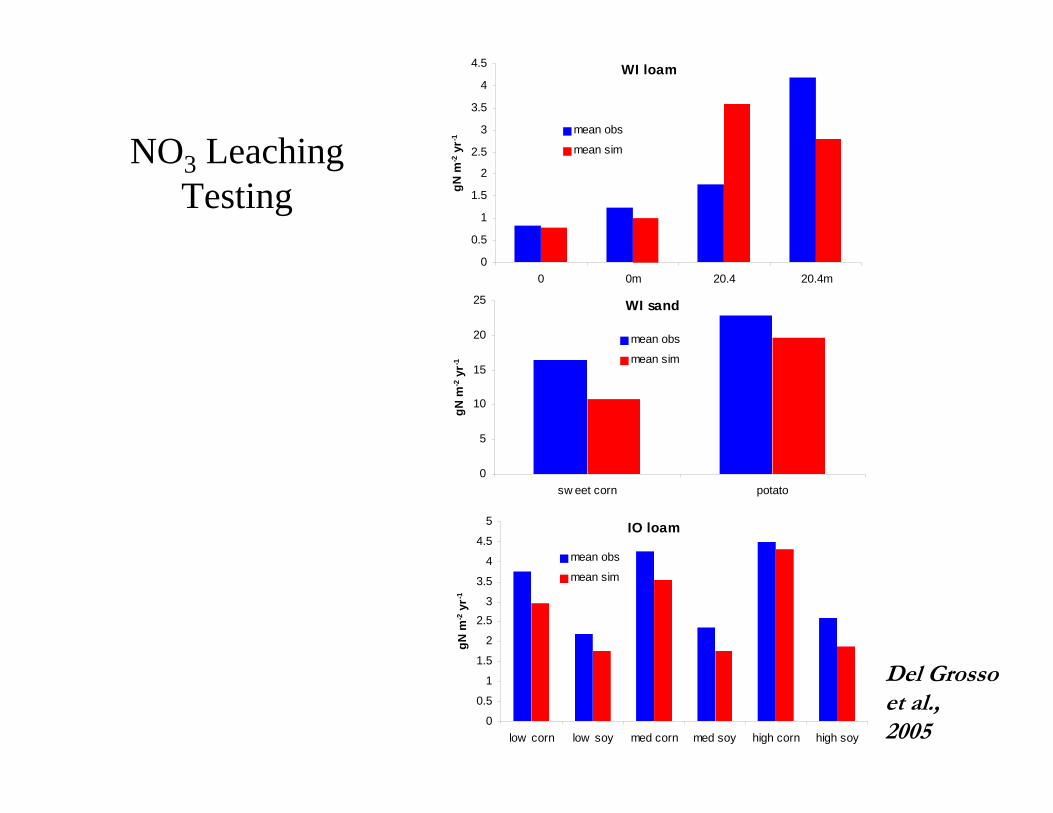
NO3 LeachingTesting
Del Grossoet al.,2005
Model Application
N2O emissions from agricultural soils for US National GHG Inventory
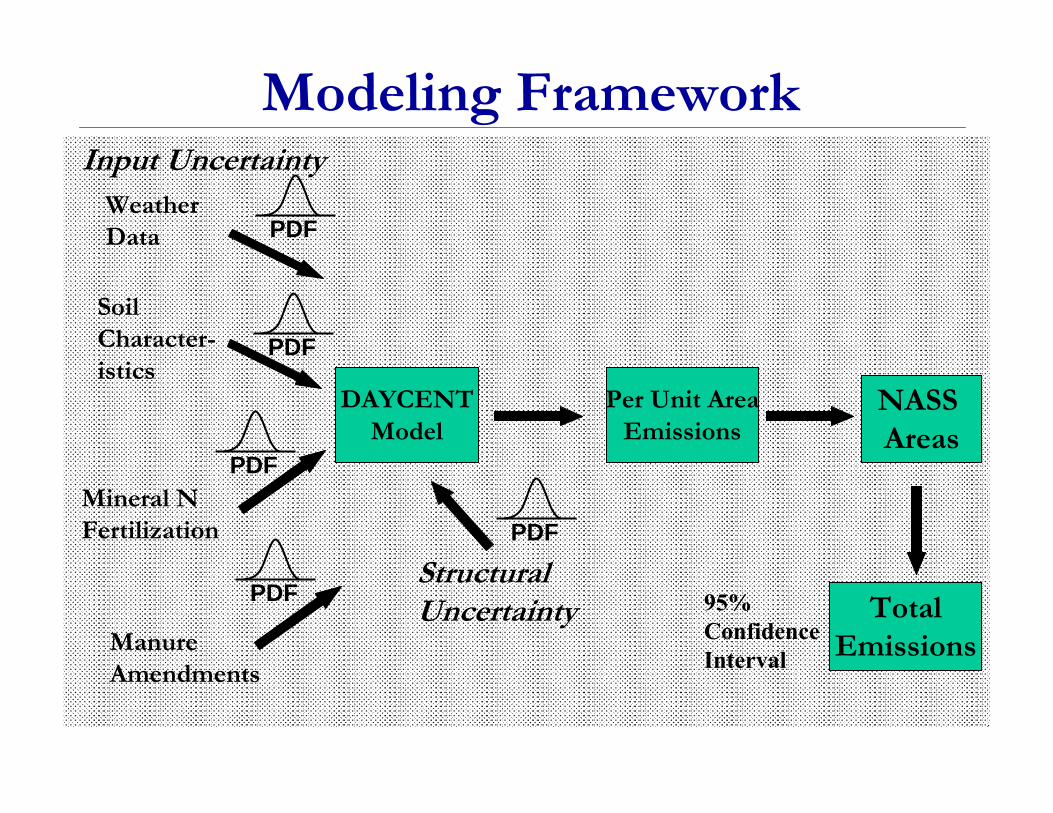
Modeling Framework
DAYCENTModel
Mineral N Fertilization
Manure Amendments
WeatherData PDF
Input Uncertainty
Per Unit AreaEmissions
NASS Areas
Structural Uncertainty
95%ConfidenceInterval
SoilCharacter-istics
TotalEmissions
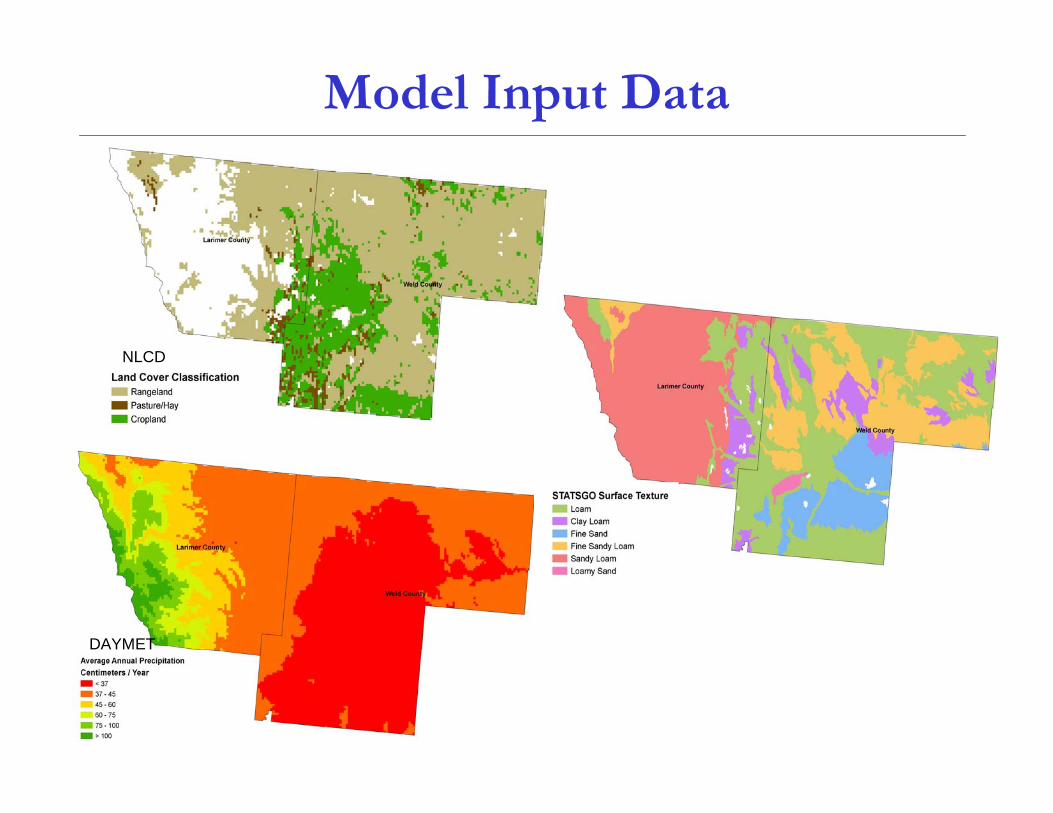
DAYMETDAYMET
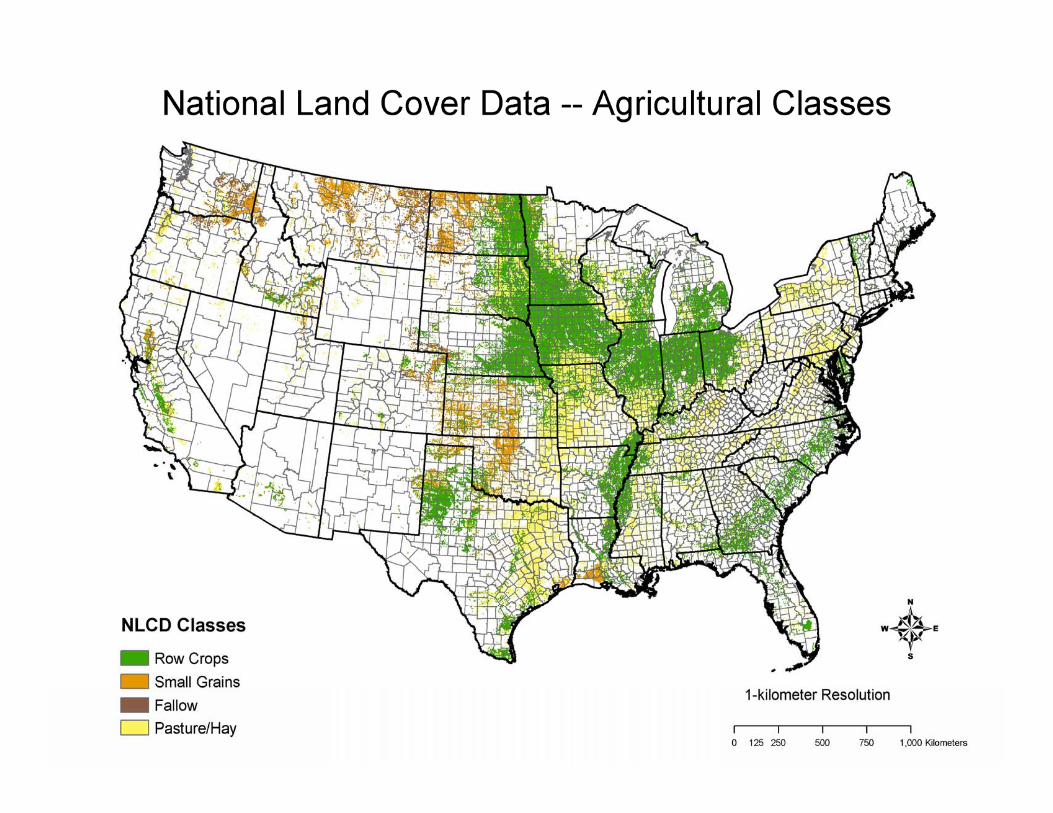
NLCDNLCD
Model Input Data
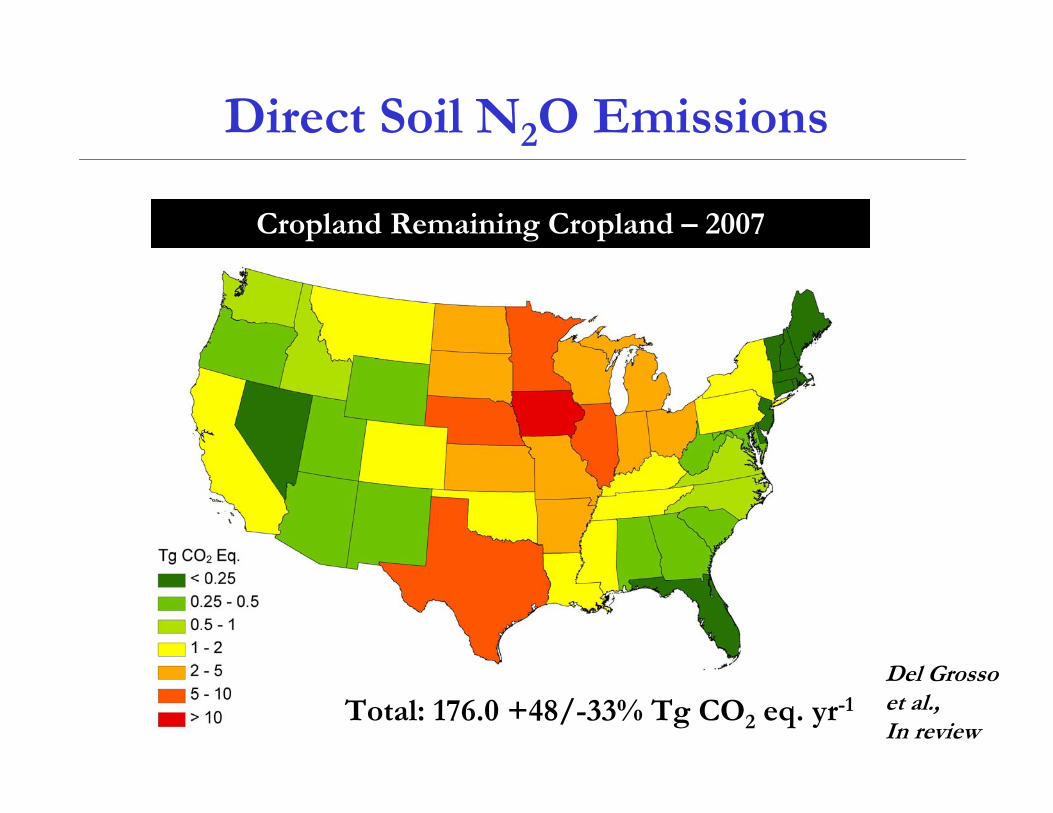
Direct Soil N2O Emissions
Cropland Remaining Cropland – 2007
Total: 176.0 +48/-33% Tg CO2 eq. yr-1
Del Grossoet al.,In review
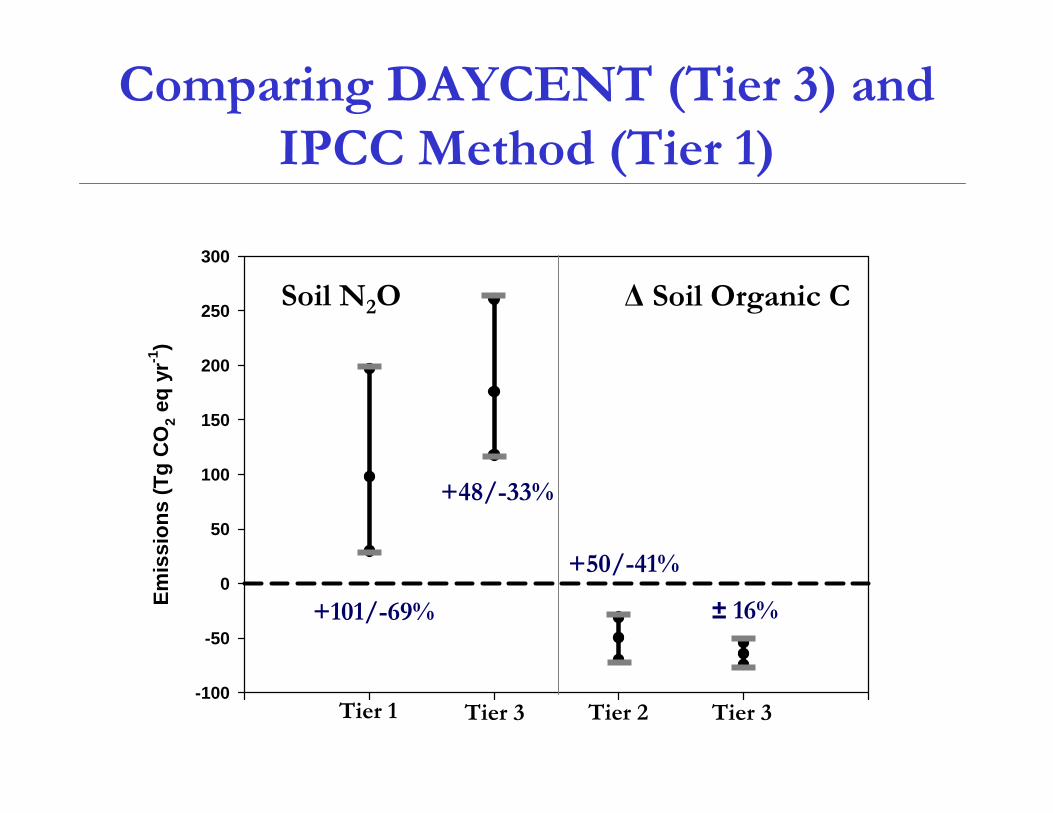
Comparing DAYCENT (Tier 3) and IPCC Method (Tier 1)
Emis
sion
s (T
g C
O2 e
q yr
-1)
-100
-50
0
50
100
150
200
250
300
Soil N2O Δ Soil Organic C
Tier 1 Tier 3 Tier 3Tier 2
+101/-69%
+48/-33%
± 16%
+50/-41%
0%
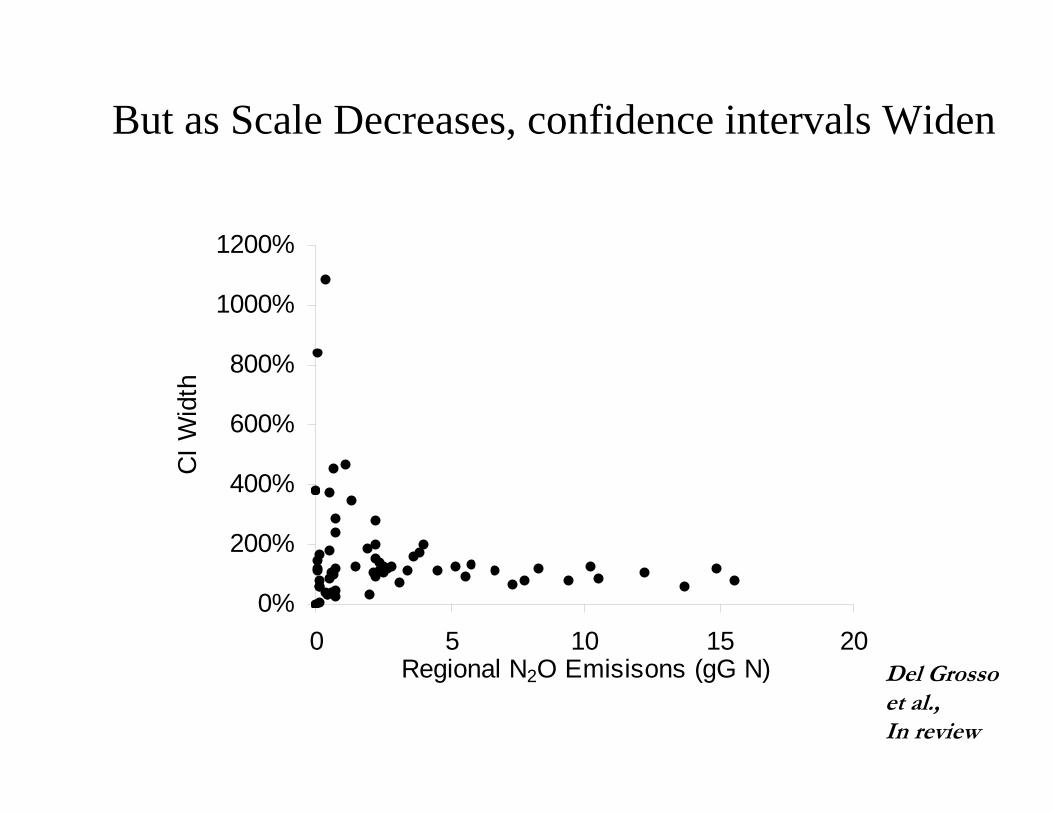
200%
400%
600%
800%
1000%
1200%
0 5 10 15 20Regional N2O Emisisons (gG N)
CI W
idth
But as Scale Decreases, confidence intervals Widen
Del Grossoet al.,In review
Model Application
Life Cycle Analysis for Biofuel Cropping Systems
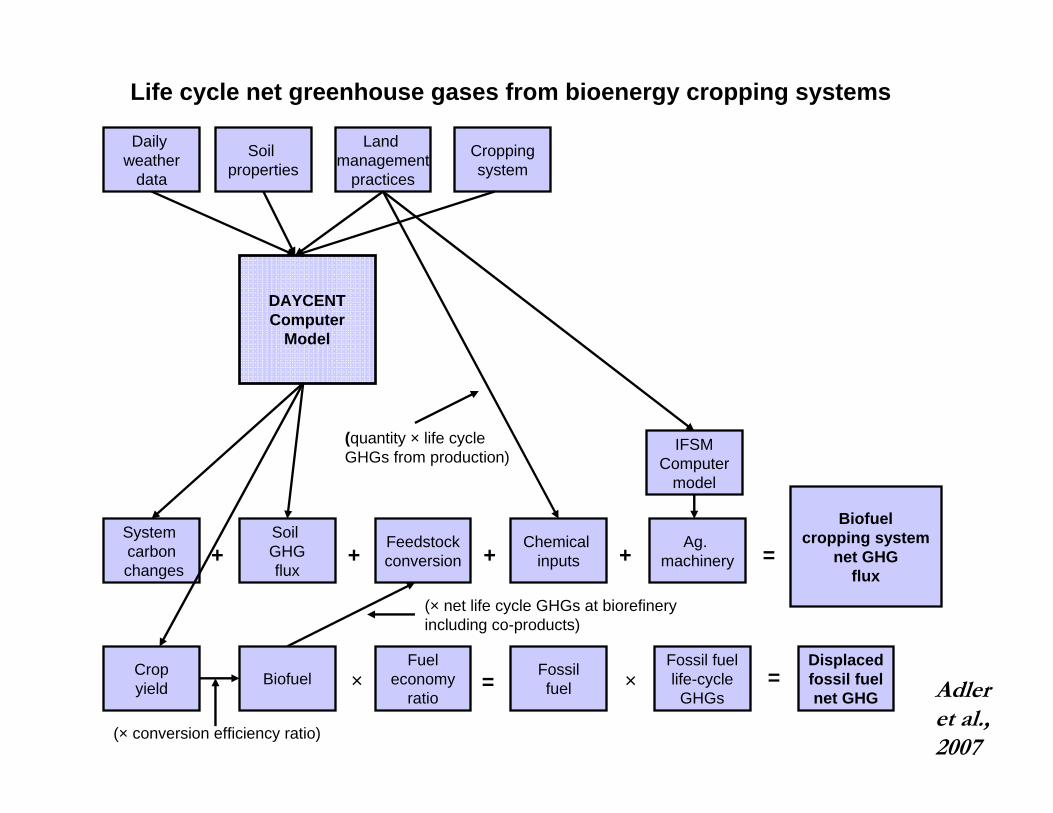
DAYCENTComputer
Model
Biofuelcropping system
net GHGflux
Life cycle net greenhouse gases from bioenergy cropping systems
Daily weather
data
Croppingsystem
Land management
practices
Soil properties
System carbonchanges
Chemical inputs
Ag. machinery
Soil GHGflux
Cropyield
Feedstockconversion
Displacedfossil fuelnet GHG
Biofuel
IFSMComputer
model
+ +++ =
×Fuel
economyratio
= Fossilfuel ×
Fossil fuellife-cycleGHGs
=
(× conversion efficiency ratio)
(× net life cycle GHGs at biorefinery including co-products)
(quantity × life cycle GHGs from production)
Adler et al.,2007
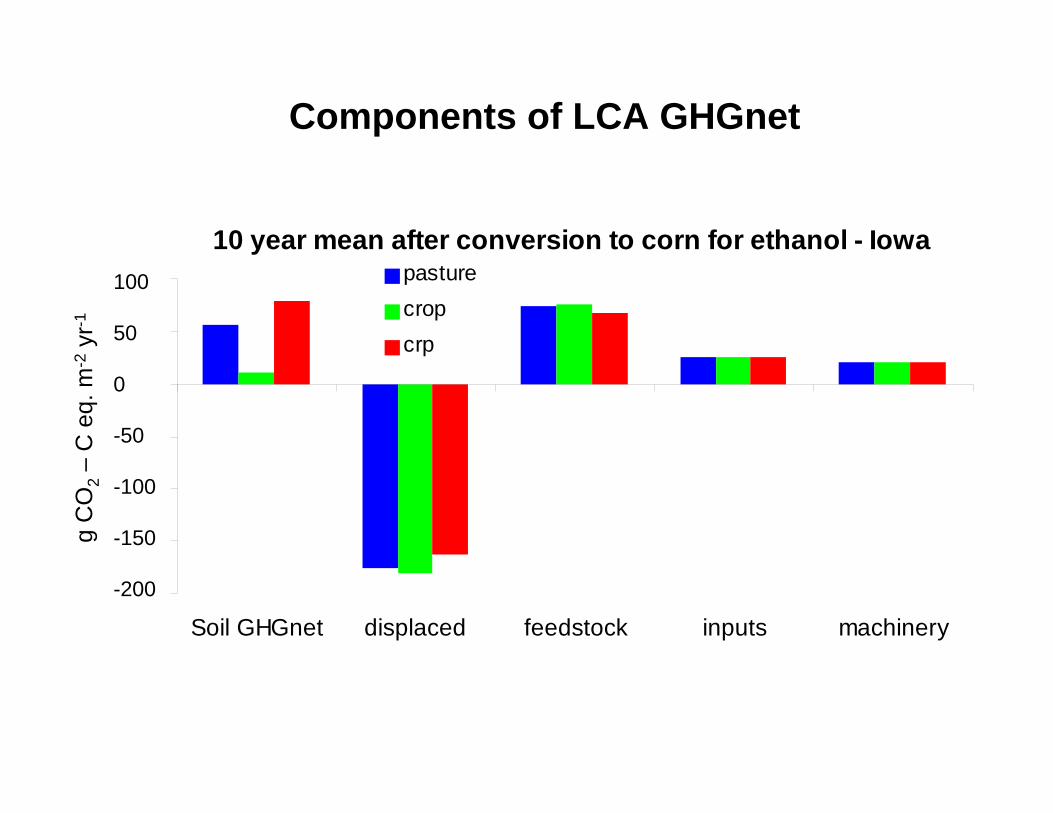
Components of LCA GHGnet
10 year mean after conversion to corn for ethanol - Iowa
-800
-600
-400
-200
0
200
400
Soil GHGnet displaced feedstock inputs machinery
g C
O2 e
q m
-2 y
r-1
pasturecropcrp
100
50
0
-50
-100
-150
-200
g C
O2
–C
eq.
m-2
yr-1
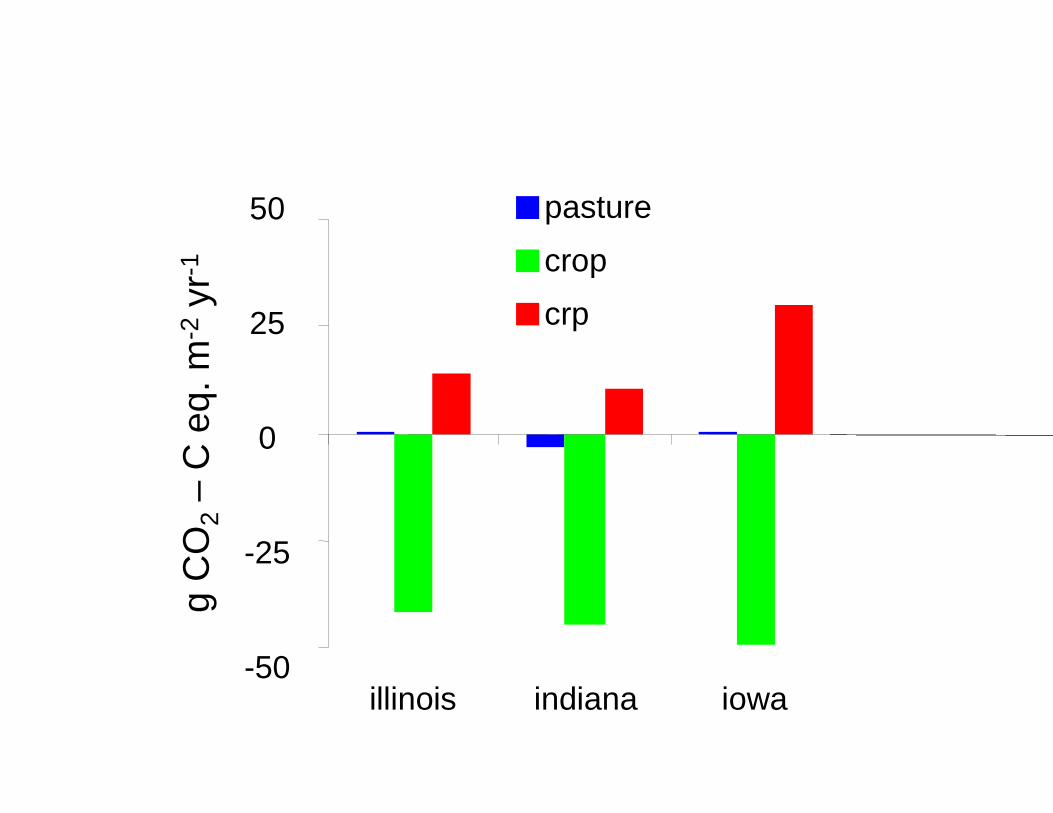
-200
-100
0
100
200
illinois indiana iowa
g C
O2
eqm
-2yr
-1pasturecropcrp
-200
-100
0
100
200
illinois indiana iowa
g C
O2
eqm
-2yr
-1pasturecropcrp
-200
-100
0
100
200
illinois indiana iowa
g C
O2
eqm
-2yr
-1pasturecropcrp
-200
-100
0
100
200
illinois indiana iowa
g C
O2
eqm
-2yr
-1pasturecropcrp
50
25
0
-25
-50
g C
O2
–C
eq.
m-2
yr-1
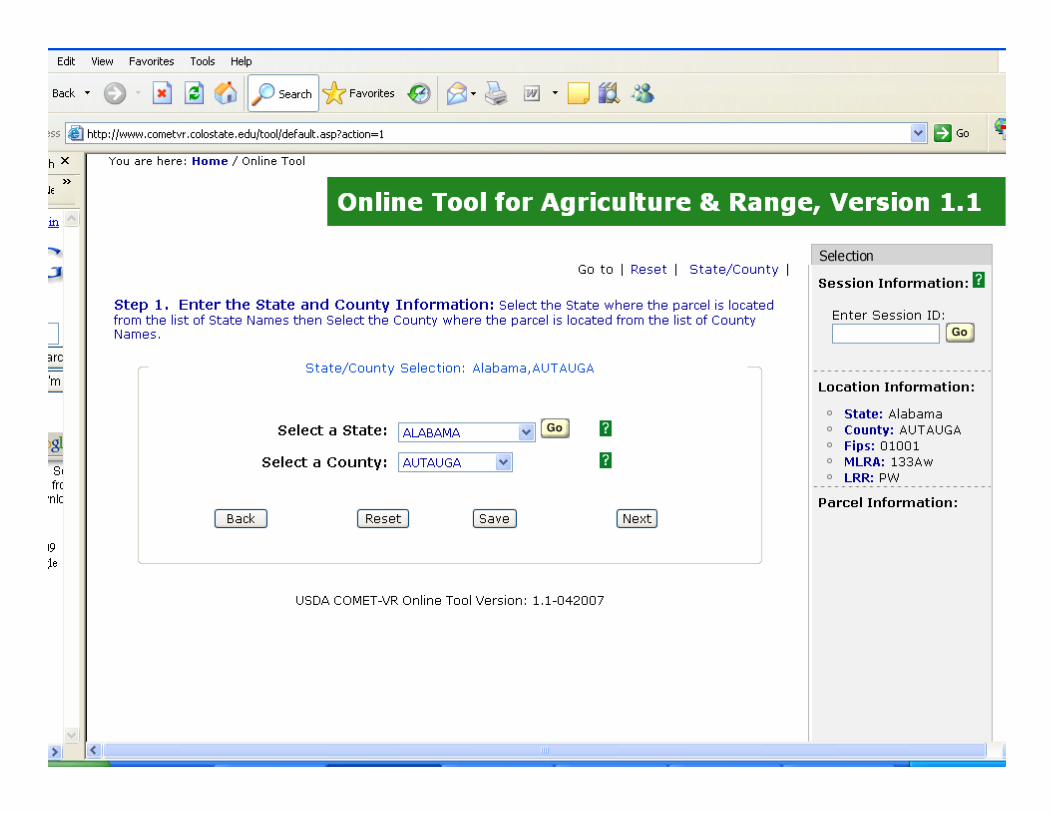
COMET-VR Toolhttp://www.cometvr.colostate.edu/
• The Voluntary Reporting of Greenhouse Gases-CarbOnManagement Evaluation Tool (COMET-VR ) tool is a decision support tool for agricultural producers, land managers, soil scientists and other agricultural interests.
• COMET-VR provides an interface to a database containing land use data from the Carbon Sequestration Rural Appraisal (CSRA) and calculates in real time the annual carbon flux using a dynamic Century model simulation
• Will Compute N2O as well in the near future• USDA does not necessarily endorse any soil GHG accounting tool