Custom Indicators - Futures Trading Platform, Futures Trading Demo

Day Trading Futures
The Manual
By Malcolm Robinson Director, The Mastery Of Trading Ltd http://www.day-trade-futures.co.uk/
Please do NOT distribute this e-book to others. It is for your use only. Unauthorized distribution constitutes theft of my intellectual property.
Copyright © 2002-2003. Malcolm E. Robinson. All rights reserved.

TheMasteryOfTrading.com 2
Risk Disclosure Statement
Futures and Options trading have large potential rewards, but also large potential risk. You must be aware of the risks and be willing to accept them in order to invest in the Futures and Options markets. Don't trade with money that you can't afford to lose. This is neither solicitation nor an offer to Buy/Sell Futures or Options. The contents of this site are for general information purposes, only. Although every attempt has been made to assure accuracy, we assume no responsibility for errors or omissions. Examples are provided for illustrative purposes and should not be construed as investment advice or strategy. No representation is being made that any account will or is likely to achieve profits or loses similar to those discussed on this web site. Hypothetical or simulated performance results have certain inherent limitations. Unlike an actual performance record, simulated results do not represent actual trading. Also, since the trades have not actually been executed, the results may have under-or-over compensated for the impact, if any, of certain market factors, such as lack of liquidity. Simulated trading programs in general are also subject to the fact that they are designed with the benefit of hindsight. Past performance is not indicative of future results. Malcolm Robinson and The Mastery Of Trading Ltd do not intend to give investment advice or to invite customers to engage in investment business through this web site.
Copyright © 2002. Malcolm E. Robinson. All rights reserved
TheMasteryOfTrading.com 3
Welcome Thank you for purchasing this futures trading course. This is an exciting time to be trading the Futures Markets. We are at the dawn of a new era of trading bought about by the impact of the Internet. In Section I of this course I will take you through the theory behind the Futures Market and explore the practical knowledge you must have to be able to trade effectively. In Section II, Trading Skills, I explore how to read the market. My approach to trading evolved through my experience as a floor trader on LIFFE (London International Futures and Options Exchange). Working as a local (independent floor trader) gave me the opportunity to immerse myself in this business, trading 100’s of times a day, 5 days a week. Over time I have developed my understanding of how the markets work and what causes the price to move. My message is deceptively simple and when fully grasped will lift a veil from before your eyes that will enable you to make sense of the seeming random nature of price movement. I hope that you enjoy reading this book and welcome any comments and feedback. Feel free to contact me at anytime. Sincerely
Malcolm Robinson The Mastery Of Trading Ltd Bridgewater Business Centre 210 High Street Lewes East Sussex BN7 2NH [email protected] 0 1273 403940
Copyright © 2002. Malcolm E. Robinson. All rights reserved

TheMasteryOfTrading.com 4
Contents Welcome
A prelude: What I learned losing £60,000…
Section I Futures Trading Chapter 1: Introduction
Chapter 2: The Futures Market
Chapter 3: Practicalities Of Futures Trading
Chapter 4: The Mechanics of the Trade: Orders Chapter 5: A Direct Access Trading Screen
Section II Trading Skills
Chapter 6: Market Forces
Chapter 7: Bar Charts
Chapter 8: Volume Chapter 9: Trends
Chapter 10: Reading the Current Price
Chapter 11: Executing Trades
Chapter 12: Money Management
Appendix : Market Master User Guide
Copyright © 2002. Malcolm E. Robinson. All rights reserved
TheMasteryOfTrading.com 5
A prelude… What I learned losing £60,000 my first year as a full-time trader During my first year as a local (independent trader) on the floor of LIFFE, I bought and sold 8804 FTSE futures contracts, about 40 contracts per day on average. The result was a loss of £61,620 or -£267 per trading day. I was profitable on 55% of days with an average gain of £1009, my average losing day was -£1780. My biggest one-day gain was £7730 and my biggest loss -£12,426.
As you can probably imagine, this was a difficult time for me. I was trying to work out how to make money consistently. It was the consistency that seemed so hard to find. I was having a regular experience of making money, what was killing me were my losses. It seemed that every time I got ahead by £5-6000 over a period of a week or two, I would lose it all and a few thousand more in the space of a couple of days.
At the time I was too unhappy with my performance to be willing to spend any time analysing my results. If I had I would have discovered that during this period all I needed to do to go from a loss of £61,620 to a small profit would have been to avoid just 10 trading days. Those 10 days cost me a total of £69,169!
At the end of this period I was so frustrated, fed up and stuck that I decided to quit trading and return to a more secure career. It only took me a few weeks to abandon this plan and return to trading. I felt sure that I had the raw talent to become a consistently successful trader, what I needed, I reasoned, was some support. Support to stop me having the huge losing days that were crippling me financially.
I approached a firm I knew that backed traders on the floor and they agreed to back me with £20,000 of trading capital. We would split profits 60:40 and I was set an initial daily loss limit of £500. If I hit my £500 limit the firm’s floor manager would come and tell me to go home. The third day trading I lost about £3500 and nothing happened, no one came to ask me to stop trading. I felt very foolish, but continued to trade for the remainder of the week while avoiding any contact with the floor manager. The following Monday (the week’s losses had totalled about £5000) I got a message to meet with the director with whom I had made the agreement (it transpired he had been away the previous week). I was sure that he was going to say that the deal was off. Instead, to my surprise, he told me how important it was that he could trust me, he needed to know that when the market was volatile he could trust me not to be racking up big losses. He suggested that I start afresh. Needless to say I was both relieved and grateful.
Copyright © 2002. Malcolm E. Robinson. All rights reserved

TheMasteryOfTrading.com 6
So I went back to the trading pit that morning with the determined intention to not lose more that £500.
The next two weeks turned out to be one of the toughest periods of my trading career and one of the most rewarding. Stopping when I was down was hard. I realised that what had been at the root of my large losses was my inability to accept losing at all. To me losing was unacceptable. Such was my intolerance for loss that I lost for ten consecutive days. But as the days progressed, even though I continued to lose £500 a day, I found my mood lifting. I actually started to feel OK about losing as long as it was within my limit.
At the end of this 10-day period of losses a seeming miracle happened; I started to make money. My target was to get to +£1000 and then not give back more than 20% of my gain. So when I had a profitable day I was making between £800 and £2000, for an average of about £1200. Not only did I start to make money, I did so for 15 days in a row, three entire weeks without a loss.
This marked the beginning of a new era of trading for me. In retrospect, I believe that I had been trading scared, scared that I was really a loser. The two weeks of rigidly sticking to my loss limit caused me to revaluate myself. I started to feel good about myself for sticking to my limit. Before it was bad if I lost money, now it was only bad if I lost more than my limit. Before, I never knew whether I was going to make £1000 or lose £5000; now I knew that the worst case was a loss of £500 and that was OK. I started to see that sticking to my trading limits was a sign of strength and my confidence started to rise.
Looking back at my first year’s losing streak, if I had restricted my losing days to -£500 my loss of £61,620 would have turned into a profit of £83,525. Not only that, I think that had I been sticking to a loss limit during that period, my confidence would have been that much greater and my percentage of profitable days would also have been higher.
Copyright © 2002. Malcolm E. Robinson. All rights reserved
TheMasteryOfTrading.com 7
Section I: Futures Trading Chapter1: Introduction The trading revolution We live in very exciting times, the futures industry is going through a revolution, a revolution brought about by advances in technology. How it used to be When I started trading, all futures market orders were executed in a trading pit on the floor of the exchange building. I started out trading the FTSE100 futures market through a discount broker. When I wanted to enter a trade I would call my broker, who was sitting in his office somewhere in the City, he would check my account to make sure I had enough funds, and then phone my order to a phone broker on the floor of LIFFE. The phone broker would write down my order and then phone it through to another phone broker who was situated within shouting distance of the FTSE pit. This broker would write down my order and signal it to his pit broker who would actually execute the order in the pit. As you can imagine, this could take some time, especially when there was a lot of activity. There were multiple potential bottlenecks in this approach and I would often find that my actual fill was some way off the price that was available when I originally entered the order. The trading floor The frustrations of bad fills, inaccurate data and high commissions caused me to go and find out what happened on the floor of the exchange, to see if I could find some alternative to the way I was trading. Through my enquiries, and some chance encounters, I found myself being given a tour of LIFFE by the respected veteran trader David Morgan. When we first walked through the doors that led onto the floor I was met by a barrage of shouting that was soon accompanied by the riotous spectrum of colour and activity that was the hallmark of open outcry trading. As soon as I saw the floor I immediately knew that I had to trade there. What became quickly apparent were the advantages of floor trading and the
Copyright © 2002. Malcolm E. Robinson. All rights reserved
TheMasteryOfTrading.com 8
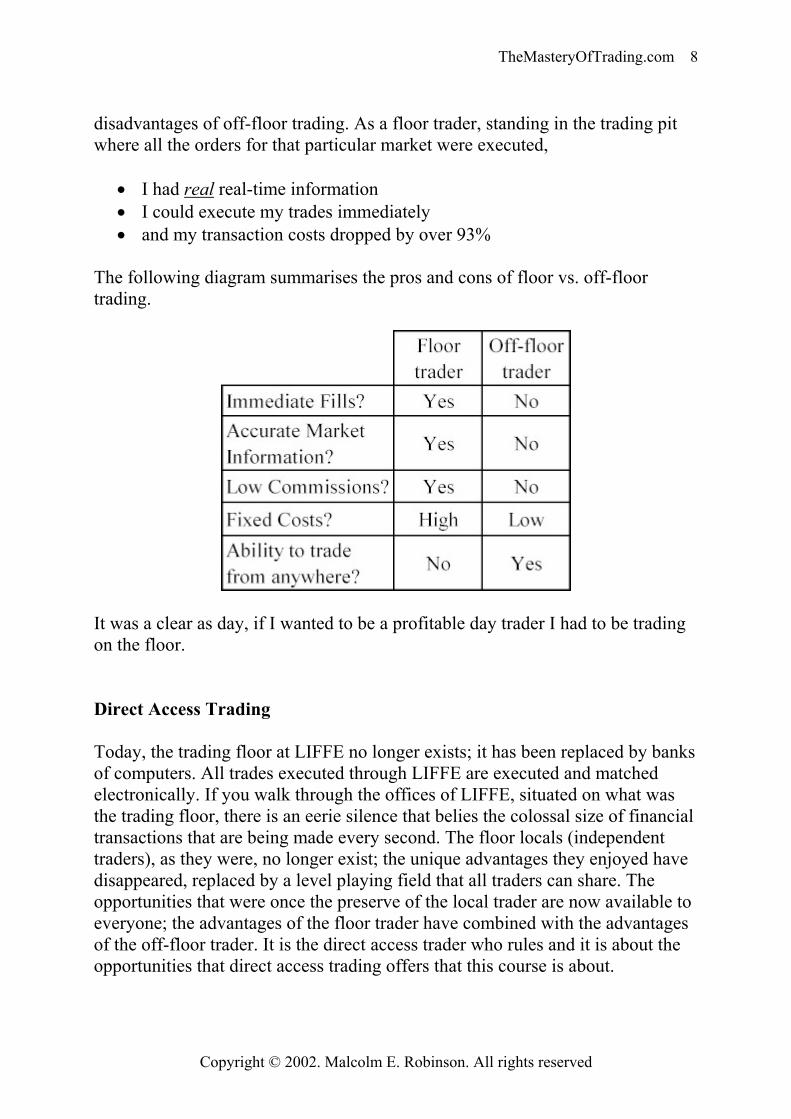
disadvantages of off-floor trading. As a floor trader, standing in the trading pit where all the orders for that particular market were executed,
• I had real real-time information • I could execute my trades immediately • and my transaction costs dropped by over 93%
The following diagram summarises the pros and cons of floor vs. off-floor trading.
It was a clear as day, if I wanted to be a profitable day trader I had to be trading on the floor. Direct Access Trading Today, the trading floor at LIFFE no longer exists; it has been replaced by banks of computers. All trades executed through LIFFE are executed and matched electronically. If you walk through the offices of LIFFE, situated on what was the trading floor, there is an eerie silence that belies the colossal size of financial transactions that are being made every second. The floor locals (independent traders), as they were, no longer exist; the unique advantages they enjoyed have disappeared, replaced by a level playing field that all traders can share. The opportunities that were once the preserve of the local trader are now available to everyone; the advantages of the floor trader have combined with the advantages of the off-floor trader. It is the direct access trader who rules and it is about the opportunities that direct access trading offers that this course is about.
Copyright © 2002. Malcolm E. Robinson. All rights reserved
TheMasteryOfTrading.com 9
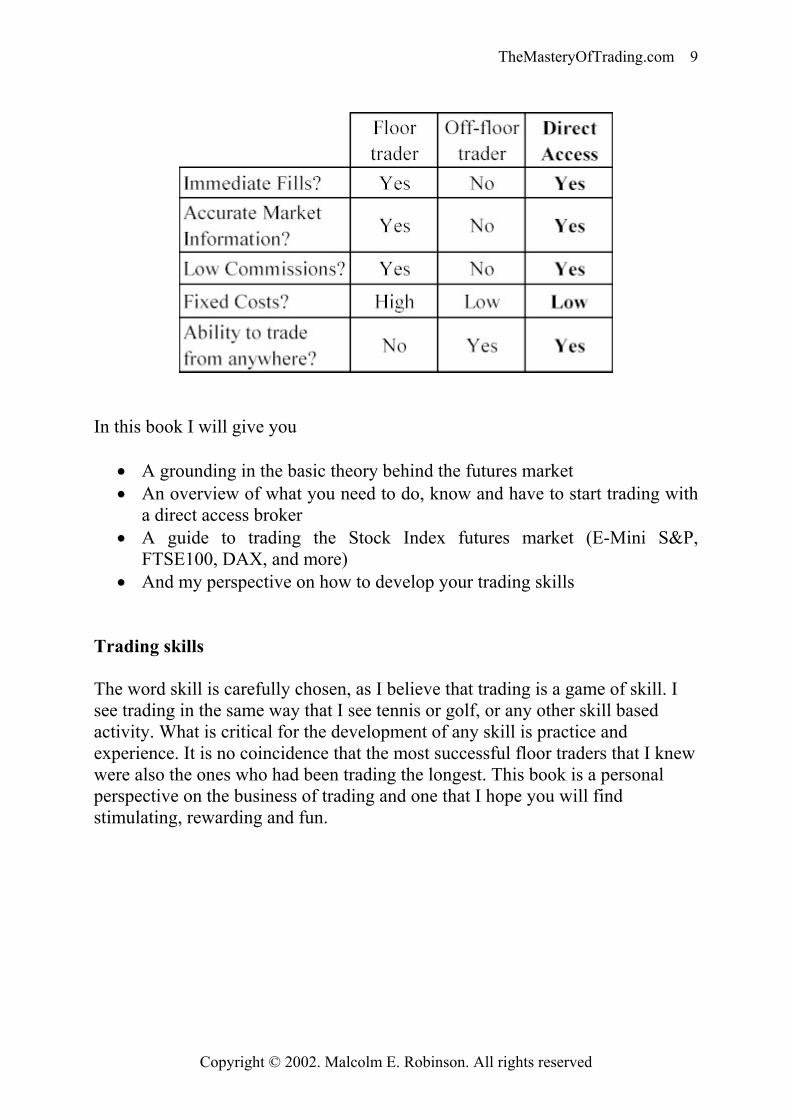
In this book I will give you
• A grounding in the basic theory behind the futures market • An overview of what you need to do, know and have to start trading with
a direct access broker • A guide to trading the Stock Index futures market (E-Mini S&P,
FTSE100, DAX, and more) • And my perspective on how to develop your trading skills
Trading skills The word skill is carefully chosen, as I believe that trading is a game of skill. I see trading in the same way that I see tennis or golf, or any other skill based activity. What is critical for the development of any skill is practice and experience. It is no coincidence that the most successful floor traders that I knew were also the ones who had been trading the longest. This book is a personal perspective on the business of trading and one that I hope you will find stimulating, rewarding and fun.
Copyright © 2002. Malcolm E. Robinson. All rights reserved
TheMasteryOfTrading.com 10
Chapter 2: The Futures Market What are Futures? A futures contract is a legally binding agreement between a buyer and a seller that calls for the seller to deliver to the buyer a specified quantity (and quality, for commodities) of a specific asset at a future date for a price agreed today. It is important not to get confused about what the word future refers to. Futures traders are not trading future prices, we are trading today’s prices, but the settlement is taking place in the future. So we buy if we think prices will increase and sell if we think prices will drop. If I buy (or sell) a futures contract today, I don’t have to hold it until the contract expires; I can simply choose to sell it (or buy it) in the market at the prevailing price. Futures contracts are bought and sold in the regulated environment of a futures exchange, such as the Chicago Board of Trade (CBOT) in the U.S. and the London International Futures and Options Exchange (LIFFE) in the U.K. Origins of Futures
Futures were originally developed to help offset the risks and uncertainties experienced by farmers and merchants due to the fluctuating supply and demand for produce. Take for example a coffee plantation farmer. The price that he will receive for his beans will vary according to the vagaries of supply and demand. In a year when supplies are limited and demand is high, prices will be high. In a year when demand falls and the supply is plentiful, the price will fall. The coffee merchant also experiences the same turbulence in prices due to fluctuating supply and demand. The only difference is that a good price for the farmer is bad for the merchant and vice versa. If neither the farmer nor the merchant knows what the price of beans will be at harvest time, it is difficult for them as they do not know how much money they can spend now in anticipation of future profits.
It makes sense for the farmer and the merchant to get together early in the season and agree the price to be paid for the produce at harvest time. This way the farmer can plan his expenses and the merchant can set his prices. In effect they are negotiating a type of futures contract, which provides them a way of eliminating the risk they face due to the uncertain future price of coffee beans.
Copyright © 2002. Malcolm E. Robinson. All rights reserved

TheMasteryOfTrading.com 11
Futures markets have evolved to include markets whose underlying asset is a financial asset, such as a bond or a portfolio of stocks. Most of the contracts traded can be classified as either commodity futures or financial futures, depending on whether the underlying asset is a commodity or a financial asset. Futures Exchanges The Chicago Board of Trade (CBOT) was established in 1848 to allow farmers and merchants to negotiate future prices for their produce. The main task of the exchange was to standardize the quantity and quality of the produce that was traded. CBOT now offers futures contracts on many different underlying assets, including corn, oats, soybeans, wheat, silver and Treasury bonds. In 1919, the Chicago Mercantile Exchange (CME) was created. The exchange has provided a futures market for many commodities including pork bellies & live cattle. In 1982, it introduced a futures contract on the S&P 500 stock index. The London International Futures and Options Exchange (LIFFE) was founded in 1982. Futures markets traded on LIFFE include the FTSE100, the GILT and Short Sterling. LIFFE has experienced huge growth, over 40% a year, since it started. In 2001 a record 216 million contracts were traded, representing approximately £96 trillion in value. EUREX started life as the DTB, the German futures exchange. The DTB has always been an electronic exchange and started back in 1990, when electronic exchanges were still considered to be inferior to the open outcry system. One of the biggest futures markets in the world is the German Bund, which, during the first half of the 90’s, was the biggest contract traded on LIFFE. The Bund pit on the floor of LIFFE was the biggest and the most active, it was the heart of the trading floor. The Bund was also traded on the DTB, but in much smaller quantities. Inevitably, as the electronic market became more stable, more of the Bund business was routed through the DTB. The Bund market was growing all the time, so even though the DTB was taking an increasingly larger share it was not apparent on the floor of LIFFE, as the business there was also increasing. When the share of Bund transactions executed through the DTB reached 50% there was a sudden exodus of trading from LIFFE to the DTB. The Bund pit on the floor of LIFFE all but vanished in just a couple of weeks. The Trading Pit & The Electronic Market
Copyright © 2002. Malcolm E. Robinson. All rights reserved

TheMasteryOfTrading.com 12
All trading on exchanges used to take place in what are called trading pits. These are polygon shaped rings with steps descending into the centre. The traders stand in the pits on the steps facing each other. The traders in the pit are either brokers, whose job is to execute (by open outcry) the orders of other traders who are outside the pit or exchange, or locals, who are independent traders trading purely for their own profit. Around each pit, which is used as a marketplace for only one contract, there are phone booths manned by phone brokers. An order, originating from outside the exchange, is placed by telephone, with a phone broker, who then signals the order to their broker in the pit, who executes it. The value of the pit brokers is obvious, the value of the local is less apparent. Locals, though, perform an essential role for the market. Although the aim of the local is to create a profit for themselves, the by-product of their active trading is that they create liquidity in the market. Liquidity is essential if a market is to thrive. Potential market participants are only interested in trading markets with reasonable liquidity. Liquidity offers the assurance that they will be able to enter and exit positions as and when they want. In recent years electronic market places have risen to replace the open outcry markets. Open outcry still predominates on the U.S. exchanges, although with an increased reliance on electronic aids. Electronic markets have many benefits over the traditional markets. The costs of trading are reduced, access and transparency are improved, and a level playing field is created. LIFFE decided to become an electronic exchange in 1998 and has gradually moved all their individual futures markets from the pits to LIFFE Connect, their totally electronic trading platform. What are Futures used for? There are 3 primary reasons for participating in the futures market.
• Hedging is taking a futures position to protect the value of an asset. If you have an investment portfolio of UK shares and you believe that the market is due for a correction (a fall), you could sell the FTSE100 futures market. This would mean that if the market fell, although your portfolio would drop in value, your futures position would profit and offset your portfolio’s loss.
• Arbitrage is when an opposing position is taken simultaneously in two
markets with a view to making a profit from the change in the difference in prices. For example, if you felt that the price of the FTSE100 futures was trading at too great a premium to the underlying cash market, you
Copyright © 2002. Malcolm E. Robinson. All rights reserved

TheMasteryOfTrading.com 13
could sell the futures and simultaneously buy the cash market. If you were correct the markets would converge creating a profit.
• Speculation is trading for profit by anticipating the movement in the
market. If you felt that the market was about to rise you could buy the FTSE100 futures, taking a long position; or if you felt it was about to drop you could sell the FTSE100 futures, a short position.
Futures Prices, Fair Value & Convergence to Cash Price The difference between the futures price and the cash price is the cost of carry or the cost of ownership of the asset. For example if you compare exposure to the gold market with a futures contract as opposed to ownership of gold bullion. The futures market allows you exposure to the gold market without the costs associated with ownership of the physical gold: storage, security, financing etc. Hence you would expect the cost of a futures contract to be greater than the cash price. This difference will then diminish as the futures contract approaches expiry. At the close of the last trading day the price will be equal to, or very close to, the cash price. Arbitrageurs ensure that the futures price stays closely bound to the fair value price, which is the price at which there is no advantage in holding a position in the futures market as opposed to the underlying cash market or vice versa. Using the FTSE100 futures market as an example. Assuming the following: Ftse100 Index (Cash) stands at 5000 (£50,000 at £10 a point) Interest Rate 4% Dividend Rate 2% Contract expires in: 3 months FTSE100 Futures = cash price + interest - dividends Fair Value = 50,000 + ((50,000 x 4%) - (50,000 x 2%)) / 4 = 50,000 + (2000-1000) / 4 = 50,000 + 250 = 50,250 So we would expect the FTSE100 to be trading at, or close to, 5025. Usually the cost of buying the shares that make up the FTSE100 index is greater than the dividend yield so the futures prices will trade at a price higher than the underlying index. Since dividends are paid unevenly throughout the year, the
Copyright © 2002. Malcolm E. Robinson. All rights reserved
TheMasteryOfTrading.com 14
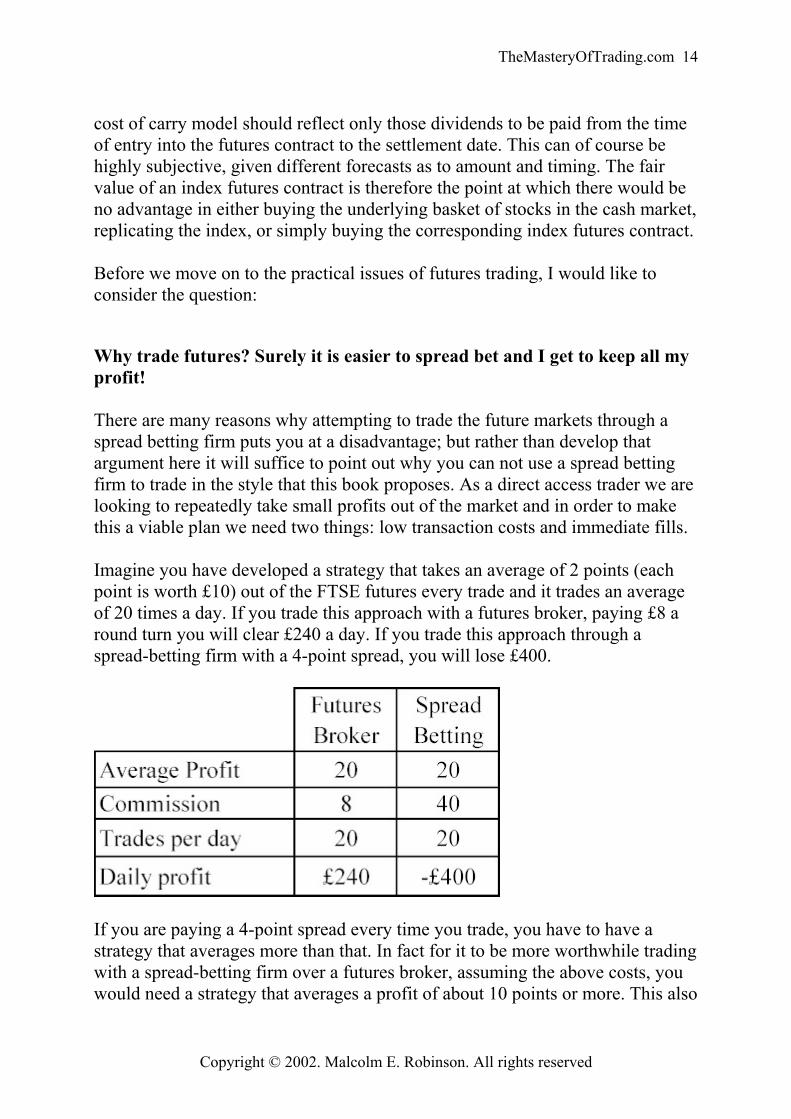
cost of carry model should reflect only those dividends to be paid from the time of entry into the futures contract to the settlement date. This can of course be highly subjective, given different forecasts as to amount and timing. The fair value of an index futures contract is therefore the point at which there would be no advantage in either buying the underlying basket of stocks in the cash market, replicating the index, or simply buying the corresponding index futures contract. Before we move on to the practical issues of futures trading, I would like to consider the question: Why trade futures? Surely it is easier to spread bet and I get to keep all my profit! There are many reasons why attempting to trade the future markets through a spread betting firm puts you at a disadvantage; but rather than develop that argument here it will suffice to point out why you can not use a spread betting firm to trade in the style that this book proposes. As a direct access trader we are looking to repeatedly take small profits out of the market and in order to make this a viable plan we need two things: low transaction costs and immediate fills. Imagine you have developed a strategy that takes an average of 2 points (each point is worth £10) out of the FTSE futures every trade and it trades an average of 20 times a day. If you trade this approach with a futures broker, paying £8 a round turn you will clear £240 a day. If you trade this approach through a spread-betting firm with a 4-point spread, you will lose £400.
If you are paying a 4-point spread every time you trade, you have to have a strategy that averages more than that. In fact for it to be more worthwhile trading with a spread-betting firm over a futures broker, assuming the above costs, you would need a strategy that averages a profit of about 10 points or more. This also
Copyright © 2002. Malcolm E. Robinson. All rights reserved
TheMasteryOfTrading.com 15
assumes that you can execute such a strategy with the same efficiency with the spread firm as you could in the real futures market, which is by no means a given. If you have developed a strategy that averages 10 points or more, then I would recommend paper trading in both the futures market and with a spread firm to see how the results differ.
Copyright © 2002. Malcolm E. Robinson. All rights reserved
TheMasteryOfTrading.com 16
Chapter 3: Practicalities Of Futures Trading Specification of the Futures Contract All futures contracts must specify the following details: • The Unit of Trading/Contract Size gives a precise definition of the quantity
(and quality) of the underlying asset. • Delivery Months/Day. Certain months are designated for the contract to
expire and a certain day in that month is designated for delivery. • The Last Trading Day is the last day that contracts can be bought or sold
prior to the delivery day. If you hold a contract at the close of the last trading day you will have to receive or deliver the underlying asset of the contract. If you are trading live cattle, for example, it is apparent why you must make sure you close out your positions well before the last trading day (unless you are a farmer).
• Quotation/Tick Size/Tick Value. The price quote describes how the quote is derived, the tick size is the minimum movement that the price can make and the tick value is the change in value of one contract for a change in price of one tick.
• Trading Hours stipulate the hours in the business day when the market is open for trading
• Settlement describes how the contract is settled at expiry. All index futures are settled in cash, so there is no need to be concerned if you have a position open at expiry.
Copyright © 2002. Malcolm E. Robinson. All rights reserved

TheMasteryOfTrading.com 17
FTSE 100 Index Future
• Contract size: Valued at £10 per index point (e.g. value £65,000 at 6500.0)
• Delivery months: March, June, September, December (nearest three available for trading)
• Last trading day: 10:30:30 (London time) - Third Friday in delivery month
• Quotation: Index points, with one decimal place (e.g.6500.5) • Tick size (minimum price movement): 0.5 • Tick value: £5.00 • Trading hours: 08:00 - 17:30 (London time)
E-mini S&P Future
• Contract size: Valued at $50 per index point (e.g. value £51,500 at 1030.00)
• Delivery months: March, June, September, December (nearest three available for trading)
• Last trading day: 08:30 (Chicago time) - Third Friday in delivery month
• Quotation: Index points (e.g.1030.25) • Tick size (minimum price movement): 0.25 • Tick value: $12.5 • Trading hours: Virtually 24 hours, but most liquidity when big S&P is
open: 08:30-15:15 (Chicago time)
Copyright © 2002. Malcolm E. Robinson. All rights reserved

TheMasteryOfTrading.com 18
Dax Futures
• Contract size: Valued at EUR 25 per index point (e.g. value EUR 112,500 at 4500)
• Delivery months: March, June, September, December (nearest three available for trading)
• Last trading day: 08:30 (Chicago time) - Third Friday in delivery month
• Quotation: Index points, with one decimal place (e.g.4500.5) • Tick size (minimum price movement): 0.5 • Tick value: EUR 12.5 • Trading hours: 08:50-20:00 (CET)
For contract specifications for other futures contracts visit the exchange web sites.
Copyright © 2002. Malcolm E. Robinson. All rights reserved

TheMasteryOfTrading.com 19
Margins Margins are effectively deposit you have to pay in order to take a position in a futures market. If you wanted to buy one FTSE100 futures contract and the margin requirements are £5000 per contract, then you must have at least £5000 in your trading account. If you wanted to buy 5 contracts you would need a minimum of £25000 in your account. This margin is called initial margin, as it is what is required to initiate a position. Once you have a position in the market your account is marked to market at the end of each trading day, this means that your account balance is adjusted to reflect your gain or loss for the day. If your account balance falls below the maintenance margin requirement you will be required to increase the funds in your account to meet the initial margin requirements (this amount is called variation margin) or have your position liquidated. For example: FTSE100 Futures Initial Margin £5000 Maintenance Margin £3500 Lets say an investor buys 2 FTSE 100 Index futures contracts for a price of 5300. His initial margin requirement is 2 x £5000 = £10,000, which is the minimum he must have in his account to open this position. Let us assume that he has in his account exactly £10,000 when he buys the 2 contracts. At the end of the first day the price of the FTSE 100 Index futures has dropped to 5100, a fall of 200 points. The point value for the FTSE is £10, so our trader has a loss at the end of the first day of 2 x £10 x 200 = £4000. This will be reflected in his account, which will be reduced to £6000. As this is below the maintenance margin requirement of £7000, he will need to deposit £4000 into his account to maintain his position.
Copyright © 2002. Malcolm E. Robinson. All rights reserved

TheMasteryOfTrading.com 20
Delivery The majority of market participants close out their positions before the contract expiration date. Unless you are participating in the market as a hedging vehicle and you want to receive or deliver the underlying asset, it is very important to close out your position before expiration. Having said that, for some financial futures contracts any positions still open at expiration are settled in cash. It would be impossible to deliver, for example, the FTSE 100 index at the precise value specified, so such markets are settled in cash on expiry.
Anyone who has a position that they wish to keep, roll it over to the next contract month. So if I am long one FTSE 100 futures contract in early March and wish to remain long, I will sell my March contract and simultaneously buy a June contract. I will therefore close out the March position, which is close to expiry, and initiate a June position so that I am still long one contract. As to the date that one might roll their positions forward, there are two approaches. Either choose a particular day, for example 10 trading days before expiry, or, choose to roll positions forward when the trading volume in the next available month is greater than the near month.
Copyright © 2002. Malcolm E. Robinson. All rights reserved

TheMasteryOfTrading.com 21
Chapter 4: The Mechanics of the Trade Orders There are various types of order you can use to initiate or close a position, depending on your objectives. Market Order: This is a request to trade (either buy or sell) at the best available price. Market FTSE 100 Futures BID: 6432 OFFER: 6434 A market order to sell would be filled at the best available price, i.e. 6432 A market order to buy would be filled at the best available price, i.e. 6434 Market orders are always executed Limit Order: A limit order specifies the worst price that an order can be filled at. It sets a limit to the price the trader is willing to trade. If a limit order to buy at 6430 has been placed in the market, the order can only be executed at 6430 or better (i.e. 6430 or less). • A buy limit order is usually placed below the current offer price • A sell limit order is usually placed above the current bid price Stop Order: A stop order to trade at the market when a specified price trades. So a buy stop at 6460 will become a market order to buy as soon as 6460 or higher trades. A sell stop at 6410 will become a market order to sell as soon as 6410 or lower trades. • A buy stop is placed above the current market • A sell stop is placed below the current market. The Pros and Cons of Market Orders. A market order will always be filled immediately; it is therefore a useful order when you have to get in or out of the market. Most obviously if you have a losing position and you are uncertain what to do, get out with a market order. The main disadvantage of market orders is that you do not know the price that you will be filled at, it may be worse than the price that was available when you first entered the order. The difference between the price you hoped to trade at and the price that you actually get filled at is called slippage. Slippage represents
Copyright © 2002. Malcolm E. Robinson. All rights reserved

TheMasteryOfTrading.com 22
one of the hidden costs of trading and for an active day trader it needs to be minimised. If you trade 100 times a day, an average of 0.5 points slippage per trade will cost £500 in the FTSE futures market! The Pros and Cons of Limit Orders. With a limit order you specify the worst fill price, so with a limit order there is no slippage. The main disadvantage to using limit orders is that there is no guarantee that they will be filled. So if I have a limit order to buy 1 FTSE contract at 6432 and the market trades at 6432 (but no lower), I may not get a fill. This could happen if, for example, my buy order was entered after a 10 lot order to buy at 6432, so for my order to be filled 11 lots would need to trade at 6432. The market operates on a first come first serve basis. As it is important to avoid slippage and to avoid paying the spread (the difference between the bid and the offer) limit orders are the best orders to use for entering a position. At times you won’t get filled and you will miss a trading opportunity, but the cost advantages are significant. Tip: One of the big advantages to electronic trading over the open outcry system is that there is no disadvantage to being a small trader. There is also no problem putting your limit orders just inside the best bid or offer. On the floor it was frowned upon to put a small bid just ahead of a bigger order. So if the market was 6431 bid for 50 and I start bidding 6431.5 for 1, it would be considered poor form. The advantage to me in placing such a bid is that I would get hit by the next sell order entering the pit and if I decide it’s not a good trade I can turn and sell the 31 bid. On the screen you can do what you like, there is no peer pressure, no one to keep happy. So an effective way to avoid paying the spread and to increase the likelihood of getting hit, is to place your bid one tick inside the current bid, or place your offer one tick inside the current offer. Of course you can’t do this if the spread is only one tick wide.
Copyright © 2002. Malcolm E. Robinson. All rights reserved

TheMasteryOfTrading.com 23
The Pros and Cons of Stop Orders. Stop orders can be used to open a position or to close a position. When used to open a position they are usually for entering a trade when the market breaks out of a range or makes a new high or low. If they are used to exit a position they are sometimes referred to as a protective stop or a stop loss, as they are used to minimise losses. The advantage of using stops is that you can place them in the market ahead of time and if the market trades at the specified price the order will definitely get filled. The disadvantage is that the fill price and the subsequent slippage is unpredictable (and usually significant). Trailing Stops A trailing stop is the name used to describe the action of moving your stop closer to the current price as the market moves in your favour. Lets say you open a long position in the FTSE and you place a sell stop 10 points below your entry price. The market starts to rise and when you are in profit by 15 points you move your stop to 10 points below the current price, to ensure a 5 point gain should the market reverse. You continue to adjust your stop so that it is always 10 points below the current price, but you never lower your stop. This way every time you move your stop you are locking in a greater profit. Eventually the market will reverse and your stop will be hit taking you out of the position with a profit. Action: Use Market Master to familiarise yourself with different orders.
Copyright © 2002. Malcolm E. Robinson. All rights reserved
TheMasteryOfTrading.com 24
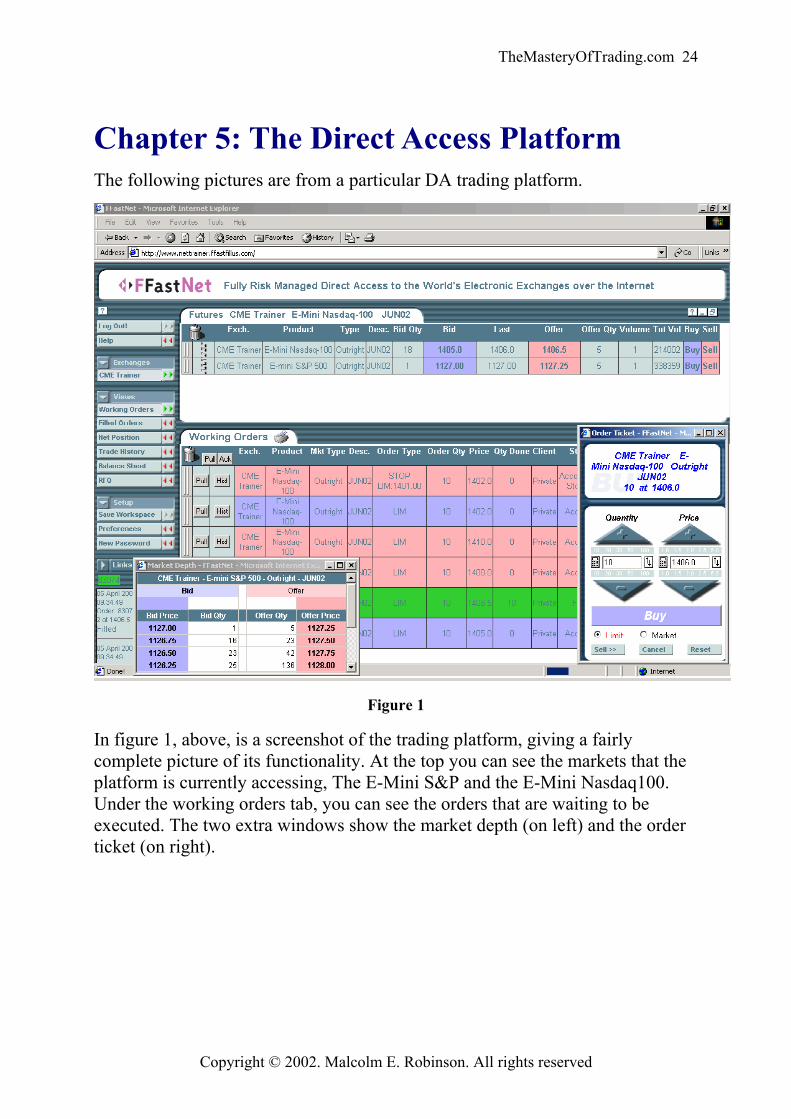
Chapter 5: The Direct Access Platform The following pictures are from a particular DA trading platform.
Figure 1
In figure 1, above, is a screenshot of the trading platform, giving a fairly complete picture of its functionality. At the top you can see the markets that the platform is currently accessing, The E-Mini S&P and the E-Mini Nasdaq100. Under the working orders tab, you can see the orders that are waiting to be executed. The two extra windows show the market depth (on left) and the order ticket (on right).
Copyright © 2002. Malcolm E. Robinson. All rights reserved

TheMasteryOfTrading.com 25
Figure 2
In figure 2, is a detail showing the market data and the working orders. The markets (top two grey lines) are the FTSE100 future, represented by the letter Z, and the Long GILT future, represented by the letter R. You can just make out the price data, which includes the bid quantity, the bid price, the last traded price, the offer price, the offer quantity, the last trade volume and the total volume. To trade you click on a price or on the volume, or on the buy and sell buttons on the left. Any of these actions bring up the order window, shown below.
The working orders section contains details of every order that is waiting to be filled. Once they have been filled, they turn green and can be transferred to the filled order book (another window). The menu on the left gives access to the other windows and the settings.
Copyright © 2002. Malcolm E. Robinson. All rights reserved

TheMasteryOfTrading.com 26
Figure 3
Figure 3 is the order window; it is showing an order to buy 2 June FTSE futures contracts at 5229.5 or better (limit order). In this window you can alter the quantity, the price, the order type (either limit or market) and whether it is a buy or a sell order. To enter any other type of orders, the more options button expands the window to reveal…
Copyright © 2002. Malcolm E. Robinson. All rights reserved

TheMasteryOfTrading.com 27
Figure 4
Here (figure 4) we can enter stop and stop limit orders and various other options.
Copyright © 2002. Malcolm E. Robinson. All rights reserved

TheMasteryOfTrading.com 28
Figure 5
Figure 5 shows the market depth window. Here we can see the current bid and offer (52331 and 5232) and the next best bid and offer for 10 levels. Tip: The depth of market window is useful for keeping aware of big orders in the market, if you are looking for somewhere to place a stop, tucking it behind a big order is a good idea.
Figure 6
Figure 6 shows the net position window, or your profit and loss window. Above we can see that the trader has a profit of £175 in the FTSE and £1300 in the GILT for a total of 80 contracts bought and old. We can also see that he has no open position and is therefore flat.
Copyright © 2002. Malcolm E. Robinson. All rights reserved

TheMasteryOfTrading.com 29
Figure 7
The last picture, figure 7, shows a window from the pro version of this trading platform. It is a scalp window and allows the trader to trade the market very rapidly. The offer prices and volumes are listed above the central blue bar (scalp bar) and the bids below. The best bid and offer are closest to the scalp bar. You can trade by clicking on the prices or you can trade by clicking on the scalp bar. If you left click on the scalp bar you will enter a bid one tick better than the current bid; and if you right click on the scalp bar you will enter an offer one tick better than the current offer. This allows for a scalper to very quickly and efficiently trade inside the spread.
Copyright © 2002. Malcolm E. Robinson. All rights reserved
TheMasteryOfTrading.com 30
Section II Trading Skills Chapter 6: Market Forces There are two key components to successful trading:
• The ability to read/anticipate the market • The ability to execute the trades
Reading the Market The market is never the same and there is no pattern or behaviour that will be exactly repeated, so reading the market has to be a subjective activity and we can never say for sure what is going to happen next. All we can do is gauge the current market and estimate what will happen. As a trader we need to have an opinion of what will happen, we then trade our opinion getting out as soon as we realise we are wrong. What we are working on, when learning to read the market, is developing an opinion. When I first walked on the floor of LIFFE, the markets seemed pretty chaotic. It was very noisy, there was litter everywhere and the pit traders seemed to be acting in an uncontrolled and raucous way. I imagine it is similar for novices looking at the markets on the screen for the first time. It must appear as if there is no order to the markets, no logic to decipher, just numbers flickering in a random way about the screen. So when I first started on the floor it was hard for me to have an opinion, I didn’t know which way the market was going to go next. Over time, as I started to understand the business of the floor, I started to get a feel for what the market was going to do. Similarly, if a novice watches the market day in day out on the screen, he would inevitably start to make sense of the prices. As they start to make sense of it all they naturally form an opinion of where the market is going next and it is the ability to form such an opinion that all traders need to cultivate.
Copyright © 2002. Malcolm E. Robinson. All rights reserved

TheMasteryOfTrading.com 31
Market Forces The market is a constant struggle between buyers and sellers. Like a tug of war that has no end, the opposing teams are forever trying to push the price in their favour. Buyers always want the price to go higher and sellers always want the price to go lower. I find it very helpful to watch the market with one question in mind: who is in control, the buyers or the sellers? It is by observing the market from this perspective and by seeing control shift from one side to the other it is possible to be alert to new trading opportunities. The information we receive about the market is always giving clues as to who is in control. By becoming adept at reading this information we become adept at anticipating price movements.
Copyright © 2002. Malcolm E. Robinson. All rights reserved

TheMasteryOfTrading.com 32
Chapter 7: Bar Charts A chart is a graphical summary of what has happened in the market so far. The chart is concerned only with price, time (not always, for example not with Point & Figure charts) and volume (not always). So a chart is a summary of all the trades that have taken place in a certain time frame. If we were to chart all of the trades in a particular market over a period of time it would become a very large chart and lose some of the value that a chart offers (representing a lot of information in an easily digestible format). So it is usual for the chart to summarise the trade information is a series of bars, each bar summarising the trades that took place over a specific period of time. Although it may seem that I am writing as if for a complete novice, I am not. I want to explore the fundamentals of price movement so that you have a thorough appreciation for all the information that is available from a chart.
Bars A 5-minute bar starting at 8am will summarise trades from 08:00:00 to 08:04:59. The bar records the opening price, which is the price of the first trade in this time bracket; the closing price, which is the price of the last trade in this time bracket; the high price, which is the highest price traded in this time bracket; and the low price, which is the lowest price traded in this time bracket. So if we are to look at a chart, made up of 5-minute bars, with or without volume, we are seeing a summary of what has happened. I think this is important to be aware of when looking at a chart, we are not looking at the market, we are looking at a summary of it.
Copyright © 2002. Malcolm E. Robinson. All rights reserved
TheMasteryOfTrading.com 33
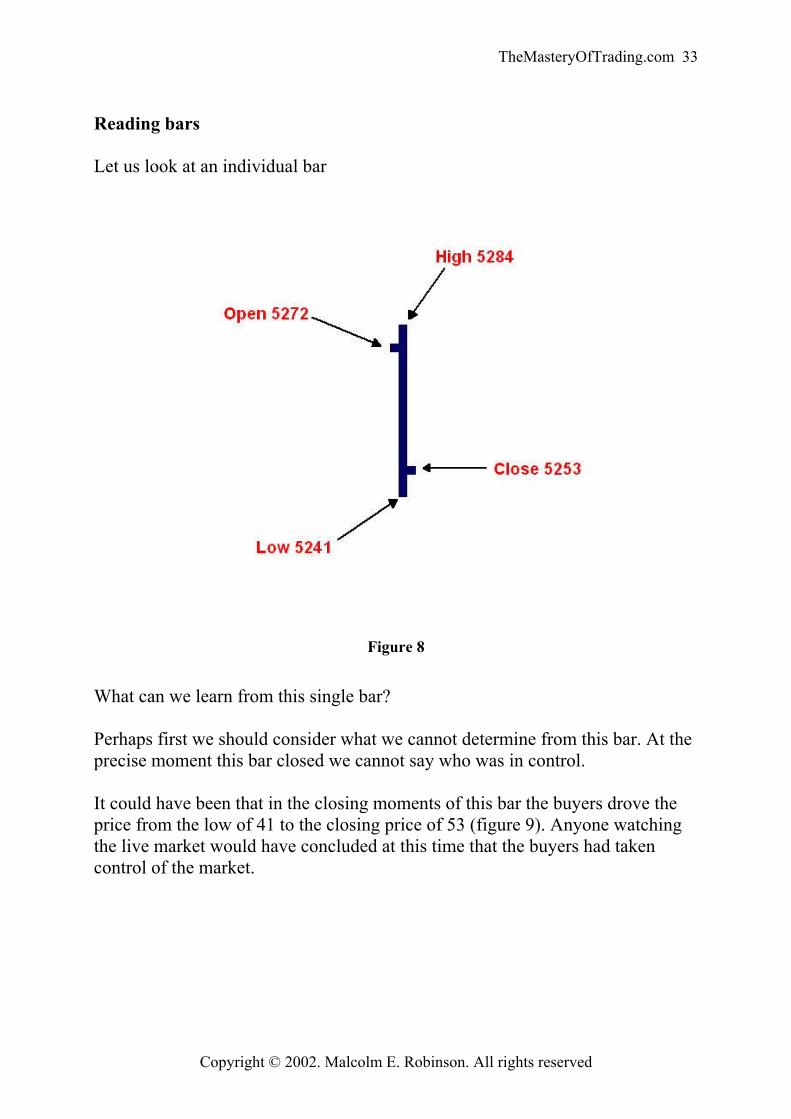
Reading bars Let us look at an individual bar
Figure 8
What can we learn from this single bar? Perhaps first we should consider what we cannot determine from this bar. At the precise moment this bar closed we cannot say who was in control. It could have been that in the closing moments of this bar the buyers drove the price from the low of 41 to the closing price of 53 (figure 9). Anyone watching the live market would have concluded at this time that the buyers had taken control of the market.
Copyright © 2002. Malcolm E. Robinson. All rights reserved

TheMasteryOfTrading.com 34
Figure 9
Or it could have been that in the last few moments of this bar the sellers had just forced the price from 65 down to 53 (figure 10) and they were clearly in control.
Figure 10
We cannot tell which of these two situations occurred, or, in fact, whether another, different scenario was played out during this bar. All we have to work with is the information that the bar presents.
Copyright © 2002. Malcolm E. Robinson. All rights reserved
TheMasteryOfTrading.com 35
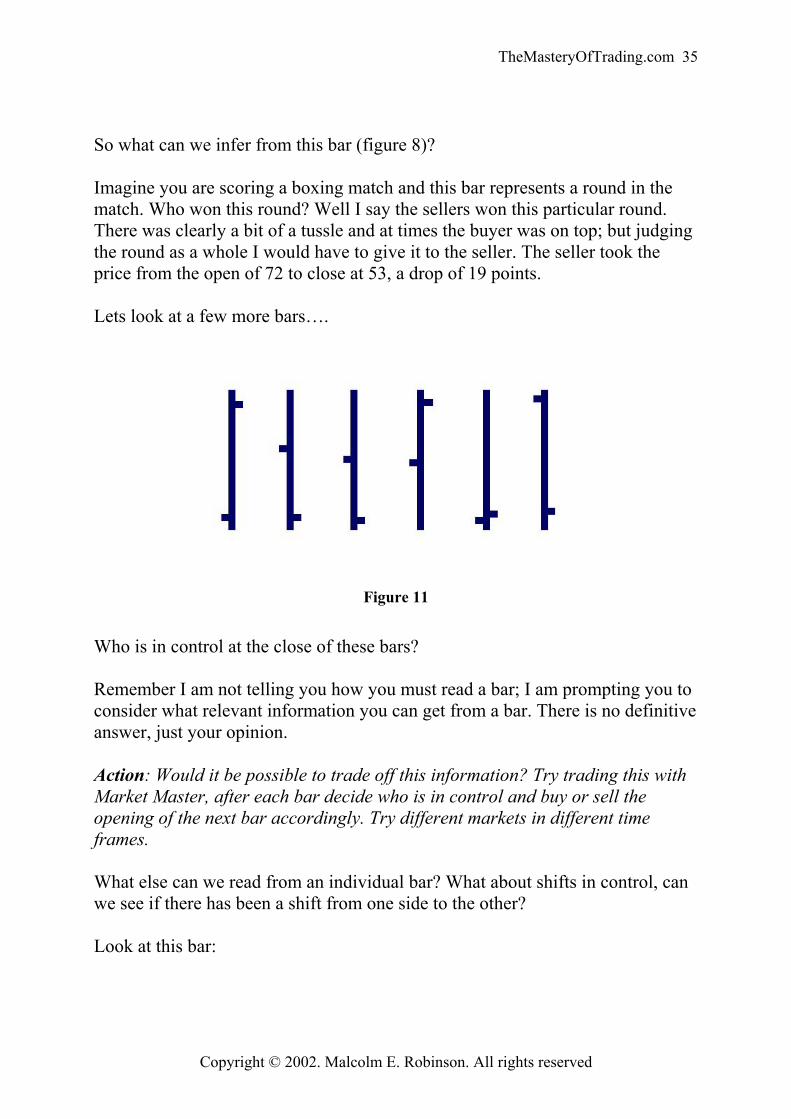
So what can we infer from this bar (figure 8)? Imagine you are scoring a boxing match and this bar represents a round in the match. Who won this round? Well I say the sellers won this particular round. There was clearly a bit of a tussle and at times the buyer was on top; but judging the round as a whole I would have to give it to the seller. The seller took the price from the open of 72 to close at 53, a drop of 19 points. Lets look at a few more bars….
Figure 11
Who is in control at the close of these bars? Remember I am not telling you how you must read a bar; I am prompting you to consider what relevant information you can get from a bar. There is no definitive answer, just your opinion. Action: Would it be possible to trade off this information? Try trading this with Market Master, after each bar decide who is in control and buy or sell the opening of the next bar accordingly. Try different markets in different time frames. What else can we read from an individual bar? What about shifts in control, can we see if there has been a shift from one side to the other? Look at this bar:
Copyright © 2002. Malcolm E. Robinson. All rights reserved

TheMasteryOfTrading.com 36
Figure 12
The sellers won this round, but what else can we gather. Notice that the bar opened at 42 and went all the way up to 58; during this rise the buyers were clearly in control. So we can infer that during this bar control shifted from buyers to sellers. It could have been that control shifted from buyers to sellers and back again many times in this bar, we don’t know; but we can conclude that buyers had control and that sellers gained control from the buyers. So we have more information, sellers won the round and they wrestled control from the buyers. This bar is sometimes called a bearish reversal bar. Look again at the previous bars (figure 11), which of these bars clearly indicate a shift in control? Action: Could we improve our trading with this new information? Try trading with Market Master, this time look to open a position when you see clear evidence of a shift in power from one side to the other and get out on a trailing stop.
Copyright © 2002. Malcolm E. Robinson. All rights reserved
TheMasteryOfTrading.com 37
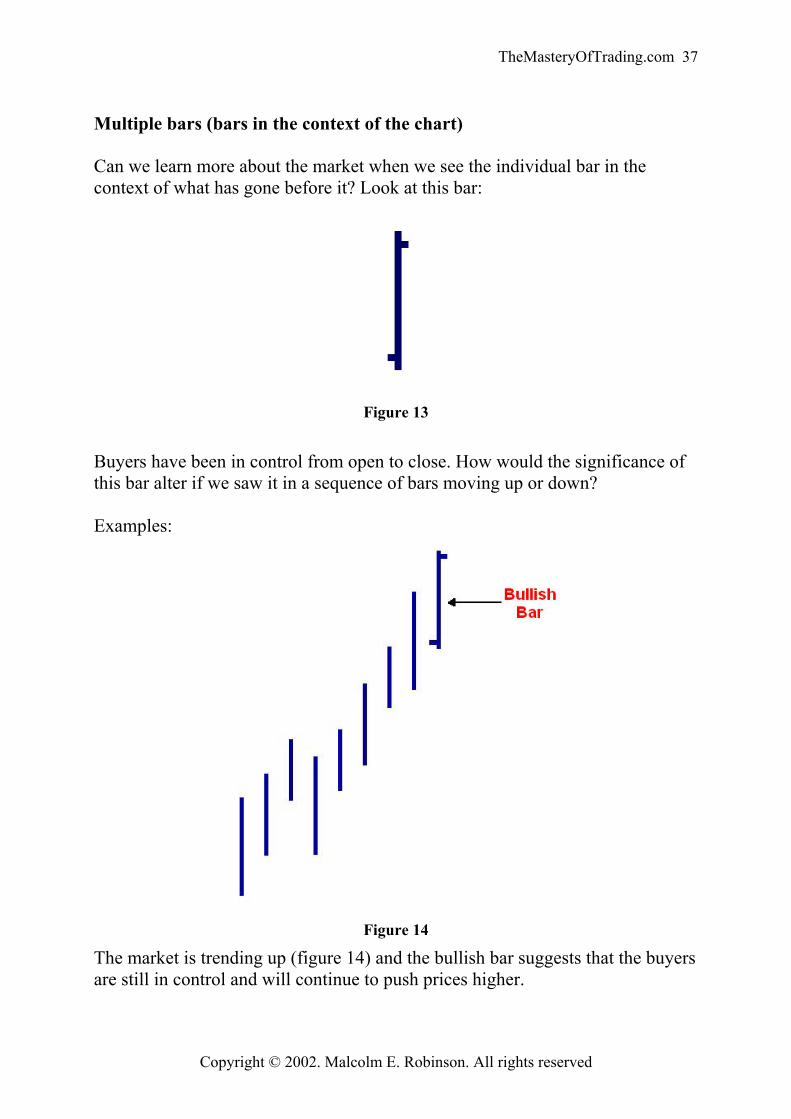
Multiple bars (bars in the context of the chart) Can we learn more about the market when we see the individual bar in the context of what has gone before it? Look at this bar:
Figure 13
Buyers have been in control from open to close. How would the significance of this bar alter if we saw it in a sequence of bars moving up or down? Examples:
Figure 14
The market is trending up (figure 14) and the bullish bar suggests that the buyers are still in control and will continue to push prices higher.
Copyright © 2002. Malcolm E. Robinson. All rights reserved
TheMasteryOfTrading.com 38
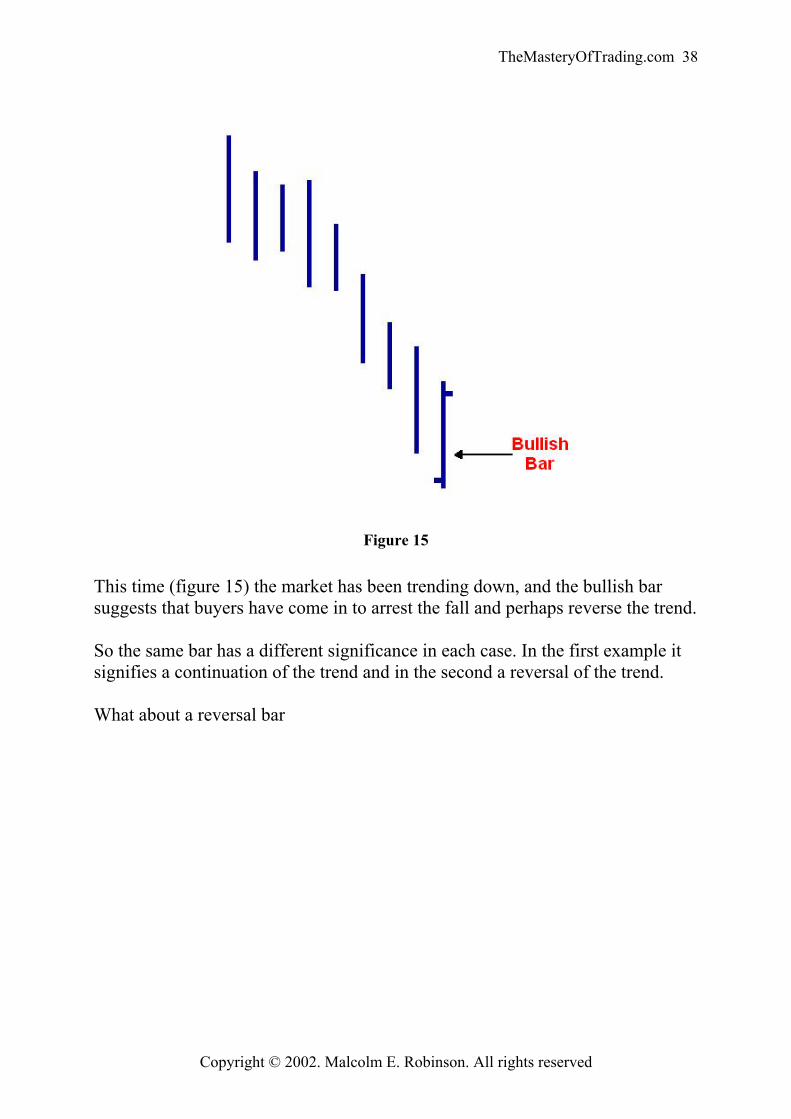
Figure 15
This time (figure 15) the market has been trending down, and the bullish bar suggests that buyers have come in to arrest the fall and perhaps reverse the trend. So the same bar has a different significance in each case. In the first example it signifies a continuation of the trend and in the second a reversal of the trend. What about a reversal bar
Copyright © 2002. Malcolm E. Robinson. All rights reserved

TheMasteryOfTrading.com 39
Figure 16
The last bar (figure 16) a bearish reversal bar, suggests that an attempt by buyers to reverse the trend has failed and prices will continue lower.
Figure 17
The bearish reversal bar seems much more significant (figure 17) when the market has been moving up as it indicates the possible end of the current up trend.
Copyright © 2002. Malcolm E. Robinson. All rights reserved
TheMasteryOfTrading.com 40
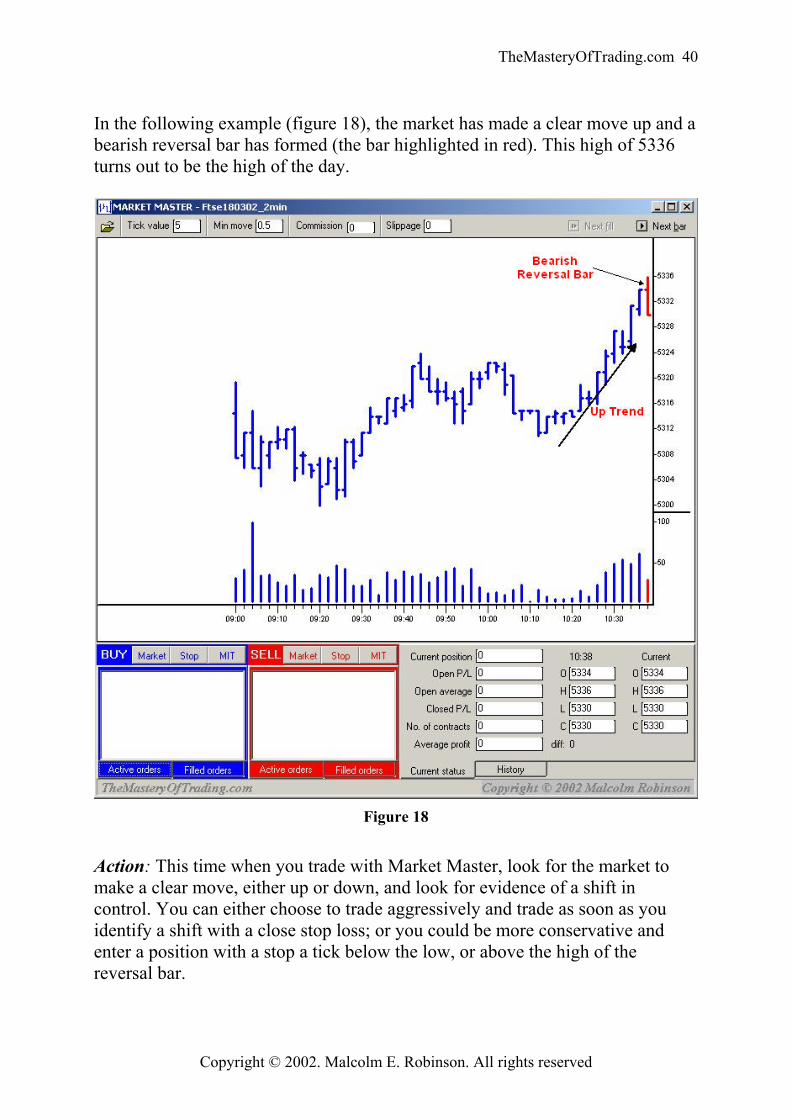
In the following example (figure 18), the market has made a clear move up and a bearish reversal bar has formed (the bar highlighted in red). This high of 5336 turns out to be the high of the day.
Figure 18
Action: This time when you trade with Market Master, look for the market to make a clear move, either up or down, and look for evidence of a shift in control. You can either choose to trade aggressively and trade as soon as you identify a shift with a close stop loss; or you could be more conservative and enter a position with a stop a tick below the low, or above the high of the reversal bar.
Copyright © 2002. Malcolm E. Robinson. All rights reserved

TheMasteryOfTrading.com 41
Chapter 8: Volume Volume in a chart is useful for identifying turning points in a market. Consider a falling market; in order for the trend to reverse from down to up, conditions have to change. In a down trending market sellers are in control (overall), and for the market to turn buyers need to take control: buyers have to come into the market in sufficient quantities to overwhelm the sellers. When buyers come into the market, sufficient to overcome sellers, the volume will increase. An increase in volume does not always coincide with a turning point in the market, and an increase in volume does not always mean the market is turning; but often times, when a market has been moving in one direction, and there is a significant increase in volume, it signifies a change in the balance of power. A change in the current balance in power signals a turning point in the market; or if not a significant turn, a pause at least.
Copyright © 2002. Malcolm E. Robinson. All rights reserved

TheMasteryOfTrading.com 42
Example 1: Again if you look at the chart for March 18th (figure 19), you will notice that as the market rose from the 10:12 low of 5311 to the 10:38 high of 5336, the volume increases. The increase in volume is evidence of resistance; as the market rises so it meets more sellers, until the buyers are exhausted and the sellers gain the upper hand, forcing the price back down.
Figure 19
Copyright © 2002. Malcolm E. Robinson. All rights reserved

TheMasteryOfTrading.com 43
Example 2: Another example comes from later in the same day.
Figure 20
Here we see a bearish reversal bar with increased volume (figure 20). The market appears to have made a decisive upward thrust, but is clearly met with resistance. The strong bullish bar, four bars before the reversal bar, is accompanied by the highest volume, which suggests that this upward thrust may not be as decisive as it appears. After this bar the market trades in a narrow range before breaking to the high of 5334 where more selling resistance was uncovered and the bearish reversal bar was formed. It is easy to see why many traders would be trapped into buying as the market broke out of the top of the
Copyright © 2002. Malcolm E. Robinson. All rights reserved

TheMasteryOfTrading.com 44
trading range set earlier in the afternoon; but when you take into account volume, a different picture emerges. After the formation of the bearish reversal bar the market falls sharply away (figure 21). The first indication that the fall is abating comes in the bounce at 17:12 (red bar below) and again at 17:28 (final bar below), both reversal bars on higher volume.
Figure 21
We see evidence here of support, but as 17:30 (16:30 UK) is effectively the close of the futures market (as it is the close of the cask market), I would not
Copyright © 2002. Malcolm E. Robinson. All rights reserved

TheMasteryOfTrading.com 45
open a new position. Interestingly though, the open the next day is at 5330 and the June FTSE goes on to make a morning high of 5345.
Copyright © 2002. Malcolm E. Robinson. All rights reserved

TheMasteryOfTrading.com 46
Example 3: Here is a more recent example.
Figure 22
The market has fallen (figure 22) and in the last 2 bars we can see that the volume (trading activity) has increased significantly. There is clearly buying resistance (support) to the selling pressure. The next bar (figure 23) is an up bar
Copyright © 2002. Malcolm E. Robinson. All rights reserved

TheMasteryOfTrading.com 47
on lower volume, suggesting that the buying support has absorbed the selling enough to force the prices back up a little. The lower volume on this bar also suggests that the sellers have run out of ammunition to resist this rise.
Figure 23
Copyright © 2002. Malcolm E. Robinson. All rights reserved

TheMasteryOfTrading.com 48
The market rises from here and then starts to fall again (figure 24), but again there is a clear indication of support; a bullish reversal bar with increased volume (red bar, figure 24).
Figure 24
Copyright © 2002. Malcolm E. Robinson. All rights reserved

TheMasteryOfTrading.com 49
The market subsequently rises over 100 points (figure 25).
Figure 25
Copyright © 2002. Malcolm E. Robinson. All rights reserved

TheMasteryOfTrading.com 50
Chapter 9: Trends An up trend is defined as rising highs and rising lows:
Figure 26
A downtrend is defined as falling highs and falling lows:
Figure 27
Copyright © 2002. Malcolm E. Robinson. All rights reserved

TheMasteryOfTrading.com 51
In the example below, figure 28, the market is in a clearly defined downtrend.
Figure 28
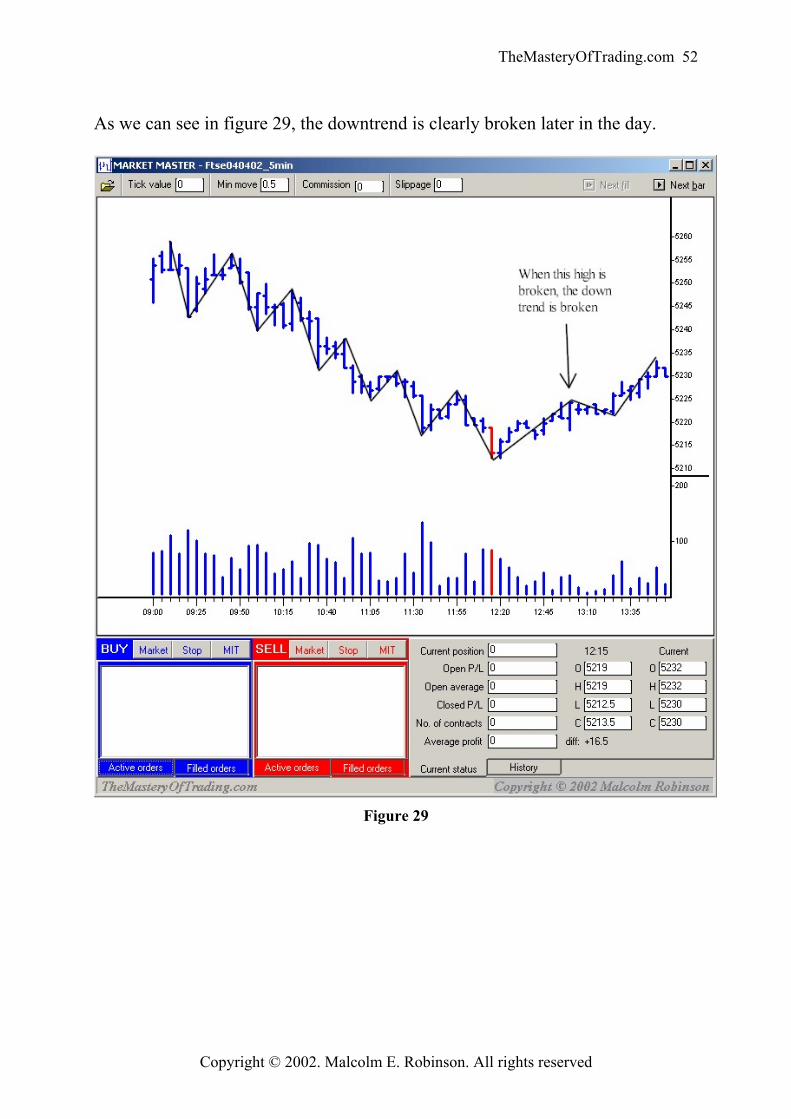
A trend reversal has to be accompanied by a breakdown of the existing trend. So if an up trending market has a series of higher highs and lows, at some point a lower low is made and the up trend is broken. In a down trending market at some point a higher high is made and the downtrend is broken.
Copyright © 2002. Malcolm E. Robinson. All rights reserved
TheMasteryOfTrading.com 52
As we can see in figure 29, the downtrend is clearly broken later in the day.
Figure 29
Copyright © 2002. Malcolm E. Robinson. All rights reserved

TheMasteryOfTrading.com 53
The High/Low Trend Following Strategy In order to be able to trade with the trend, we need to be able to identify the trend. We could use an objective or a subjective method to identify the trend. A subjective method allows for interpretation and flexibility, but is subject to our indecisiveness and hesitation. An objective method allows for no such flexibility, so it won’t always be right, but being rules based and rigid it is open to testing and minimises human error. We know that the definition of a trend is higher highs and higher lows for an up trend and lower highs and lower lows for a downtrend. So an up trend is broken when the last low is broken and a downtrend is broken when the last high is exceeded. My method is simply to buy the breakout of the most recent high and sell the breakout of the most recent low. In order to be able to do this we need to be able to define a high and a low. In this approach we define a high as being a bar (in any time frame) that has two lower highs before it and two lower highs after it. So we will only know if a bar is a high bar after at least two more bars have formed. Similarly a low bar has to have two higher bars before it and two higher lows after it.
Figure 30
Copyright © 2002. Malcolm E. Robinson. All rights reserved

TheMasteryOfTrading.com 54
Figure 31
The two bars in the diagram above have equal lows and as they have two higher lows before and two higher lows after, they form a low bar. So when a high bar has been formed I place a stop one tick above the high of the high bar (in the FTSE I round this to the nearest point, so if the high is 4543 or 4543.5, I place a buy stop at 4544). When a low bar has been formed I place a stop to sell one tick below the low of the low bar.
Copyright © 2002. Malcolm E. Robinson. All rights reserved
TheMasteryOfTrading.com 55
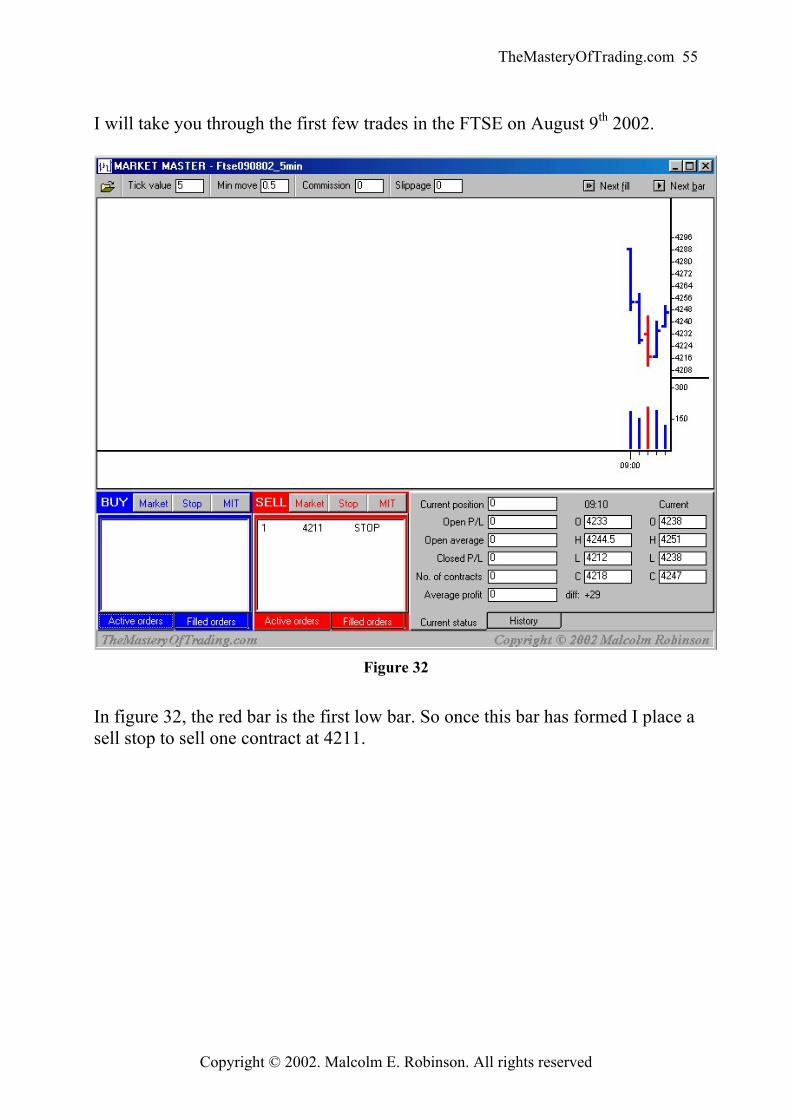
I will take you through the first few trades in the FTSE on August 9th 2002.
Figure 32
In figure 32, the red bar is the first low bar. So once this bar has formed I place a sell stop to sell one contract at 4211.
Copyright © 2002. Malcolm E. Robinson. All rights reserved
TheMasteryOfTrading.com 56
Figure 33
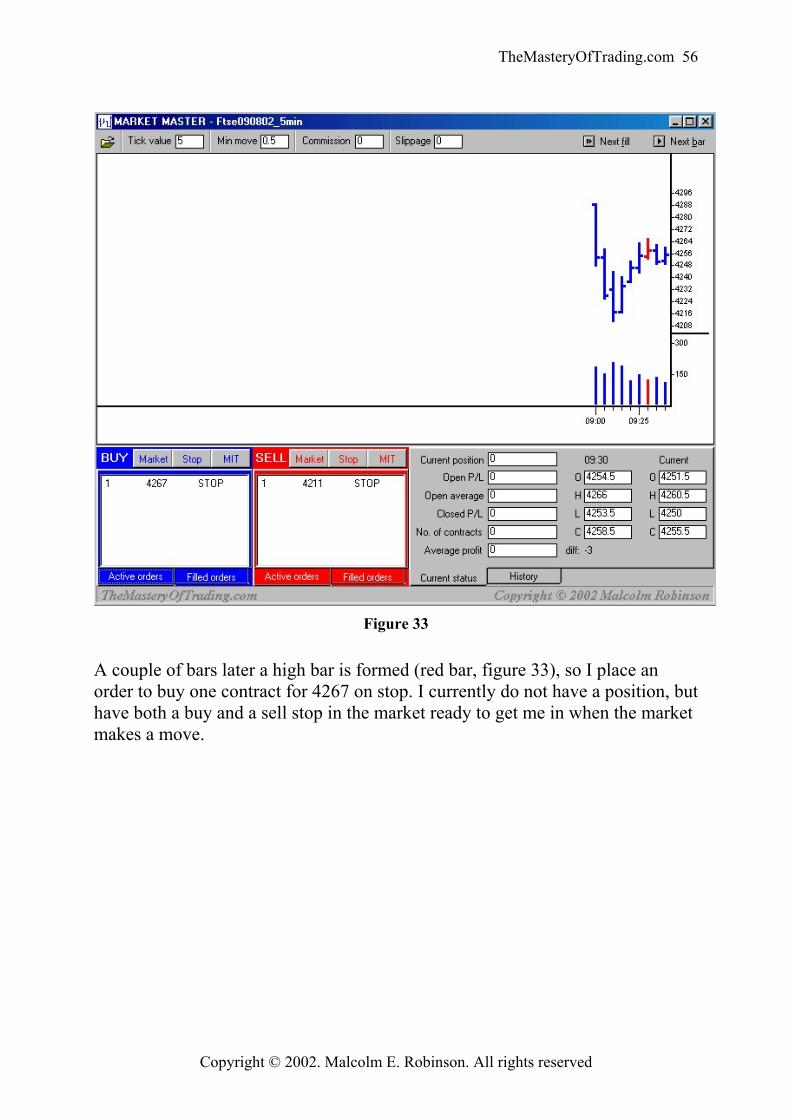
A couple of bars later a high bar is formed (red bar, figure 33), so I place an order to buy one contract for 4267 on stop. I currently do not have a position, but have both a buy and a sell stop in the market ready to get me in when the market makes a move.
Copyright © 2002. Malcolm E. Robinson. All rights reserved
TheMasteryOfTrading.com 57
Figure 34
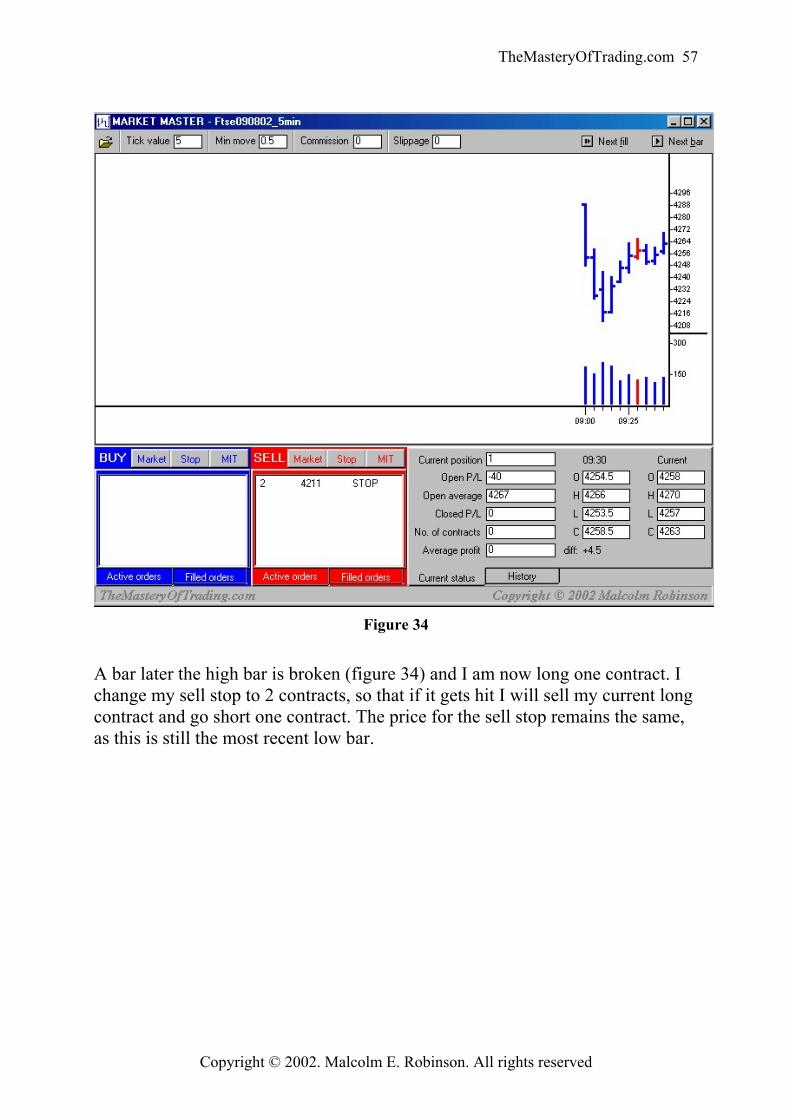
A bar later the high bar is broken (figure 34) and I am now long one contract. I change my sell stop to 2 contracts, so that if it gets hit I will sell my current long contract and go short one contract. The price for the sell stop remains the same, as this is still the most recent low bar.
Copyright © 2002. Malcolm E. Robinson. All rights reserved

TheMasteryOfTrading.com 58
Figure 35
Now a new higher low bar has formed (red bar, figure 35) so I raise my sell stop to 4229, one tick below the low bar of 4230.
Copyright © 2002. Malcolm E. Robinson. All rights reserved

TheMasteryOfTrading.com 59
Figure 36
My sell stop has been hit and I am now short one contract. I place a buy stop for two contracts at 4271, one tick above the most recent high bar of 4270 (red bar figure 36).
Copyright © 2002. Malcolm E. Robinson. All rights reserved

TheMasteryOfTrading.com 60
Figure 37
A new, lower high bar has formed at 4235.5 (red bar, figure 37) so I have lowered my buy stop to 4236. I will stop here, but if you had traded this strategy on this day you would have made a total profit of 138 points (£1380) for 3 trades. See video for all the day’s trades.
Copyright © 2002. Malcolm E. Robinson. All rights reserved

TheMasteryOfTrading.com 61
Here are a few ideas of how you could use this technique to profitable effect in your trading. As a confirmation set-up If we look again at this chart for the FTSE on July 3rd, 2002 (figure 38):
Figure 38
We can see that the low bar has formed, which is a possible short entry signal, but what makes this a much better set-up is the last bar (in red, figure 38). This is a bearish bar on high volume, which suggests that sellers are in control. Also note that this is the second time, since the mornings’ high, that the market has
Copyright © 2002. Malcolm E. Robinson. All rights reserved

TheMasteryOfTrading.com 62
tried and failed to make a new high. So at this point the market is looking very weak and we have a low bar to get us into the trade should the market break lower (figure 39); the market subsequently falls to a low 4444.5, a drop of over 100 points.
Figure 39
Copyright © 2002. Malcolm E. Robinson. All rights reserved
TheMasteryOfTrading.com 63
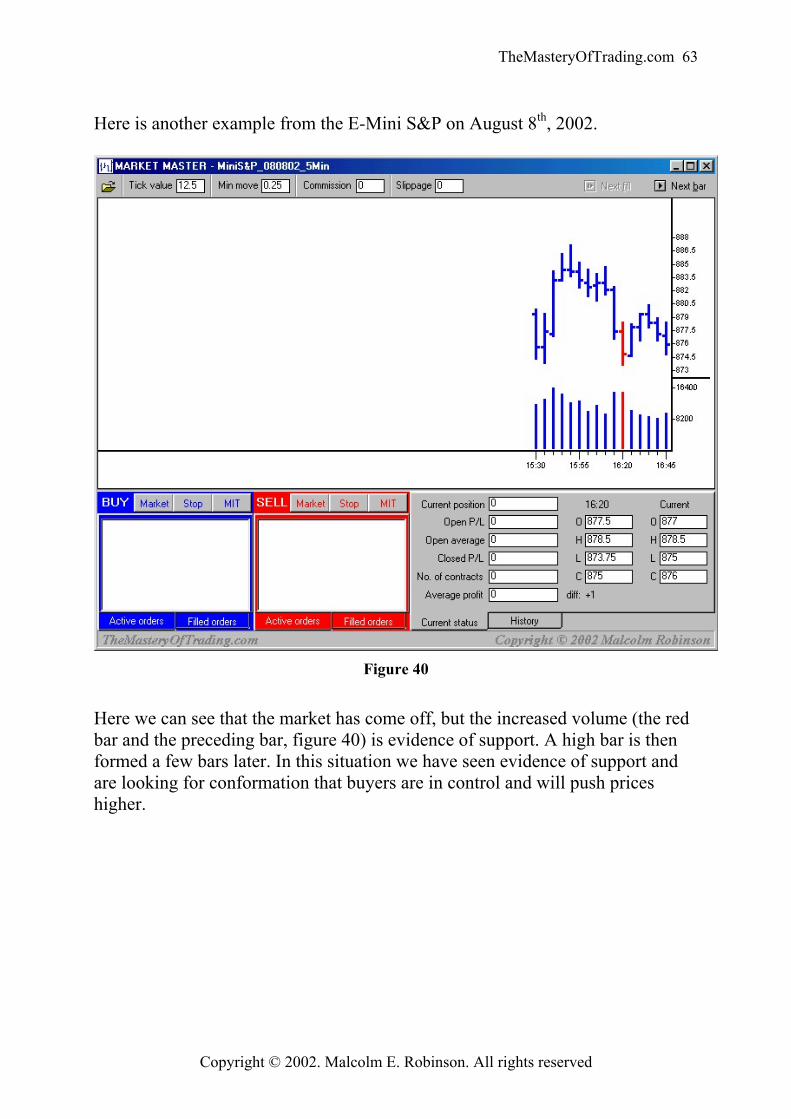
Here is another example from the E-Mini S&P on August 8th, 2002.
Figure 40
Here we can see that the market has come off, but the increased volume (the red bar and the preceding bar, figure 40) is evidence of support. A high bar is then formed a few bars later. In this situation we have seen evidence of support and are looking for conformation that buyers are in control and will push prices higher.
Copyright © 2002. Malcolm E. Robinson. All rights reserved
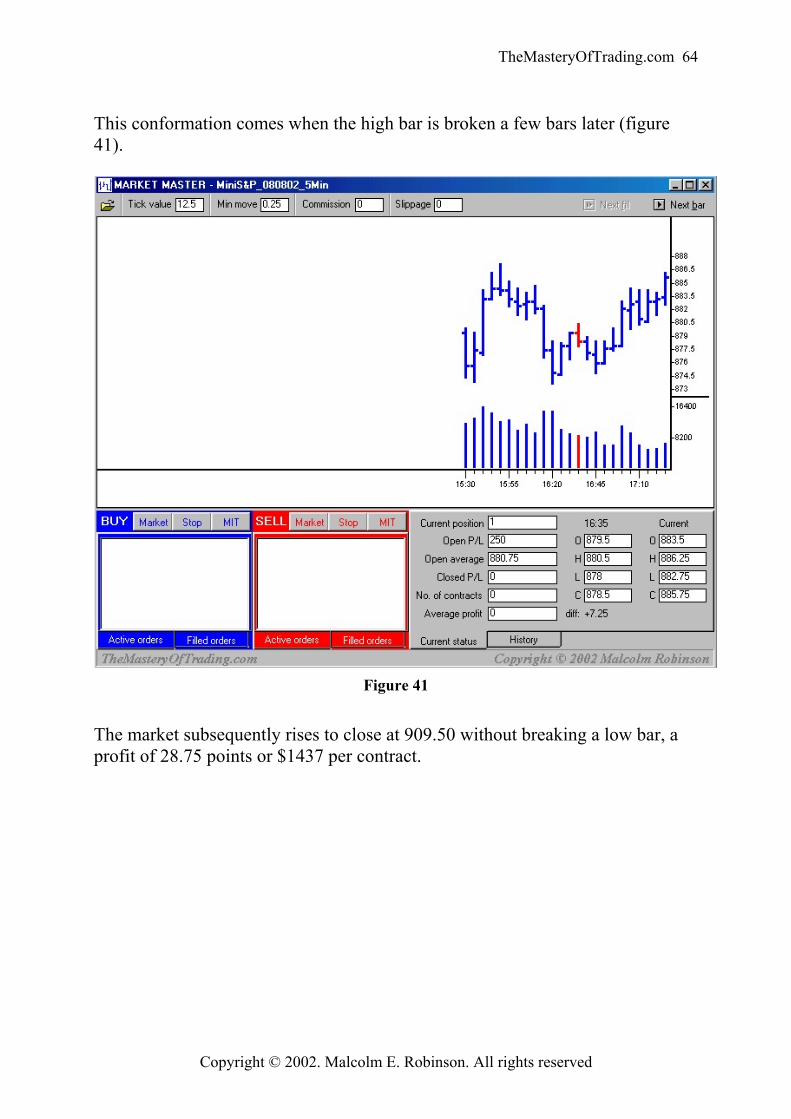
TheMasteryOfTrading.com 64
This conformation comes when the high bar is broken a few bars later (figure 41).
Figure 41
The market subsequently rises to close at 909.50 without breaking a low bar, a profit of 28.75 points or $1437 per contract.
Copyright © 2002. Malcolm E. Robinson. All rights reserved
TheMasteryOfTrading.com 65
As an exit You could simply use this technique as an exit mechanism. This will ensure that you stay in a profitable trade while the trend is in your favour. This is an effective way of implementing a trailing stop, where the market action, rather than a fixed number of points, determines the stop. In the FTSE example above (figure 38), exiting the trade, short at 4554, on the breakout of the most recent high bar stays in the market all the way down and exits at 4465 for a profit of 89 points, or £880 per contract. As a trading filter You could use this technique to determine the broader trend of the market. For example, using a 60-minute chart, determine the trend and then during the day only take trades from a 5-minute chart in line with the 60-minute trend. Or use a 5-minute chart to determine the trend and trade from a 1-minute chart only in the direction of the 30-minute trend. When you use an indicator as a filter of your trades the indicator must give you an edge. In other words, it must make a profit if you were to trade it alone. It does not have to make a big profit, it does not need to be so good that you would want to trade it on its own, but it must make some sort of profit for it to give you an edge. So if you use, say, a 30 period moving average to help you read the market, to find out whether it is of value (gives you an edge) test it over a period of a month to see if it makes a profit on its own.
Copyright © 2002. Malcolm E. Robinson. All rights reserved

TheMasteryOfTrading.com 66
Example: Below is a table showing the results of trading the High/Low strategy on a 5-minute chart of the E-Mini S&P for the week beginning 5th August 2002.
S&P 5 Min High/Low 5th-9th August 2002
5-Min 5-Min filtered by
60-Min
Points Trades Points Trades 05/08/2002 9.75 3 14.75 2 06/08/2002 16.75 4 0.5 1 07/08/2002 24.25 2 0 0 08/08/2002 7.0 4 9.0 2 09/08/2002 16.25 3 20.5 2
Total $3,700 16 $2238 7 Average $231
$320 The results are for trading one contract and do not take into account slippage and commissions. As you can see it was a good week. The results in the right hand columns above come from only taking the trades that are in line with the High/Low strategy on the 60-minute chart. It makes less money overall, but the average profit per trade is greater. Also there were 5 losing trades trading just the 5-minute strategy (68% profitable), but with the filtered approach there were no losing trades (100% profitable)! This was a good week, but what happens on a not so good week?
Copyright © 2002. Malcolm E. Robinson. All rights reserved
TheMasteryOfTrading.com 67
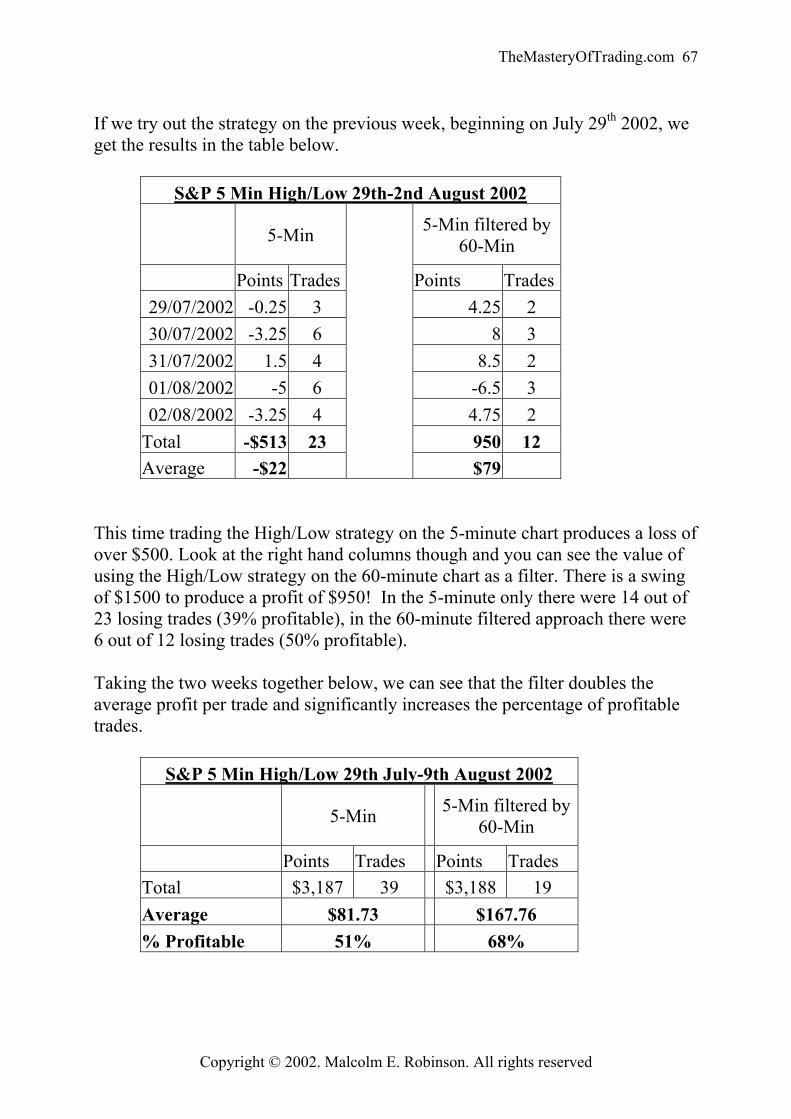
If we try out the strategy on the previous week, beginning on July 29th 2002, we get the results in the table below.
S&P 5 Min High/Low 29th-2nd August 2002
5-Min 5-Min filtered by
60-Min
Points Trades Points Trades29/07/2002 -0.25 3 4.25 2 30/07/2002 -3.25 6 8 3 31/07/2002 1.5 4 8.5 2 01/08/2002 -5 6 -6.5 3 02/08/2002 -3.25 4 4.75 2
Total -$513 23 950 12 Average -$22
$79 This time trading the High/Low strategy on the 5-minute chart produces a loss of over $500. Look at the right hand columns though and you can see the value of using the High/Low strategy on the 60-minute chart as a filter. There is a swing of $1500 to produce a profit of $950! In the 5-minute only there were 14 out of 23 losing trades (39% profitable), in the 60-minute filtered approach there were 6 out of 12 losing trades (50% profitable). Taking the two weeks together below, we can see that the filter doubles the average profit per trade and significantly increases the percentage of profitable trades.
S&P 5 Min High/Low 29th July-9th August 2002
5-Min 5-Min filtered by
60-Min
Points Trades Points Trades Total $3,187 39 $3,188 19 Average $81.73 $167.76 % Profitable 51% 68%
Copyright © 2002. Malcolm E. Robinson. All rights reserved

TheMasteryOfTrading.com 68
The 60-Minute Chart I favour the 60-minute chart as a trend filter for intraday trading; it is broad enough to keep you from excessive whipsaw, while being short enough to allow for a change in trend within a day. In testing the High/Low strategy during July 2002, it has produced impressive results, whether this performance will continue, only time will tell. I am not that concerned to extensively back test trading ideas and strategies, I use these ideas as a guide to, and support of, my trading decisions and I appreciate that these ideas go in and out of success. I think it is important to adjust our approach to trading according to the prevailing conditions; when the market is trading in a narrow range a more sensitive filter is required; when volatile, a broader filter is required. Below are the results of trading High/Low strategy on 60-minute charts for the FTSE and the E-Mini S&P500.
FTSE 60-min chart Price Profit
01-Jul-02 Sell 1 4622
04-Jul-02 Buy 2 4469 15309-Jul-02 Sell 2 4565 9617-Jul-02 Buy 2 4077 48819-Jul-02 Sell 2 4170 9324-Jul-02 Buy 2 3758 41225-Jul-02 Sell 2 3855 9725-Jul-02 Buy 2 3930 -7530-Jul-02 Sell 2 4138 20831-Jul-02 Buy 2 4274 -13631-Jul-02 Sell 1 4173 -101
TOTAL: 20 1235 £12,350
Average profit per trade £1235
Copyright © 2002. Malcolm E. Robinson. All rights reserved

TheMasteryOfTrading.com 69
E-Mini S&P 60-min chart
Price Profit 01-Jul-02 Open 1 996
02-Jul-02 Sell 2 964 -32.503-Jul-02 Buy 2 955 8.7508-Jul-02 Sell 2 974 19.2517-Jul-02 Buy 2 921 53.517-Jul-02 Sell 2 897 -23.7524-Jul-02 Buy 2 815 81.7531-Jul-02 Close 1 908 92.75
TOTAL: 14 199.75 $9,988
Average profit per trade $1,427 A very profitable month, but the High/Low strategy on 60-minute bars does not have to maintain this level of profitability for it to be a valuable filter.
Copyright © 2002. Malcolm E. Robinson. All rights reserved

TheMasteryOfTrading.com 70
Chapter 10: Reading the Current Price
As a floor trader I learned to read the current price. I did not have access to charts when I was in the pit, so I learned to interpret the price action. At first it seems pretty chaotic and confusing, yet if you spend time watching the price, without reference to a chart, you will start to make observations that will help you to start anticipating the ebb and flow of the market. Our ability to read the current price develops through experience, experience of observing and questioning the price action. We need to bring an enquiring and open mind to observing the market, faithful that there are distinctions that we can make that will lead us to profitable trading opportunities. I remember once watching one of the biggest FTSE locals pick his spot to buy. He stood in the market confidently bidding for a 100 lots. He maintained his bid for a few minutes, buying a few hundred contracts; then I watched as the market started to move away from his bid, slowly rising. It seemed amazing to me that he could so confidently and so accurately pick this bottom (this low was the lowest low for some time and wasn’t just a momentary response to his buying). At times these successful traders seemed like magicians, but as my market awareness increased I started to appreciate that these traders were exhibiting their trading skills; skills that had been forged over many years of experience. It is easy to assume when watching anyone execute a particular skill effortlessly, that they have an innate ability that cannot be replicated. The truth is though, whether we are talking about golf, tennis, chess or trading, that the skilled practitioners of these arts have dedicated their lives to mastering these skills. Of course we all have different natural ability, which will determine our full potential, but whatever the limits of our ability, we have to be willing to dedicate and commit ourselves to the development of these skills. What sort of questions can we ask as we observe the market that will enhance our understanding of what is happening. Below is a list that is by no means exhaustive, but is a starting point. When I am trading my main focus is on the current bid, the current offer and the last trade price and volume. Consider these questions when observing the market: What does an improved bid imply? What does an improved offer imply? What does a big bid imply? What does it imply if this big bid is sold in one hit?
Copyright © 2002. Malcolm E. Robinson. All rights reserved

TheMasteryOfTrading.com 71
What does it imply if this big bid is sold gradually? What does a big offer imply? What does it imply if this big offer is bought in one hit? What does it imply if this big offer is bought gradually? What does it suggest if the market has been falling and the spread starts to widen? What does it suggest if the market has been rising and the spread starts to widen? What does it suggest if the spread starts to narrow? What does it imply if most of the trading is at the offer price? What does it suggest if most of the trading is at the bid price? What does an increase in trading volume imply? What does a decrease in trading volume imply? What does an increase/decrease in volume after a rise/fall in the market imply? There is not necessarily a right or wrong answer to these questions, what is important for your trading is that you start to create a means of interpreting the price action, based on your own observations. If you misinterpret a particular behaviour you will soon know, as the market will prove you wrong. This is one of the wonderful aspects of trading; you get perfect feedback. Here are some possible interpretations: What does an improved bid imply? This is usually a bullish indication: the buyer is keen to buy and does not want to join the current bid and wait in line; an improved bid implies that the current offer is more than one tick above the current bid (the spread is greater than one tick) which is not aggressive selling. What does an improved offer imply? Inverse of above. What does a big bid imply? This is usually a bullish indication, but it is more useful to observe how the market responds to this bid. What does it imply if this big bid is sold in one hit? This suggests that there are sellers waiting on the sidelines, a sign of weakness What does it imply if this big bid is sold gradually? Suggest some tentativeness by sellers, if they manage to sell the entire bid the market will often dip briefly and then rise suddenly because the sellers have exhausted their ammunition selling the large bid.
Copyright © 2002. Malcolm E. Robinson. All rights reserved

TheMasteryOfTrading.com 72
What does a big offer imply? As above, I have also noticed that when big offers appear that are just trying to intimidate the market (you know this when they appear briefly and disappear before being hit) it is usually a sign of strength. Perhaps if sellers are resorting to bully tactics their position is weak. What does it imply if this big offer is bought in one hit? Clearly a sign of strength. What does it imply if this big offer is bought gradually? As above for big bids (inverse). What does it suggest if the market has been falling and the spread starts to widen? A widening spread suggests that the market is slowing down. The sellers are clearly less aggressive and often the spread will widen at turning points. It is like an over stretched elastic band that has to snap back. What does it suggest if the market has been going up and the spread starts to widen? Again it suggest that the buyers are less aggressive, the higher the market goes on a move the less attractive it becomes to buyers, so the less aggressive they become and the more attractive the price becomes for sellers. What does it suggest if the spread starts to narrow? A narrow spread suggests a balance point, where buyers and sellers are as keen and aggressive as each other, so wait to see who wins this struggle. What does it imply if most of the trading is at the offer price? Aggressive buying. What does it suggest if most of the trading is at the bid price? Aggressive selling.
Copyright © 2002. Malcolm E. Robinson. All rights reserved

TheMasteryOfTrading.com 73
Reading the Depth of Market First let me explain the DOM, to those of you who are not totally familiar with it. If you look at the picture (figure 42) of a DOM window, you will see it is divided into bid data on the left in blue and offers on the right in red. For each bid price there is the bid quantity and similarly for each offer price there is an offer quantity. The current best bid and offer are at the top of their respective lists. So the best bid is 5231 for 3 lots and the best offer is 1 lot at 5232 (in the trading pit when a trader bids the market he says the price then the quantity and when he offers the market he says the quantity then the price). As you move down the lists, the bids and offers represent the next best bid and offer. This particular example shows the DOM 10 levels deep.
Figure 42
One of the first points to make about the DOM is that it represents limit orders that are in the market already. It does not show stop orders and it does not show the intention of traders who have not placed their orders in the market. In the example we can see that there is an order to buy 14 lots at 5230, but this order could be cancelled before the market gets to 5230, so it is not a certainty. Assuming this order does hold and the market moves down to be 5230 bid, it could be that a trader is waiting for the market to be 5230 bid to enter a market order to sell 50 lots. If we knew that we would have a different view of this 14-lot bid. When we see the 14-lot bid in the DOM we assume that it will offer some support, but if we had all the information we might view it differently. The
Copyright © 2002. Malcolm E. Robinson. All rights reserved

TheMasteryOfTrading.com 74
main point is that the information available in the DOM is only part of the picture and it is not certain. Because of these factors I do not use the DOM as a means of gauging the strength and weakness of the market. It is not simply a matter of adding up all the contracts that are bid and comparing it to the number of contract for offer. It is useful, however for deciding where to place an order. If you were long at say 5232 and you were looking for a place to put a protective stop, hiding it behind a big order is a good idea. So putting your sell stop at 5229.5 is better than at 4230. To trigger your stop at 5229.5 the 14 contracts at 5230 will have to be sold first. Similarly if you were short from 5232, you might want to put your protective buy stop at 5237.5, as there is a bulk of orders between 5235 and 5237 to work through before your stop can be triggered. If you were looking to open a position, placing a bid to go long one tick in front of a big order is a good idea because you will be filled before the big order instead of after it. If I wanted to go long at the current prices in this example I would place a limit order to buy at 5231 and if I wanted to sell I would place a limit order to sell at 5232.5. With these orders I would feel confident that I would get filled.
Copyright © 2002. Malcolm E. Robinson. All rights reserved
TheMasteryOfTrading.com 75
Chapter 11: Executing Trades Our ability to execute trades efficiently is dependent on our state of mind. We want to maintain an:
• Open • Focused • Objective • Positive • And flexible mind
Such a mind is open to opportunity and quick to accept and respond to losses. We want to avoid:
• Fear • Anxiety • Self-doubt • Anger • Blame • Self-criticism • Apathy • Greed • Complacency • Etc…
When we find ourselves in any of the above states we are led to destructive trading behaviours:
• Over trading • Procrastination • Freezing • Holding onto losing trades • Adding to losing trades • Taking profits prematurely
One of the challenges of trading is the fact that we have a strong desire to succeed; we want to make lots of money, it is very important to us. The problem is that the more we want something, the more value we attach to the outcome; the more anxious we are to achieve it. It is the anxiety that is the greatest
Copyright © 2002. Malcolm E. Robinson. All rights reserved

TheMasteryOfTrading.com 76
obstacle to our success. The feelings listed above that we want to avoid could all be attributable to our strength of desire to succeed. As soon as we want something, we start to fear that we won’t get it; we start to doubt our ability to achieve the outcome. This fear, doubt or anxiety may lead to feeling angry, to blaming (of ourselves or others), to apathy (we can just switch off when too much is at stake) etc. Whatever emotional states we flow through in response to the initial anxious response, it is this initial response that we need to deal with. There is so much at stake in trading. It is not just the money that we are risking today; it is our self-concept that is on the line. To succeed at trading effects many things, not just our finances, but also our life style and our self esteem. When we take on the desire to be a successful trader we are taking on the whole concept of what it means to make our living in such a way. So it is natural that under the weight of such a challenge we will experience doubt and anxiety. We need to find a way of managing these feelings, which if left unchecked lead us to take the very actions that we are desperate to avoid. Focus the mind. The interesting question to ask is how do anxious/fearful emotional states manifest and maintain themselves? Imagine an anxiety-provoking situation and consider what you do to be anxious and to maintain your anxiety. If you can identify what you do to create any emotional state you create the possibility of being able to control your state. If on considering an anxiety provoking state, you notice that you create some vivid mental pictures that reinforce your fear, you can start to play with these images and alter them and change your state. The main two points to make about anxiety is that:
• It is fed by our internal dialogue and our mental imagery • It requires all our attention: it is attention hungry.
In other words anxiety is a mental activity, we have to work at it. In order to avoid being anxious we need to occupy our mind with something else; our conscious mind cannot do two things at once. The simple idea of counting sheep to help fall asleep is using this idea, giving the mind a simple activity to occupy itself and distract it from worrying thoughts about not being able to sleep. What can we occupy ourselves with when trading, something that will also support our trading objectives? Observing the market, we distract ourselves from our anxious thoughts by getting absorbed in observing the market. Next time
Copyright © 2002. Malcolm E. Robinson. All rights reserved

TheMasteryOfTrading.com 77
you are trading and you notice that your anxiety is rising, consciously bring your focus back to the market. If you find that difficult it may help to call out loud or in your head a running commentary of the market. This is something that I do all the time and I can choose to bring this commentary to the forefront of my mind if I find my attention wandering. Also add a bit of drama by varying your pitch to reflect the events unfolding in front of you. Imagine that your commentary is being broadcast around the world. “50 bid at 1, 50 for 5, 25 at 1, 1s trade 5 lots, it’s 10 at 1, 50 for 12, 1s trade out, at 2, 25 at 2, 1 bid, 1 for 10, 25 at 2, 2 trades, 2 bid, 3 bid, at 5 etc…”
Copyright © 2002. Malcolm E. Robinson. All rights reserved

TheMasteryOfTrading.com 78
Chapter 12: Money Management As a day trader the issue of money management is a simple one. We need to come to a figure that we are willing to risk losing each day. This figure needs to satisfy two key requirements:
• It needs to be small enough to not cause us distress to lose &. • It needs to be large enough to offer us a reasonable opportunity to profit.
Small enough We all have a threshold of comfort when it comes to risking money trading and it is important to find out what your level is. This level is influenced by such factors as your personal wealth, your trading skill and your financial history. You may feel comfortable risking £200 or £2000; it is not important what the figure is, but that it is the right figure for you. As a floor trader I found that my threshold was £1000 a day. This meant that if I lost less than £1000 it was OK, not that I liked losing £1000, but it didn’t devastate me. If on the other hand I lost more than £1000 a day, it did affect me, I would start to trade more aggressively trying to make it back. So if I made sure that I kept my losing days to less than £1000 I was fine, I could come back the next day and trade unaffected by the loss. If, though, I did not contain the loss and it went over the £1000 mark, I was in very dangerous territory as I would find it progressively harder to accept the loss and would trade accordingly. As time has passed I have found that my tolerance for loss has decreased rather than expanded. Perhaps as my skill level has increased my level of control has also increased. Large enough When considering your threshold of tolerance for loss, it is important to also consider the approximate minimum that is realistic for a specific market. For example with FTSE futures I would say the minimum is £200, which is 20 points trading a 1 lot. If your comfort level is below £200 then a less volatile market would make a better fit. So your level needs to be large enough for the market you choose to trade.
Copyright © 2002. Malcolm E. Robinson. All rights reserved
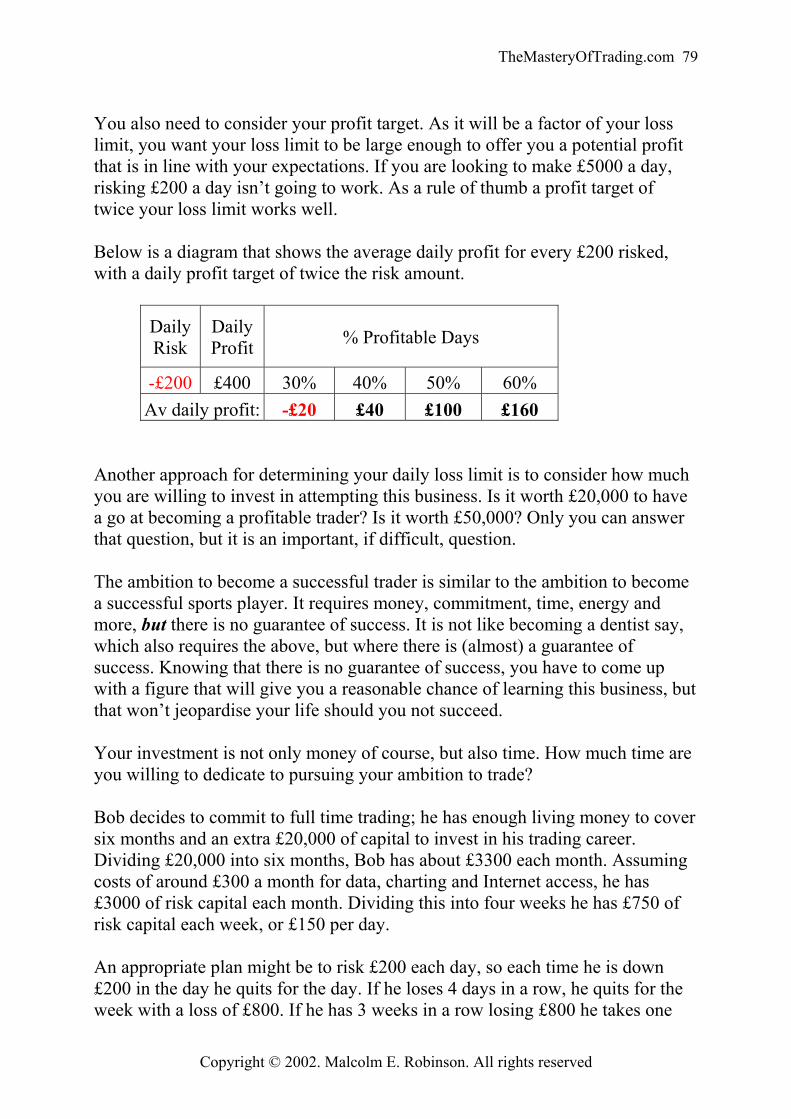
TheMasteryOfTrading.com 79
You also need to consider your profit target. As it will be a factor of your loss limit, you want your loss limit to be large enough to offer you a potential profit that is in line with your expectations. If you are looking to make £5000 a day, risking £200 a day isn’t going to work. As a rule of thumb a profit target of twice your loss limit works well. Below is a diagram that shows the average daily profit for every £200 risked, with a daily profit target of twice the risk amount.
Daily Risk
Daily Profit % Profitable Days
-£200 £400 30% 40% 50% 60% Av daily profit: -£20 £40 £100 £160
Another approach for determining your daily loss limit is to consider how much you are willing to invest in attempting this business. Is it worth £20,000 to have a go at becoming a profitable trader? Is it worth £50,000? Only you can answer that question, but it is an important, if difficult, question. The ambition to become a successful trader is similar to the ambition to become a successful sports player. It requires money, commitment, time, energy and more, but there is no guarantee of success. It is not like becoming a dentist say, which also requires the above, but where there is (almost) a guarantee of success. Knowing that there is no guarantee of success, you have to come up with a figure that will give you a reasonable chance of learning this business, but that won’t jeopardise your life should you not succeed. Your investment is not only money of course, but also time. How much time are you willing to dedicate to pursuing your ambition to trade? Bob decides to commit to full time trading; he has enough living money to cover six months and an extra £20,000 of capital to invest in his trading career. Dividing £20,000 into six months, Bob has about £3300 each month. Assuming costs of around £300 a month for data, charting and Internet access, he has £3000 of risk capital each month. Dividing this into four weeks he has £750 of risk capital each week, or £150 per day. An appropriate plan might be to risk £200 each day, so each time he is down £200 in the day he quits for the day. If he loses 4 days in a row, he quits for the week with a loss of £800. If he has 3 weeks in a row losing £800 he takes one
Copyright © 2002. Malcolm E. Robinson. All rights reserved
TheMasteryOfTrading.com 80
week off. So the worst result for any 4-week period will be a loss of £2400. As there are six 4-week periods in six months, the worst result Bob can achieve is a loss of £14,400. This way Bob is assured of being able to trade for the full six months, giving himself the opportunity to develop the necessary skills. Of course it is very unlikely that anyone will have such consistent losing experiences; in fact to lose so consistently would be quite an achievement. A novice trader, trading within their loss limits is more likely to have the experience of breaking even, but will see their capital eroded by the impact of trading commissions.
Copyright © 2002. Malcolm E. Robinson. All rights reserved

TheMasteryOfTrading.com 81
Appendix 1: Market Master User Guide Load Market Master Click or double click on MMaster.exe (in whichever folder you choose to save it) to start the program This will open Market Master for you and the window below will appear.
Figure 43
Copyright © 2002. Malcolm E. Robinson. All rights reserved

TheMasteryOfTrading.com 82
Market variables Along the top of the screen you will see 4 variables: Tick Value, Min Move, Commission and Slippage. Tick value: this refers to the monetary value of each tick, which is the minimum movement that can happen in the market. Min Move: this is the minimum movement that can happen in a particular market. The tick value and the min move values are specific to a particular futures contract, and need to be set when you load a data file. So if you load a FTSE futures data file, the tick value will be 5 (£5) and the min move 0.5 points. Once you have advanced to the first bar of the chart these variables will become locked (unchangeable), so you need to ensure that the right values are entered when you first load a new data file, but before you advance to the first bar. Commission: this is the price you pay to buy and sell one futures contract through your broker. It could be anything from £2 to £50 and is up to you to set, the value can only be entered before the first bar of a data file appears on the screen, from that point on it is fixed, until you load the next data file. Slippage represents the average difference of the price you want to trade at and the actual price that is available in the market when your trade is executed. For example, if you place an order to buy one FTSE futures contract and the information that you have is that the market is offered at 5830, you may expect to be filled at 5830, but by the time your order reaches the market the offer may have moved to 5832 and you would be filled at 5832, which is 2 points worse than your desired price. It is this difference that is referred to as slippage. In Market Master you can set a slippage value that represents the likely average slippage across all your trades. Appropriate slippage values will vary from one market to the next according to the type of market and the volume of trading. Again, the value can only be entered before the first bar of a data file appears on the screen, from that point on it is fixed, until you load the next data file.
Copyright © 2002. Malcolm E. Robinson. All rights reserved
TheMasteryOfTrading.com 83
Entering Orders On the bottom left of the screen you will see the blue and red buy and sell windows. Along the top of each one are the order buttons: Market, Stop and MIT, these buttons are used to enter orders. Along the bottom you will see two tabs, Active orders and Filled orders. Click on the tabs to move between the active and filled order windows. Market: when you click on this button you are prompted to enter the number of contracts you wish to buy or sell, then click on OK to enter the order. In the real market a market order is filled at the best available price when the order is entered into the market. In the simulator we have broken the day into bars and all orders can be entered just before the next bar. So in the simulator Market orders are always filled at the opening price of the next bar. Stop: when you click on this button you are prompted to enter the number of contracts and the price at which you want the order to be activated. Click on OK to enter the order. A stop order becomes a market order when the specified price trades. A buy stop is placed above the current price and a sell stop is placed below the current price. So if the current price is 5645 I could place a buy stop at 5655 and it will be triggered if and when the market trades at 5655 and/or a sell stop at 5633, which will be triggered if and when the market trades at 5633. Market if touched (MIT): when you click on this button you are prompted to enter the number of contracts and the price at which you want the order to be activated. Click on OK to enter the order. The MIT is similar to the stop order except in reverse, i.e. a buy MIT is placed below the current price and a sell MIT is placed above the current price. You will notice that there is no button for Limit orders. In the real market a limit order will not necessarily be filled even if the market trades at the limit order price, but in the simulator it always will be filled if the market trades at the limit order price. Imagine that the market is currently trading at 5680 and you place a limit order to buy 5665 (or better). The market then falls to 5665, and it trades just 2 contracts at 5665 and then moves higher. In the real market you would probably not have been filled as only two contracts traded, but the simulator will assume that you have been filled. An MIT order is similar to a limit order, except that when the specified price trades your order becomes a market order, so you will definitely be filled at the best available price when the order is triggered. So I have omitted the Limit order, as the simulator is unable to accurately reflect the outcome of limit orders. In practice, though, an MIT has the same effect as a limit order.
Copyright © 2002. Malcolm E. Robinson. All rights reserved

TheMasteryOfTrading.com 84
All orders are placed in the active order window until they are executed (filled) at which time they are moved to the filled order window. Any order in the active order window can be cancelled by right clicking on the order and selecting cancel, followed by OK. Current status On the bottom right of the screen you will see the current status and history window. Again click on the current status and history tabs to toggle between the two windows. On the right hand side of the current status window you will see values for the current bars OHLC. The OHLC to the left show the details of any bar that you have highlighted by selecting with your mouse pointer. The difference refers to the difference of the close of the highlighted bar and the current bar. Description of values in current status window:
• Current position: number of contracts long or short. i.e. if you are net long 6 contracts the value will be 6; if you are net short 3 contracts the value will be –3.
• Open P/L: this is the monetary value of your current position. • Open average: this is the average price of your current position; i.e. if you
are long 2 and you bought one at 5862 and one at 5912, you average purchase price is
(5862 + 5912)/2 = 5887 • Closed P/L: this is the profit or loss that you have banked and includes the
commission costs. • No of contracts: this is the total number of contracts that you have bought
and sold and does not include your open position. • Average profit: this is the closed P/L / no of contracts, it is the average
profit for your closed position. Example: lets us say that I have bought a total of 20 contracts and sold a total of 15. I now have an open position of 5 contracts (I am long 5) and a closed out position of 15 contracts.
Copyright © 2002. Malcolm E. Robinson. All rights reserved

TheMasteryOfTrading.com 85
History This window shows an equity chart for the day. Equity always starts at 0 and the chart is updated each time the closed P/L is adjusted. On the right are the equity OHLC values, with the draw down (DD). The draw down value is the biggest fall in equity from peak to trough. If you do only two trades in the day and the first trade nets you £1000, and the second trade losses you £400, you will end the day with a £600 profit and your DD will be £400. Keeping your DD low in relation to your final profit is an indication of successful and controlled trading. Loading Data In the top left hand corner of the screen you will see an open file icon, click on this and navigate to you data files. Double click your chosen file and it will be loaded. At this point the screen will go blank. You can now (before the market has opened) place orders. When you click the Next bar button in the top left hand corner (you can also press ‘Alt’ + b) the chart will advance to the first (or next) bar. Any orders that are triggered during that bar are filled and you current status window is updated accordingly. You can continue to place orders in advance of each subsequent bar and they will be filled as and when the conditions of the order are met. The Next fill button, next to the Next bar button, can be used to move the chart forward to the next trade. It is only active when there is an order in the active order window. When you reach the last bar of the day any open position will automatically be closed at the close price of the last bar. A prompt will appear asking if you would like to save a report of your day’s trading. Give the file a name and save it in an appropriate folder.
Copyright © 2002. Malcolm E. Robinson. All rights reserved

TheMasteryOfTrading.com 86
Creating Market Master Data Files It is easy to create data files for Market Master. You can use Market Master to practice trading and get familiar with any market, be it Futures, Shares, Currencies or Cash Indices. You just need to ensure that the data is stored as a comma delineated text file with a .CSV extension. There are two ways of getting data for market master:
• You can use your own data and convert it into the appropriate format for market master.
• You can import data from IRD RealTick directly into Excel with the DDE
Link Upgrade. This cost an extra EUR35 and allows you to do many weird and wonderful thinks with your data. Contact [email protected] for more information.
Tip: Source for historical tick data: http://www.tickdata.com. If you want to convert your existing data, or data from another source, follow the following instructions. Below is the first few lines of a Market Master data file for the E-Mini Nasdaq on August 8th, 2002: Symbol:,/NQP2,,,,, Date,Time,Volume,Open,High,Low,Close 09/08/02,3:30 PM,3693,935,936,931.5,933 09/08/02,3:35 PM,3564,933.5,933.5,928.5,932.5 09/08/02,3:40 PM,3490,932.5,933.5,928.5,929.5 09/08/02,3:45 PM,3900,930,934,929,931 09/08/02,3:50 PM,3016,930.5,933,928.5,930.5 09/08/02,3:55 PM,4003,930.5,931,925,927 09/08/02,4:00 PM,2300,927.5,929.5,926.5,926.5 09/08/02,4:05 PM,3401,926.5,935,926.5,932 09/08/02,4:10 PM,2449,932.5,934.5,931.5,931.5 Market Master ignores the first two lines, so it does not matter what is there, it is from line three down that is important. These lines must be in the order of:
Date,Time,Volume,Open,High,Low,Close
Copyright © 2002. Malcolm E. Robinson. All rights reserved

TheMasteryOfTrading.com
Copyright © 2002. Malcolm E. Robinson. All rights reserved
87
With the commas separating each bit of data. You also need to make sure that the format for the time is the same as in the example above i.e. h:mm AM/PM. Market Master does not use the date, so the format is not important. The easiest way of manipulating the data that you start with into the right format for Market Master is to use Excel. You can load your data file into Excel, separate the data into columns using the Data/Text to Columns command (if not done automatically), and then order the columns and the format to match Market Master. Then simply save the file as a CSV file, using the File/Save As command. Once you have created your first few files it will be a cinch!