
Pre-Algebra 4-1 Samples and Surveys Week of Nov 4 Tues Thur.
Upload
sharyl-briana-farmerCategory
view
213download
1
ASTR_4170Special Topics: Photometry
& Filter Systems
Day-3

Announcements•Next week: Dark Night Observing on Tues. 9/8 & Thur. 9/10
•Plan to re-start the “Astro-group” meetings.• When is good for everyone?• Right now I’m looking at 2:30-3:30pm on Fridays, but can
move it if needed.
History of Photometry• The First Stellar Magnitudes• Visual Magnitude Estimates• Visual Photometric Measurements• Early Photographic Photometry• Early Photoelectric Photometry• Photometry at Longer Wavelengths• Photographic Photometry from 1922• Photometry & Birth of Astrophysics• PEP with a Photomultiplier• Large Area Detectors• The Measurement of Starlight; J.B. Hearnshaw; 1996; Cambridge
Early Photographic PhotometryThe first daguerreotype was of the moon (Louis Daguerre;
1739-1851), announced 1839; a bright spot.Polished silver on a copper plate, evaporated iodine on it to
create a layer of silver iodide. Exposure to light would reduce it back to the metallic element. Exposure to mercury vapor formed an amalgam on the bright parts of the image. Sodium thiosulphate would remove the rest of the AgI and leave a positive, permanent image.
Arago saw the potential for astronomy.Draper recorded a successful exposure of the moon (23 March
1840) – 20 minute exposure.Became the second to record a spectrum of the Sun.

Early Photographic PhotometryEarly experiments looked at exposure time versus
intensity - found good dynamic range – factor of 10.Discovered the reciprocity failure at 60 to 1.Fizeau & Foucault had first paper on spectrum of Sun,
and a second on solar limb darkening (2 April 1845). This image also showed two sunspot groups.
By 1863, Roscoe had made quantitative measurements of limb darkening. These were to play a significant role in solar atmospheric structure studies from 1920 onward.
Early Photographic PhotometryWlm. Bond (director of Harvard Obs.) invited Whipple
and Black to try stellar imaging using the 15-inch refractor in 1847. Though unsuccessful, they did improve on lunar images.
17 July 1850, Whipple succeeded with image of Vega, but Polaris gave no impression (too faint).
By 1857, an upgrade to the telescope drive system allowed another attempt, this time with wet collodion plates which offered a factor of 10 to 100 times in sensitivity.Proposed in 1851 by Le Grey in France.Dip in SiN3 to sensitize just before exposure.Exposed while still wet.

Early Photographic PhotometryUsing this technique, Bond, Whipple, and Black imaged Mizar
(both components) and Alcor. Reported in Bond, 1857, AN, 47, 1
Struve began work in astrometryBond and Mitchell began photographic photometry. Bond’s
death in 1865 ended the first effort of photographic photometry.
Gould returned to Argentina in 1870 with these new techniques and continued astrometric work there.
With his assistant, Rutherfurd, able to get to 9th magnitude stars in 8 minute exposures.
Early Photographic PhotometryThe first dry SiBr-gelatin emulsions were introduced in
1871. Immediately put to use by Gould and others.March 1881, Draper was doing extended object work
with M-42. Reaching stars to 14.7 on Pogson’s scale.Pickering began experimenting at Harvard 1881.Argelander began using plates and would note 2 stars per
plate that he derived magnitudes for, thus providing “standards” to derive all magnitudes from.

Early Photographic PhotometryEdward Pickering, Harvard, 1882 started an active
program of photography. His younger brother Wlm. began producing dry plates at his lab at MIT.
1885 E.P. had acquired an 8-in. f/5.6 system and could take 8X10 plates covering 10° x 12° with good images in the center 5° x 5°. Began to develop a series of trailed standard stars for comparison of other stars.
Williamina Fleming (1857-1911) published photometry for 1009 stars within 1° of NCP in 1890 brighter than m=15; 1131 bright equatorial stars.
Early Photographic PhotometryCape Photographic Durchmusterung (CPD) was
undertaken in 1882. Despite issues with uncertainties of photographic magnitudes. 6-inch f/9 lens.
6° x 6° plates of 613 areas between -18° and the SCP.3000 plates and 6.5 years, completed in 1891. No funds for
reduction of data.Kapteyn (U. of Groningen) provided funds and people to do
the reductions (astrometry and photometry). Probably the first major collaborative program with institutions in different countries. 454,875 stars (32.66 per sq. deg.) between -18° and SCP.

Early Photographic PhotometryTelescopes got bigger, plate technology advanced. More
experiments in deriving mag. from spot diameters and use of wedge photometers.
Trépied concluded that stars nearer the MW were bluer than those farther from plane – raised magnitude estimation concerns.
Kapteyn proposed a technique in 1891 to place a mesh over the plates which would produce a 1 magnitude difference between two exposures. … nothing became of it at this time.
Early Photographic PhotometryVogel (1834-1898) discovered by chance (Berlin, 1873) a
method to make plates sensitive to G, Y, O light plus UV – using dyes which made the plates sensitive to different parts of the spectrum.
By 1880, Abney in London, was producing solar grating spectra down to 1 micron!
By turn of century, some companies were supplying orthochromatic plates. Yerkes 1904 stared to use these on the 24-inch refractor.
Images with red-plates showed differences from photo-visual plates, especially for the very red carbon star U Cyg.

Sensitivity for Cramer Isochromatic plates relative to an untreated plate.

Early Photographic PhotometryLots of experiments with new plates and in-vs-out-focus
for calibration.Seares and Mt. Wilson (1912) developed a set of polar
standards using isochromatic plates with yellow filters (photo-visual) – became the 339 star calibration sequence down to mpv = 17.5 using in-focus images.. This work set the standard for calibration for the next three decades.
Early Photographic PhotometryKarl Schwarzschild (1873-1916) was instrumental in driving
this technique as a quantitative science. Did work on plate dynamics, emulsions, intensity of stars vs image, reciprocity failure onset vs optimum exposure.
Applied to h and c Per, the Pleiades and Praesepe, plus variable stars. Found the Cepheid h Aql to have a photographic amplitude of 1.29 magnitudes, twice the visual amplitude, he interpreted this to be a temperature change in the outer layers of the star, not an eclipse. 3 decades later, Baade produced pulsating star hypothesis.
More out-of-focus experiments.

Relation between color index and spectral type from purely photographic measures. Parkhurst & Jordan, 1908
G
K
MS
pect
ral
Typ
es
M0.0
M1.0
M2.0
Color-Intensities
Early Photographic PhotometryNorth Polar Sequence: a dominant concept in stellar
photographic photometry for the first half of the 20th century, began at Harvard ~1907.
Basic philosophy was to establish a sequence of carefully calibrated stars near the pole which could be used as relative calibrators for other nearby stars without having to resort to absolute techniques.
Secondary standards would be established in 48 “Harvard Standard Regions” spaced at intervals of 30° from +75° to -75° and labelled A to F … followed form the visual photometry effort years earlier.
Henrietta Leavitt (1868-1921) assigned the NPS.
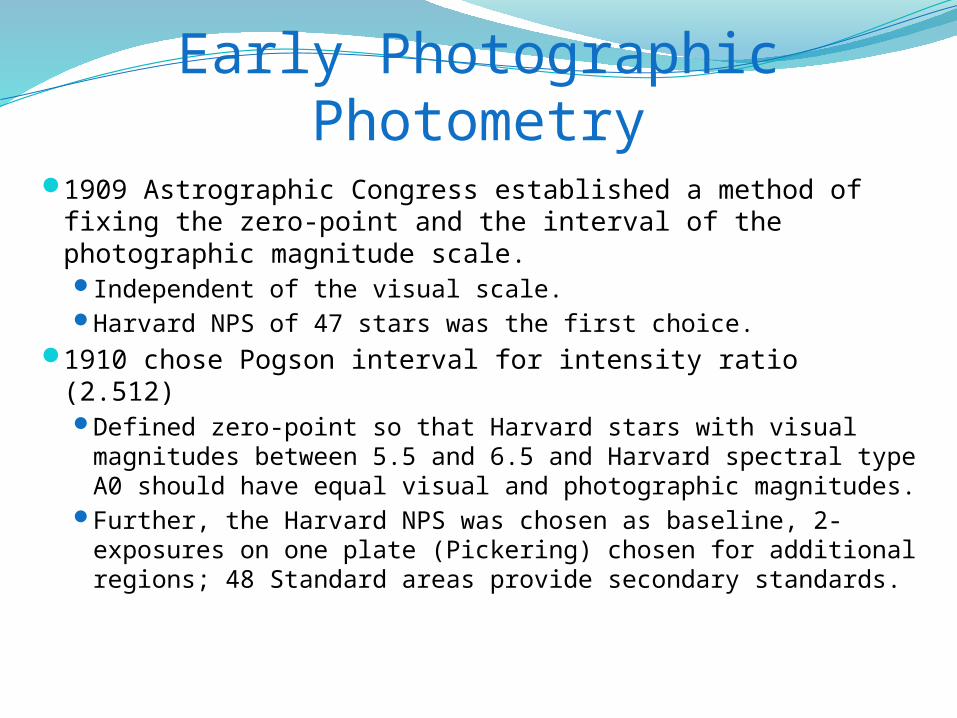
Early Photographic Photometry1909 Astrographic Congress established a method of fixing the
zero-point and the interval of the photographic magnitude scale. Independent of the visual scale. Harvard NPS of 47 stars was the first choice.
1910 chose Pogson interval for intensity ratio (2.512)Defined zero-point so that Harvard stars with visual magnitudes
between 5.5 and 6.5 and Harvard spectral type A0 should have equal visual and photographic magnitudes.
Further, the Harvard NPS was chosen as baseline, 2-exposures on one plate (Pickering) chosen for additional regions; 48 Standard areas provide secondary standards.

Early Photographic PhotometryWork on the color of stars continued by Charlier (Lund Obs.)
and Scheiner (Postdam); they were unaware of the significance. Relation of F = -2.5 log A; A = ratio of pg/vis.
Schwarzschild understood at once the astrophysical meaning of this ratio.
Color indices were investigated with color-sensitive plates and spectra. Concept off effective wavelength came to be.
Davidson & Martin (Greenwich, 30-inch) began a program to study the relationship between spectral type and leff.

History of Photometry• The First Stellar Magnitudes• Visual Magnitude Estimates• Visual Photometric Measurements• Early Photographic Photometry• Early Photoelectric Photometry• Photometry at Longer Wavelengths• Photographic Photometry from 1922• Photometry & Birth of Astrophysics• PEP with a Photomultiplier• Large Area Detectors• The Measurement of Starlight; J.B. Hearnshaw; 1996; Cambridge

Early Photoelectric Photometry1892 – 1945Start in 1892 in Ireland. George Minchin (1845-1914)
experimenting with Selenium photovoltaic cells. Found they produced an electromotive force when illuminated. Photocathode was Se deposited on an Al substrate, Platinum wire anode, mounted in an acetone (electrolyte) filled tube.
Light was admitted through a quartz window. The emf was detected with an electrometer.
Using Monck’s private observatory. Missed first detection of starlight as he had returned to England. Not very successful, but did get good readings from Jupiter, Venus, and the moon.

Early Photoelectric Photometry
By 1894, Minchin had improved the design of the cells. Now used oenanthol as the electrolyte. Several mV currents for Regulus, Sirius, Saturn, Arcturus, and h Boo, and others.
Found relative strengths were related to the visual magnitudes.
Minchin’s photovoltaic cell, 1894

Early Photoelectric Photometry
The big players: Joel Stebbins and Fay Cluff Brown, Univ. of Illinois.
1906 Se cells run to a Wheatstone bridge and galvanometer; working on the 12-inch refractor.
First with moon, then stars and planets.
Showed wide variation from cell to cell.
Pioneered cooling the tubes, recovery time from exposure.
Stebbins’ photoconductive photocell light curve for Algol, 1910


Early Photoelectric PhotometryThe first true photoelectric cell: H. Hertz in 1887 first observed the photoelectric effect.1889 Elster & Geitel at Wolfenbüttel developed it to the
point it could be used for photometry.After Stebbins’ visit to Berlin in 1912, switched to KH
cathodes for use at Illinois. Immediately saw 100+ fold increase in sensitivity (Dec. 1912). Rosenberg (the third group reported measurements as small as 10-13 amps; also produced a gimbaled mounting system for telescope.

Early Photoelectric PhotometryTwo-filter color work was undertaken in Berlin in early
1920s. A blue glass filter was added to the yellow one.Uncertainties in measurements began to drop and
sensitivities continued to improve.
Beta Cep photoelectric lightcurve. Guthnick & Prager, 1917
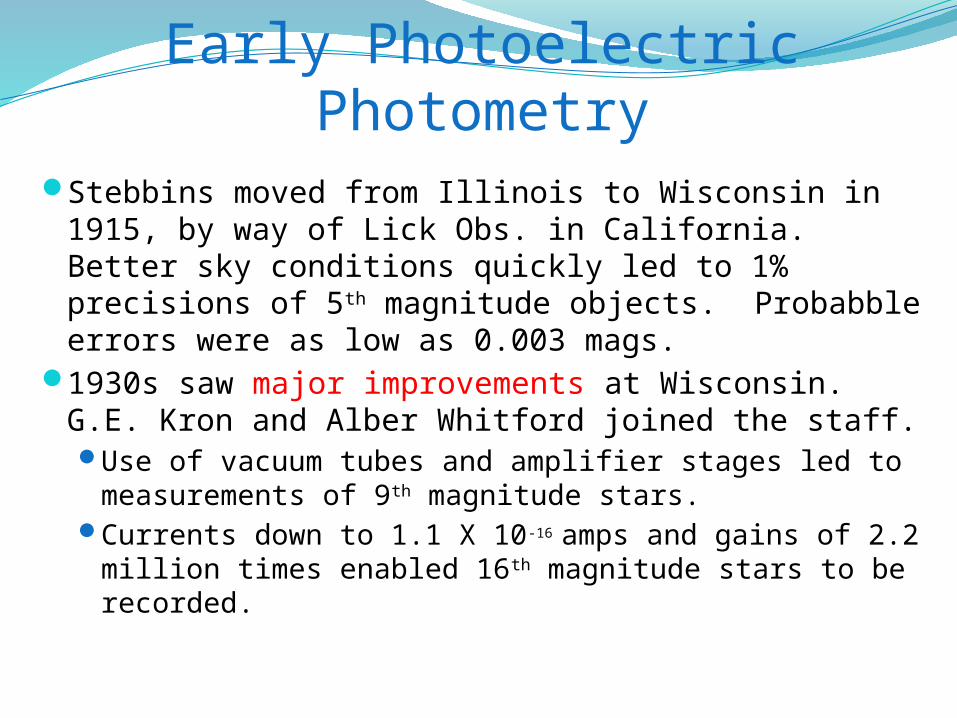
Early Photoelectric PhotometryStebbins moved from Illinois to Wisconsin in 1915, by way of
Lick Obs. in California. Better sky conditions quickly led to 1% precisions of 5th magnitude objects. Probabble errors were as low as 0.003 mags.
1930s saw major improvements at Wisconsin. G.E. Kron and Alber Whitford joined the staff.Use of vacuum tubes and amplifier stages led to
measurements of 9th magnitude stars.Currents down to 1.1 X 10⁻¹⁶ amps and gains of 2.2 million
times enabled 16th magnitude stars to be recorded.

Early Photoelectric PhotometryWork continued in development of photocathode materials,
including a red sensitive cathode (Cs-O-Ag) by John Hall (Yale).

Early Photoelectric PhotometryKron (now at Lick) designed a new cooled photometer to
use either a blue or red sensitive tube and confirmed limb darkening on stars other than the Sun.
The big innovation was Stebbins & Whitford introducing filters with designated passbands to be used with the same tube (UVBGRI – first system), and the first to use UV light.
New cell work continued up to PbS able to get 2.2m (1966 by Becklin & Neugebauer).

History of Photometry• The First Stellar Magnitudes• Visual Magnitude Estimates• Visual Photometric Measurements• Early Photographic Photometry• Early Photoelectric Photometry• Photometry at Longer Wavelengths• Photographic Photometry from 1922• Photometry & Birth of Astrophysics• PEP with a Photomultiplier• Large Area Detectors• The Measurement of Starlight; J.B. Hearnshaw; 1996; Cambridge

Photometry at Longer WavelengthsWlm. Herschel was the first to detect IR waves.Pouillet did a study of Solar pyrometry in 1838 and concluded
that the atmosphere absorbs a good fraction of the IR band.Edison first proposed doing an IR sky survey, but could not
fully develop his “tasimeter” to be effective. But, this led to platinum bolometers and thermocouples.
First real solar work was Lamansky in 1872 when he detected absorption dips at (0.85), 0.985, 1.23, and 1.48 m.
Mouton detected the weaker fourth dip.Huggins was first to detect IR from stars (1866-67) at Tulse
Hill Obs. using a thermocouple.

Photometry at Longer WavelengthsLangley (Allegheny Obs.) and later the Smithsonian Obs. was
the first really successful IR observer. Studied limb darkening and sunspot on Sun. Low sensitivity of the thermocouples and thermopiles led him to develop the bolometer – increased resistance in a Pl wire as temperature increases. Based on a design by Svanberg (Uppsala) three decades earlier. First unit could detect temperature changes of 10-4°C in the platinum wire.
Major importance showed IR spectrum is broken by telluric absorption bands.
1883 took expedition to top of Mt. Whitney to record Solar spectrum to “longest possible wavelengths”.

Photometry at Longer WavelengthsRadiometer was developed by Crookes in 1875.Thermocouple photometry in the early 1900s.Pettit & Nicholson - thermocouple photometry of atmosphere
in early 1920s. Continued work with 124 bright stars.

Photometry at Longer WavelengthsAfter WW II, big improvements in IR detectors.Oxley (NRL) reported tests of PbS photocells of German
manufacture (1946). British Admiralty was also experimenting with these. Soon became the favorites of astronomical research as they would reach out to 3.6m, 1000X better than thermocouples.
Harold Johnson (1921-1980) began using cooled PbS cells in 1959. However, he changed to InSb in 1961 and started cooling with LN2 (instead of dry ice). Defined four passband which fell in the transparent windows in the atmosphere. These are J (1.3m), K (2.2m), L (3.6m) and M (5.0m), all defined by interference filters.
Showed (V-K) correlated well with (B-V), but not linear (1963).And, (B-V) with (K-M) using the InSb detector to record Mira(1962),
a very red star with Teff around 2000K.

Photometry at Longer WavelengthsIR Sky Surveys in the 1960s.1st major undertaking: Neugebauer & Leighton at CalTech
from 1965-1968 to survey the sky at 2.2m (K) and 0.84m (I) from -30° to +81°. 20,000 sources detected. Most notable were cool late-type giant and super-giant stars.
Southern hemisphere was not surveyed as thoroughly.One surprise was R Mon, a very red star (Mendoza, 1966).
Frank Low & Bruce Smith extended this work to 20m and developed a viable model based on circumstellar dust shells re-radiating visible light in the IR. (T Tau stars).