DaVita’s Village Vitality - DFWBGH · DaVita’s Village Vitality Measuring Wellness Program...
23
DaVita’s Village Vitality Measuring Wellness Program Performance DFWBGH Wellness Forum / November 29, 2012
Transcript of DaVita’s Village Vitality - DFWBGH · DaVita’s Village Vitality Measuring Wellness Program...

DaVita’s Village Vitality Measuring Wellness Program Performance
DFWBGH Wellness Forum / November 29, 2012

Agenda
What are most employers measuring?What are most employers measuring?
About DaVita
Wellness at DaVita
Question: What does our CEO want to see?
Measuring Wellness & Using the Data
©2010 DaVita Inc. All rights reserved. Proprietary and confidential. For internal use only. 2

What are most employers measuring?g
Question…Are you asked by your senior leadership to provide measurable results in your wellness programs?
Question…
y p g
For Example...o a p e- Participation
- Satisfaction
- Improvement in biometric data
- Reduced utilization in certain areas
©2010 DaVita Inc. All rights reserved. Proprietary and confidential. For internal use only.
- Reduced medical claims trend
3

Typical types of measurement
ROI Did benefits or savings outweigh the investment?
Long-Term(18 to 60 months)
Medical costsH lth t d
Outcome Did we alter health or business outcomes? Intermediate
Health care trendOrganizational culture
ROI
Impact Did we change levels of risk or behaviors?
(12 to 24 months)Risk, Risk MigrationAbsence, Disability
Workers’ CompTurnover
Sh t TAttitude
p
Did we change attitudes, readiness or opinions?
g TurnoverPerformance, Productivity
Preliminary ROI
Short-Term
(0 to 12 months)AwarenessUtilization
SatisfactionProcess Did we get high levels of participation?
Did we change attitudes, readiness or opinions?
©2010 DaVita Inc. All rights reserved. Proprietary and confidential. For internal use only.
SatisfactionKnowledge, Readiness,
AttitudesBaseline analysis
Process g g p pAre vendors performing?
4

New thinking around measurement
Old Thinking: measuring in silos and how many different tools can be introducedtools can be introduced
New Thinking: understanding health care that emphasizes wholes rather than parts and stresses the role ofwholes rather than parts, and stresses the role of interconnections; using a designated process and approach to create the optimal health measurement plan and metrics
Does it really matter where savings and health y gimprovement comes from; as long as health
improves and savings occur?!
©2010 DaVita Inc. All rights reserved. Proprietary and confidential. For internal use only.
p g
5

About DaVita
DaVita Inc., a Fortune 500® company,DaVita Inc., a Fortune 500® company,Leading provider of kidney care; delivering dialysis services to patients
with chronic kidney failure and end stage renal disease.
44,000 Teammates
2,000 outpatient dialysis centers and145,000 patients in U.S.
15 outpatient dialysis centers and 400 patients in 3 countries
©2010 DaVita Inc. All rights reserved. Proprietary and confidential. For internal use only. 6

At DaVita we call it “Village Vitality”
©2010 DaVita Inc. All rights reserved. Proprietary and confidential. For internal use only. 7

Village Vitality tools and resources
National Online Campaigns – focus is on physical activity, nutrition and other modifiable behaviors
Vitality Points – earn points and lower health insurance premiums –includes biometric screenings, HRA completion and taking action.includes biometric screenings, HRA completion and taking action.
Cigna Wellness Team – Dedicated Wellness Team, Lifestyle Management Programs Health Assessment etcManagement Programs, Health Assessment, etc.
We Are Well Award – Awards one year FREE health insurance i t t t f b i l d lpremiums to teammates for being role models.
Wellness Champions – local advocates for Village Vitality.
©2010 DaVita Inc. All rights reserved. Proprietary and confidential. For internal use only.
Wellness Champions local advocates for Village Vitality.
8

Village Vitality is part of our culture
©2010 DaVita Inc. All rights reserved. Proprietary and confidential. For internal use only. 9

The Question
Question:What does our CEO Want to See…?Question:
Answer:It just depends, so be prepared for anything!
Being prepared means “Knowing DaVita’s Numbers”
©2010 DaVita Inc. All rights reserved. Proprietary and confidential. For internal use only. 10

Be Prepared
Steps to “Knowing DaVita’s Numbers”Steps to Knowing DaVita s Numbers
Step 1: Step 2: Step 3:
Identify data sources & key analytic drill-
Identify and populate key
Document methodologyanalytic drill
downsmetrics
methodology
©2010 DaVita Inc. All rights reserved. Proprietary and confidential. For internal use only. 11
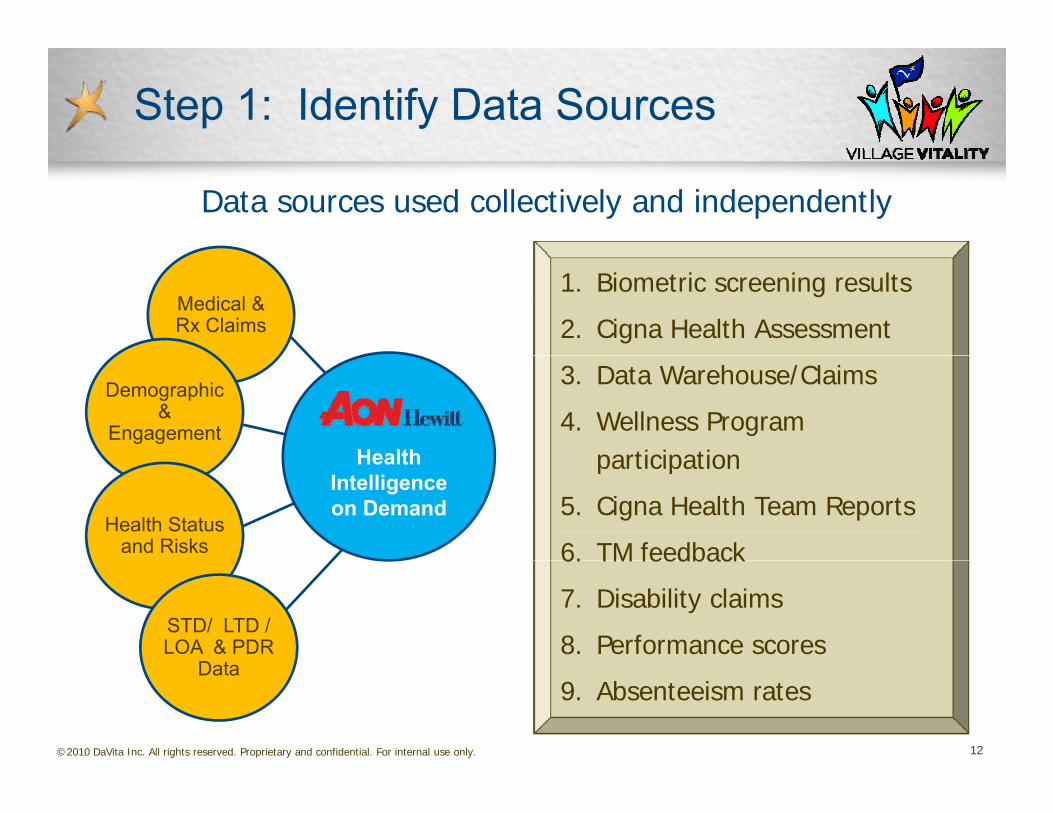
Step 1: Identify Data Sources
Data sources used collectively and independently
1. Biometric screening results
2. Cigna Health AssessmentMedical & Rx Claims
3. Data Warehouse/Claims
4. Wellness Program participationHealth
Demographic&
Engagementparticipation
5. Cigna Health Team Reports
6. TM feedback
Health Intelligence on Demand
Health Status and Risks 6. TM feedback
7. Disability claims
8. Performance scoresSTD/ LTD / LOA & PDR
D t
©2010 DaVita Inc. All rights reserved. Proprietary and confidential. For internal use only.
9. Absenteeism ratesData
12

Step 1: Identify Key Analytics
More Aggressive and Action-able Measurement & Monitoring
Health Intelligence
Health Risk Living Well
Segmentation Carrier / Plan bi ti
Continuously Enrolled
gon Demand
StatusSegmentation
Profiles combinations
Pre-High Cost Cl i t & Hi h
Enrolled Indicator
Absence Annual Performance
Health ImprovementClaimant & High
Cost indicatorsCategories
Site-specific Di i i ll Top Location
Performance Review Rating
Improvement Program
R i l ll
©2010 DaVita Inc. All rights reserved. Proprietary and confidential. For internal use only.
wellness participation
Division roll-ups Top Location roll-ups
Regional roll-ups
13

Step 2: Identify & Populate Key Metrics
Key Metrics Key Metrics
1. Clinical
2. Financial
3. Health Engagement
4. Lifestyle Behaviors
5. Wellness Culture
Key Metrics are supported by Key Indicators
©2010 DaVita Inc. All rights reserved. Proprietary and confidential. For internal use only. 14

Clinical Key Indicators
Clinical Key IndicatorsClinical Key IndicatorsM i l i h l h f h l h h k ib i diM i l i h l h f h l h h k ib i di
Metric 2010-DVA Baseline 2011 Result ~TM Movement
Moving people into healthy ranges for health measurements that are key contributors to more serious disease states. Moving people into healthy ranges for health measurements that are key contributors to more serious disease states.
TMs with Bp of <= 120/80 33% ~172
TMs with Bp of <= 140/90 76% ~523
36%
80%p /
TMs w/ elevated TC/HDL RatioF <4.4 / M <5.0
M: 35% ~70
F 20% 6417%
31%
F: 20% ~64
TMs w/BMI >=30 or waist F <=35” / M <=40” 38.6% ~13
17%
38.8%
©2010 DaVita Inc. All rights reserved. Proprietary and confidential. For internal use only.
TMs w/BMI <=25 29% 029%15

Step 3: Document Methodology
Clinical Indicators: MethodologyClinical Indicators: MethodologyClinical Indicators: MethodologyClinical Indicators: Methodology
Metric Data Sources Measurement Methods Frequency Data 2010 Data 2011The proportion of teammates who have a blood pressure of ≤140/90
OHD Biometric Screening Data or Annual Report
Data from DaVita biometric screening report will identify percentage of participants with normal blood pressure defined as systolic pressure <140mmHg and diastolic pressure
Annual 14,30618,728
76 4%
11,87314,868
79 9%<90mmHg.
The numerator is the number of participants with normal blood pressure and the denominator is the total benefit participants participating in the biometric screenings.
76.4% 79.9%
Example©2010 DaVita Inc. All rights reserved. Proprietary and confidential. For internal use only. 16
Example

Using the Data
• Incentive development• Incentive development• Plan design; renewal• Budget• Vendor evaluation
P liInternally
• Policy• Business integration and partnerships internally• Communication; targeted and impact to cost
y
• Recognition/awardsE t ll • Recognition/awards• Community involvementExternally
©2010 DaVita Inc. All rights reserved. Proprietary and confidential. For internal use only. 17
More DaVita Examples

Health Risks - Snapshot
Represents 22,000+ TMsTotal TM Population Snapshot
Self Reported Risks(Cigna HRA)
Grade 2010 vs.
2011 movement
2010 2011
Weight 48% 48%
Total TM Population Snapshot
e g t 48% 48%
Blood Pressure 25% 26%
Stress 16% 16%
Positive Movement Having positive impact on annual trend!
Physical Activity 13% 11%
Biometrics Risks – Out of Range
(Vitality Screenings)
W i ht 71% 71%
2010-2011 Screening results shows improvement in two key risk categories:
Weight 71% 71%
Blood Pressure 67% 64%
Blood Sugar 13% 19%
• Blood Pressure – 2,600 TMs• Cholesterol – 2,700 TMs
More in-depth analysis, including metrics, fin n i l imp t nd p e h oni g o p
©2010 DaVita Inc. All rights reserved. Proprietary and confidential. For internal use only.
Cholesterol/HDL Ratio 17% 14%financial impact and pre-chronic groups
during renewal mtg.
18

Where Did Our Risk Migrate?
Positive Risk Migration 6.9%Negative Risk Migration 8.3%
74.5% 75.0%
60%
80% *excludes new enrollees/claimants (may not total100%)
Period 1 (‘10) Period 2 (‘11) % change
11.8% 10.0%1.0%
10.8% 10.3%1.1%
0%
20%
40%
Period 1 ( 10) Period 2 ( 11) % changeLow Risk Moderate Risk High Risk Extreme High Risk
Prior Year Current Year
$372 PEPYAvg Age 35.8
$2,455 PEPYAvg Age 44.1
$13,403 PEPYAvg Age 49.2
$39,999 PEPYAvg Age 47.8
• While 82.1% of teammates’ risk level remained status quo• 6.9% saw a positive risk migration
©2010 DaVita Inc. All rights reserved. Proprietary and confidential. For internal use only.
6.9% saw a positive risk migration • 8.3% saw a negative risk migration

Able to show a positive change
Risk for High and Moderate Groups are moving in the right direction
$3,739 PEPY
$4,018 PEPY
$3,761 PEPY
$2,439 PEPY
$6,244 PEPY
$4,766 PEPY
$4,047 PEPY
$3,809 PEPY
$3,325 PEPY
81% 74%67% 65%
50%36%
80% 73% 66% 60%48%
35%40%
60%
80%
100%1.3% ↓ 1.1% ↓ 1.5% ↓ 0.1% ↑8.4% ↓0.8% ↓0.6% ↓ 4.4% ↓ 1.4% ↓
20%8%
1%11% 7% 1%
0%
20%
40%
Nutrition Weight Physical Activity
Blood Pressure
Cholesterol Stress Blood Sugar Tobacco Usage
Alcoholy g
Prior Year Current Year
2010 - 2011
©2010 DaVita Inc. All rights reserved. Proprietary and confidential. For internal use only.
2010 2011
20

Individual Health & Absenteeism
Correlation between absenteeism and risk factors
Meets (54%)
Above (43%)• 96% HRQ Participation • 51% at High Risk• 38% Obese
B l (3%)
• 95% HRQ Participation • 53% at High Risk• 43% Obese• 25% pre-diabetics
8% Hi h b
%• 23% pre-diabetics• 6% High absence• $2892 Med Paid/TM
Below (3%)• 91% HRQ Participation • 57% at High Risk• 47% Obese• 28% pre-diabetics
• 8% High absence• $3081 Med Paid/TM
©2010 DaVita Inc. All rights reserved. Proprietary and confidential. For internal use only.
• 28% pre diabetics• 11% High absence• $4182 Med Paid/TM
21

Putting It All Together
1. Be proactive in your data analysisSenior Leadership may ask for anything anytime!- Senior Leadership may ask for anything, anytime!
2. Adopt evidence-based decision making- Value-Based Plan Design: additional coverage for certainValue Based Plan Design: additional coverage for certain
preventive medicines- Design of wellness program incentives based on biggest
challengeschallenges- Addition of some pilot programs based on identification of pre-
chronics, chronics, and those with metabolic syndrome
3 R b t fi d d t3. Remember to refine and update
4. Avoid the silos – look for data correlations and ask “why”If data is available include it in our overall measurement
©2010 DaVita Inc. All rights reserved. Proprietary and confidential. For internal use only.
- If data is available, include it in our overall measurement
22

Questions ?Questions ?
©2010 DaVita Inc. All rights reserved. Proprietary and confidential. For internal use only. 23