Date Mexico Strategy - Fuller Treacy Money · Mexico Strategy Date 7 January 2014 ... Tenaris TS.N...
68
Deutsche Bank Markets Research Industry Mexico Strategy Date 7 January 2014 Global Emerging Markets Mexico Cement & Construction F.I.T.T. for investors Juanito and his bright mañana A better tomorrow starts today Juanito's epiphany arrives after years of average performance; it is time to stand out. He will get his act together in an attempt to attract entrepreneurs for several projects he has in mind. If successful, investors could have access to exclusive, long-lasting and profitable businesses. The word has spread and partners are starting to put money on the table. The catch: ventures will be highly dependent on Juanito's financial health, arbitrary rules and mood changes. Will Juanito's bright mañana become a reality this time? And more important, will you be part of it? Esteban Polidura, CFA Research Analyst (+52) 55 52018115 [email protected] Daniela Najar Research Associate (+52) 55 52018513 [email protected] ________________________________________________________________________________________________________________ Deutsche Bank Securities Inc. Deutsche Bank does and seeks to do business with companies covered in its research reports. Thus, investors should be aware that the firm may have a conflict of interest that could affect the objectivity of this report. Investors should consider this report as only a single factor in making their investment decision. DISCLOSURES AND ANALYST CERTIFICATIONS ARE LOCATED IN APPENDIX 1. MICA(P) 054/04/2013.
Transcript of Date Mexico Strategy - Fuller Treacy Money · Mexico Strategy Date 7 January 2014 ... Tenaris TS.N...

Deutsche Bank Markets Research
Industry
Mexico Strategy
Date 7 January 2014 Global Emerging Markets Mexico Cement & Construction
F.I.T.T. for investors
Juanito and his bright mañana
A better tomorrow starts today
Juanito's epiphany arrives after years of average performance; it is time to stand out. He will get his act together in an attempt to attract entrepreneurs for several projects he has in mind. If successful, investors could have access to exclusive, long-lasting and profitable businesses. The word has spread and partners are starting to put money on the table. The catch: ventures will be highly dependent on Juanito's financial health, arbitrary rules and mood changes. Will Juanito's bright mañana become a reality this time? And more important, will you be part of it?
Esteban Polidura, CFA
Research Analyst (+52) 55 52018115 [email protected]
Daniela Najar
Research Associate (+52) 55 52018513 [email protected]
________________________________________________________________________________________________________________
Deutsche Bank Securities Inc.
Deutsche Bank does and seeks to do business with companies covered in its research reports. Thus, investors should be aware that the firm may have a conflict of interest that could affect the objectivity of this report. Investors should consider this report as only a single factor in making their investment decision. DISCLOSURES AND ANALYST CERTIFICATIONS ARE LOCATED IN APPENDIX 1. MICA(P) 054/04/2013.

Deutsche Bank Markets Research
Global Emerging Markets Mexico Cement & Construction
Industry
Mexico Strategy
Date 7 January 2014
FITT Research
Juanito and his bright mañana
A better tomorrow starts today
________________________________________________________________________________________________________________
Deutsche Bank Securities Inc.
Deutsche Bank does and seeks to do business with companies covered in its research reports. Thus, investors should be aware that the firm may have a conflict of interest that could affect the objectivity of this report. Investors should consider this report as only a single factor in making their investment decision. DISCLOSURES AND ANALYST CERTIFICATIONS ARE LOCATED IN APPENDIX 1. MICA(P) 054/04/2013.
Esteban Polidura, CFA
Research Analyst (+52) 55 52018115 [email protected]
Daniela Najar
Research Associate (+52) 55 52018513 [email protected]
Table of contents
Energy Reform in a nutshell Page 10
Oil & Gas Page 17
Downstream Page 28
Electricity Page 33
Top investable ideas Page 37
Timing the exposure Page 54
Source: Deutsche Bank
Top ideas to play the Energy Reform
Company Ticker Segment Last priceBP BP.L Integrated oils 472.5Kinder Morgan KMI.N Natural gas/Power generation 34.7Schlumberger SLB.N Offshore/Deepwater 86.4Siemens SIE.GY Natural gas/Power generation 100.3Tenaris TS.N Equipment/Oil pipes 43.8Weatherford WFT.N Onshore/Brownfield 14.9
Company Ticker Segment Last priceAlfa ALFAA.MX Conglomerate 37.9Alpek ALPEKA.MX Petrochemicals 30.0Cemex CX.N Cement 11.4Grupo Mexico GMEXICOB.MX Conglomerate 42.9Ienova IENOVA.MX Natural gas/Power generation 55.1Mexichem MEXCHEM.MX Petrochemicals 56.9
Foreign listings
Local listings
Source: Deutsche Bank; Bloomberg PLC
Related recent research 2013
The House View Raj Hindocha
Dec/16
Global Asset Allocation in 2014 Binky Chadha
Dec/13
GEM Equity Strategy Outlook 2014 John-Paul Smith
Dec/11
Global Commodity Themes in 2014 Michael Lewis
Dec/10
Source: Deutsche Bank
Upcoming events 2014
Energy Reform Week Mexico City
Mar/25-28
Source: Deutsche Bank
Juanito's epiphany arrives after years of average performance; it is time to stand out. He will get his act together in an attempt to attract entrepreneurs for several projects he has in mind. If successful, investors could have access to exclusive, long-lasting and profitable businesses. The word has spread and partners are starting to put money on the table. The catch: ventures will be highly dependent on Juanito's financial health, arbitrary rules and moodchanges. Will Juanito's bright mañana become a reality this time? And more important, will you be part of it?
What, how and when to play the Energy Reform The recently approved Energy Reform in Mexico breaks perennial paradigms, thus clearing the way for healthier and faster growth for years to come. It allows private companies to participate as never before in three key areas: oil & gas, downstream and electricity. The main challenge for participants will be to balance the appeal of ample business possibilities with the inherent risks of long-term relationships with the government. Through the analogy of Juanito, a Mexican entrepreneur, we present investors our best ideas of what, how and when to play the Energy Reform. We thoroughly examine the new opportunities available to private companies, assess risk-reward for each of them and highlight listed global and local companies to play particular themes.
Focus on services now and on integrated models in the future Engineering services, equipment and pipes suppliers, and offshore/onshore drillers should be among the first to reap the benefits of the sector’s opening. Their dependence on congress enforcing operating rules is limited; thus, they are already starting to provide services to companies exposed to the sector. Deep-water crude oil exploration and extraction and complex downstream projects should be target businesses for global integrated oil companies. Returns for these should be evident in the long term.
Globally listed vehicles with potential long-term positive spillover It is still early to assess the impact on listed companies but we have made a first attempt to identify our preferred names to play Mexico’s Energy Reform. We have picked names across Deutsche Bank’s worldwide Buy-rated universe. Our list includes BP, Schlumberger, Weatherford, Tenaris, Kinder Morgan and Siemens. Key names among locally listed companies include Alfa, Mexichem, Alpek, Cemex, Grupo Mexico and Ienova.
Look out for better entry points to play this secular story Hefty expectations behind Mexico’s current rich valuation should soon undergo a reality check. In the short-term, consensus’ potentially lower estimates on the elimination of the fiscal consolidation regime could push the IPC to a 2014 P/E above 20x, 50% higher than 10-year average multiples and 100% over the MSCI EM index. Such large premium is difficult to prevail as the full impact of the Energy Reform is likely to materialize post 2015.
We use DCF valuations across the board Key downside risks include adverse economic conditions, inability to implement major structural reforms and failure of the government to meet public spending programs. Upside risks are faster economic reactivation, prompt approval of secondary laws and stronger recovery of asset profitability.

7 January 2014
Cement & Construction
Mexico Strategy
Page 2 Deutsche Bank Securities Inc.
Table Of Contents
The epiphany ....................................................................... 3 Changing paradigms as never before .................................................................. 3
Improving the finances ........................................................ 4 No money should be left on the table .................................................................. 4 Relevant aspects of Fiscal Reform ....................................................................... 5 Our stance on Mexico is positive, but not without challenges ............................ 5
Business plan ...................................................................... 8 Entering exclusive areas along with partners ...................................................... 8 Energy Reform in a nutshell ................................................................................. 9 Contracts ............................................................................................................ 12 Pemex’s first right of refusal .............................................................................. 14 Sector regulators ................................................................................................ 14 New Pemex Board .............................................................................................. 15 The Mexico Oil Fund ........................................................................................... 15
Oil & Gas ............................................................................ 16 Pushing for a leaner and more efficient model .................................................. 16 Pemex ................................................................................................................. 16 Mexico in clear need of higher crude oil production ......................................... 18 Sub-optimal investment capacity in deep waters .............................................. 20 Global oil supply and demand ............................................................................ 22 Natural gas ......................................................................................................... 24 Global trends behind natural gas prices............................................................. 26 Shale gas could emerge as the next hidden treasure ........................................ 27
Downstream ...................................................................... 29 Ample room to increase refining capacity ......................................................... 29 Global refining supply and demand ................................................................... 33
Electricity ........................................................................... 34 Boosting industrial growth through lower tariffs ............................................... 34 Competition should have positive spillover ....................................................... 36
Top investable ideas .......................................................... 37 Joining forces with the experts .......................................................................... 37 The foreign players ............................................................................................. 38 The domestic companies ................................................................................... 50
Timing the exposure .......................................................... 55 Several risks need to be assessed ...................................................................... 55 GEMS might remain out of favor ....................................................................... 56 Mexico’s market multiples seem high from several angles .............................. 57 Eliminating fiscal consolidation could drag valuations ...................................... 58 Further catalysts could take a while to materialize ............................................ 59
The day after mañana ........................................................ 60 Gain not without the pain ................................................................................... 60
Energy Reform Week ........................................................ 61 Join us to discover opportunities across Mexico ............................................... 61

7 January 2014
Cement & Construction
Mexico Strategy
Deutsche Bank Securities Inc. Page 3
The epiphany
Changing paradigms as never before
It is a rainy Friday night and Juanito is flying back home after several days working abroad. The proximity to foreign peers helped him realize that his career has been average, at best. He has not excelled in any particular field, nor has he failed dramatically in his past endeavors. His performance has been fair, and so have been his professional growth and compensation.
Comfortable job conditions and his lack of ambition have translated into Juanito allowing several opportunities to pass by. Leaving money on the table is starting to bother him; thus, he has decided to put an end to it.
Extra revenues will come in hand as Juanito is determined to pursue several business projects for which he feels strongly about. He realizes that embarking on this endeavor alone is impossible as he lacks experience, know how, and most of all, financial power. He must then attract investors, a tough decision, as sharing benefits with partners is not his ideal scenario.
Juanito is extremely excited about his renewed life plan and often transmits to friends and family his positive outlook. A rising career, materially higher income and ambitious spending plans are just some examples of thoughts he commonly shares. The word has started to spread and Juanito is already attracting the attention of a crowd willing to invest along with him.
As usual, there is no free lunch. Juanito will control to a certain degree his partners' profit potential. Furthermore, he will be able to set arbitrary rules anytime. Finally, the long-term relationship will expose investors to risks tied to Juanito’s mood changes, a condition that seems to spike every six years.
We believe it is worth noting that he launched similar initiatives in the past. His results were far away from optimal; thus, one would expect to see a certain degree of skepticism among those close to him. This is definitely not the case; Juanito’s focus seems as serious as ever and people cannot help sharing a positive gut feeling.
Will Juanito’s bright mañana become a reality this time?

7 January 2014
Cement & Construction
Mexico Strategy
Page 4 Deutsche Bank Securities Inc.
Improving the finances
No money should be left on the table
First things first. Juanito’s ability to embark in business projects and improve his quality of life is capped by his limited income. He acknowledges that he has adopted a comfortable position toward diversifying his revenue stream. As a result, he is extremely dependent on a single income source, a condition not shared by peers.
He has come up with a plan to quickly improve his finances. He will start by collecting more from his current income sources. That means asking for a pay raise at work and charging his uncle for the occasional investment advice. He will also adopt a less forgiving attitude with his roommate, who is now used to deduct all sorts of expenses from the agreed rental payment.
In addition, he has come up with a plan to have an edge in any future relationship with investors. For example, he plans to charge a commission on dividend payments, regardless of the nationality of shareholders. Furthermore, he will also collect a fee on capital gains.

7 January 2014
Cement & Construction
Mexico Strategy
Deutsche Bank Securities Inc. Page 5
Relevant aspects of Fiscal Reform
With revenues from the oil and gas industry representing 7-9% of Mexico’s GDP over the last five years, Pemex had turned into the most important source of government income (i.e., taxes and duties paid by Pemex account for about 34% of the federal government’s income).
In turn, Mexico’s Energy Reform had to come along a comprehensive fiscal plan to increase revenues and thus strengthen Mexico’s economy. This plan came as a Fiscal Reform approved last October with the support of the PRI and PRD.
Some of the main tax collection changes approved in the reform include: 1) 10% capital gain tax in the Mexican stock exchange and 10% tax on dividend paid by Mexican companies, 2) 7.5% income tax on mining, 3) increasing the tax rate of high-income earners to 35% from 30%, 4) special consumption taxes (i.e., 8% on high-calorie food and P$1 per liter on sugary beverages), and 5) elimination of the fiscal consolidation regime as well as limiting deductions and exemptions.
According to Deutsche Bank’s Mexico Economic unit, the Fiscal Reform should translate into an additional 0.9% growth to GDP in years to come.
Figure 1: Approved fiscal reform (as a % of GDP) Source Approved
Corporate taxes 0.5
Personal income taxes 0.3
VAT 0.1
Other taxes and royalties
0.7
Elimination of IETU -0.7
Total 0.9Source: Deutsche Bank .Ministry of Economy
Our stance on Mexico is positive, but not without challenges
Energy Reform should take some time to benefit macro figures Deutsche Bank’s Mexico economic unit forecasts GDP growth at 1.2% and 3.2% for 2013 and 2014, respectively. Likewise, analysts see inflation reaching 3.7% this year, while maintaining next year’s inflation projections at 3.9%. Additionally, Central Bank expects the Mexican currency to reach P$13.1 by the end of 2013 and P$12.7 by 2014.
Our team highlighted in recent reports that the tone of the Central Bank’s (Banxico) statements reflects a deterioration of the balance of risks for growth, despite forecasts not having been modified. In this regard, the minutes of the last monetary policy meeting highlighted downside risks for growth in 2014 such as lower-than-expected growth in the US, ineffective structural reforms, weak construction activity, and the possibility that higher interest rates in global markets which may cause a reversal of capital flows. Our team

7 January 2014
Cement & Construction
Mexico Strategy
Page 6 Deutsche Bank Securities Inc.
highlights an additional risk; the potential pressure that higher public sector borrowing requirements may exert on available resources for the private sector.
Deutsche Bank’s base-case scenario remains one where inflation mounts in 2014 and approaches the upper limit of the target. As a result, Banxico should hike rates preemptively by year-end 2014. This view has been reinforced by a deterioration of inflation expectations, as shown in recent surveys.
Our Mexico economic unit expects the Energy Reform to take some time to materialize in terms of gross fixed investment and growth, as secondary legislation still has to be processed in Congress and the new regulatory framework has to be set up. Nevertheless, some of the potential long-term effects of the reform are being priced in by the markets.
For example, the spread between the Pemex perpetual bond and the UMS bond due in 2110 (century bond), which averaged around 150bp in 2012, is now close to a historical low of below 40bp. In our view, this mainly reflects expectations that the reform will somewhat dissociate the government’s and Pemex’s finances by reducing the tax burden on the company. Pemex estimates that the tax cuts could reach up to US$10bn a year under the reform, a significant proportion of the US$70bn paid in taxes in 2012. This may also reflect that production prospects may be improving, particularly because of changes to Pemex’s corporate government and its possibilities to expand capital expenditure due to a diminished tax load.
Figure 2: Energy Reform impact on GDP
4.2% 4.4% 4.5%4.8%
5.0%5.2% 5.3% 5.3% 5.4% 5.5%
3.7% 3.9%3.6% 3.5% 3.5% 3.5% 3.5% 3.5%
0.0%
1.0%
2.0%
3.0%
4.0%
5.0%
6.0%
2014
2015
2016
2017
2018
2019
2020
2021
2022
2023
2024
2025
GD
P gr
owth
With reform Without reform
Source: Deutsche Bank. Economy Ministry
With the approval of the Energy Reform, Deutsche Bank’s economist unit estimates additional FDI to the oil sector at around US$20bn or 1.5% of GDP.
7 January 2014
Cement & Construction
Mexico Strategy
Deutsche Bank Securities Inc. Page 7
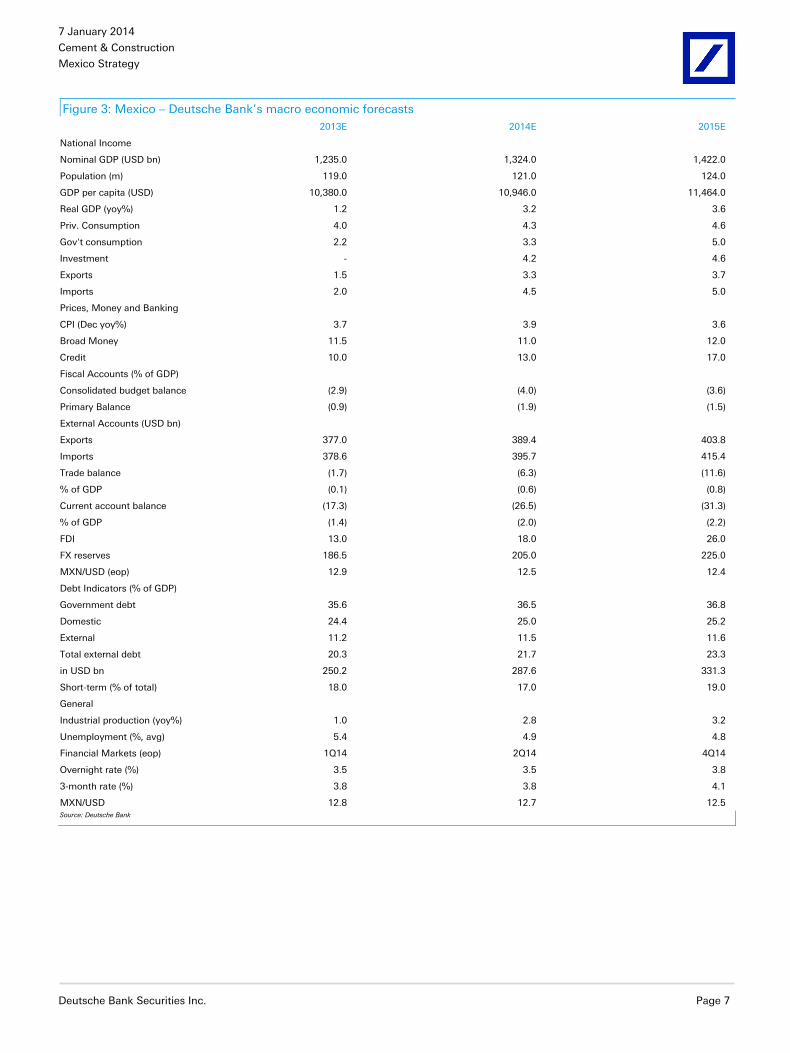
Figure 3: Mexico – Deutsche Bank’s macro economic forecasts 2013E 2014E 2015E
National Income Nominal GDP (USD bn) 1,235.0 1,324.0 1,422.0
Population (m) 119.0 121.0 124.0
GDP per capita (USD) 10,380.0 10,946.0 11,464.0
Real GDP (yoy%) 1.2 3.2 3.6
Priv. Consumption 4.0 4.3 4.6
Gov't consumption 2.2 3.3 5.0
Investment - 4.2 4.6
Exports 1.5 3.3 3.7
Imports 2.0 4.5 5.0
Prices, Money and Banking
CPI (Dec yoy%) 3.7 3.9 3.6
Broad Money 11.5 11.0 12.0
Credit 10.0 13.0 17.0
Fiscal Accounts (% of GDP)
Consolidated budget balance (2.9) (4.0) (3.6)
Primary Balance (0.9) (1.9) (1.5)
External Accounts (USD bn)
Exports 377.0 389.4 403.8
Imports 378.6 395.7 415.4
Trade balance (1.7) (6.3) (11.6)
% of GDP (0.1) (0.6) (0.8)
Current account balance (17.3) (26.5) (31.3)
% of GDP (1.4) (2.0) (2.2)
FDI 13.0 18.0 26.0
FX reserves 186.5 205.0 225.0
MXN/USD (eop) 12.9 12.5 12.4
Debt Indicators (% of GDP)
Government debt 35.6 36.5 36.8
Domestic 24.4 25.0 25.2
External 11.2 11.5 11.6
Total external debt 20.3 21.7 23.3
in USD bn 250.2 287.6 331.3
Short-term (% of total) 18.0 17.0 19.0
General
Industrial production (yoy%) 1.0 2.8 3.2
Unemployment (%, avg) 5.4 4.9 4.8
Financial Markets (eop) 1Q14 2Q14 4Q14
Overnight rate (%) 3.5 3.5 3.8
3-month rate (%) 3.8 3.8 4.1
MXN/USD 12.8 12.7 12.5 Source: Deutsche Bank

7 January 2014
Cement & Construction
Mexico Strategy
Page 8 Deutsche Bank Securities Inc.
Business plan
Entering exclusive areas along with partners
Juanito has already announced to his boss, friends, family and potential investors his plan to improve the health of his finances. As expected, there was some pushback. However, his initiatives seem to be well underway.
With that part of his renewed life plan secured, Juanito can now focus on his business projects. He is excited as the new endeavors could turn into his main legacy.
Juanito has found ample business opportunities in the energy sector, specifically in three key areas: oil & gas, downstream and electricity. All of these were so far exclusive of the public sector, but changing regulations now allow private participation.
He is specifically thinking of deep water oil exploration and extraction, shale gas exploitation, and electricity generation. There are also many other business opportunities in these sectors.
Juanito lacks knowledge, technical capacity and financial power to pursue most of these projects alone, and therefore attracting the right investor will be paramount. It means that highly specialized, capital intensive projects will most likely need the participation of some of his friends in the US, Europe and Asia, to name a few. There are some Mexican colleagues that would also add value to his plans.
In a final effort to maximize his revenues, Juanito acknowledges that he will be unable to participate directly in all his projects. Therefore, Juanito has come up with a plan to offer a licensing scheme to investors who want to exploit his business ideas without him being actively engaged in the day-to-day operations.

7 January 2014
Cement & Construction
Mexico Strategy
Deutsche Bank Securities Inc. Page 9
Energy Reform in a nutshell
The recently approved Energy Reform in Mexico breaks perennial paradigms, thus clearing the way for healthier and faster growth for years to come. The approved bill includes:
Constitution. Modifications to Articles 25, 27 and 28 to allow the participation of private companies in the energy sector.
Contracts. Service, profit sharing, production sharing, and licenses. Concessions are not part of the potential deal. Contractors will be hired using public bidding processes.
Risks. To be assumed by the contractor. The state will be allowed to join the project since inception or when exploration activities prove to be successful.
Pemex. No longer a state monopoly but rather a productive entity that will compete against other companies. Private investments will be allowed in crude oil exploration and extraction; gas processing; oil and gas transport, warehousing and distribution. Pemex to retain the right of first refusal (Ronda Cero) for crude oil exploration and extraction. The workers union to leave Pemex’s board.
CFE. Private investments in electricity generation and commercialization. State to control transmission and distribution.
Mexican Oil Fund. Banxico will act as trustee to manage all payments under granted contracts.
Macroeconomic goals. Boost GDP growth by an additional 1% by 2018 and 1.6% by 2025. Increase crude oil production to 1.5mn barrels per day by 2025 (i.e., +60% vs current levels); increase natural gas production 7.3bn cubic feet per day by 2025 (i.e., +100% vs current levels).
Adapting energy models to modern times The hydrocarbons chain comprises the following activities:
Exploration and extraction. Pemex manages all crude oil and gas resources and establishes simple service contracts with its suppliers.
Refining and petrochemicals. Pemex refines oil (gasoline and diesel) and produces basic petrochemicals (natural gas and liquefied petroleum gas or LPG). Secondary petrochemicals are open to private investments along with Pemex.
Transport, storage, distribution and sales of refined products and petrochemicals. Pemex and the private sector transports, stores and sells natural gas and LPG. The private sector transports and sells gasoline and diesel.

7 January 2014
Cement & Construction
Mexico Strategy
Page 10 Deutsche Bank Securities Inc.
The Energy Reform modifies these activities the following way:
Exploration and extraction. The state will continue to manage resources but will be allowed to assign profit sharing contracts to Pemex and/or the private sector.
Refining and petrochemicals. The private sector will be allowed to participate in the refining of crude oil and the production of basic petrochemicals. Secondary petrochemicals will remain open to private investments.
Transport, storage, distribution and sales of refined products and petrochemicals. The private sector will continue to provide transport, storage, and sale services.
The electric sector comprises the following activities:
Generation. CFE is in charge of generating electricity through traditional and alternative sources. The agency is in charge of the operational control along with the National Energy Control Center or Cenace (Centro Nacional de Control de la Energía).
Transport. CFE is the sole operator of a national transmission and distribution chain.
Supply. CFE is in charge of commercializing energy to the final user.
The Energy Reform modifies these activities the following way:
Generation. Private generators will be allowed to compete against CFE. Cenace transforms into a federal agency and will be in charge of operational control of the sector.
Transport. CFE can participate along with private companies to finance and operate transmission and distribution projects.
Supply. CFE will remain in charge of commercializing energy to the final user.
More room for private sector to participate The reform includes the participation of the private sector through government-granted contracts in several areas so far controlled by Pemex and CFE. No concessions will be granted to safeguard the state’s power over natural resources.
The private sector will now be allowed to participate in refining, distribution and commercialization, among other tasks. Payments will be set based on a progressive model where profits will be shared up to certain limits, pushing the IRRs in line with typical market returns.
The government expects this scheme to boost oil production to 2.5-3.0mn barrels per day by 2018 and above 3.5mn by 2025. Furthermore, it also anticipates gas production to increase to 8,000mn square feet by 2018 and 10,000mn square feet by 2025.
With respect to electricity, the state will have exclusive rights to control the national electrical system, and transmission and distribution networks.

7 January 2014
Cement & Construction
Mexico Strategy
Deutsche Bank Securities Inc. Page 11
Accountability and transparency to improve Pemex and CFE will be restructured and a new set of rules will be set for purchases and projects. With respect to Pemex, the new structure will include two divisions: Exploration and Production, and Industrial Transformation.
Oil, gas, and electricity account for the bulk of NIP About US$215bn, or 67%, of the National Infrastructure Program (NIP) 2013-18 should be directed toward energy, Pemex and CFE included. The remaining US$105bn should be invested as follows: US$58bn in telecom and US$47bn in transportation. Regarding the latter, the plan includes the construction of 44 toll roads and highways, seven airports, seven marine ports, and three passenger trains, among others.
Short-term projects We expect the following projects to have positive spillover in 2014:
Pemex using partners to drill in shallow waters.
Building pipelines to transport fuel across Mexico rather than moving it by truck, which raises transportation costs by 15 times when compared to pipelines.
Developing natural gas so far neglected by Pemex and increasing pipeline infrastructure for imports should bring manufacturers’ costs down.
Fostering the production of fertilizers and petrochemicals, most of which are imported due to the lack of natural gas and companies that transform oil.
The US-Mexico Transboundary Hydrocarbons Agreement The US-Mexico Transboundary Hydrocarbons Agreement, signed in 2012, is a set of rules concerning the development of oil and gas reservoirs that cross the international maritime boundary between the two countries in the Gulf of Mexico. The US is Mexico’s largest supplier of refined oil products (mostly coming from US Gulf Coast refineries) and Mexico is consistently one of the top three exporters of petroleum to the US. In turn, we believe it is in the best interest of both countries to execute such an agreement; Pemex needs technology and investment to boost production and US companies eagerly wait for an opportunity to do business in Mexico.
Production impact of the Energy Reform Deutsche Bank’s Mexico economic unit expects production to reach 4mn barrels per day vs 2.5mn without reforms. Furthermore, the energy bill should boost energy-related investments to 3.5% of GDP instead of 2% currently.
Figure 4: Energy Reform scenarios and performance No reform Reform
Production (million barrels per day) 2.5 4
Natural gas price (US$ per thousand cubic feet) 5 3.5
Electricity price (US$cents per Kilowat hour) 9.9 6.2
Investment (% of GDP) 2 3.5Source: Deutsche Bank.

7 January 2014
Cement & Construction
Mexico Strategy
Page 12 Deutsche Bank Securities Inc.
Contracts
The approved Energy Reform includes the possibility of offering private companies four types of contracts: service, profit sharing, production sharing and licenses. In addition, the approved bill includes the possibility of offering "other schemes”. This suggests that the array of production alternatives may be even wider than expected.
Service contracts Companies are hired for clearly defined jobs and for a fixed period of time. They will explore and develop oil or natural gas fields on behalf of the Mexican government by bringing their own technology and making all upfront capital investments. The payment is fixed and agreed upon when the contract is signed. Payments will be in cash and the company will not receive any of the oil it helps extract. A major drawback is that pre-determined fees for deep water exploration and extraction are typically so onerous that Pemex and the Mexican government have so far been unable to use service contracts for more complex drilling and development work.
Profit sharing Companies will get a fixed base payment to cover mainly incurred costs. In addition, they will also get a fee per barrel that should be capped at a level that allows the private entity to reach a certain internal rate of return (IRR). The payment will be in cash. The company will have no field ownership rights and will bear most of the operational risks.
Production sharing The Mexican government and participating private companies will agree on a percentage of production that each party will receive after both sides have recovered a specified amount of costs and expenses. This means that part of the oil extracted will be used to cover costs (ie, cost oil) and the remaining portion will be profit (ie, profit oil). Payments will be in cash or in oil. These contracts should foster a partnership between the private companies and Pemex to maximize profits. Mexico will retain full control and ownership of the resources.
Licenses Private companies will compete in public bidding processes to win the right to explore and extract oil. Payments to the government imply an up-front fee and could also include a bonus payment upon conclusion of the contract. After extraction, hydrocarbons will be transferred to the private companies, which could have to pay some additional fees. Across the world, licenses also include other smaller income streams such as fees per square kilometers. Licenses could work as a good proxy to concessions in terms of operability, without the political costs of granting property of underground resources to private companies. Mexico will retain full control and ownership of the resources.
Licenses should allow companies to write them as long-term assets, thus increasing the possibility of leveraging the balance sheet to execute the projects. A key challenge will be to handle sovereignty concerns that could arise from these contracts giving decision making power to private companies in handling the exploration and development of the fields.

7 January 2014
Cement & Construction
Mexico Strategy
Deutsche Bank Securities Inc. Page 13
According to Deutsche Bank’s Mexico economic unit, close to half of the crude oil production in the world is conducted through concession-based schemes, and another quarter rests on legal arrangements that combine them with another scheme. On the other hand, out of the 20 top oil producers, only Iran, Iraq and Angola use profit-sharing contracts. Licenses could work as a good proxy to concessions in terms of operability, without the political costs of granting property of underground resources to private companies.
Figure 5: Top global oil producers and their alternative schemes
Source: Deutsche Bank. R means included in the Energy Reform.
By including production-sharing contracts and licenses in the menu of available schemes for oil exploration and production, the energy reform became deeper and broader than the original proposal: deeper because licenses and production sharing contracts can attract more investment by granting companies more operational control of their projects than profit-sharing contracts and provide a clearer legal framework; broader because different projects can be accommodated in the different schemes, depending on their risk, investment requirements and technical difficulty. A diverse menu of schemes may create opportunities for investment not only in deep-water wells and other high-risk projects, but also in mature fields on a declining production path. Such flexibility would be difficult to attain even in a scheme purely based on concessions.
Our LatAm Economics team estimates that additional FDI to the oil sector could be around US$20bn or 1.5% of GDP, up from our previous estimate of 1%. Moreover, they estimate that a broader legal scope able to accommodate a wider diversity of projects should have a larger impact on production. Thus, our team estimates crude production under the reform to reach 4.0mn barrels per day.

7 January 2014
Cement & Construction
Mexico Strategy
Page 14 Deutsche Bank Securities Inc.
No free lunch According to El Economista, Pemex’s fiscal regime will be applied to all domestic and international companies that participate in the oil business. This is 70% per barrel. However, deep-water exploration, due to the nature of the higher costs and risks, as well as even shale gas, could be subject to a revised rate to be set by the National Hydrocarbons Commission and the Ministry of Finance.
Pemex’s first right of refusal
Pemex will retain a first right of refusal (Ronda Cero) for crude oil exploration and extraction.
The company will have 60 natural days as soon as a decree is public to show the Ministry of Energy (Sener) that it has all technical, financial and execution capabilities to explore and extract hydrocarbons in an efficient and competitive way. In the absence of this, contracts will be available for private companies to benefit.
Sener and the National Hydrocarbons Commission will have to publish a resolution within 180 natural days after Pemex shows interest in a project.
It is worth noting that Pemex will retain all rights in fields currently under development.
According to Emilio Lozoya, Pemex’s CEO, “Ronda Cero” will be up and running during 1H14. Through this first right of refusal, Pemex expects to keep its exposure to all fields currently producing hydrocarbons and to those where the company has already performed exploration or seismic studies. If at any point Pemex decides to have partner, these will have to participate in a public bidding process.
Sector regulators
Ministry of Energy The Ministry of Energy (Secretaría de Energía or Sener) will establish all technical and contractual rules. The National Hydrocarbons Commission and the Energy Regulating Commission, which today are part of Sener, will now act as independent regulatory agencies. This means that they will have enough power to control competitors in the sector. They will also act independently in the use of proceeds arising from contracts.
National Hydrocarbons Commission The National Hydrocarbons Commission (Comisión Nacional de Hidrocarburos or CNH) will auction all new contracts among private companies and Pemex. It will provide technical assistance to Sener, will gather geological information, will designate the winners of bidding processes and will underwrite hydrocarbons exploration and extraction contracts.
Energy Regulating Commission The Energy Regulating Commission (Comisión Reguladora de Energía or CRE) will regulate all permits for warehousing, distribution and transport of hydrocarbons.

7 January 2014
Cement & Construction
Mexico Strategy
Deutsche Bank Securities Inc. Page 15
Natural Gas Control National Center The Natural Gas Control National Center (Centro Nacional de Control del Gas Natural) will be in charge of operating the natural duct network.
Energy Control National Center The Energy Control National Center (Centro Nacional de Control de Energía) will be in charge of the operating control of the national electric system).
Ministry of Finance The ministry of Finance (Secretaría de Hacienda y Crédito Público or SHCP) will be in charge of setting fiscal conditions.
New Pemex Board
A new board will be formed by five representatives of the federal government and five independent members appointed by the senate. The bill puts the workers union out of the board, thus suggesting that the corporate governance of the company will change significantly and that the discussion of this issue will not be an obstacle in the secondary legislation process.
A leaner Board along with other changes approved in the Energy Reform should give Pemex not only autonomy over its budget but also faster decision processes. The changes might allow Pemex to raise its investment budget to US$35bn per year from about US$25bn currently.
The Mexico Oil Fund
Banco de México (Banxico) will be the trustee behind the newly created public trust, denominated the Mexico Oil Fund. Banxico will collect, manage and distribute all income generated from contract assignments.
One of the shortcomings of this fund is that, in contrast to the Norway model, in Mexico this fund is formed with the resources that are left over from first covering public finance needs. That means that transparency could be limited by other use of proceeds not directly tied to the energy sector.
Resources generated from the commercialization of hydrocarbons (excluding taxes) will be deposited in this fund. In a first instance, the fund will pay dues to companies and the state. After that, it will make transfers to the oil-related income stabilization funds, created in 2009 to offset financial needs if market oil prices are below budget estimates. This will be managed by a committee formed by three government representatives and four independent members appointed by the senate.
The Hydrocarbons Extraction Fund will then receive resources (mainly used for sustainable energy investigation).
Finally, any leftovers will reach the Ministry of Finance, which will use the money to cover any other major needs.

7 January 2014
Cement & Construction
Mexico Strategy
Page 16 Deutsche Bank Securities Inc.
Oil & Gas
Pushing for a leaner and more efficient model
The hydrocarbons chain is currently comprised of the following activities.
Exploration and extraction. Pemex manages all crude oil and gas resources and establishes simple service contracts with its suppliers.
Refining and petrochemicals. Pemex refines oil (gasoline and diesel) and produces basic petrochemicals (natural gas and liquefied petroleum gas or LPG). Secondary petrochemicals are open to private investments along with Pemex.
Transport, storage, distribution and sales of refined products and petrochemicals. Pemex and the private sector transport, store and sell natural gas and LPG. The private sector transports and sells gasoline and diesel.
The Energy Reform modifies these activities the following way:
Exploration and extraction. The state will continue managing the resources but will be allowed to assign profit sharing contracts to Pemex and/or the private sector.
Refining and petrochemicals. The private sector will be allowed to participate in the refining of crude oil and the production of basic petrochemicals. Secondary petrochemicals will remain open to private investments.
Transport, storage, distribution and sales of refined products and petrochemicals. The private sector will continue to provide transport, storage and sale services.
Pemex
Petróleos Mexicanos (Pemex) is the fifth crude oil producer worldwide. In Mexico it is the sole producer of crude oil, natural gas and refined products. It is also the sole marketer of refined products in the country. The institute is the third major suppliers of crude oil to the US, just behind Canada and Saudi Arabia.
Pemex currently operates through four different subsidiaries.
Pemex Exploración y Producción (Exploration and Production) Main products include crude oil (Maya, Istmo and Olmeca) and natural gas.
Pemex Refinación (Refining). Main products include Magna and Premium gasolina, diesel, turbosine and fuel oil.
Pemex Gas y Petroquímica Básica (Gas and Basic Petrochemicals). Main products include natural and liquefied gas, sulphur, and industrial fuel inputs (eg, ethane, propane, butane, pentane, hexane, heptanes, naphtha, and methane).
Pemex Petroquímica (Petrochemical). Main products include methane and ethane derivatives, as well as propylene.

7 January 2014
Cement & Construction
Mexico Strategy
Deutsche Bank Securities Inc. Page 17
In addition, Pemex and its four subsidiaries have equity stakes in 40 different companies.
Figure 6: Pemex’s main business lines
Source: Deutsche Bank; Pemex
Under President Peña Nieto’s Energy Reform, Pemex will be restructured into two divisions: Exploration and Production, and Industrial Transformation.
A pillar of the Mexican economy Pemex’s revenues are higher than the total of the top five companies in the Mexican Stock Exchange (BMV). Furthermore, its EBITDA is 60% higher than the sum of all listed companies in Mexico.
With revenues from the oil and gas industry representing 7-9% of Mexico’s GDP over the last five years, Pemex has turned into the most important source of government income (i.e., taxes and duties paid by Pemex account for about 34% of the federal government’s income).
Figure 7: Key contributor to the Mexican government
30%
31%
32%
33%
34%
35%
36%
37%
38%
39%
0
10
20
30
40
50
60
70
80
2006 2007 2008 2009 2010 2011 2012
Taxes and duties (US$bn) % of government income
Source: Deutsche Bank; Pemex

7 January 2014
Cement & Construction
Mexico Strategy
Page 18 Deutsche Bank Securities Inc.
Plenty leeway for the private sector to participate Pemex’s business plan includes 14 objectives, which the private sector can help achieve, in our view. The most relevant are to 1) increase inventory of reserves through new discoveries, 2) increase production of hydrocarbons, 3) obtain efficiency levels in-line with international standards and 4) support business growth through technological development.
We also foresee immediate opportunities for the private sector in the following strategic projects for the institute: 1) deep water exploration, 2) cogeneration, 3) clean fuels, 4) cryogenic plants and 5) new refineries.
Mexico in clear need of higher crude oil production
The production of hydrocarbons in Mexico is in a clear downward trend affected by an outdated energy model in which the private sector has extremely limited participation.
In addition, proved and probable reserves have contracted over the last years and the outlook remains one of reduction. Proved reserves have declined at a 1% CAGR since 2008; probable reserves however, have shrunk at a 4% CAGR during the last four years.
According to Sener, hydrocarbon projections in production from 2013-2018 are based on a starting level of 3,729 thousand barrels of oil and can reach levels of up to 5,648 thousand barrels of oil. In 2026, the share of crude oil in the production of hydrocarbons could decrease to reach a range of 59-64 % due to the expected exploitation of shale gas in Mexico.
Investment programs created by Sener in exploration and production activities are intended to increase proven reserves and substantially improve the rate of return and sustain production levels in the short and medium term. Investments in production are estimated to be at least P$311bn during the period 2012-2026. Of the total investments to be developed in exploration and production projects between 2012-2026, 19% will go to deepwater developments and 24% for exploration projects on onshore basins and shallow waters.
It is estimated that comprehensive production contracts could average at least 8.4 % of total investments while the development of shale gas projects require a minimum of 4% of investments in 2012-2016.
Additionally, exploitation activities could represent at least 70% of crude oil production in the period 2012-2026.

7 January 2014
Cement & Construction
Mexico Strategy
Deutsche Bank Securities Inc. Page 19
Figure 8: Hydrocarbons Production (MMboed) Figure 9: Reserves (MMMboe)
0.00
0.50
1.00
1.50
2.00
2.50
3.00
3.50
4.00
4.50
2008 2009 2010 2011 2012
Crude Condensates Natural gas equivalent
3.963.78 3.79 3.72 3.70
0.00
5.00
10.00
15.00
20.00
25.00
30.00
35.00
40.00
45.00
50.00
2008 2009 2010 2011 2012
Proved Probable Possible
43.56 43.07 43.07 43.84 44.53
Source: Deutsche Bank; Pemex Source: Deutsche Bank; Pemex
Limited reserves along with declining hydrocarbons production have translated into lower manufacture of petroleum products.
Figure 10: Production of petroleum products (Mbd)
0
200
400
600
800
1,000
1,200
1,400
1,600
2008 2009 2010 2011 2012
Gasoline Diesel Fuel Oil LPG Other
1,436 1,4701,362 1,316 1,337
Source: Deutsche Bank; Pemex
According to Milenio, crude production in LatAm countries with constitutional amendments increased at least 45%.
Brazil, for example, has had major reforms: one in 1997 and another one in 2010. Crude production has increased from about 650,000 barrels per day in 1990 to 2.1mn barrels per day as of today. This implies a 60% increase.
Colombia is another good example, which had a major reform in 2003. Crude production has increased from about 530,000 barrels per day in 1990 to almost 1.0mn crude barrels per day as of today. This implies a 45% increase.

7 January 2014
Cement & Construction
Mexico Strategy
Page 20 Deutsche Bank Securities Inc.
Figure 11: Crude production in LatAm countries with energy reforms
3,022
3,371
2,577 2,538
841
1,497
2,055 2,108
652541
786990
0
500
1,000
1,500
2,000
2,500
3,000
3,500
4,000
1990
1991
1992
1993
1994
1995
1996
1997
1998
1999
2000
2001
2002
2003
2004
2005
2006
2007
2008
2009
2010
2011
2012
2013
Mexico Brazil Colombia
Reform in Brazilin 1997
Reform in Colombia
in2003
Reform in Brazilin 2010
Source: Deutsche Bank; Milenio; Ministry of Energy
Mexico is the world’s sixth most important producer of crude oil. Current production stands at about 2,500 barrels per day; however, data from the Ministry of Energy (Sener) shows a clear negative trend, with production potentially falling close to 15% by 2016.
Considering the decline of the Chicontepec reservoir, maintaining a production platform close to current levels will require multiplying project execution capacity along the exploration and exploitation value chain, as well as important investment resources.
Sub-optimal investment capacity in deep waters
In 2012, the US invested about US$25bn in deep-water wells; this is excluding submarine infrastructure. This is higher than the US$20bn 2013 budget for Pemex Exploration and Production.
The US produces 1mn barrels of crude oil per day in deep waters. In contrast, Mexico has still not produced a single barrel of oil derived from these basins.

7 January 2014
Cement & Construction
Mexico Strategy
Deutsche Bank Securities Inc. Page 21
Figure 12: Producing basins
Source: Deutsche Bank; Pemex
In 2012, the US drilled 137 wells in deep waters along with 70 private oil companies. In contrast, Mexico drilled only six wells and with exploratory goals only.
Every well in this type of basin has an approximate cost of US$150-200mn. The likelihood of success ranges 20-50%, which implies that of each 100 wells drilled, close to US$10-12bn will be lost in dry wells.
Figure 13: Producing basins Basin Accumulated
production Reserves Prospective resources
1P (90%) 2P (50%) 3P (10%) Conventional Non conventional
Southeastern 45.4 12.1 19 24.4 20.1
Tampico Misantla 6.5 1.2 7 17.4 2.5 34.8
Burgos 2.3 0.4 0.5 0.7 2.9 15
Veracruz 0.7 0.1 0.2 0.3 1.6 0.6
Sabinas 0.1 0.0 0.0 0.1 0.4 9.8
Deep waters 0.0 0.1 0.4 1.7 26.6
Yucatan platform 0.5
Total 55 13.9 16.2 44.5 54.6 60.2
Reserve/production (yrs.) 10.2 19.3 32.9 Source: Deutsche Bank

7 January 2014
Cement & Construction
Mexico Strategy
Page 22 Deutsche Bank Securities Inc.
Global oil supply and demand
According to Deutsche Bank’s The House View, oil prices have been relatively stable since 2011 after rising ~4-5x in the decade before the crisis. Brent oil has risen in 11 out of the past 13 years with 2008 and 2013 (to date) the exceptions and has been broadly stable since 2011, trading in the $100-120 range 90% of the time.
Oil prices should fall as shifting supply dynamics transform global oil markets as a result of:
Rising non-OPEC supply growth led by US, Brazil, Canada to reduce OPEC pricing power
Thanks to shale oil, the US should become the world’s largest oil producer in the next few years
Thawing geopolitical tensions could support additional production from Iran and Libya
In turn, Deutsche Bank expects ~10% fall in oil prices between 2014-16 with Brent averaging $95-100 and US WTI $80-90.
Figure 14: Brent oil prices Figure 15: US oil supply
Source: Deutsche Bank; Bloomberg Finance LP Source: Deutsche Bank; IEA
Our Global Commodities team sees growing risk of an oil supply glut developing as rampant US oil production growth collides with the prospect that Iranian and Libyan oil returns to the market. Regarding the former, our team expect domestic US oil supply growth next year to rise by 1 mmb/d. This marks the third consecutive year where US oil supply has risen by such a large magnitude. The US is set to overtake Saudi Arabia and Russia to become the world’s largest oil producer in the next few years.
The US currently represents 60% of total non-OPEC oil supply growth. As a result, our team estimates that non-OPEC supply growth will be more than 70% greater than global oil demand growth in 2014. This should reduce the requirements of OPEC crude oil which in turn will imply OPEC spare capacity levels rising and surpassing their highest levels in over a decade.
As a result, Deutsche Bank’s Global Commodities team recently lowered its 2014 WTI price forecast to USD88.75/bbl and Brent to USD97.50/bbl, which would mark a roughly USD10/bbl drop in both benchmarks from 2013.

7 January 2014
Cement & Construction
Mexico Strategy
Deutsche Bank Securities Inc. Page 23
Figure 16: Global oil supply & demand, 2005-2016
Unit: Million bbl/day 2005 2006 2007 2008 2009 2010 2011 2012 2013E 2014E 2015E 2016E '00-05 '05-10 '10-15CONSUMPTIONOECD Americas 25.9 25.7 25.8 24.5 23.7 24.1 24.0 23.6 23.7 23.7 23.7 23.8 1.2% -1.4% -0.3% USA 20.8 20.7 20.7 19.5 18.8 19.2 18.9 18.5 18.7 18.7 18.7 18.8 1.1% -1.6% -0.5%OECD Europe 15.7 15.7 15.6 15.5 14.7 14.7 14.3 13.7 13.6 13.5 13.4 13.3 0.6% -1.4% -1.8% Germany 2.6 2.6 2.4 2.5 2.5 2.5 2.4 2.4 2.4 2.4 2.4 2.4 -1.1% -1.2% -0.5%OECD Asia-Pacific 8.9 8.8 8.7 8.4 8.0 8.2 8.2 8.6 8.4 8.3 8.3 8.3 0.1% -1.7% 0.3% Japan 5.3 5.2 5.0 4.8 4.4 4.5 4.5 4.7 4.6 4.4 4.4 4.3 -0.7% -3.5% -0.3%TOTAL OECD 50.5 50.2 50.1 48.4 46.4 47.0 46.5 45.9 45.8 45.6 45.4 45.4 0.8% -1.4% -0.7%
FSU 3.9 4.0 4.1 4.2 4.0 4.1 4.4 4.5 4.6 4.7 4.8 4.9 0.6% 1.3% 2.9%Europe 0.7 0.7 0.7 0.7 0.7 0.7 0.7 0.7 0.7 0.7 0.7 0.7 4.3% -1.1% 0.8%China 6.7 7.2 7.6 7.5 7.9 8.9 9.3 9.8 10.2 10.6 11.1 11.6 7.8% 5.8% 4.5%Other Asia 9.0 9.2 9.6 9.7 10.1 10.7 11.0 11.3 11.6 11.7 12.0 12.2 2.9% 3.7% 2.2%Latin America 5.0 5.2 5.3 5.7 5.7 6.1 6.2 6.4 6.6 6.7 6.9 7.0 1.2% 3.9% 2.4%Middle East 5.9 6.1 6.4 6.8 7.2 7.3 7.4 7.7 7.9 8.1 8.3 8.5 4.5% 4.4% 2.5%Africa 3.0 3.0 3.1 3.2 3.4 3.5 3.5 3.7 3.8 4.0 4.1 4.3 3.6% 3.6% 3.1%TOTAL NON-OECD 34.1 35.4 36.9 37.9 39.1 41.4 42.5 44.1 45.3 46.5 47.8 49.1 3.6% 3.9% 2.9%
GLOBAL OIL DEMAND 84.7 85.6 87.0 86.3 85.5 88.4 89.0 90.0 91.1 92.1 93.2 94.5 1.9% 0.9% 1.1%
SUPPLYOECD Americas 13.9 13.9 13.8 13.4 13.6 14.1 14.6 15.9 17.2 18.4 19.4 20.4 -0.4% 0.3% 6.6% USA 7.1 7.0 7.0 7.0 7.4 7.8 8.1 9.2 10.2 11.3 12.1 12.8 -2.5% 1.9% 9.2% Mexico 3.8 3.7 3.5 3.2 3.0 3.0 2.9 2.9 2.9 2.9 2.8 2.9 1.8% -4.7% -0.9% Canada 3.0 3.2 3.3 3.2 3.2 3.3 3.5 3.8 4.0 4.3 4.5 4.7 2.2% 1.9% 6.0%OECD Europe 5.7 5.3 5.0 4.8 4.5 4.1 3.8 3.5 3.3 3.1 2.9 2.8 -3.6% -6.1% -6.6% North Sea 5.2 4.8 4.6 4.4 4.1 3.8 3.4 3.1 2.9 2.7 2.5 2.3 -3.9% -6.3% -7.6%Other OECD 0.6 0.6 0.6 0.6 0.6 0.7 0.6 0.6 0.5 0.4 0.4 0.3 -7.6% 2.0% -11.6%TOTAL OECD 20.2 19.8 19.5 18.8 18.8 18.9 19.0 19.9 21.0 21.9 22.7 23.5 -1.6% -1.3% 3.7%
FSU 11.8 12.3 12.8 12.8 13.3 13.5 13.5 13.6 13.8 14.0 14.1 14.2 8.2% 2.7% 0.9%
Non-OECD Europe 0.2 0.1 0.2 0.1 0.1 0.1 0.1 0.1 0.1 0.1 0.1 0.1 -3.4% -1.8% -3.4%China 3.6 3.7 3.7 3.8 3.8 4.1 4.1 4.2 4.2 4.3 4.3 4.4 2.2% 2.3% 1.1%Other Asia 3.8 3.8 3.7 3.7 3.6 3.7 3.6 3.6 3.5 3.5 3.5 3.5 0.1% -0.6% -1.1%Latin America 3.5 3.6 3.6 3.7 3.9 4.1 4.2 4.2 4.2 4.4 4.5 4.7 1.8% 3.5% 1.9%Middle East 1.8 1.7 1.7 1.7 1.7 1.7 1.7 1.5 1.4 1.3 1.3 1.3 -3.3% -1.2% -5.0%Africa 2.5 2.5 2.6 2.6 2.6 2.6 2.6 2.3 2.3 2.5 2.6 2.6 4.4% 0.7% 0.1%TOTAL NON-OECD SUPPLY 27.2 27.8 28.2 28.4 29.0 29.9 29.9 29.5 29.5 30.1 30.5 30.9 3.8% 1.9% 0.4%
PROCESSING GAINS 2.0 2.0 2.0 2.0 2.0 2.1 2.1 2.1 2.2 2.2 2.2 2.3 1.3% 1.2% 1.5%GLOBAL BIOFUELS 0.6 0.8 1.1 1.4 1.6 1.8 1.9 1.9 2.0 2.1 2.2 2.3 17.2% 24.1% 3.7%
TOTAL NON-OPEC SUPPLY 50.0 50.4 50.7 50.6 51.4 52.7 52.8 53.4 54.6 56.4 57.6 58.9 1.4% 1.1% 1.8%
*TOTAL SUPPLY 84.8 85.5 85.7 86.8 85.7 87.4 88.7 90.9 1.9% 0.6%
OECD STOCK CHANGE 0.23 0.25 -0.24 0.32 0.01 0.06 -0.28 0.19 Industry 0.13 0.22 -0.31 0.32 -0.10 0.07 -0.21 0.16 Government 0.10 0.03 0.07 0.01 0.10 -0.01 -0.08 0.03
OPEC NGLS 4.2 4.3 4.3 4.5 5.1 5.6 5.9 6.3 6.4 6.6 6.9 7.0 7.0% 6.0% 4.5%**Other & Balance -0.13 -0.33 -1.11 0.18 0.18 -1.04 -0.02 0.75 -0.10 -0.05 -0.09 0.10
OPEC CRUDE OIL 30.6 30.9 30.7 31.6 29.1 29.2 29.9 31.3 2.0% -1.0%
***IEA's Call on OPEC Crude 30.5 31.0 32.0 31.1 28.9 30.2 30.2 30.4 30.0 29.1***DB's Call on OPEC Crude 30.0 29.1 28.7 28.6
Brent (1st Month) USD/bbl 55.25 66.11 72.66 98.52 62.67 80.34 110.91 111.68 108.91 97.50 100.00 95.00WTI (1st Month) USD/bbl 56.70 66.25 72.36 99.75 62.09 79.61 95.11 94.15 98.59 88.75 85.00 80.00WTI-Brent 1.45 0.14 -0.30 1.23 -0.58 -0.73 -15.80 -17.53 -10.33 -8.75 -15.00 -15.00
ANNUAL AVERAGE RATE
*Total supply excludes inventory change and other categories. **Other & Balance includes Misc. to balance and Floating Storage. ***Call on OPEC crude includes stock change and other. Source: IEA, Deutsche Bank

7 January 2014
Cement & Construction
Mexico Strategy
Page 24 Deutsche Bank Securities Inc.
Natural gas
As of late, natural gas has become the more sensible alternative to the transition towards a more efficient and cleaner energy sources in the country. In recent years, the natural gas market has increased in importance, particularly in the development and use of reserves of non conventional gas, such as shale gas.
According to Sener, the private sector is involved in transportation, distribution, storage, import and marketing of natural gas in the country. Private sector participation is allowed under the umbrella of Article 227 in the Mexican Constitution.
Transport of natural gas includes receiving, leading and delivering gas and is done under permits issued by the CRE. Transport can be categorized into i) own use, ii) for own use in societies of self-service and iii) open access transport. As of 2012, the CRE granted 235 permits, out of which 156 are currently active.
In terms of distribution, the CRE has authorized a total of 22 permits (20 of which are currently active), which include a distribution network that, as of 1H12, had a length of 46,312km with an estimated investment of close to US$2bn.
As for storage, CRE has granted three permits, all of them active (with an estimated investment of US$3bn and storage capacity of 1.2mn cubic meters. There is an additional permit granted for underground storage with a committed investment of US$200mn.
In 2011, demand for natural gas in Mexico increased 1.9% vs. 2010, mainly on the back of a more dynamic electrical sector in the country.
According to Sener, during the period spanning 2000-2011, domestic production of natural gas increased at an average annual rate of 3.9%, whereas demand increased 5.7%. In order to meet this demand, it was necessary to resort to imports, which, on average, grew 18.1% per annum and provided 22.1% of total demand. The main source of import was the United States.

7 January 2014
Cement & Construction
Mexico Strategy
Deutsche Bank Securities Inc. Page 25
Figure 17: Consumption/supply/imports of natural gas Figure 18: Natural gas participation*
0
1,000
2,000
3,000
4,000
5,000
6,000
7,000
8,000
9,000
1997
1998
1999
2000
2001
2002
2003
2004
2005
2006
2007
2008
2009
2010
2011
2012
2013
Cubi
c fe
et ('
000)
Consumption Supply Imports
39%
27%
18%
14%1% Electricity
Oil
Recirculation of the oil sector
Industrial
Residential, services and transportation
Source: Deutsche Bank. Sener Source: Deutsche Bank. Sener. * data as of 2011
According to Sener, natural gas demand in Mexico is expected to grow at an average rate of 3.5% per annum for 2012-2026. The electricity sector is expected to become the main user of natural gas in 2026, with a 46% share of the product, followed by the oil and industrial sectors, with 36% and 16%, respectively.
Domestic production is estimated to grow at an average rate of 4.5% per annum for the next 15 years; in order to meet demand, an increasing amount of imports will be necessary (estimated to grow at a 4.9% rate), which necessarily involves expansions of transport and distribution infrastructure in order to meet demand.
Figure 19: Natural gas production in Mexico and US
0
10,000
20,000
30,000
40,000
50,000
60,000
70,000
80,000
1997
1998
1999
2000
2001
2002
2003
2004
2005
2006
2007
2008
2009
2010
2011
2012
2013
Dai
ly c
ubic
feet
(mn)
Mexico US with shale gas US without shale gas
Source: Deutsche Bank. Ministry of energy

7 January 2014
Cement & Construction
Mexico Strategy
Page 26 Deutsche Bank Securities Inc.
Global trends behind natural gas prices
According to Deutsche Bank’s Global Commodities team, natural gas prices have been trading in-line with energy-adjusted coal prices since May, suggesting that further moves higher are being limited by potential utility fuel-switching away from natural gas and into coal.
However, our team finds that the price elasticity of utility demand is relatively modest. Variations in natural gas demand by electric utilities are a weak factor in influencing the supply-demand balance in comparison with weather effects on residential and commercial demand. The decreased electric utility demand in a single day of a $1/mmBtu increase in gas prices versus coal is equivalent to the increased demand resulting from a single HDD. Put another way, if electric utility demand were the only factor allowed to adjust for an excess of 30 HDDs in any given month, natural gas prices would have to rise by $1/mmBtu for the duration of the month in order to compensate.
While our team sees utility fuel-switching as significant, it is weaker in comparison to weather effects on residential and commercial demand, and therefore unlikely to create a durable ceiling or floor to prices.

7 January 2014
Cement & Construction
Mexico Strategy
Deutsche Bank Securities Inc. Page 27
Shale gas could emerge as the next hidden treasure
According to the Energy Information Administration (EIA), shale gas reserves reach 7,299 billion square feet across the world. Mexico holds the sixth place with 545 billion square feet of gas or 7.4% of total reserves worldwide.
Figure 20: Top 10 countries with shale gas reserves (billion square feet)
545
0 200 400 600 800 1,000 1,200
Brazil
Russia
South Africa
Australia
Mexico
Canada
US
Algeria
Argentina
China
Source: Deutsche Bank; El Economista
The exploitation of shale gas reserves is poised to become a secular story in Mexico. EIA estimates that total gas reserves in the world reach 22,882 billion square feet, of which shale gas accounts for more than 1/3. This ratio seems to be practically constant across the world. In the US, shale gas represents 27% of total gas reserves, practically in line with a 32% found in other countries.
In our view, the Energy Reform should help detonate Mexico’s ample shale gas reserves, most of which remain intact and with limited potential to be exploited under the current energy model.
Grupo Mexico could immediately participate in shale gas projects given their current experience in the US. The company has operated its own infrastructure of gas pipeline in the US for over a decade. It is 110 km long and flows through Douglas, Arizona, and Nacozari, Sonora.

7 January 2014
Cement & Construction
Mexico Strategy
Page 28 Deutsche Bank Securities Inc.
Figure 21: Shale oil and gas formations
Source: Deutsche Bank; SENER
Mexico lags peers in shale oil and gas investments In 2012, the US invested about US$55bn in shale basins. This is equivalent to 90% of Mexico’s fiscal proceeds coming from Pemex Exploration and production. Every well in this type of basin has an approximate cost of US$8-10mn. The likelihood of success is also below 50%.
In 2012, the US produces 700,000 barrels per day of shale oil and 26.9bn cubic feet per day of shale gas. To achieve this, the US granted that year 9,100 permits to 170 companies to drill in this type of basins.
Even though the US shale oil and gas geological structures extend into Mexico, Pemex granted only three permits to drill in these basins.
As for the extraction of shale gas, Sener estimates the Eagle Ford shale formation to provide 1,343mn daily cubic feet, which will represent a 15% share. Pemex has expressed interest to explore and develop fields where gas containing liquids is more profitable. On the other hand, it is important to mention that exploration and production of shale gas technologies require integration of geosciences, horizontal drilling and hydraulic fracturing to achieve massive commercial success and appropriate profitability in the current environment.
Figure 22: Shale resources potential
Source: Deutsche Bank; Pemex

7 January 2014
Cement & Construction
Mexico Strategy
Deutsche Bank Securities Inc. Page 29
Downstream
Ample room to increase refining capacity
According to Sener, Pemex Refinación (PR) will increase the infrastructure of its production system and incorporate new technologies to improve product quality and satisfy increasing demand. One of the strategies to follow is to enhance residue conversion to optimize fuel production, decreasing thereby residue generation and increasing gasoline and intermediate distillate production.
Some strategic projects to be executed include 1) residue conversion in Tula refinery, 2) Salina Cruz refinery upgrading and 3) additional refining capacity, considering that there are sufficient investment resources to execute it.
Figure 23: Future goals in downstream
Source: Deutsche Bank; Pemex
All in all, Sener expects processed crude oil to reach 1.8mn barrels per day by 2016, not enough to offset current demand in the domestic market.

7 January 2014
Cement & Construction
Mexico Strategy
Page 30 Deutsche Bank Securities Inc.
Figure 24: Processed crude oil by type (thousand barrels per day)
0
200
400
600
800
1,000
1,200
1,400
1,600
1,800
2,000
2006 2007 2008 2009 2010 2011 2012 2013 2014 2015 2016
Heavy Light Other
Source: Deutsche Bank; Sener
It is important to keep in mind that the quality of crude oil to be processed will also demand higher investments. In 2006, heavy crude oil accounted for 39% of total processed oil; however, Sener expects this stake to increase to 60% by 2016.
Furthermore, the increase of the vehicle fleet, air travel and a stronger industrial sector will require more and better fuel availability. The production of oil-derived products such as gasoline, turbosine, diesel, fuel oil and petroleum coke should reach 1.6mn barrels of equivalent crude oil by 2016, according to Sener. This translates into a 22% increase vs 2012 levels.
Gasoline According to Sener, with the construction of infrastructure projects to improve refining capabilities, a greater amount of light and middle distillates will be produced, and thus, imports of gasoline might likely decrease in the long term. However, a gradual increase in demand could lead to an increase in imports. On this, Sener estimates that gasoline production will increase at a 4% rate during the period spanning 2012-2026; furthermore, gasoline imports are estimated to increase at an average annual rate 3.4% for the same period, which could lead to a deficit in the commercial balance of this product. Sener forecasts that, in 2026, gasoline production in Mexico will only cover 51% of national demand and 49% will come from imports.

7 January 2014
Cement & Construction
Mexico Strategy
Deutsche Bank Securities Inc. Page 31
Figure 25: Gasoline consumption and imports Figure 26: Gasoline supply sources in 2026
0
50
100
150
200
250
300
350
400
450
500
1997
1998
1999
2000
2001
2002
2003
2004
2005
2006
2007
2008
2009
2010
2011
2012
Barr
eks
('000
)
Production Imports
51%
49%
Production Imports
Source: Deutsche Bank. Sener Source: Deutsche Bank. Sener
For the period 2011-2026, gasoline demand will grow at an annual average rate of 3.7% according to Sener, with the motor transport sector utilizing close to 100% of the production. Among the alternatives to reduce fuel consumption and reduce greenhouse gas emissions is hybrid technology, which combines a gasoline or diesel engine with an electric motor to drive the vehicle. However, the introduction into Mexico of these technologies has been slow and is likely to continue being so mainly due to lack of economic or fiscal incentives for the acquisition of these types of vehicles.
Figure 27: Production/imports/demand of petrochemicals in Mexico
0
3
6
9
12
15
18
21
24
1997
1998
1999
2000
2001
2002
2003
2004
2005
2006
2007
2008
2009
2010
2011
2012
US$
bn
Demand Imports Production
Source: Deutsche Bank. Ministry of Energy.
Turbosine Turbosine is destined for consumption in air transport. Thus, the sector demand is directly related to economic activity, both nationally and internationally. Sener expects turbosine production to have an annual growth of 1.5% in 2011-2026. However, turbosine production is likely to present a deficit in the long term mainly due to an increase in demand from the aeronautical sector in the country, and thus imports will be of utmost relevance going forward.

7 January 2014
Cement & Construction
Mexico Strategy
Page 32 Deutsche Bank Securities Inc.
Figure 28: Turbosine production and imports 2011-2026
0
10
20
30
40
50
60
70
80
90
2011
2012
2013
2014
2015
2016
2017
2018
2019
2020
2021
2022
2023
2024
2025
2026
Dai
ly b
arre
ls (´
000)
Production Imports
Source: Deutsche Bank. Sener
Consumption of turbosine is forecasted to reach close to 101mndaily barrels (vs. 45mn daily barrels consumed in 2011). This growth will mainly be due to increased business activity in the sector. Expansions and modernization of airport infrastructure and increases in fleets of national and international airlines will be the backbone of the aeronautical sector increase.
Diesel According to Sener, one of the most essential plans is to build the necessary infrastructure to produce ultra low sulfur distillate facilities in the SNR. These projects will likely raise diesel production and reduce imports of energy in the upcoming years.
Diesel production is estimated to grow at an annual average rate of 5.2% for the period spanning 2011-2026. Additionally, from 2016 to 2021 diesel imports will be halted and Mexico is expected to turn into a net exporter of this product. It is estimated that by 2017, diesel exports will reach their highest level (ie 88mndaily barrels). From 2022-2026, diesel imports will increase gradually until they reach 70mn daily barrels in 2026.
Figure 29: Diesel production/imports/exports
0
100
200
300
400
500
600
700
2011
2012
2013
2014
2015
2016
2017
2018
2019
2020
2021
2022
2023
2024
2025
2026
Dai
ly b
arre
ls (´
000)
Production Imports Exports
Source: Deutsche Bank. Sener
Total demand is expected to increase at 3.4% per annum; close to 90% of demand is likely to come from the transportation sector, 6% from industrial sector and 45% could correspond to the oil and electricity sectors.

7 January 2014
Cement & Construction
Mexico Strategy
Deutsche Bank Securities Inc. Page 33
Others According to Sener, fuel oil is expected to have a production surplus in upcoming years; thus, fuel oil production up to 2026 is will likely to be reduced to 49%. Total demand for fuel oil is likely to reach 47mndaily barrels (-79% vs 2011 levels) out of which 76% will be directed to the electricity sector and the remaining 24% to the oil, industrial and shipping sectors.
Petroleum coke is estimated to reach 5,202mn tons per annum in 2026 (vs 1,624mn tons per annum in 2011) and demand is likely to reach 3% annual growth on the back of an increase of use in the cement, basic metals and chemical sectors in Mexico and this fuel will be regarded as an alternative product to natural gas and fuel oil.
Global refining supply and demand
According to Deutsche Bank’s Global Commodities team, the current refinery capacity glut that is ever growing given rapid and sizable capacity expansions in Asia and now the Middle East appears to be on track to persist for the next several years. This paints a bearish picture for refining margins. On their estimates, only in 2017 should we expect to see surpluses swamp the downstream balance essentially forcing capacity closures, which will the key catalyst to reversing the bearish trend.
According to BP Statistical Review, global refinery capacity expanded by sizable 10.3 mmb/d or 13% from 2000 to 2012, of which 60% of the growth occurred in China alone. Refinery expansions are set to continue in Asia, notably in China over the next several years. From 2014 to 2021 an estimated 15 mmb/d of refinery capacity (distillation basis only) is planned to be constructed, of which 43% is to be in China. Latin America is set to add 2 mmb/d of capacity contributing 14% of global growth. Our team notes that projects face slippage and delays if not outright cancellations with Latin America being the most vulnerable. Ultimately this implies that the US could have to bear perhaps more than its expected share of the burden to consolidate capacity.
Figure 30: Global refinery capacity expansions – primary by region
0.0
2.0
4.0
6.0
8.0
10.0
12.0
2012 2013 2014 2015 2016-Beyond
Africa Asia-Pacific Europe FSU Latin America Middle East North America
Mln Bbl/day
2.1 1.8 1.5 2.3
11.2
Source: Deutsche Bank; Bloomberg Finance LP, C1, Wood Mackenzie, Reuters. Gross capacity addition.

7 January 2014
Cement & Construction
Mexico Strategy
Page 34 Deutsche Bank Securities Inc.
Electricity
Boosting industrial growth through lower tariffs
CFE The Federal Electricity Commission (CFE) is a company created and owned by the Mexican government. It generates, distributes and markets electric power across the nation and is in charge of planning the national electrical system. It is a decentralized government agency, with full control of its own assets.
The infrastructure to generate electric power is made up of 209 generating plants, having an installed capacity of 52,515 megawatts (MW). The institute has thermoelectric, hydroelectric, coal-fired, geothermal solar, and wind powered plants and facilities, as well as one nuclear power plant. Furthermore, CFE has more than 756,000 km of power lines that transmit and distribute electric power.
Domestic users account for 87% of CFE’s users but only 17% in sales (MWh) and 14% in revenues (P$). On the other hand, the industrial sector accounts for 1% of users but 59% in sales (MWh) and 64% in revenues (P$).
Figure 31: Number of users 2012 Figure 32: Sales 2012 (MWh)
0
50,000
100,000
150,000
200,000
250,000
300,000
350,000
400,000
450,000
Domestic Commercial Services Agriculture Medium industry
Large industry
Total
0
500,000
1,000,000
1,500,000
2,000,000
2,500,000
3,000,000
Domestic Commercial Services Agriculture Medium industry
Large industry
Total
Source: Deutsche Bank; CFE Source: Deutsche Bank; CFE
Figure 33: Revenues 2012 (P$mn) Figure 34: Average price (P$/kWh)
0
500
1,000
1,500
2,000
2,500
3,000
3,500
4,000
Domestic Commercial Services Agriculture Medium industry
Large industry
Total
0.00
0.50
1.00
1.50
2.00
2.50
3.00
3.50
Domestic Commercial Services Agriculture Medium industry
Large industry
Total
Source: Deutsche Bank; CFE Source: Deutsche Bank; CFE

7 January 2014
Cement & Construction
Mexico Strategy
Deutsche Bank Securities Inc. Page 35
As of 2012, CFE’s total effective generation capacity reached 53,114 MW. Thermal and hydroelectric energy account for more than half of CFE’s generation. Furthermore, independent power producers contribute with about 1/3 of electricity, according to our estimates.
Figure 35: Effective generation capacity by type
31%
30%
25%
5%4%
3%1%1%
Thermal
Independent producers
Hydro electric
Dual
Coal-fired
Nuclear
Geo-thermal
Wind-driven
Photo voltaic
Source: Deutsche Bank
The institute’s 2013-27 work and investment program (POISE) anticipates generation capacity to increase 45,140 MW within the period. Just La Yesca hydroelectric plant should contribute with an additional 750MW.
Figure 36: Capacity and expected additions (MW)
0
500
1,000
1,500
2,000
2,500
3,000
3,500
4,000
4,500
5,000
0
20,000
40,000
60,000
80,000
100,000
120,000
2012
2013
2014
2015
2016
2017
2018
2019
2020
2021
2022
2023
2024
2025
2026
2027
Capacity Addition
Source: Deutsche Bank; CFE
Fighting a complex financial scenario Currently, 47% of CFE’s transmission lines are 30 years old or more and only 8% was constructed during the last five years.
CFE expects to increase its transmission network by 1.1% per year in 2013-26, below the expected 4.1% annual growth in demand during the same period.
CFE’s losses, measured as uncharged energy service as a percentage of net consumption, have increased from 12% in 1980 to 15% in 2012. Adding distribution and commercialization losses, uncharged energy reached 21%. During the same period, countries part of the Organisation for Economic Co-

7 January 2014
Cement & Construction
Mexico Strategy
Page 36 Deutsche Bank Securities Inc.
operation and Development (OECD) decreased losses from 5-12% in 1980 to 3-8% in 2012.
In 2012, CFE’s financial deficit reached P$77bn of which more than 40% was absorbed through reductions in the agencies equity. Furthermore, in 1H13 CFE’s equity decreased another P$35bn, more than the full equity adjustment of 2012.
Competition should have positive spillover
The industry faces problems such as the lack of competitive electric tariffs, high generating costs, distribution constraints and CFE’s tight financial situation. Electric tariffs are on average 25% higher than those in the US despite Mexico’s subsidized rates. The main objective of the reform to the electric sector is the decrease of tariffs. This should be achieved through the reduction of production costs, the increase in supply and the efficient operation of the National Electric System.
Mexico’s current effective electric capacity reaches 63 Gigawatts. Of this, nearly 64% is operated by CFE and the remaining 36% by private producers through schemes such as Independent Electric Energy producers (PIE), auto-supply and co-generation, among others (all part of 1992 Electric Energy Reform). The main problem of these alternative generation schemes is that their entire electric flux of independent producers has to be sold to CFE, which then has the task of distributing exceeding supply.
Clean electricity In 2012, Congress approved the Climate Change general Law (Ley general de Cambio Climático), which sets a target of greenhouse gas reduction of 30% by 2020 and 50% by 2050 (both vs 2000 levels). This law establishes that at least 35% of electric generation should come from non-fossil clean sources by 2024 vs 18% in 2012.
In 2012, China, the US and India had capacity to generate electricity through renewable energies of 90, 86 and 24 Gigawatts, respectively. In contrast, Mexico’s capacity reached only 2.4 Gigawatts.
Figure 37: Loss reduction (technical and non technical)
0
5
10
15
20
25
30
Eden
or
Edes
ur
Edel
ap
Edes
a
Edes
al
San
Juan
Edea
Chile
ctra
Luz
del S
ur
After reforms Before reforms
Source: Deutsche Bank. Ministry of energy.

7 January 2014
Cement & Construction
Mexico Strategy
Deutsche Bank Securities Inc. Page 37
Top investable ideas
Joining forces with the experts
Juanito realizes that embarking on this endeavor alone is impossible as he lacks experience, know how, and most of all, financial power. He must then attract investors, a tough decision, as sharing benefits with partners is not his ideal scenario.
He has started to do a mock list of characteristics he would like his partners to have. His wish list includes people with long-standing experience, sizable financial resources, thorough understanding of the sectors and risk appetite.
Juanito’s list has allowed him to narrow down his search to a few investors. He has said that the crude oil businesses would benefit from including several investors in the US, Europe, Asia and of course, Mexico.

7 January 2014
Cement & Construction
Mexico Strategy
Page 38 Deutsche Bank Securities Inc.
The foreign players
Below we present a set of Deutsche Bank’s Buy-rated energy names that could participate in Mexico’s Energy Reform. Our top picks to play this theme are BP, Schlumberger, Weatherford, Tenaris, Kinder Morgan and Siemens.
Figure 38: Top picks listed across the world Company Ticker Price DB rating Segment Market Cap ADTV
(Local currency) (US$bn) (US$mn)
BP BP.L 472.5 Buy Integrated oils 146.6 6,704
Galp Energia GALP.LS 11.7 Buy Integrated oils 15.3 11
Chevron CVX.N 123.2 Buy Integrated oils 238.0 732
Schlumberger SLB.N 86.4 Buy Offshore/Deepwater 114.4 539
Weatherford WFT.N 14.9 Buy Onshore/Brownfield 11.5 117
Key Energy Services KEG.N 7.6 Buy Onshore/Brownfield 1.2 19
Fluor FLR.N 78.8 Buy Engineering services 12.8 104
KBR KBR.N 29.8 Buy Engineering services 4.3 56
Tenaris TS.N 43.8 Buy Equipment/Oil pipes 25.8 44
Hunting HTG.L 734.5 Buy Equipment/Oil pipes 1.1 120
Kinder Morgan KMI.N 34.7 Buy Natural gas/Power generation 36.1 206
Siemens SIE.GY 99.2 Buy Natural gas/Power generation 120.7 138 Source: Deutsche Bank
Figure 39: Comp sheet 2014 Growth Margins Profitability Leverage Valuation
Company Revenue EBITDA Net income
EBITDA Net income ROE Net Debt/Equity P/E EV/EBITDA P/BV
BP 2% -25% -38% 8.6% 5.1% 12% 18% 9.0 4.4 1.0
Kinder Morgan 17% 15% 20% 43.5% 9.3% 11% 113% 25.1 11.4 2.8
Schlumberger 12% 20% 16% 28.6% 15.6% 20% 21% 14.4 8.1 2.8
Tenaris 13% 6% 5% 24.8% 13.6% 13% 0% 15.6 7.6 1.9
Siemens 4% 10% 15% 13.4% 7.8% 18% 43% 14.7 9.4 2.7
Weatherford 13% 32% 734% 21.5% 6.7% 13% 65% 10.1 4.8 1.2 Source: Deutsche Bank
Figure 40: Comp sheet 2015 Growth Margins Profitability Leverage Valuation
Company Revenue EBITDA Net income
EBITDA Net income ROE Net Debt/Equity P/E EV/EBITDA P/BV
BP 2% 11% 11% 9.4% 5.6% 13% 17% 7.7 4.0 0.9
Kinder Morgan NA NA NA NA NA NA NA NA NA NA
Schlumberger 11% 17% 21% 30.0% 17.0% 23% 16% 11.6 6.8 2.6
Siemens 6% 12% 10% 14.1% 7.0% 20% 43% 12.9 8.3 2.4
Tenaris 10% 11% 10% 25.1% 13.6% 13% -2% 14.2 6.7 1.7
Weatherford 12% 24% 51% 23.7% 9.0% 16% 39% 6.7 3.5 1.0
Source: Deutsche Bank

7 January 2014
Cement & Construction
Mexico Strategy
Deutsche Bank Securities Inc. Page 39
British Petroleum (BP) Lucas Herrmann
44-20-754-73636
Company description
BP p.l.c. is an oil and petrochemicals company. The company explores for and produces oil and natural gas, refines, markets, and supplies petroleum products, generates solar energy, and manufactures and markets chemicals. BP's chemicals include terephthalic acid, acetic acid, acrylonitrile, ethylene and polyethylene. The company has operations in over 100 countries.
Outlook
Our Buy stance reflects our view that BP's shares are trading at a value that does little more than reflect the depressed level of profitability. As the business emerges from a traumatic period, one which has seen considerable focus on improving the safety and reliability of its operations, we expect a strong recovery in upstream profitability with real potential for material earnings upgrades, driven in particular by the recovery of very high margin US GoM production together with project start ups in the North Sea and, most especially, Angola.
Valuation
With BP's cash flows hindered by the costs of Macondo although its forward earnings no longer reflecting these costs, we value the shares using NAV, earnings and 2014E cash flow yield. With NAV standing at an estimated 690p post an assumed US$45bn of potential Macondo costs – some US$7bn higher than BP presently allows for – we target an NAV discount of c25%, slightly greater than the long-run sector average of c20%. We look for the shares to trade at a FCF yield, assuming annual disposals of cUS$2-3bn of c7-8% ex Macondo cash costs, which again implies a share price target in line with our NAV target. This drives a target P/E based on 2014 EPS of c8.2x, the equivalent of a c10% discount to our 9x 2014 sector target. To the extent that BP can demonstrate the release of value from ongoing disposals and exploration deals or that the litigation threat recedes, we do believe that there is material scope for its valuation and earnings multiple to improve over time.
Risk
Risks to our price target include general industry risks such as oil and gas price volatility, weather, equipment failure and loss of assets and life in such failures. Political risk manifests itself in the form of nationalisation and/or higher taxes. Risks to BP are mainly around the potential for US litigation given the likely extensive litigation after the Gulf of Mexico disaster.

7 January 2014
Cement & Construction
Mexico Strategy
Page 40 Deutsche Bank Securities Inc.
Chevron Paul Sankey
212-250-6137
Company description
With the recently completed merger between Chevron and Unocal, Chevron is well positioned to aggressively ramp up production and replacement rate numbers that have fallen behind its peers in recent years. E&P play Unocal provides Chevron with a strategic fit of Asian crude and natural gas reserves that vaunt it to a Super Major position in a region regarded as the growth driver of the world economy for the 21st century. Chevron is also actively engaged in several large organic development projects in Kazakhstan, Nigeria, Angola, Australia and the Gulf of Mexico, which should drive volume growth. The company is leveraged to Gulf Coast, West Coast and Asian refining and marketing.
Outlook
We believe that US crude prices (WTI) will remain structurally discounted to international prices (Brent) on a long-term basis, which is positive for Brent-levered oil companies such as Chevron. Despite a mild medium-term growth outlook (around 1% pa production growth out to 2014), Chevron's project portfolio is robust and long-term production growth should be solid. We rate Brent-levered, discounted and defensive Chevron a BUY.
Valuation
We value Chevron based on the average of our NAV and P/E analyses. We estimate NAV based on a bottom-up analysis of future cash flows and ROCE/WACC. Our P/E methodology is based on a target P/E of 11x (derived from ROCE/WACC) applied to a mid-cycle EPS estimate. The average results in our blended target price.
Risk
Downside risks include challenges in Kazakhstan, West Africa, stranded gas in Asia and deepwater Latin America causing over-spending and delays that could destroy shareholder value. Another downside risk is in the political and operational fallout from the Deepwater Horizon oil spill disaster in the Gulf of Mexico. Dislocations of Brent-WTI resulting in a lower spread could erode some of the company's relative advantage due to its leverage to Brent.
Fluor Vishal Shah
212-250-0028
Company description
Fluor is a professional services company providing engineering, procurement, construction and maintenance, as well as project management services on a global basis. Fluor serves a diverse set of industries worldwide, including oil

7 January 2014
Cement & Construction
Mexico Strategy
Deutsche Bank Securities Inc. Page 41
and gas, chemicals and petrochemicals, transportation, mining and metals, power, life sciences and manufacturing.
Outlook
We rate Fluor Corporation (FLR) as Buy. Our price target represents upside potential of ~30% from current levels. We believe risk-reward is attractive and street estimates are not accurately discounting the potential for accelerated revenue growth or margin expansion due to leverage to faster growing, higher margin energy/traditional infrastructure segments. We expect FLR to benefit from favorable geographic exposure as oil & gas and traditional infrastructure capex shifts towards North America due to the development of shale gas assets and to developing economies such as Asia and EMEA. We expect the strategic EPC agreements with Dow, Shell and BASF to result in disproportionately larger share gains during the upcoming petrochemicals and GTL capacity build-outs occurring in the 2014-2017 timeframe. We also expect FLR to benefit from the non-US refinery capacity build out. Additionally, we expect FLR to benefit from an increase in infrastructure spending in the US. We also believe consensus is not accurately factoring the potential for margin expansion and see upside risk to street margin estimates as some of the larger oil & gas projects near completion and revenue mix shifts from lower margin mining projects to higher margin downstream/petrochemical projects.
Valuation
Shares are currently trading at 15x 2013 earnings, a ~25% discount vs. the cross-cycle P/E multiple of ~20x. As FLR's new award growth and margin improvement story plays out, we expect valuation multiple to expand to ~20x, in line with the mid cycle multiple.
Risk
Risks include project delays/cancellations, end-market cyclicality and project cost overruns.
Galp Energia Mark Bloomfield
44-20-754-57905
Company description
Galp Energia operates in the Oil, Gas and energy power sectors. The Upstream division is the key driver of growth in the coming years and Galp's core portfolio comprises Angola and Brazil (the key driver of production growth), whilst it also has exploration assets in regions like East Timor, Venezuela, Portugal and Mozambique. In refining, Galp is the sole oil refiner in Portugal operating two facilities, one in Sines (220 kbbld) and the other in Matosinhos (110 kbbld). In marketing, the company is the leader in Portugal with a 37% market share and it has a growing business in Spain.
7 January 2014
Cement & Construction
Mexico Strategy
Page 42 Deutsche Bank Securities Inc.
Outlook
We continue to argue that for the investor with a 3-5 year time horizon, Galp offers the potential for unrivalled growth in barrels, cash flow and asset value. The catch is owning exposure to near-term execution risk as the capital is sunk to deliver this growth. With the shares trading at a 0.6x P/NAV, a 15% discount to the sector, scope for the perception of execution risk to modestly improve with the ramp of Lula NE, and some upside potential with the drill-bit, we are at present comfortable owning this risk. Buy.
Valuation
Our preferred approach is to use a SoTP method to allow us to capture the value associated with those identifiable growth opportunities that will not begin to deliver earnings or cash flow until the second half of the decade. To our EUR19.0/sh NAV valuation we apply a 0.8x target multiple. We support this approach with a standard corporate DCF which applies a 9.2% WACC (3.5% risk-free rate, 1.1x beta) and a 1% long-term growth rate in the post-2020 terminal period to derive a per share valuation. Our target price is based on the blended average of these two approaches.
Risk
Risks to our price target include general industry factors such as oil and gas price volatility, seasonality, the reliability/safety of operating assets, exposure to political/fiscal volatility in countries of operation and asset exposure to physical risks. Galp-specific downside risks include the scope for disappointing exploration results, the potential for significant delays or cost over-runs in the development of the BMS-11 assets offshore Brazil, exposure to volatility in refining margins, exposure to Iberian end markets and Portuguese domicile, and the overhang from Eni's residual shareholding.
Hunting Sebastian Yoshida
44-20-754-56489
Company description
Hunting PLC (HTG.L) is a global energy services provider that manufactures and distributes products that enable the extraction of oil & gas for the world's leading companies. Following a recent string of acquisitions and organic capacity growth, the group's operating footprint now exceeds 2.5 million square feet across 38 manufacturing facilities.
Outlook
Hunting's business has evolved and expanded over time – from aircraft servicing and Canadian mid-stream to shipbroking, E&P and drilling consumables. As a result, leverage to some of the most attractive secular growth themes in global oil services – the US unconventional revolution, recovery in GOM activity levels, internationalisation of shale gas and rising drilling intensity in international basins – is much enhanced. Hunting has weathered the shift from gas to liquids-rich plays better than its peers, and

7 January 2014
Cement & Construction
Mexico Strategy
Deutsche Bank Securities Inc. Page 43
with gas drilling activity looking like it's bottoming, this market should be an accretive growth driver to 2015. We also think the market underestimates the positive impact that a return to activity in the Gulf of Mexico should have on Hunting's products and overall industry pricing, which we believe will drive both margin and revenue growth beyond expectations. Hunting has outpaced the growth in its end markets by c12% on average annually since 2005, with capacity nearly tripling in just three years. Further increases in capacity, continued growth in manufacturing efficiency and the higher-value, complex product lines now dominating the portfolio are growth drivers that provide confidence in further gains ahead of expectations regardless of the macro. Buy.
Valuation
Our target price methodology for UK and European oil service stocks focuses on absolute valuation – mid-cycle PEs and discounted cash flow. Hunting's business has been reshaped significantly over the past few years to such an extent that historical trading ranges have little meaning going forward. With this in mind, we think DCF is the best way to value Hunting, sense checked with the absolute PE/PEG implied by the DCF output. Our DCF assumes a 10% WACC, based on 7% ERP, 3% RFR (in line with service peers), 1.46 beta, 29% tax rate and 3% long-term growth (reflecting the positive long-term underlying fundamentals of the industry). With >10% upside to our target price we reiterate our Buy recommendation.
Risk
Key risks relate to macroeconomic variables. We see the oil price as pro-cyclical; the historical relationship between the commodity price and drilling activity (however measured: in terms of rig count, wells drilled or total drilling & completion spend) means that Hunting's earnings outlook is explicitly related to movements in the commodity price – more so than for most European oil service companies. Additionally, Hunting's recent acquisitions bring integration risk (churn/retention of key employees) and technology risk. Hunting has expressed a desire to continue adding capacity aggressively – whether organically (in Africa and China) or inorganically, should the right acquisition present itself. Other risks include the loss of key personnel, client risk (unpaid/impaired receivables from US E&Ps faced by low gas prices), product and reputational risk (owing to a faulty product that causes a high-profile disaster), and potentially even hurricane risk (a number of Hunting's facilities are on the Gulf Coast).
KBR Vishal Shah
212-250-0028
Company description
KBR, Inc. is a global engineering, construction and services company supporting the energy, hydrocarbons, government services, minerals, civil infrastructure, power, industrial and commercial markets. The company operates in four segments: Hydrocarbons, Infrastructure, Government and Power (IGP), Services and Other.

7 January 2014
Cement & Construction
Mexico Strategy
Page 44 Deutsche Bank Securities Inc.
Outlook
We rate KBR as Buy. KBR is one of the best positioned E&C companies in our coverage to benefit from the upcoming LNG capex cycle in our view (~35% of revenues come from the LNG segment). With a historical 40-50% share of LNG projects we believe KBR will be best positioned for the upcoming US$100+ billion LNG-related capex spending cycle. Even assuming a 20% share of estimated projects, we expect ~25% earnings growth over the next few years with incremental upside opportunity if KBR is able to win more share of potential jobs. We also expect the company to benefit from strong fundamentals in the U.S chemicals industry where it has ~50% market share of the ammonia licensing market.
Valuation
Our price target is based on 13-13.5x 2014 EPS (mid cycle multiple).
Risk
Downside risks include: 1) projects moving to the right, 2) stronger–than-expected competition putting pressure on pricing 3) worse-than-expected government spending environment.
Key Energy Services Mike Urban
877-250-3113
Company description
Key Energy Services is the largest onshore, rig-based well servicing contractor based on the number of rigs owned. Key provides a complete range of well intervention services and has operations in all major onshore oil and gas producing regions of the continental United States and internationally in Mexico, Colombia, the Middle East, Russia and Argentina.
Outlook
We continue to favor leverage to a recovery in marginal oil driven activity. With roughly three-quarters of revenue coming from oil and liquids, KEG is well positioned to benefit from the continued recovery in oil driven customer spending. This significant oil exposure and the company’s growing international presence make KEG unique among small-cap and US-focused peers. As such, we rate KEG shares a BUY.
Valuation
Our target price is based on 4.8x our 2015 EBITDA estimate. Our target multiple is based on a one-year forward relative (to the S&P 500) EV/EBITDA multiple applied to the historical average relative (to the S&P 500) through-cycle EV/EBITDA multiple for KEG.

7 January 2014
Cement & Construction
Mexico Strategy
Deutsche Bank Securities Inc. Page 45
Risk
The biggest risk is deterioration in oil prices to which KEG has more leverage than other US leveraged companies. Although KEG has undertaken a number of steps to reduce debt, it does have greater leverage than others in the industry. This could limit the company's flexibility in terms of growth and/or ability to undertake acquisitions. KEG's international expansion, while a positive for growth, also increases its exposure to the political and operational risks associated with many of the countries in which it operates or hopes to operate.
Kinder Morgan Curt Launer
212-250-1143
Company description
Kinder Morgan Inc is a midstream energy company, operating natural gas and product pipelines, retail distribution, electric generation and terminal assets. Through its General Partner's Interest, it also operates Kinder Morgan Energy Partners, L.P., a Master Limited Partnership.
Outlook
The acquisition of El Paso, by its GP, Kinder Morgan Inc, provides the partnership a significant growth opportunity as well as minimization of the risk inherent in the KMP CO2 business unit. KMP's relatively high cost of capital from high distribution splits and the scale of the partnership had made organic growth more difficult in a "move the needle" manner. In our opinion, the KMI-EP deal has changed that scenario for the 2012-2015 period. We value EP's pipeline/MLP-able assets at US$18bn and expect KMI to gradually drop down most of them in the next three year or so. The acquisition also provides KMP access to the major shale gas plays where it does not have foothold, such as Marcellus and Permian basins. We note EP has US$1bn of growth projects on stream in the liquid-rich Marcellus. In organic growth, we believe shale gas projects will add to the growth for KMP in most of the fast growing shale gas plays, including Eagle Ford, Haynesville, Fayetteville and Barnett. We rate KMI Buy based on the valuation upside the EP acquisition provides, through synergy with KMP assets and the leverage its offers to the KMP drop-down growth potentials. We value EP's stand-alone pipeline business, excluding EPB, at US$18bn based on 13x 2012 EV/EBITDA. Over the next few years, we see KMP and EPB acquiring these assets through drop-down transactions, which would enhance distribution growth at the LP level and the GP offers an attractive leverage. In addition, KMI would benefit from the US$3bn NOL available at EP, which can be used fund the taxes requirements arising from E&P assets sales. Buy.
Valuation
Our valuation target price for KMI is derived from our existing valuation of the holdings of KMP and KMR plus an expectation of additional value from the soon-to-close El Paso acquisition. The announcement of EP's upstream asset
7 January 2014
Cement & Construction
Mexico Strategy
Page 46 Deutsche Bank Securities Inc.
sales, before completion of acquisition, reduces the risk associated with the deal.
Risk
The risks that are specific to KMI all derive from the risks at KMP with the exception of the potential issue related to the EP acquisition in terms of the timing of the closing. With the largest hurdle of an E&P sale done, the next issues will be Federal Trade Commission oversight and financing. We expect FTC constraints to be limited to the Rockies region and to be minor and we view financing markets as welcoming to the type of deal that KMI has put together with EP. In addition to that, the deal also has risks associated with drop-down of pipeline asset sales to its MLPs and its valuation.
Schlumberger Mike Urban
877-250-3113
Company description
Schlumberger is the world's leading supplier of technology, integrated project management and information solutions to customers working in the oil and gas industry worldwide. Employing approximately 110,000 people representing over 140 nationalities and working in approximately 80 countries, Schlumberger provides the industry's widest range of products and services from exploration through production.
Outlook
SLB remains the premier oil service franchise and should continue to leverage its market-leading position and infrastructure. SLB's technology leadership and pre-eminent share in several "emerging service" markets make it well positioned to capture long-term upside as upstream capital intensity rises on a secular basis. We therefore continue to rate SLB a Buy.
Valuation
Our price target is derived from a 16.4x P/E multiple of our 2015 EPS estimate. Our target multiple is a one-year forward relative (to the S&P 500) P/E multiple based on the historical average relative (to the S&P 500) through-cycle P/E multiple for SLB.
Risk
Given SLB's large international leverage, risks include earnings volatility associated with operations in politically unstable regions (such as Nigeria and Venezuela) and national oil companies. Renewed weakness in oil prices could negatively impact exploration spending, to which SLB has significant leverage. Execution on recent joint ventures is an additional risk.

7 January 2014
Cement & Construction
Mexico Strategy
Deutsche Bank Securities Inc. Page 47
Siemens Peter Reilly
44-20-754-59835
Company description
After major structural changes, Siemens is now focused on four sectors: Industry, Energy, Healthcare and Infrastructure & Cities. Industry makes industrial control systems and associated electric motors and gearboxes. Energy makes gas, steam and wind turbines, power transmission systems and industrial turbines and compressors. Healthcare makes imaging and diagnostic equipment and consumables. I&C is a less focussed collection of businesses active in rail, building automation and smart grids. Siemens is the global No. 1 or No. 2 across most of its markets.
Outlook
Siemens is a diversified industrial group and the outlook therefore varies by division. The Industry sector is cyclical and we think the outlook has now stabilised. Order trends at Energy have improved and we believe Energy overall has good growth prospects although Power Transmission and Renewables face structural problems. The Healthcare sector is stable and margins have been improving modestly. We remain unconvinced that the new Infrastructure & Cities sector is a logical development. Siemens has undertaken major (and successful) restructuring in recent years, which we think has made it structurally more profitable. However, the gross margin has been sliding since FY2011, and Siemens has launched a E6bn cost reduction programme ("Siemens 2014") aimed at reversing the slide. It has also suffered from a stream of charges for problems with major contracts. After a profit warning in July 2013, Siemens changed its CEO, and we are hopeful that over time it will become more profitable, less accident-prone and more focussed. We rate Siemens a Buy based on the upside implied by our target price.
Valuation
The capital goods sector has traded on 9-10x prospective EV/EBIT for the last ten years, although the multiple does deviate from this range at turning points in the economic cycle. We have used both a sum of the parts and a multiples approach to value Siemens. We have based our valuation on our assessment that Siemens will be divesting assets for the next 1-2 years. The SOP assumes about EUR 17bn of disposal proceeds. Using a multiples approach, we assume that Siemens trades at a small (5%) discount to the sector for FY2014E on an EV/EBIT basis but with 10% upside coming from portfolio change. We realise that valuing a business in expectation of portfolio change is inherently imprecise so our TP is approximate rather than precise.
Risk
Risks: 1) The sudden change in CEO creates uncertainty, both real and perceived, 2) the short-term earnings outlook is clouded by charges, 3) future portfolio changes could disappoint, and 4) there may be more negative surprises awaiting in the backlog.

7 January 2014
Cement & Construction
Mexico Strategy
Page 48 Deutsche Bank Securities Inc.
Tenaris is Tenaris Marcus Sequeira
212-250-3255
Company description
Tenaris is a leading global manufacturer and supplier of seamless steel pipe products and provider of pipe handling, stocking and distribution services to the oil and gas, energy and mechanical industries. It is also a leading regional supplier of welded steel pipes for gas pipelines in South America.
Outlook
We are positive on the oilfield service sector over the next 12 months, as accelerating decline rates and rising service intensity (especially for oil) should drive a strong activity recovery as commodity markets come back into balance. Less constructive on US natural gas, we note that production declines as well as signs of demand recovery are bringing the market back into balance but drilling intensity in the US continues to fall, which could partially offset the impact of improving gas fundamentals. Tenaris should benefit not only from improved drilling activity levels but also from a more levered playing field in the OCTG markets in US and Europe, which reflect anti-dumping measures taken against Chinese imports. Inventory levels have decreased, which should provide support for prices going forward. Buy.
Valuation
We derive our price target using DCF analysis. We use the DCF methodology (10-year horizon) because we consider it a superior indicator of value to multiples, as it relies on free cash flows generated over a longer period of time rather than the profitability of a single year. Our assumptions include 7.0% after-tax cost-of-debt and 10.6% cost-of-equity that reflects a 4.0% country risk premium based on the proportionate country risks of each of Tenaris' geographically diverse production facilities (Argentina, Mexico, Italy, Japan, Canada, Romania and the US) and 5.5% equity risk premium. As a result, we estimate Tenaris' WACC at 9.1%. We assume a 3.0% long-term growth rate as we believe that the company will apply its strong free-cash flow generation to foster growth.
Risk
Risks include: 1) accelerated competitor success, 2) softening of global demand for oil & gas on a long-term basis, 3) longer-than-expected weakness in Canada drilling and 4) volatile oil and natural gas prices as they affect stock performance.

7 January 2014
Cement & Construction
Mexico Strategy
Deutsche Bank Securities Inc. Page 49
Weatherford Mike Urban
877-250-3113
Company description
Weatherford is a Swiss-based, multi-national oilfield service company. It is one of the largest global providers of innovative mechanical solutions, technology and services for the drilling and production sectors of the oil and gas industry. Weatherford operates in over 100 countries and employs over 58,000 people worldwide.
Outlook
We continue to rate WFT a Buy. Despite recent earnings missteps, we believe WFT's investments in international infrastructure, supply chain, logistics and people will continue to result in industry-leading growth in the long term.
Valuation
Our price target is based on an 12.5x P/E multiple of our 2015 EPS estimate. Our target multiple is based on a one-year forward relative (to the S&P 500) P/E multiple applied to the historical average relative (to the S&P 500) through-cycle P/E multiple for WFT. This is a discount to WFT's long-term (since 1995) multiple to reflect 1) WFT's ambitious change from a relatively narrowly focused domestic player to a diversified global company and 2) current market concerns about execution on growth and leverage.
Risk
We continue to highlight the following risks: 1) execution and the pace of market acceptance for new technologies, 2) ability to improve efficiency of operations and capital while driving growth, 3) execution on international growth is the biggest risk to our thesis, especially as WFT continues to penetrate new markets, 4) the outcome of the pending tax accounting issues and various government investigations and 5) execution on restructuring.

7 January 2014
Cement & Construction
Mexico Strategy
Page 50 Deutsche Bank Securities Inc.
The domestic companies
Below we present a set of locally-listed names that could participate in Mexico’s Energy Reform. There are currently few pure-play energy related names listed in the Mexican Stock Exchange; thus, we also present companies that could benefit indirectly from the opening of the sector. Key names among locally listed companies include Alfa, Mexichem, Alpek, Cemex, Grupo Mexico and Lenova.
Figure 41: Key potential beneficiaries listed in Mexico Company Ticker Price DB rating Segment Market Cap ADTV
(Local currency) (US$bn) (US$mn)
Ienova IENOVA.MX 55.1 Buy Natural gas/Power generation 4.9 5.5
Cemex CX.N 11.4 Buy Cement 13 186.6
Oma OMAB.MX 45.1 Buy Airports 18.1 2.3
Alfa ALFAA.MX 37.9 No rating Conglomerate 14.5 17.8
Grupo Mexico GMEXICOB.MX 42.9 No rating Conglomerate 23.8 34.2
Grupo Carso GCARSOA1.MX 69.7 No rating Conglomerate 12.5 3.1
Alpek ALPEKA.MX 30.0 No rating Petrochemicals 4.8 3.6
Mexichem MEXCHEM.MX 56.9 No rating Petrochemicals 9.1 14.8
ICH ICHB.MX 82.5 No rating Steel 2.6 3.4 Source: Deutsche Bank
Figure 42: Comp sheet 2014 Growth Margins Profitability Leverage Valuation
Company Revenue EBITDA Net income
EBITDA Net income ROE Net Debt/Equity P/E EV/EBITDA P/BV
Alfa* 1% -2% -8% 11.8% 4.5% 12% 45% 24.8 9.7 3.3 Alpek* -7% -20% -14% 8.7% 3.8% 6% 27% 20.1 9.4 2.4 Cemex 7% 16% -151% 18.7% 1.2% 2% 119% 63.4 9.1 1.2 Grupo Mexico* -6% -9% -41% 44.9% 23.2% 24% 28% 13.0 6.7 2.6 Ienova 8% 9% 9% 39.2% 24.8% 8% 26% 25.5 17.3 1.9 Mexichem* 4% -6% -8% 18.9% 7.2% 9.4 30% 34.3 10.3 2.7 Source: Deutsche Bank; * Bloomberg PLC Consensus
Figure 43: Comp sheet 2015 Growth Margins Profitability Leverage Valuation
Company Revenue EBITDA Net income
EBITDA Net income ROE Net Debt/Equity P/E EV/EBITDA P/BV
Alfa* 6% 16% 25% 12.9% 4.8% 11% 47% 19.1 8.1 2.9 Alpek* 2% 16% 35% 9.9% 4.7% 3% 30% 16.5 7.9 2.2 Cemex 8% 15% 163% 19.9% 3.0% 5% 102% 24.1 7.5 1.1 Grupo Mexico* 9% 9% 42% 45.2% 19.0% 17% 25% 12.7 6.1 2.3 Ienova NA NA NA NA NA NA NA NA NA NA Mexichem* 10% 17% 53% 20.1% 8.8% 7% 25% 19.8 8.7 2.5 Source: Deutsche Bank; * Bloomberg PLC Consensus

7 January 2014
Cement & Construction
Mexico Strategy
Deutsche Bank Securities Inc. Page 51
Cemex Esteban Polidura
52-55-52018115
Company description
Cemex is a global building materials company that produces, distributes and sells cement, ready-mix concrete, aggregates and related building materials in more than 50 countries throughout the Americas, Europe, Africa, the Middle East and Asia. The company's vertically integrated portfolio of products –tailored to each market's needs – provides it with the opportunity to manage its assets as one integrated business rather than as distinct businesses, further improving its operational efficiency and profitability.
Outlook
Cemex should continue to deliver solid results backed by margin expansion in the US and strong performance of the South/Central America and the Caribbean division. In Mexico, we anticipate a pickup in economic activity during 2H13 and 2014, in line with normalizing government spending. Furthermore, the country's Energy Reform should translate into higher volumes for Cemex, especially from 2015 onward. Buy on attractive risk/reward.
Valuation
Our target price is based on a discounted cash flow (DCF) analysis that employs a terminal growth rate of 2% in nominal terms and a WACC of 10.2%; this assumes a risk-free rate of 3.0%, risk premium of 1.0%, beta of 2.3, and total cost of debt of 8.5%
Risk
Downside risks are slower infrastructure and housing sectors in the US, Europe and Mexico, debt repayment risk on lower-than-anticipated FCF generation and potential equity dilution on further convertible bonds issuances.
Ienova Curt Launer
212-250-1143
Company description
Infraestructura Energetica Nova SAB de CV is a Mexico-based company primarily engaged in the utilities sector. Its activities are organized into two segments: gas and electricity. In the gas segment, the company is involved in the development and operation of natural gas pipelines and liquefied petroleum gas (LPG), and storage, transportation, distribution and marketing of natural gas and LPG in a number of Mexican states, including Baja California, Sonora, Chihuahua, Durango, Tamaulipas, Nuevo Leon and Jalisco. Additionally, it owns and operates a unit for storage and regasification of liquefied natural gas (LNG) in Baja California, Mexico, which is used in the

7 January 2014
Cement & Construction
Mexico Strategy
Page 52 Deutsche Bank Securities Inc.
import of LNG. In the electricity segment, the company is active in the management and operation of a natural gas power plant, which includes two gas turbines and one steam turbine, as well as in the development of a wind energy project in Baja California, Mexico.
Outlook
Mexico’s natural gas demand is projected to grow at a 4.1% compounded annual growth rate from 2012 to 2017. The history of the company is that of the Mexican infrastructure business of SRE, begun in 1995 with the privatization of certain assets in Mexico. After the state-supported Pemex, it grew via greenfield projects, organic additions and acquisitions to be the second largest infrastructure company in Mexico; these projects and additions are expected to generate significant cash flows in the next few years. We rate IEnova a Buy.
Valuation
We use a SoTP valuation to derive our target price for IEnova. We value its existing (legacy) natural gas pipeline business based on 14x '14E EV/EBITDA, Sonora expansion pipeline based on 12x future EV/EBITDA, its LNG business segment based on 13x '14E EV/EBITDA, its distribution business based on 13x '14E EV/EBITDA, its power generation segment based on 13x '14E EV/EBITDA. For its joint venture business with PEMEX, we value the legacy portion at 14x '14E EV/EBITDA and brought forward all expansion projects at 50% of 12x~13x future EV/EBITDA.
Risk
We assess the risks in the IEnova investment to be regulatory and legislative, commodity price related and project execution oriented. From a regulatory and legislative point of view, the Mexican government has mandated a shift from oil to natural gas for power generation and has allowed the contracts for the new pipelines. We expect this to be continued and enhanced over time with additional moves to invite foreign capital to participate in the energy sector. A governmental change that reverses this trend would be negative for IEnova. In commodity pricing, current prices and trends for oil and natural gas are supportive of IEnova and its growth plans. If commodity prices rose to levels that impacted demand or fell to levels that reduced supply, growth at IEnova would slow. In the area of execution risk, IEnova’s large capital budgets are a relatively new development for the management team. In our opinion, the team and the parent SRE are capable and efficient builders and operators but the capital commitment is large and will be subject to constant review.
Oma Esteban Polidura
52-55-52018115
Company description
Oma was incorporated in 1998 and holds a 50-year concession to operate, maintain and develop 13 airports in the central and northern region of Mexico. The company charges airlines, passengers and other user fees for the use of

7 January 2014
Cement & Construction
Mexico Strategy
Deutsche Bank Securities Inc. Page 53
airport facilities. Additionally, Oma obtains rental and other income from commercial activities. In addition to airport operations, Oma intends to develop non-strategic real estate that amounts to 1,000 hectares. The most direct use for this land is in the logistics chain industry (ie, warehouses and cargo facilities), hotels, multi modal cargo facilities, strip malls and gas stations. Oma operates the Reynosa and Tampico airports, ideally located to benefit from Mexico’s Energy Reform given their proximity to the Gulf of Mexico.
Outlook
We expect Oma to deliver double-digit EBITDA CAGR in the next three years and high-teen ROE by 2016, backed by increased traffic activity industry wide, new routes to Oma's airports derived from the low-cost carriers' aggressive expansion plans and the potential development of 1,000 hectares of non-strategic real estate. In our view, robust growth and margins, one of the highest ROE and the potential value from real estate development should provide Oma with room for higher valuation. Buy on attractive risk-reward.
Valuation
Our target price is based on a DCF analysis, with 10-year forecasts, WACC 11.5% (a 3.0% risk-free rate, a 1.4% sovereign risk premium, 3% long-term inflation differential) and a 3% terminal growth rate in nominal terms. Our terminal growth rate estimate is in line with long-term GDP growth forecasts in Mexico. Our inflation differential estimate is also in line with consensus' long-term forecasts, which points toward a US-Mexico average inflation differential of about 3%.
Risk
The main downside risks to our target price are loss of value from available land for development, potential future natural disasters in the central and northern regions of the country and adverse economic conditions in the US and Mexico.
Alfa Alfa is one of the largest conglomerates in the world. It has 85 plants in 18 different countries. The company leads the Mexican market in petrochemicals such as polypropylene, expandable polystyrene (EPS) and caprolactam and is one of the world’s largest producers of polyester (PTA, PET and fibers). Alfa is also engaged in the exploration and exploitation of natural gas and hydrocarbons. It is currently developing the Eagle Ford Shale (EFS) and Edwards Trend (ET) plays in South Texas. In addition, it is the largest producer of aluminum engine components for the automotive industry in the world, and the leading maker of processed meats in North America.
Alpek Alpek is the largest petrochemical company in Mexico and the leading producer of PTA and polyester fibers in the Americas. The company operates two business groups: Polyester Chain Products (PTA, PET, and polyester fibers) and Specialty Chemicals and Plastics (Expandable Polystyrene (EPS), Polypropylene, Polyurethane, Caprolactam and other industrial chemicals).

7 January 2014
Cement & Construction
Mexico Strategy
Page 54 Deutsche Bank Securities Inc.
Grupo Carso Grupo Carso is one of the largest diversified conglomerates in LatAm. It is involved in three sectors: Retail, Industrial and Infrastructure & Construction. The last division participates in the oil and chemical industry as well as duct installation, among others. It is often involved in drilling contracts, the production of oil platforms and the installation of natural gas pipeline networks.
Grupo Mexico GMexico is one of the major copper producers in the world. It additionally incorporates the largest multimodal rail service in Mexico and a substantial Infrastructure Development Division with attractive growth prospects. The latter is involved in engineering and construction services for large scale projects at the private and public levels. It is also active in land and sea exploratory drilling, as well as the construction of oil and gas pipelines.
ICH ICH is the largest Special Bar Quality (“SBQ”) steel producer in North America and the leading structural steel producer in Mexico. ICH has a total of 24 steel production and processing units: 16 in Mexico, seven in the United States and one in Canada. The company has 2.2mn tons of steel-making capacity in the US and 2.8mn tons of EAF steel-making capacity in Mexico. Currently, ICH’s major markets are energy (oil & gas), automotive, and appliances, among others. ICH holds an 82.5% stake in Simec.
Mexichem Mexichem is a global leader in the chemical and petrochemical industry. It has 95 plants located in 41 countries. It operates in three main value chains: chlorine-Vinyl, fluorine and integral solutions. Its products are used in fields such as construction and civil infrastructure, water supply and basic sanitation, power generation, transportation, communication, and health care, among many others.

7 January 2014
Cement & Construction
Mexico Strategy
Deutsche Bank Securities Inc. Page 55
Timing the exposure
Several risks need to be assessed
Juanito’s master plan relies on his conviction that the legal backbone of his new business projects will be timely drafted, discussed and approved by all involved parties. His message on this front has been strong and reassuring. This has pushed several businessmen to anticipate major investments, a risky move as the law tends to move slowly in Mexico.
There are endless examples of practically flawless business plans that have been halted by a bureaucratic legal system. Just six years ago, another entrepreneur tried to launch a seemingly simple business in the energy sector, one where no major approvals were needed. In that case, the corresponding rules took more than two years to be drafted, discussed and enforced. Clearly Juanito’s investors are not ready to wait such a long time.
Given abnormally high expectations from his partners, especially for new ventures in sectors so far out of reach for the private sector, Juanito runs the risk of losing support if things do not work as expected. In that case, investments would rapidly find their way to back other entrepreneurs, leaving Juanito with a set of good ideas but no capital to execute them.
Furthermore, the inability to deliver as promised would bring back perception to the unimpressive status he dragged for years. This could prove to be costly given that support for his future endeavours would most likely be limited or non-existent.
And as usual, there is no free lunch. Juanito will control to a certain degree his partners' profit potential. Furthermore, he will be able to set arbitrary rules anytime. Finally, the long-term relationship will expose investors to risks tied to Juanito’s mood changes, a condition that seems to spike every six years.

7 January 2014
Cement & Construction
Mexico Strategy
Page 56 Deutsche Bank Securities Inc.
GEMS might remain out of favor
According to Deutsche Bank’s Global Strategy team, the crux of EM underperformance has been a falling growth spread over DM, from a peak of 7% in 2009 down to 3%, almost back in the modest 0-2% range of 1975-2001. Four factors drove the unusual growth outperformance cycle: bounce from late 1990s crises; dollar down cycle drove capital inflows and a credit boom; rising oil and commodity prices benefitted EM exporters; interactions of these factors meant appreciating exchange rates kept inflation in check and rates low, supporting growth. Each of these factors has gone into reverse. A reversion of the spread to the historical range, our team’s baseline, could see EM de-rate further.
Our GEM Equity Strategy team would tentatively forecast a negative return of around 10% for MSCI EMF in 2014, but with a greater degree of volatility and dispersion between constituents. The relative call is harder following massive underperformance in 2014, which has left DM valuations expensive, but economic and governance drivers indicate further potential underperformance from GEM of around 10%.
It is even possible that emerging equities will begin the year strongly as fears concerning the impact of tapering recede. Nevertheless we believe that the year will be defined by increasingly negative sentiment towards the ability of the authorities in Beijing to manage a soft landing for the Chinese economy. There will eventually be beneficiaries within GEM from lower commodity prices but the initial impact will be to raise risk premiums and redemptions across GEM.
Our GEM Equity Strategy team has been overweight in Mexico for almost three years for the same couple of reasons we believe investor’s portfolios have also shown a preference towards the country: first, the dearth of regional or GEM alternatives (especially Brazil) and second, Mexico’s relatively coherent agenda towards structural reforms (practically all of them approved in 2013).
Our team agrees with our view that some reforms, especially the Fiscal and Telecom, might have a negative impact on the listed corporate sector before the benefits of the Energy Reform come through in terms of stronger growth rates. Furthermore, the changes to both the tax system and competition regulations are occurring against a backdrop of deteriorating free cash flow, which if it continues could undermine one of the most attractive features of the Mexican market in the current financial environment.

7 January 2014
Cement & Construction
Mexico Strategy
Deutsche Bank Securities Inc. Page 57
Mexico’s market multiples seem high from several angles
The IPC currently trades at a 12-month trailing P/E of 20x and at a 2014 P/E of 18x; this is about 30% above 10-year average multiples and 80% above the MSCI Emerging Market’s index. In our view, the market’s long-standing favorable stance toward President Peña Nieto’s Energy Reform has been a major driver behind Mexico’s premium valuation.
Figure 44: Mexico’s IPC Index trailing P/E Figure 45: P/E MSCI MX vs P/E Emerging Markets
5
10
15
20
25
Jan-
03
Jan-
04
Jan-
05
Jan-
06
Jan-
07
Jan-
08
Jan-
09
Jan-
10
Jan-
11
Jan-
12
Jan-
13
Jan-
14
IPC Index Average +1 St. Dev. -1 St. Dev.
0.5
0.7
0.9
1.1
1.3
1.5
1.7
1.9
2.1
2.3
Jan-
03
Jan-
04
Jan-
05
Jan-
06
Jan-
07
Jan-
08
Jan-
09
Jan-
10
Jan-
11
Jan-
12
Jan-
13
Jan-
14
MSCI MX vs MSCI EM Average +1 St. Dev. -1 St. Dev.
Source: Deutsche Bank; Bloomberg Finance LP Source: Deutsche Bank; Bloomberg Finance LP
Figure 46: Sectors’ 2014 P/E Figure 47: Sectors’ 2014 P/BV
0
5
10
15
20
25
Met
als
& M
inin
g
Cem
ent &
Con
stru
ctio
n
Tran
spor
tatio
n
Tech
nolo
gy, M
edia
&
Tele
com
Fina
ncia
ls/B
anks
Real
Est
ate
Cong
lom
erat
es
Food
& B
ever
ages
Reta
iling
Oil,
Gas
&
Petr
oche
mic
als
00.5
11.5
22.5
33.5
4
Tran
spor
tatio
n
Fina
ncia
ls/B
anks
Real
Est
ate
Met
als
& M
inin
g
Cem
ent &
Con
stru
ctio
n
Oil,
Gas
&
Petr
oche
mic
als
Food
& B
ever
ages
Cong
lom
erat
es
Tech
nolo
gy, M
edia
&
Tele
com Re
taili
ng
Source: Deutsche Bank; Bloomberg Finance LP Source: Deutsche Bank; Bloomberg Finance LP
The elimination of the fiscal consolidation regime should have negative implications for the market’s EPS and cash flow; thus, we would not rule out profit-taking in the medium term and multiples getting closer to long-term average levels.
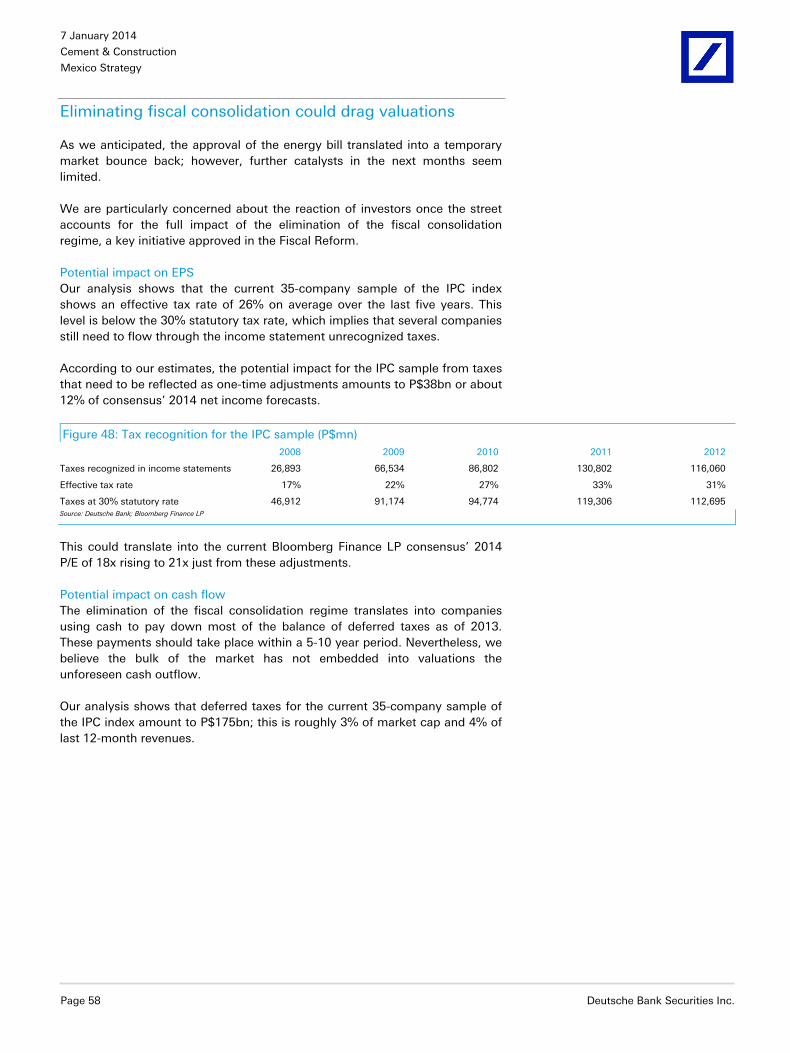
7 January 2014
Cement & Construction
Mexico Strategy
Page 58 Deutsche Bank Securities Inc.
Eliminating fiscal consolidation could drag valuations
As we anticipated, the approval of the energy bill translated into a temporary market bounce back; however, further catalysts in the next months seem limited.
We are particularly concerned about the reaction of investors once the street accounts for the full impact of the elimination of the fiscal consolidation regime, a key initiative approved in the Fiscal Reform.
Potential impact on EPS Our analysis shows that the current 35-company sample of the IPC index shows an effective tax rate of 26% on average over the last five years. This level is below the 30% statutory tax rate, which implies that several companies still need to flow through the income statement unrecognized taxes.
According to our estimates, the potential impact for the IPC sample from taxes that need to be reflected as one-time adjustments amounts to P$38bn or about 12% of consensus’ 2014 net income forecasts.
Figure 48: Tax recognition for the IPC sample (P$mn) 2008 2009 2010 2011 2012
Taxes recognized in income statements 26,893 66,534 86,802 130,802 116,060
Effective tax rate 17% 22% 27% 33% 31%
Taxes at 30% statutory rate 46,912 91,174 94,774 119,306 112,695 Source: Deutsche Bank; Bloomberg Finance LP
This could translate into the current Bloomberg Finance LP consensus’ 2014 P/E of 18x rising to 21x just from these adjustments.
Potential impact on cash flow The elimination of the fiscal consolidation regime translates into companies using cash to pay down most of the balance of deferred taxes as of 2013. These payments should take place within a 5-10 year period. Nevertheless, we believe the bulk of the market has not embedded into valuations the unforeseen cash outflow.
Our analysis shows that deferred taxes for the current 35-company sample of the IPC index amount to P$175bn; this is roughly 3% of market cap and 4% of last 12-month revenues.

7 January 2014
Cement & Construction
Mexico Strategy
Deutsche Bank Securities Inc. Page 59
Further catalysts could take a while to materialize
According to El Economista, secondary laws need to be formulated in a timeframe that does not exceed 120 days after the approval of the Energy Reform. If no extraordinary legislative period is enforced, these secondary laws would be discussed in September 2014. This means that the first exploration and production contracts with the private sector could be signed in 2015.
Emilio Lozoya, Pemex’s CEO, has a more upbeat outlook as he expects the first barrel of oil to come from a partnership with a private company to be out of the ground as soon as late 2014.
Rating agencies have already accounted for a more robust scenario for Mexico. Late December 2013 Standard & Poor's raised Mexico's credit rating to BBB+ from BBB on expectations that the Energy Reform will increase the country's growth over time. As a result, S&P rating is now in-line with the ratings of Moody's Investors Service and Fitch Ratings. S&P had lowered Mexico's rating one notch during the 2009 recession.
According to S&P, the passage of a landmark energy reform, supported by some changes in the fiscal framework, bolsters Mexico's growth prospects and fiscal flexibility in the medium term. The agency expects economic growth to accelerate to 3% in 2014 from an estimated 1.2% in 2013, increasing further to 3.5% in 2015..

7 January 2014
Cement & Construction
Mexico Strategy
Page 60 Deutsche Bank Securities Inc.
The day after mañana
Gain not without the pain
Several years have gone by. The road was clearly more challenging than what Juanito imagined when he embarked on his new life project. Unforeseen problems, legal challenges, the occasional lack of consensus with partners, and materially higher financial needs than originally expected made things difficult.
Juanito now realizes that the high expectations he managed to raise at the beginning of this process only put him in a vulnerable situation in front of investors, which pressured for results from a very early stage. This generated a short-term loss of confidence and therefore, some money moving out and into peers' projects. But his gradual progress overshadowed at the end any doubts that could have existed.
Despite the headwinds, Juanito is today one of the most successful businessmen in the world. Not every business succeeded but those that did are today leading enterprises on international standards. His business partners are happy and prosperous; they continue to back Juanito in his new ventures.
It is fair to say that Juanito’s bright mañana really materialized this time.

7 January 2014
Cement & Construction
Mexico Strategy
Deutsche Bank Securities Inc. Page 61
Energy Reform Week
Join us to discover opportunities across Mexico
Please join us on March 24-27, 2014 for four consecutive days of ongoing corporate access to Mexico’s main energy companies. Our Mexico Energy Reform Week will offer site visits, management meetings, direct contact with regulators and in-depth economic and political updates.
Figure 49: SAVE THE DATE
Source: Deutsche Bank

7 January 2014
Cement & Construction
Mexico Strategy
Page 62 Deutsche Bank Securities Inc.
Appendix 1
Important Disclosures Additional information available upon request Disclosure checklist
Company Ticker Recent price* Disclosure
Cemex CX.N 11.53 (USD) 3 Jan 14 14,17
ICA ICA.MX 26.74 (MXN) 3 Jan 14 14,17
Asur ASURB.MX 154.00 (MXN) 3 Jan 14 NA
Gap GAPB.MX 66.08 (MXN) 3 Jan 14 NA
Oma OMAB.MX 43.74 (MXN) 3 Jan 14 2 *Prices are sourced from local exchanges via Reuters, Bloomberg and other vendors. Data is sourced from Deutsche Bank and subject companies
Important Disclosures Required by U.S. Regulators
Disclosures marked with an asterisk may also be required by at least one jurisdiction in addition to the United States. See Important Disclosures Required by Non-US Regulators and Explanatory Notes.
2. Deutsche Bank and/or its affiliate(s) makes a market in securities issued by this company.
14. Deutsche Bank and/or its affiliate(s) has received non-investment banking related compensation from this company within the past year.
Important Disclosures Required by Non-U.S. Regulators
Please also refer to disclosures in the Important Disclosures Required by US Regulators and the Explanatory Notes.
2. Deutsche Bank and/or its affiliate(s) makes a market in securities issued by this company.
17. Deutsche Bank and or/its affiliate(s) has a significant Non-Equity financial interest (this can include Bonds, Convertible Bonds, Credit Derivatives and Traded Loans) where the aggregate net exposure to the following issuer(s), or issuer(s) group, is more than 25m Euros.
For disclosures pertaining to recommendations or estimates made on securities other than the primary subject of this research, please see the most recently published company report or visit our global disclosure look-up page on our website at http://gm.db.com/ger/disclosure/DisclosureDirectory.eqsr Analyst Certification
The views expressed in this report accurately reflect the personal views of the undersigned lead analyst about the subject issuers and the securities of those issuers. In addition, the undersigned lead analyst has not and will not receive any compensation for providing a specific recommendation or view in this report. Esteban Polidura

7 January 2014
Cement & Construction
Mexico Strategy
Deutsche Bank Securities Inc. Page 63
Historical recommendations and target price: Cemex (CX.N) (as of 1/3/2014)
12
3
4
5
0.00
2.00
4.00
6.00
8.00
10.00
12.00
14.00
Jan 12 Apr 12 Jul 12 Oct 12 Jan 13 Apr 13 Jul 13 Oct 13
Sec
uri
ty P
rice
Date
Previous Recommendations
Strong Buy Buy Market Perform Underperform Not Rated Suspended Rating
Current Recommendations
Buy Hold Sell Not Rated Suspended Rating
*New Recommendation Structure as of September 9,2002
1. 31/01/2012: Hold, Target Price Change USD7.00 4. 18/04/2013: Buy, Target Price Change USD13.50
2. 02/02/2012: Upgrade to Buy, Target Price Change USD10.00 5. 10/10/2013: Buy, Target Price Change USD13.00
3. 15/01/2013: Buy, Target Price Change USD11.80
Historical recommendations and target price: ICA (ICA.MX) (as of 1/3/2014)
1 2
3
4
5
0.00
5.00
10.00
15.00
20.00
25.00
30.00
35.00
40.00
45.00
Jan 12 Apr 12 Jul 12 Oct 12 Jan 13 Apr 13 Jul 13 Oct 13
Sec
uri
ty P
rice
Date
Previous Recommendations
Strong Buy Buy Market Perform Underperform Not Rated Suspended Rating
Current Recommendations
Buy Hold Sell Not Rated Suspended Rating
*New Recommendation Structure as of September 9,2002
1. 22/02/2012: Buy, Target Price Change MXN29.00 4. 22/05/2013: Downgrade to Hold, Target Price Change MXN31.00
2. 17/07/2012: Downgrade to Hold, MXN29.00 5. 27/10/2013: Hold, Target Price Change MXN29.00
3. 21/01/2013: Upgrade to Buy, Target Price Change MXN43.00

7 January 2014
Cement & Construction
Mexico Strategy
Page 64 Deutsche Bank Securities Inc.
Historical recommendations and target price: Asur (ASURB.MX) (as of 1/6/2014)
1 2
0.00
20.00
40.00
60.00
80.00
100.00
120.00
140.00
160.00
180.00
200.00
Jan 12 Apr 12 Jul 12 Oct 12 Jan 13 Apr 13 Jul 13 Oct 13
Sec
uri
ty P
rice
Date
Previous Recommendations
Strong Buy Buy Market Perform Underperform Not Rated Suspended Rating
Current Recommendations
Buy Hold Sell Not Rated Suspended Rating
*New Recommendation Structure as of September 9,2002
1. 07/11/2013: Upgrade to Hold, Target Price Change MXN180.00 2. 06/01/2014: Hold, Target Price Change MXN170.00
Historical recommendations and target price: Gap (GAPB.MX) (as of 1/3/2014)
1
0.00
10.00
20.00
30.00
40.00
50.00
60.00
70.00
80.00
90.00
Jan 12 Apr 12 Jul 12 Oct 12 Jan 13 Apr 13 Jul 13 Oct 13
Sec
uri
ty P
rice
Date
Previous Recommendations
Strong Buy Buy Market Perform Underperform Not Rated Suspended Rating
Current Recommendations
Buy Hold Sell Not Rated Suspended Rating
*New Recommendation Structure as of September 9,2002
1. 07/11/2013: Upgrade to Hold, Target Price Change MXN77.00
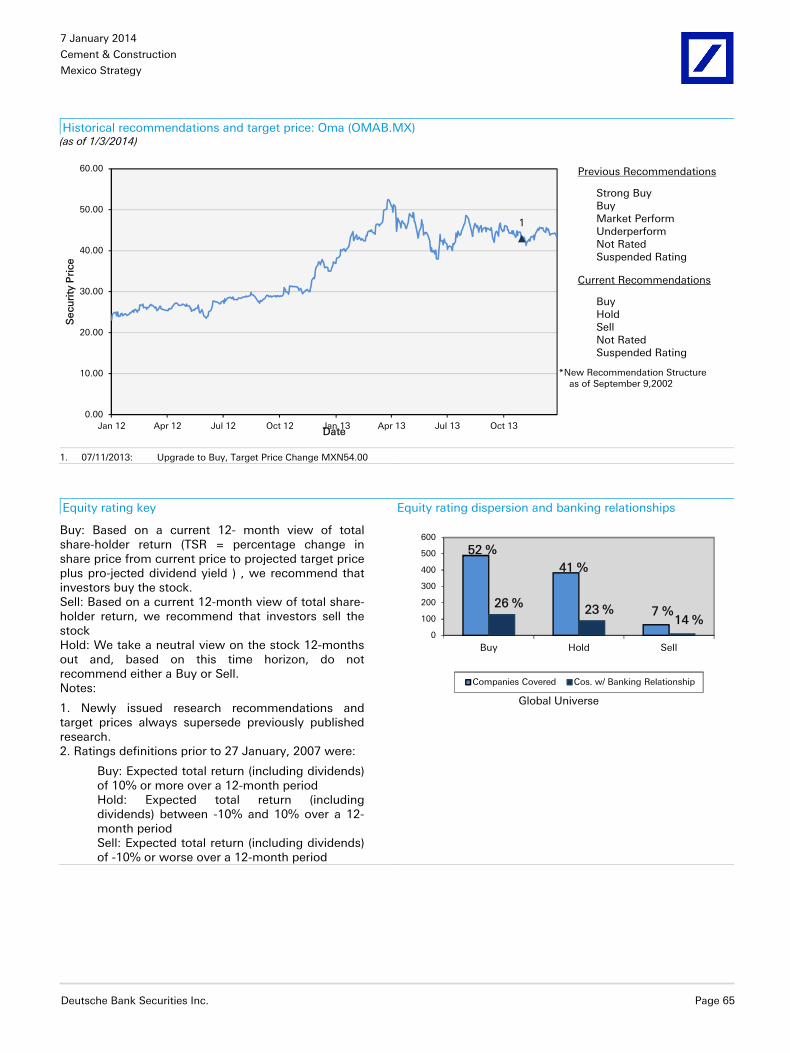
7 January 2014
Cement & Construction
Mexico Strategy
Deutsche Bank Securities Inc. Page 65
Historical recommendations and target price: Oma (OMAB.MX) (as of 1/3/2014)
1
0.00
10.00
20.00
30.00
40.00
50.00
60.00
Jan 12 Apr 12 Jul 12 Oct 12 Jan 13 Apr 13 Jul 13 Oct 13
Sec
uri
ty P
rice
Date
Previous Recommendations
Strong Buy Buy Market Perform Underperform Not Rated Suspended Rating
Current Recommendations
Buy Hold Sell Not Rated Suspended Rating
*New Recommendation Structure as of September 9,2002
1. 07/11/2013: Upgrade to Buy, Target Price Change MXN54.00
Equity rating key Equity rating dispersion and banking relationships
Buy: Based on a current 12- month view of total share-holder return (TSR = percentage change in share price from current price to projected target price plus pro-jected dividend yield ) , we recommend that investors buy the stock. Sell: Based on a current 12-month view of total share-holder return, we recommend that investors sell the stock Hold: We take a neutral view on the stock 12-months out and, based on this time horizon, do not recommend either a Buy or Sell. Notes:
1. Newly issued research recommendations and target prices always supersede previously published research. 2. Ratings definitions prior to 27 January, 2007 were:
Buy: Expected total return (including dividends) of 10% or more over a 12-month period Hold: Expected total return (including dividends) between -10% and 10% over a 12-month period Sell: Expected total return (including dividends) of -10% or worse over a 12-month period
52 %
41 %
7 %26 % 23 %
14 %0
100
200
300
400
500
600
Buy Hold Sell
Global Universe
Companies Covered Cos. w/ Banking Relationship

7 January 2014
Cement & Construction
Mexico Strategy
Page 66 Deutsche Bank Securities Inc.
Regulatory Disclosures
1. Important Additional Conflict Disclosures
Aside from within this report, important conflict disclosures can also be found at https://gm.db.com/equities under the "Disclosures Lookup" and "Legal" tabs. Investors are strongly encouraged to review this information before investing.
2. Short-Term Trade Ideas
Deutsche Bank equity research analysts sometimes have shorter-term trade ideas (known as SOLAR ideas) that are consistent or inconsistent with Deutsche Bank's existing longer term ratings. These trade ideas can be found at the SOLAR link at http://gm.db.com.
3. Country-Specific Disclosures
Australia and New Zealand: This research, and any access to it, is intended only for "wholesale clients" within the meaning of the Australian Corporations Act and New Zealand Financial Advisors Act respectively. Brazil: The views expressed above accurately reflect personal views of the authors about the subject company(ies) and its(their) securities, including in relation to Deutsche Bank. The compensation of the equity research analyst(s) is indirectly affected by revenues deriving from the business and financial transactions of Deutsche Bank. In cases where at least one Brazil based analyst (identified by a phone number starting with +55 country code) has taken part in the preparation of this research report, the Brazil based analyst whose name appears first assumes primary responsibility for its content from a Brazilian regulatory perspective and for its compliance with CVM Instruction # 483. EU countries: Disclosures relating to our obligations under MiFiD can be found at http://www.globalmarkets.db.com/riskdisclosures. Japan: Disclosures under the Financial Instruments and Exchange Law: Company name - Deutsche Securities Inc. Registration number - Registered as a financial instruments dealer by the Head of the Kanto Local Finance Bureau (Kinsho) No. 117. Member of associations: JSDA, Type II Financial Instruments Firms Association, The Financial Futures Association of Japan, Japan Investment Advisers Association. Commissions and risks involved in stock transactions - for stock transactions, we charge stock commissions and consumption tax by multiplying the transaction amount by the commission rate agreed with each customer. Stock transactions can lead to losses as a result of share price fluctuations and other factors. Transactions in foreign stocks can lead to additional losses stemming from foreign exchange fluctuations. "Moody's", "Standard & Poor's", and "Fitch" mentioned in this report are not registered credit rating agencies in Japan unless “Japan” or "Nippon" is specifically designated in the name of the entity. Reports on Japanese listed companies not written by analysts of Deutsche Securities Inc. (DSI) are written by Deutsche Bank Group's analysts with the coverage companies specified by DSI. Russia: This information, interpretation and opinions submitted herein are not in the context of, and do not constitute, any appraisal or evaluation activity requiring a license in the Russian Federation.

David Folkerts-Landau
Group Chief Economist Member of the Group Executive Committee
Guy Ashton
Global Chief Operating Officer Research
Marcel Cassard Global Head
FICC Research & Global Macro Economics
Richard Smith and Steve Pollard Co-Global Heads Equity Research
Michael Spencer Regional Head
Asia Pacific Research
Ralf Hoffmann Regional Head
Deutsche Bank Research, Germany
Andreas Neubauer Regional Head
Equity Research, Germany
Steve Pollard Regional Head
Americas Research
International locations
Deutsche Bank AG Deutsche Bank Place Level 16 Corner of Hunter & Phillip Streets Sydney, NSW 2000 Australia Tel: (61) 2 8258 1234
Deutsche Bank AG Große Gallusstraße 10-14 60272 Frankfurt am Main Germany Tel: (49) 69 910 00
Deutsche Bank AG Filiale Hongkong International Commerce Centre, 1 Austin Road West,Kowloon, Hong Kong Tel: (852) 2203 8888
Deutsche Securities Inc. 2-11-1 Nagatacho Sanno Park Tower Chiyoda-ku, Tokyo 100-6171 Japan Tel: (81) 3 5156 6770
Deutsche Bank AG London 1 Great Winchester Street London EC2N 2EQ United Kingdom Tel: (44) 20 7545 8000
Deutsche Bank Securities Inc. 60 Wall Street New York, NY 10005 United States of America Tel: (1) 212 250 2500
Global Disclaimer The information and opinions in this report were prepared by Deutsche Bank AG or one of its affiliates (collectively "Deutsche Bank"). The information herein is believed to be reliable and has been obtained from public sources believed to be reliable. Deutsche Bank makes no representation as to the accuracy or completeness of such information.
Deutsche Bank may engage in securities transactions, on a proprietary basis or otherwise, in a manner inconsistent with the view taken in this research report. In addition, others within Deutsche Bank, including strategists and sales staff, may take a view that is inconsistent with that taken in this research report.
Opinions, estimates and projections in this report constitute the current judgement of the author as of the date of this report. They do not necessarily reflect the opinions of Deutsche Bank and are subject to change without notice. Deutsche Bank has no obligation to update, modify or amend this report or to otherwise notify a recipient thereof in the event that any opinion, forecast or estimate set forth herein, changes or subsequently becomes inaccurate. Prices and availability of financial instruments are subject to change without notice. This report is provided for informational purposes only. It is not an offer or a solicitation of an offer to buy or sell any financial instruments or to participate in any particular trading strategy. Target prices are inherently imprecise and a product of the analyst judgement.
As a result of Deutsche Bank’s March 2010 acquisition of BHF-Bank AG, a security may be covered by more than one analyst within the Deutsche Bank group. Each of these analysts may use differing methodologies to value the security; as a result, the recommendations may differ and the price targets and estimates of each may vary widely.
In August 2009, Deutsche Bank instituted a new policy whereby analysts may choose not to set or maintain a target price of certain issuers under coverage with a Hold rating. In particular, this will typically occur for "Hold" rated stocks having a market cap smaller than most other companies in its sector or region. We believe that such policy will allow us to make best use of our resources. Please visit our website at http://gm.db.com to determine the target price of any stock.
The financial instruments discussed in this report may not be suitable for all investors and investors must make their own informed investment decisions. Stock transactions can lead to losses as a result of price fluctuations and other factors. If a financial instrument is denominated in a currency other than an investor's currency, a change in exchange rates may adversely affect the investment. Past performance is not necessarily indicative of future results. Deutsche Bank may with respect to securities covered by this report, sell to or buy from customers on a principal basis, and consider this report in deciding to trade on a proprietary basis.
Unless governing law provides otherwise, all transactions should be executed through the Deutsche Bank entity in the investor's home jurisdiction. In the U.S. this report is approved and/or distributed by Deutsche Bank Securities Inc., a member of the NYSE, the NASD, NFA and SIPC. In Germany this report is approved and/or communicated by Deutsche Bank AG Frankfurt authorized by the BaFin. In the United Kingdom this report is approved and/or communicated by Deutsche Bank AG London, a member of the London Stock Exchange and regulated by the Financial Conduct Authority for the conduct of investment business in the UK and authorized by the BaFin. This report is distributed in Hong Kong by Deutsche Bank AG, Hong Kong Branch, in Korea by Deutsche Securities Korea Co. This report is distributed in Singapore by Deutsche Bank AG, Singapore Branch or Deutsche Securities Asia Limited, Singapore Branch (One Raffles Quay #18-00 South Tower Singapore 048583, +65 6423 8001), and recipients in Singapore of this report are to contact Deutsche Bank AG, Singapore Branch or Deutsche Securities Asia Limited, Singapore Branch in respect of any matters arising from, or in connection with, this report. Where this report is issued or promulgated in Singapore to a person who is not an accredited investor, expert investor or institutional investor (as defined in the applicable Singapore laws and regulations), Deutsche Bank AG, Singapore Branch or Deutsche Securities Asia Limited, Singapore Branch accepts legal responsibility to such person for the contents of this report. In Japan this report is approved and/or distributed by Deutsche Securities Inc. The information contained in this report does not constitute the provision of investment advice. In Australia, retail clients should obtain a copy of a Product Disclosure Statement (PDS) relating to any financial product referred to in this report and consider the PDS before making any decision about whether to acquire the product. Deutsche Bank AG Johannesburg is incorporated in the Federal Republic of Germany (Branch Register Number in South Africa: 1998/003298/10). Additional information relative to securities, other financial products or issuers discussed in this report is available upon request. This report may not be reproduced, distributed or published by any person for any purpose without Deutsche Bank's prior written consent. Please cite source when quoting.
Copyright © 2014 Deutsche Bank AG