DataToon: Drawing Data Comics About Dynamic Networks with ... · comics often illustrate the...
12
DataToon: Drawing Data Comics About Dynamic Networks with Pen + Touch Interaction Nam Wook Kim 1,2 Nathalie Henry Riche 2 Benjamin Bach 3 Guanpeng Xu 4 Matthew Brehmer 2 Ken Hinckley 2 Michel Pahud 2 Haijun Xia 5 Michael J. McGuffin 6 Hanspeter Pfister 1 1 Harvard University 2 Microsoft Research 3 University of Edinburgh 4 Philips Academy 5 University of Toronto 6 École de technologie supérieure {namwkim, pfister}@g.harvard.edu {nath, mabrehme, kenh, mpahud}@microsoft.com [email protected] [email protected] haijunxiadgp.toronto.edu michael.mcguffi[email protected] Figure 1: DataToon is a pen & touch environment for producing data comics. A storyteller can rapidly isolate aspects of their data via filtering and pattern detection, as well as assemble a rich narrative via annotation and automatic panel transitions. ABSTRACT Comics are an entertaining and familiar medium for pre- senting compelling stories about data. However, existing visualization authoring tools do not leverage this expressive medium. In this paper, we seek to incorporate elements of comics into the construction of data-driven stories about dynamic networks. We contribute DataToon, a flexible data comic storyboarding tool that blends analysis and presenta- tion with pen and touch interactions. A storyteller can use Permission to make digital or hard copies of all or part of this work for personal or classroom use is granted without fee provided that copies are not made or distributed for profit or commercial advantage and that copies bear this notice and the full citation on the first page. Copyrights for components of this work owned by others than the author(s) must be honored. Abstracting with credit is permitted. To copy otherwise, or republish, to post on servers or to redistribute to lists, requires prior specific permission and/or a fee. Request permissions from [email protected]. CHI 2019, May 4–9, 2019, Glasgow, Scotland UK © 2019 Copyright held by the owner/author(s). Publication rights licensed to ACM. ACM ISBN 978-1-4503-5970-2/19/05. . . $15.00 https://doi.org/10.1145/3290605.3300335 DataToon to rapidly generate visualization panels, annotate them, and position them within a canvas to produce a visual narrative. In a user study, participants quickly learned to use DataToon for producing data comics. CCS CONCEPTS • Human-centered computing → Visualization systems and tools. KEYWORDS Data comics, pen + touch interfaces, direct manipulation, storytelling, dynamic networks, data visualization. ACM Reference Format: Nam Wook Kim, Nathalie Henry Riche, Benjamin Bach, Guanpeng Xu, Mathew Brehmer, Ken Hinckley, Michel Pahud, Haijun Xia, Michael J. McGuffin, and Hanspeter Pfister. 2019. DataToon: Draw- ing Data Comics About Dynamic Networks with Pen + Touch Interaction. In CHI Conference on Human Factors in Computing Systems Proceedings (CHI 2019), May 4–9, 2019, Glasgow, Scotland UK. ACM, New York, NY, USA, 12 pages. https://doi.org/10.1145/ 3290605.3300335
Transcript of DataToon: Drawing Data Comics About Dynamic Networks with ... · comics often illustrate the...

DataToon: Drawing Data Comics About DynamicNetworks with Pen + Touch Interaction
NamWook Kim1,2 Nathalie Henry Riche2 Benjamin Bach3 Guanpeng Xu4 Matthew Brehmer2Ken Hinckley2 Michel Pahud2 Haijun Xia5 Michael J. McGuffin6 Hanspeter Pfister1
1 Harvard University 2 Microsoft Research3 University of Edinburgh 4 Philips Academy 5 University of Toronto 6 École de technologie supérieure
{namwkim, pfister}@g.harvard.edu {nath, mabrehme, kenh, mpahud}@[email protected] [email protected] haijunxiadgp.toronto.edu [email protected]
Figure 1: DataToon is a pen & touch environment for producing data comics. A storyteller can rapidly isolate aspects of theirdata via filtering and pattern detection, as well as assemble a rich narrative via annotation and automatic panel transitions.
ABSTRACTComics are an entertaining and familiar medium for pre-senting compelling stories about data. However, existingvisualization authoring tools do not leverage this expressivemedium. In this paper, we seek to incorporate elements ofcomics into the construction of data-driven stories aboutdynamic networks. We contribute DataToon, a flexible datacomic storyboarding tool that blends analysis and presenta-tion with pen and touch interactions. A storyteller can use
Permission to make digital or hard copies of all or part of this work forpersonal or classroom use is granted without fee provided that copiesare not made or distributed for profit or commercial advantage and thatcopies bear this notice and the full citation on the first page. Copyrightsfor components of this work owned by others than the author(s) mustbe honored. Abstracting with credit is permitted. To copy otherwise, orrepublish, to post on servers or to redistribute to lists, requires prior specificpermission and/or a fee. Request permissions from [email protected] 2019, May 4–9, 2019, Glasgow, Scotland UK© 2019 Copyright held by the owner/author(s). Publication rights licensedto ACM.ACM ISBN 978-1-4503-5970-2/19/05. . . $15.00https://doi.org/10.1145/3290605.3300335
DataToon to rapidly generate visualization panels, annotatethem, and position them within a canvas to produce a visualnarrative. In a user study, participants quickly learned to useDataToon for producing data comics.
CCS CONCEPTS• Human-centered computing → Visualization systemsand tools.
KEYWORDSData comics, pen + touch interfaces, direct manipulation,storytelling, dynamic networks, data visualization.
ACM Reference Format:Nam Wook Kim, Nathalie Henry Riche, Benjamin Bach, GuanpengXu, Mathew Brehmer, Ken Hinckley, Michel Pahud, Haijun Xia,Michael J. McGuffin, and Hanspeter Pfister. 2019. DataToon: Draw-ing Data Comics About Dynamic Networks with Pen + TouchInteraction. In CHI Conference on Human Factors in ComputingSystems Proceedings (CHI 2019), May 4–9, 2019, Glasgow, ScotlandUK. ACM, New York, NY, USA, 12 pages. https://doi.org/10.1145/3290605.3300335

1 INTRODUCTIONVisualization is a pivotal component in data-driven story-telling, providing an audience with the means to understandpatterns in data without requiring advanced statistical lit-eracy [40]. One genre of data-driven storytelling [43] is thedata comic [4], in which a narrative grounded in data is con-veyed by leveraging the well-established visual language ofcomics [30]. Data comics integrate captions and annotationswith visualization, suppressing the complexity of data byincrementally revealing aspects of the data across multiplepanels, arranged thoughtfully on one or more pages [6, 47].A recently curated collection of manually-created data
comics [7] demonstrates the richness of this genre and its ap-plicability to telling stories about datasets of different natures.From a storytelling standpoint, one of the most challengingforms of data is a dynamic network. Dynamic networks ap-pear in many contexts, from analyzing social networks tomodeling neural connections in the brain. In addition toevolving in time, such networks may contain multiple typesof nodes and links exhibiting different connectivity patterns.Due to this complexity, it is notoriously difficult to communi-cate insights about dynamic networks to a general audiencewith a single large visual representation. Since conventionalcomics often illustrate the dynamic nature of characters andthe interactions that occur between them over time by iden-tifying and sequencing salient moments, dynamic networksare ideally suited for a comic treatment [3].However, producing a data comic is a difficult and labo-
rious process, one that involves switching between visual-ization and graphic design tools [9], the former being idealfor generating accurate data representations, and the latterbeing ideal for stylizing visual elements and arrange panelsin space. While several recent tools support the construc-tion of visual data stories [25, 37, 42, 51], they do not takeadvantage of the comic form as a storytelling medium. Thusauthors have to resort to illustration and design tools suchas Adobe Illustrator and Photoshop.
We contribute DataToon as a storytelling tool for produc-ing data comics with a focus on dynamic networks. DataToonoffers fluid storyboarding by blending analysis and presenta-tion in a unified environment supported by pen and touchinteractions. A storyteller can use DataToon to rapidly ex-plore their data and generate visualization panels via interac-tive filtering and from recommendations of interesting datapatterns, resulting in a visual story with custom annotations,automatic panel transitions, and layout templates.
The direct manipulation of panels and their data contentsfurther facilitates the storytelling process. Natural touch in-teraction supports the iteration of story ideas by experiment-ing with different ways to compose panels and lay them outon a page. The use of a digital pen also allows storytellers
to annotate panels with drawings and handwriting, or todraw custom glyphs for data entities. DataToon leveragesthe underlying data to eliminate the tedious duplication ofactions necessary in conventional illustration software, suchas propagating visual designs to other panels.
To demonstrate the expressivity of DataToon, we createda set of comics showing different rendering styles, panellayouts, visualization types, and narrative structures. Resultsfrom a reproduction study suggest that novice participantscan successfully learn to use DataToon with minimal guid-ance to produce comics about dynamic networks. Insightsabout usability that led to improvements of DataToon in-cluded difficulties in discovering features, the inconsistencyof interactions, and the complexity of visualization contents.
2 RELATEDWORKDataToon draws from and extends previous research andtool development relating to communicative visualization,data-driven storytelling, and pen and touch interaction.
Communicative VisualizationAlthough the visualization research community has beenprimarily devoted to the study of visualization in supportof data analysis tasks, visualization has throughout historybeen used to communicate insight to an audience. Recentresearch has examined the aspects of memorability [10, 11],visual embellishment [8], and annotation [36] in the contextof communicative visualization, which has in turn informedthe design of increasingly expressive interactive visualiza-tion authoring tools. For example, tools like Lyra [42] oriVisDesigner [37] both provide a palette of graphical stylingoptions that can be applied to a visualization. More recently,Data-Driven Guides [25], Data Illustrator [29], DataInk [51],and Charticulator [38] allow further expressivity in termsof custom visual marks and custom layouts, while tools likeChartAccent [36] or DataWrapper [17] provide rich annota-tion options. It is important to note that most of these toolsare devoted to visualizing tabular data; Graph Coiffure [44]is an exception in that it provides an interface for visualizing,styling, and laying out static node-link diagrams. However,to our knowledge, there exists no interactive authoring toolfor producing communicative visualization about dynamicnetworks, this being the purpose of DataToon.
Data-Driven StorytellingMost communicative visualization tools allow for the pro-duction of one visualization at a time. While these tools maybe sufficient for conveying simple messages about the data,they cannot support the design of a fuller narrative and thustheir ability to produce a comprehensive story is limited.
Recent research has examined the integration of commu-nicative visualization within a linear narrative sequence [22].

This research is reflected in another category of tools thatfocus on sequence and narration. These include commercialtools including Tableau’s Story Points [45] and Bookmarksfor Microsoft’s Power BI [32], which provide interfaces forcomposing a sequence of story points with embedded vi-sualizations. Meanwhile, tools emerging from the researchcommunity aim for greater expressivity. These include: El-lipsis [41] and Timeline Storyteller [12], which augment asequence of visualizations with annotations and state-basedscene transitions; DataClips [2], which focuses on sequenc-ing data-driven video clips; and Vistories [18], which lever-ages the interaction history produced during data explo-ration to automatically generate a sequence that can be cu-rated and annotated into a presentable story. In each of thesetools, a set of annotated visualizations are arranged in a lin-ear narrative sequence, revealed one at a time via steppingor scrolling interactions [31].
Unlike linear slideshows and scroll-based stories, the lay-out and juxtaposition of panels in a comic allows for non-linear narrative structures, in which a reader can consumenarrative points in various orders in a glanceable format thataffords both skimming and revisitation. Unfortunately, nosingle existing data-driven tool can produce such narrativestructures. The sole existing data comics editor by Zhao andElmqvist [53] allows for the composition of linear slideshowcomics and the embellishment of visualization with speechbubbles and a narrator character. However, like illustrationsoftware, this tool requires the importation of preexistingvisualization generated by other tools. In contrast, we pro-vide the first all-in-one visualization and narrative designtool where multiple panels can be arranged freely on a page.
Another assumption inherent tomany existing data-drivenstorytelling tools is that the storyteller already has a pre-conceived story, perhaps developed in the course of dataanalysis performed with other tools, in consultation withdata analysts and subject matter experts, or in some com-bination thereof. However, this separation of analysis andstorytelling hampers rapid experimentation of alternativenarrative structures and the process of refining a story. Inother words, dedicated analysis tools often do not have flexi-ble storytelling features while dedicated storytelling toolslack data exploration capabilities such as ways to collectand organize insights. One of the benefits of an interfacethat allows for the flexible arrangement of comic panelsis that storytellers can rapidly iterate with alternative nar-rative structures. Furthermore, they can quickly generateand discard panels the process of data exploration withoutdisrupting completed parts of the comic. Finally, DataToonintegrates automatic suggestions and transitions betweenpanels as a way to scaffold a story, eliminating the tediumof alternating between a dedicated visualization tool and adedicated storytelling tool.
Pen + Touch Interaction for Creativity SupportHistorically, comics have been drawn by hand, and thus wegravitated to interfaces that could leverage expressive pen-based input for drawing and styling comic elements. Suchinterfaces have become increasingly popular in recent years,and along with them we have seen an emerging body ofresearch that focuses on the combination of pen and touchinteraction for content creation and manipulation. By com-bining these forms of interaction, users report feeling moredirectly engaged as compared to manipulating elements viaa WIMP interface [51]. Hinckley et al. introduced a richpalette of compelling interaction techniques for manipulat-ing content, all following the principle that the pen writesand touch manipulates [21, 34]. Other research has soughtto identify and evaluate pen and touch gestures for commonoperations on interactive surfaces, including selection, dele-tion, and copy / paste [33], and these gestures have appliedsuch gestures in various applications including diagram edit-ing [16], digital drawing [48, 49], early-stage ideation [50],and active reading [20]. Visualization researchers are alsobeginning to take advantage of touch and pen interaction invarious contexts [27], including visualization authoring [51],storytelling [28], and data exploration [23, 52], though untilDataToon, they have yet to apply such interaction to thecreation of data comics.
3 DESIGN GOALSWe conceive DataToon to accomplish three main goals.D1. Support the creation of data comics. Data comicshave unique characteristics and components [4, 6]. Theyexpose the story via a juxtaposed and sequenced panels,each containing one (or a few) insight(s). Getting the readerto focus on each insight requires that the author carefullycrafts the view of each panel, such as zooming in on animportant part of a network. However, identifying differentcharacters of interest (e.g., nodes) and tracking them acrosspanels requires that the author gives each a custom visualstyle to maintain consistency [35]. DataToon aims to supportthe crafting of panels and the expressive design of charactersby direct manipulation using pen and touch, while ensuringconsistency with data-driven propagation.D2. Enable data-driven design. Authoring tasks such aspropagating visual designs across panels or creating transi-tions between panels are tedious and time-consuming. Data-Toon leverages the underlying data to automatically prop-agate visual designs of graphical elements and to generatetextual labels and captions from data. DataToon also enablesan author to generate transitional panels. For example, giventwo panels containing data at different times, DataToon canautomatically create a series of panels representing the dataat interim time points.

Figure 2: DataToon’s interface: the pen can acquire different functions, such as labelling or filtering. The canvas area providesan infinite space for ideation and exploration, as well as a dedicated page area for presentation.
D3. Support exploration and authoring activities. Likeany storytelling medium, the production of a comic is a cre-ative and iterative process, often requiring the author tosmoothly transition from reviewing the data and its patternsto styling them to craft a compelling story. DataToon facili-tates the data exploration and review process by providingrecommendations of interesting patterns in the data, suchas a large cluster in the network, while enabling the rapidcreation of visualizations using direct pen and touch manip-ulation. DataToon enables flexible workflows by providinga unique platform in which authors can review salient dataaspects, rapidly generate and filter data visualizations, craftexpressive visual design for data elements, compose a storyby leveraging existing data comic templates, create a story-board, or directly sequence and reorder panels.
4 USAGE SCENARIOTo illustrate how DataToon accomplishes our goals and todescribe key components of its interface, we describe theprocess taken by a hypothetical comic author named Aidanto create the comic in Figure 4, adapted from Bach et al. [3].
Aidan opens DataToon in his web browser on a pen +touch-enabled device. The pen-tools menu (Figure 2A) rep-resents the set of instruments his digital pen can acquire.Aidan loads a dataset he previously created: a dynamic ge-ographic and multi-faceted network containing countriesand their alliances and oppositions over time. Dragging thefile into the application instantiates both the legend paneland automatically generates a set of panels depicting notablestructural patterns in the data (Figure 2C).
Aidan recalls that the evolution of allianceswas interestingand he decides to explore these. He creates a new contentpanel by dragging the Country node type from the legendpanel onto the canvas. Using the time slider for these panels(Figure 1B), he filters the data back and forth to explorehow the alliances changed over time. He duplicates panelsas he finds interesting times, jotting down notes on themusing the pencil (Figure 1D).Continuing this process of exploration, Aidan now has
multiple panels with annotated insights. He proceeds to crafta story for his comic by organizing them on the canvas. Hewants to start with an overview of the nations involved, so hedrops an image file containing a map of Europe (Figure 2G)into a panel, adjusting the location of each node with the

Layout pen (Figure 2H). He extracts country names fromthe data to place them on the map with the Label pen .
After establishing the context of the story, Aidan wants toshow the evolution of alliances in Europe. He reuses panelsthat he created earlier, transforming his rapid handwrittenannotations into visual clusters around nodes, captions andlabels. While he pans and zooms his first panel to empha-size two nodes (Figure 2J), he realizes that the differencebetween this panel and the first one may be too great andthat his audience may fail to see the connection. He acquiresthe Magic pen to interpolate between these panels andgenerate intermediary ones (Figure 1G).
He generates a time caption for the last panel by draggingthe time label from the slider (Figure 2K, left). Duplicatingthis panel (Figure 2I) and adjusting the time automatically up-dates the caption (Figure 2K, right). Uncertain about what toshow next, Aidan uses the Magic pen to trigger suggestedpanels with interesting patterns (Figure 1C).As his comic nears completion, he customizes the node
and link representations. For instance, he draws a customsketchy representation for all nodes (Figure 2D). To empha-size France among all countries, he paints its flag (Figure 1E).This custom node representation is automatically propagatedto all panels. Satisfied with his comic, he exports the comicas an image that he can share with his students.
5 DATATOONWe designed DataToon for a broad range of people who wishto craft data comics that communicate insights about theirdata. This may include graphic designers without program-ming expertise, data analysts without design expertise taskedwith communicating their findings, or educators seeking newways to engage their students.
Data AbstractionAs mentioned in the introduction, we chose to focus on dy-namic network data since it is poorly supported by existingcommunicative visualization and storytelling tools, and be-cause of its inherent parallel to the dynamic interactionsbetween characters appearing in comics. In particular, Data-Toon supports multivariate dynamic network data, whichconsists of nodes and links and their attributes. A node canhave a label and a type, as well start and end dates. A linkmust have source and target nodes and may have a directionand a weight along with same set of attributes describingnodes. Given this criteria, DataToon also supports static net-works, where neither nodes nor links have associated startor end times. Note that DataToon is primarily a storytellingtool, one suitable for communicating different aspects of dy-namic network data; we do not address scalability issues andanalysis tasks related to very large networks in this paper.
Story AbstractionLike a comic book, a data comic consists of pages (Figure 4), inwhich each page can contain multiple panels. A panel is theessential building block of a narrative structure, which canin turn contain visualization, images, text captions, and an-notation. The spatial arrangement of panels having varyingsize and content generates a unique narrative flow, enablinga nonlinear reading experience unlike linear sequences pro-duced by other storytelling tools.
Interaction DesignDataToon is comprised of a canvas for storyboarding; contentand legend panels for presenting visual representations ofdata; a set of pen tools for content creation and manipulation;and a contextual canvas for sketching custom visuals.
Figure 3 summarizes our pen + touch interactions. In gen-eral, our interaction design choices reflect the mantra: thepen writes, touch manipulates [21]. However, since individualnodes and links within panels are often too small to ma-nipulate with a finger, the pen is also used to manipulatevisual elements in some circumstances, as described below.Throughout the interface, we chose to visually expose in-teractive controls rather than rely on implicit multi-touchgestures that are difficult to discover and remember. Notethat we describe our final system, which improves upon theversion used in our reproduction study described below.
Interacting with the canvas. DataToon provides an infi-nite canvas to support flexible authoring and rapid ideation,transitioning from data exploration to authoring activities(D3). The author can navigate the canvas via pan and zoomgestures. Meanwhile, using the pen, the author can draw orwrite anywhere on the canvas, either to annotate content orto add storyboarding notes and ideas. The author can createan empty panel by simply drawing a rectangle, to be filledlater with content, or create panels from data. Panels can befreely arranged and resized with touch interactions, leadingto different layouts at any point in the authoring process.
Interacting with the legend panel. A legend panel is cre-ated when the author drags a dataset file onto the canvas.This panel provides an overview of the dynamic network,displaying a list of node types and link types along withthe cardinality of each type. This legend also serves as aninterface for creating content panels. Dragging a node or linktype from the legend onto the canvas creates a new contentpanel displaying a filtered visualization of the data. Dragginga node type automatically creates a unit chart of all nodes inthe data matching this type. Dragging a link type automat-ically creates a force-directed node-link diagram of nodesconnected by this link type. Note that links can convey both

Figure 3: An overview of the pen + touch interactions supported by DataToon.
weight and direction via line thickness and arrows, shouldthese optional attributes be provided.
Node and link types can also be dragged from the legendpanel to an existing content panel, whereupon its contentsare updated to reflect the additional type (Figure 2E) and itslayout recomputed. For instance, dragging a link type to acontent panel containing a unit chart will convert the chartinto a node-link diagram. Similarly, adding a link type to apanel containing a node-link diagram will generate multiplelink types (see Figure 2).
Interacting with content panels. A content panel maycontain visualizations, text, annotations, a background image,or some combination thereof (D1). Panels can be nested:drawing a rectangle inside a panel creates a child panel,which is useful for text captions or inset visualizations. Itis possible to duplicate an existing panel, copying all of thecontent of the source panel to a new panel (Figure 2I). Thisinteraction is particularly useful for progressively building anarrative using the previous panel as a starting point.Tapping on a panel containing a visualization selects it
and enables panning and zooming within the panel. This alsoreveals a time slider for the panel, which applies additionaltemporal filtering to nodes and links displayed within thepanel. Dragging this slider onto the panel creates a nestedtime caption panel (D2), which remains updates as the userchanges the time slider (Figure 2K).Acquiring different pen modes. Content editing occursthrough the use of the following pen modes:
Pencil mode is the default pen mode and allows forfreeform inking on the canvas. If the author draws atop acontent panel, the ink belongs to the panel and moves alongwith it when that content panel is manipulated.
Label mode generates a text label for nodes and linksand allows for adjusting label positions (Figure 1F). Labeland leader lines move when the element is moved.
Highlightmode allows the author to lasso a set of nodesto highlight them in a colored group (Figure 1F). As withlabels, highlights also adjust when elements are moved.
Filter mode allows the author to lasso a set of nodes tofilter them from a panel or to create a new panel with thesenodes (Figure 1B). Filtering can de-clutter panels and helpfocus on different subsets of the network.
Layout mode leverages the high-precision of the digtialpen to adjust the positions of nodes and labels (Figure 2H).
Magic mode offers a way to automatically generate con-tent panels (Figure 1C, D), described in more detail below.
Figure 4: DataToon uses a comic bookmetaphor to allow au-thors to create multiple pages of data comics using morethan one dataset. Each page can be created with a a prede-fined layout such as the ones shown in the second row.
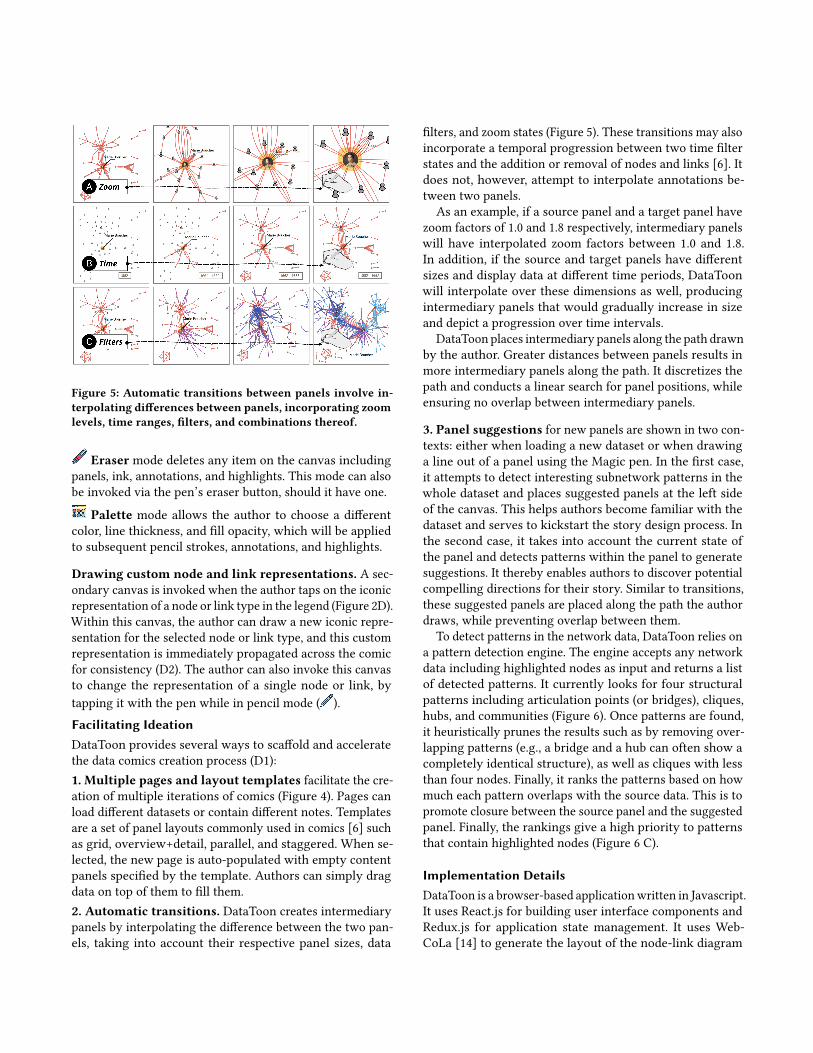
Figure 5: Automatic transitions between panels involve in-terpolating differences between panels, incorporating zoomlevels, time ranges, filters, and combinations thereof.
Eraser mode deletes any item on the canvas includingpanels, ink, annotations, and highlights. This mode can alsobe invoked via the pen’s eraser button, should it have one.
Palette mode allows the author to choose a differentcolor, line thickness, and fill opacity, which will be appliedto subsequent pencil strokes, annotations, and highlights.
Drawing custom node and link representations. A sec-ondary canvas is invoked when the author taps on the iconicrepresentation of a node or link type in the legend (Figure 2D).Within this canvas, the author can draw a new iconic repre-sentation for the selected node or link type, and this customrepresentation is immediately propagated across the comicfor consistency (D2). The author can also invoke this canvasto change the representation of a single node or link, bytapping it with the pen while in pencil mode ( ).Facilitating IdeationDataToon provides several ways to scaffold and acceleratethe data comics creation process (D1):1. Multiple pages and layout templates facilitate the cre-ation of multiple iterations of comics (Figure 4). Pages canload different datasets or contain different notes. Templatesare a set of panel layouts commonly used in comics [6] suchas grid, overview+detail, parallel, and staggered. When se-lected, the new page is auto-populated with empty contentpanels specified by the template. Authors can simply dragdata on top of them to fill them.2. Automatic transitions. DataToon creates intermediarypanels by interpolating the difference between the two pan-els, taking into account their respective panel sizes, data
filters, and zoom states (Figure 5). These transitions may alsoincorporate a temporal progression between two time filterstates and the addition or removal of nodes and links [6]. Itdoes not, however, attempt to interpolate annotations be-tween two panels.As an example, if a source panel and a target panel have
zoom factors of 1.0 and 1.8 respectively, intermediary panelswill have interpolated zoom factors between 1.0 and 1.8.In addition, if the source and target panels have differentsizes and display data at different time periods, DataToonwill interpolate over these dimensions as well, producingintermediary panels that would gradually increase in sizeand depict a progression over time intervals.
DataToon places intermediary panels along the path drawnby the author. Greater distances between panels results inmore intermediary panels along the path. It discretizes thepath and conducts a linear search for panel positions, whileensuring no overlap between intermediary panels.
3. Panel suggestions for new panels are shown in two con-texts: either when loading a new dataset or when drawinga line out of a panel using the Magic pen. In the first case,it attempts to detect interesting subnetwork patterns in thewhole dataset and places suggested panels at the left sideof the canvas. This helps authors become familiar with thedataset and serves to kickstart the story design process. Inthe second case, it takes into account the current state ofthe panel and detects patterns within the panel to generatesuggestions. It thereby enables authors to discover potentialcompelling directions for their story. Similar to transitions,these suggested panels are placed along the path the authordraws, while preventing overlap between them.
To detect patterns in the network data, DataToon relies ona pattern detection engine. The engine accepts any networkdata including highlighted nodes as input and returns a listof detected patterns. It currently looks for four structuralpatterns including articulation points (or bridges), cliques,hubs, and communities (Figure 6). Once patterns are found,it heuristically prunes the results such as by removing over-lapping patterns (e.g., a bridge and a hub can often show acompletely identical structure), as well as cliques with lessthan four nodes. Finally, it ranks the patterns based on howmuch each pattern overlaps with the source data. This is topromote closure between the source panel and the suggestedpanel. Finally, the rankings give a high priority to patternsthat contain highlighted nodes (Figure 6 C).
Implementation DetailsDataToon is a browser-based applicationwritten in Javascript.It uses React.js for building user interface components andRedux.js for application state management. It uses Web-CoLa [14] to generate the layout of the node-link diagram

Figure 6: Automatic panel suggestions depicts structural pat-terns: communities, hubs, articulation points, and cliques.The author can trigger suggestions from existing panels (A)and suggested panels (B). Patterns are ranked based on net-work coverage and inclusion of highlighted nodes (C).
and a Javascript implementation [26] of Bubble Sets [13] tohighlight a group of nodes as a cluster. DataToon consists ofa front-end interface without a back-end server, though onecan be attached if needed; currently, DataToon makes use oflocalStorage and indexedDB in HTML5 to persist the applica-tion state. The panel recommendation engine is implementedin Python and uses NetworkX to detect patterns [19].
6 EVALUATIONOur evaluation methodology is representative of other re-cent evaluations of visualization authoring systems [39], inthat we demonstrate the expressiveness of DataToon with anexample gallery (Figure 7) and also evaluate its learnabilityand usability via a reproduction study.
Example GalleryFigure 7 shows example comics varying in their comic style,including diverse rendering styles (abstract, sketchy, realis-tic), panel layouts (inset, overlapping, staggered) [6], visual-izations (unit charts or pictographs, maps, set visualizations,node-link diagram), and narrative structures (overview+detail,nonlinear-temporal, cut-out, build-up [6]). The gallery alsoexemplifies a diversity of datasets, including multivariateand temporal social networks and co-authorship networks.
Reproduction StudyTo evaluate whether people can learn how to use DataToonto create comics from data, we conducted a qualitative repro-duction study, in which participants are asked to reproducethem completed examples with DataToon. This type of studyis particularly common in the evaluation of visualizationauthoring tools [39], having been used to evaluate Lyra [42],
ChartAccent [36], DataInk [51], Data-Driven Guides [25],Data Illustrator [29], and Charticulator [38].
Participants.We recruited eight participants from a largesoftware company in the United States. Half of the partici-pants were graphic designers with limited data literacy (P1-P4: 3M, 1F; ages 30−50, avg: 44), while the other half weredata analysts with minimal experience in design tools (P5-P8:2M, 2F; ages 31−42, avg: 37).
Apparatus. Participants used a earlier version of DataToonon a Microsoft Surface Studio with a 28-inch screen at 4500× 3000px (192 PPI), a device that enables simultaneous penand multi-touch input.
Procedure and tasks. Beginning with a demographic sur-vey, each study session lasted ∼90 minutes, with two partici-pants finishing in ∼60 minutes, and one taking ∼120 minutes.We asked them to reproduce two comics: 1) the first withguidance from us using the comic aboutWorldWar I alliances(Figure 2) and 2) the second without any assistance usingthe comic inspired by Fathom’s Scaled in Miles project [15]about the evolving instrumentation on Miles Davis’ records(Figure 7-left). The first task served as a training session andlasted 30 to 40 minutes, which included a 15-minute tutorial,while the second task lasted between 30 and 50 minutes. Thestudy ended with three Likert-style questions about ease ofuse & learning, and enjoyment, along with a semi-structuredinterview about their experience.
ObservationsAll participants successfully completed both comics, whilewe discovered several usability insights into the usability ofDataToon. We describe our observations below.
Learning to interact with both pen and touch. All ofthe participants appeared to grasp DataToon’s interactiondesign by the end of the study, except for P2, who had noprior experience with pen + touch devices. It took a longtime (approx. 10 min) for P2 to complete the first task and theeffort spent to learn the interactions are reflected in their lowease of learning (3/7) and use (4/7) scores. P4, P5, P6, and P7also repeatedly appeared to be frustrated when attemptingto use pen and finger interchangeably, with P7 stating “I keptusing my hand instead of the pen”.Participants bimanual pen and touch interaction to be
engaging, with P8 remarking on the simplicity of the inter-actions: “I love the power of just dragging [shows fingers] andcreating [shows the pen]”. P4 spoke about the empoweringexperience of bimanual pen and touch input for content cre-ation, making DataToon “unique” and “fun” compared toother tools: “I feel like a surgeon because I got precise and usedboth of my hands, not something I do ever. It’s pretty cool!”.

A focused tool set for design exploration. The graphicdesign participants all expressed that one notable strength ofDataToon was a “focused tool set” (P1), its interface “stream-lining the set of tools” (P4) compared to existing illustra-tion tools. We observed that our interface enabled alterna-tive workflows to achieve the same result, reflecting whatRen et al. refer to as the flexibility of a visualization author-ing tool [39]. For example, several participants began withmultiple panels, adjusted the content of each panel beforecustomizing each of them in turn. Others would create andmodify one panel until it was polished, only then duplicatingto instantiate the next panel.Participants’ difficulties often related to feature discover-
ability, as not every pen mode was visually shown in theinterface. For example, in the version of DataToon used inthe study, the pen button was used to activate the highlightpen. P8 commented that “Minimalism is in, it looks just like asimple drawing app, but then it can be intimidating becausehow do you achieve all of this? [pointing to print out of thedata comics] I was nervous”. Similarly, P1 commented thatthe principle of dragging and dropping elements into panelswas violated in the case of time captions, which required adouble tap, making it challenging to discover.
Closing the gap between analysis and storytelling. Par-ticipants appreciated the ability to discover patterns duringthe story authoring process, suggestive of a possible advan-tage over visualization authoring tools that are disjoint fromdata analysis tools. We observed that data analysts tendedto explore the data before constructing on their comics. Forexample, P5 started by creating many panels (one per nodetype) and by commenting on the structural patterns in thedata. P8 used a different strategy, adding each node type to asingle panel in succession, where each node type was a differ-ent instruments featured on Miles Davis records; upon doingso, P8 stated that “now I am beginning to see the relationshipsbetween instruments [...] I am going to move things around soI can understand my data”. Finally, some participants notedthe necessity of additional data abstraction. For example,P3, looking at a particularly dense node-link diagram, said“I wish there were a way to untangle that because that is asuper full graph”, suggestive of a need for capabilities thataggregate nodes and links.
Lessons Learned from the Reproduction StudyThe results of the study illuminated a set of usability insightsregarding the difficulty of discovering features, the inconsis-tency of pen and touch interactions, and the complexity ofvisualization contents. These insights led to several improve-ments to the design of DataToon.To address the feature discoverability issue, we ensured
that all pen modes are visible (Figure 2A) without cluttering
the interface and degrading the authoring experience. In ad-dition, after observing participants repeatably attempting touse fingers where we enforced use of the pen, which initiallyincluded panning and zooming panel content, we opted to ac-commodate more touch interaction, reflecting the pen writes,touch manipulates mantra [21]. We also replaced the double-tap gesture for creating time captions with a consistent draggesture. Finally, to handle the visual complexity issue, weadded the ability to filter nodes of interest from a panel, aswell as the panel suggestion functionality for assisting withexploring complex data.
7 DISCUSSION AND FUTUREWORKWe now reflect on broader issues and opportunities thatarose during the development and evaluation of DataToon.
Generalization to other data and visualization types.The design of DataToon (See Figure 3) is mostly data-type-agnostic and generalizable beyond network data, such asgestures, panel manipulation, annotations, time sliders, high-lighting and removing data elements, etc. Accommodatingother data types (e.g., tabular data), visualizations (e.g., barcharts), and specific components (e.g., axes and scales) isan interesting research direction. The overarching researchquestion in this space would be how to enable fast and fluidcreation and manipulation of such panels, as visualizationscan involve complex grouping and filtering operations ondata. However, core “comic” features such as automatic prop-agation of style, automatic generation of transitions andpanel recommendation would require minimum redesign.
Pen + touch interaction for data-driven storytelling.Pen + touch interaction was seen as engaging and flexibleby our study participants, advantages that may prove bene-ficial beyond data comics to other data-driven storytellingexperiences. While novices require time to acclimate to pen+ touch interfaces, we observed that after an initial learningphase, this input modality stimulates creativity and encour-ages experimentation. However, to promote learning anddiscoverability, we must design appropriate visual cues andaffordances that remind users of their capabilities. In ourstudy, we observed that people initially want to use pen andtouch interchangeably to accomplish a single action. Thisobservation warrants further investigation and a revisitationof the pen writes, touch manipulates mantra [21].
Beyond traditional comics. DataToon exports pages asstatic images, like traditional comic books. While being re-spectful of this tradition, creating dynamic and interactivedata comics is an interesting research direction. For example,a “presentation mode” might allow for presenters or viewersto touch parts of the comic and reveal content on demand, or

Figure 7: A gallery of eight data comics created with DataToon using different comic styles and datasets.
add annotations as part of an active reading process [46]. Al-ternatively, DataToon could export comics as websites thatinvite viewer interaction, potentially by integrating tech-niques such as brushing and linking across panels.
Toward higher-level narrative design support. Our de-sign considerations emphasized use of the structural ele-ments of comics such as panels and captions to convey adata story. However, producing an engaging story still de-pends on the contents of the data and the creativity of theauthor. DataToon does not explicitly incorporate higher-levelnarrative design patterns [5, 6] into its interface.
The automatic transition, suggestion, and layout templatefeatures are a step toward narrative design guidance, butthere are further opportunities to improve . For example, wemight auto-populate an entire template with visualizationcontent as a way to seed a story, though we must take careto not absolve authors of their creative agency. Similarly,generating panel transitions that precisely match an author’snarrative intent is challenging, but such transitions can beused as a way discover new narrative directions. Also, being
able to quickly evaluate the overall narrative structure willgreatly aid the iterative process of crating a story [24].
8 CONCLUSIONWe contributed DataToon, an interactive system for produc-ing comics about dynamic networks. It leverages the formof comics to construct a narrative structure and offers a flex-ible pen + touch authoring interface for content creationand manipulation. DataToon provides automatic transitionsand panel recommendations for narrative ideation and accel-erated storyboarding. We plan to extend our evaluation tostudy the authoring process in a more longitudinal free-formstudy [39], focusing on comprehensive evaluation metricsfor visualization authoring tools [1].
9 ACKNOWLEDGMENTSWe would like to thank anonymous reviewers for usefulfeedback. Nam Wook Kim would like to acknowledge thesupport from the Kwanjeong Educational Foundation andthe Siebel Scholars Foundation.

REFERENCES[1] Fereshteh Amini, Matthew Brehmer, Gordon Bolduan, Christina Elmer,
and Benjamin Wiederkehr. 2018. Evaluating data-driven stories &storytelling tools. In Data-Driven Storytelling, Nathalie Henry Riche,Christophe Hurter, Nicholas Diakopoulos, and Sheelagh Carpendale(Eds.). A K Peters/CRC Press. https://aka.ms/dds_book.
[2] FereshtehAmini, Nathalie Henry Riche, Bongshin Lee, AndresMonroy-Hernandez, and Pourang Irani. 2017. Authoring data-driven videoswith DataClips. IEEE Transactions on Visualization and ComputerGraphics (Proceedings of InfoVis) 23, 1 (2017), 501–510. http://doi.org/10.1109/TVCG.2016.2598647.
[3] Benjamin Bach, Natalie Kerracher, Kyle W. M. Hall, Sheelagh Carpen-dale, Jessie Kennedy, and Nathalie Henry Riche. 2016. Telling storiesabout dynamic networks with graph comics. In Proceedings of the ACMConference on Human Factors in Computing Systems (CHI). 3670–3682.http://doi.org/10.1145/2858036.2858387.
[4] Benjamin Bach, Nathalie Henry Riche, Sheelagh Carpendale, andHanspeter Pfister. 2017. The emerging genre of data comics. IEEEComputer Graphics and Applications (CG&A) 37, 3 (2017), 6–13. http://doi.org/10.1109/MCG.2017.33.
[5] Benjamin Bach, Moritz Stefaner, Jeremy Boy, Steven Drucker, Lyn Bar-tram, Jo Wood, Paolo Ciuccarelli, Yuri Engelhardt, Ulrike Köppen, andBarbara Tversky. 2018. Narrative design patterns for data-driven story-telling. In Data-Driven Storytelling, Nathalie Henry Riche, ChristopheHurter, Nicholas Diakopoulos, and Sheelagh Carpendale (Eds.). A KPeters/CRC Press. https://aka.ms/dds_book.
[6] Benjamin Bach, Zezhong Wang, Matteo Farinella, Dave Murray-Rust,and Nathalie Henry Riche. 2018. Design patterns for data comics. InProceedings of the ACM Conference on Human Factors in ComputingSystems (CHI). https://doi.org/10.1145/3173574.3173612.
[7] Benjamin Bach, Zezhong Wang, Nathalie Henry Riche, MatteoFarinella, Dave Murray-Rust, Sheelagh Carpendale, and HanspeterPfister. 2018. Data Comics. http://datacomics.net.
[8] Scott Bateman, Regan L Mandryk, Carl Gutwin, Aaron Genest, DavidMcDine, and Christopher Brooks. 2010. Useful junk?: The effects ofvisual embellishment on comprehension and memorability of charts.In Proceedings of the ACM Conference on Human Factors in ComputingSystems (CHI). 2573–2582. https://doi.org/10.1145/1753326.1753716.
[9] Alex Bigelow, Steven Drucker, Danyel Fisher, and Miriah Meyer. 2017.Iterating between tools to create and edit visualizations. IEEE Transac-tions on Visualization and Computer Graphics (Proceedings of InfoVis)23, 1 (2017), 481–490. http://doi.org/10.1109/TVCG.2016.2598609.
[10] Michelle A Borkin, Zoya Bylinskii, Nam Wook Kim, Constance MayBainbridge, Chelsea S. Yeh, Daniel Borkin, Hanspeter Pfister, and AudeOliva. 2016. Beyondmemorability: Visualization recognition and recall.IEEE Transactions on Visualization and Computer Graphics (Proceedingsof InfoVis) 22, 1 (2016), 519–528. https://doi.org/10.1109/TVCG.2015.2467732.
[11] Michelle A Borkin, Azalea A Vo, Zoya Bylinskii, Phillip Isola, ShashankSunkavalli, Aude Oliva, and Hanspeter Pfister. 2013. What makesa visualization memorable? IEEE Transactions on Visualization andComputer Graphics (Proceedings of InfoVis) 19, 12 (2013), 2306–2315.https://doi.org/10.1109/TVCG.2013.234.
[12] Matthew Brehmer, Bongshin Lee, Nathalie Henry Riche, DavidTittsworth, Kate Lytvynets, Darren Edge, and Christopher White.2019. Timeline Storyteller: The Design & Deployment of an Inter-active Authoring Tool for Expressive Timeline Narratives. In To ap-pear in proceedings of the the Computation + Journalism Symposium.https://aka.ms/TSCJ19.
[13] Chistopher Collins, Gerald Penn, and Sheelagh Carpendale. 2009. Bub-ble sets: Revealing set relations with isocontours over existing visual-izations. IEEE Transactions on Visualization and Computer Graphics 15,6 (2009), 1009–1016. http://doi.org/10.1109/TVCG.2009.122.
[14] Tim Dwyer. 2018. WebCoLa. http://ialab.it.monash.edu/webcola/.[Online; accessed 31-03-2018].
[15] Fathom. 2015. Scaled in Miles. https://fathom.info/miles/. [Online;accessed 11-Sep-2018].
[16] Mathias Frisch, Jens Heydekorn, and Raimund Dachselt. 2009. Investi-gating multi-touch and pen gestures for diagram editing on interactivesurfaces. In Proceedings of the ACM Conference on Interactive Tabletopsand Surfaces (ITS). 149–156. http://doi.org/10.1145/1731903.1731933.
[17] Datawrapper GmbH. 2018. Datawrapper GmbH. https://www.datawrapper.de. [Online; accessed: 2018-08-04].
[18] Samuel Gratzl, Alex Lex, Nils Gehlenborg, Nicola Cosgrove, and MarcStreit. 2016. From visual exploration to storytelling and back again.In Computer Graphics Forum (Proceedings of EuroVis). 491–500. http://doi.org/10.1111/cgf.12925.
[19] Aric Hagberg, Dan Schult, and Pieter Swart. 2018. NetworkX. https://networkx.github.io/. [Online; accessed 31-03-2018].
[20] Ken Hinckley, Xiaojun Bi, Michel Pahud, and Bill Buxton. 2012. Infor-mal information gathering techniques for active reading. In Proceedingsof the ACM Conference on Human Factors in Computing Systems (CHI).1893–1896. http://doi.org/10.1145/2207676.2208327.
[21] Ken Hinckley, Koji Yatani, Michel Pahud, Nicole Coddington, JennyRodenhouse, Andy Wilson, Hrvoje Benko, and Bill Buxton. 2010. Pen+ touch = new tools. In Proceedings of the ACM Symposium on UserInterface Software and Technology (UIST). 27–36. http://doi.org/10.1145/1866029.1866036.
[22] Jessica Hullman, Steven Drucker, Nathalie Henry Riche, BongshinLee, Danyel Fisher, and Eytan Adar. 2013. A deeper understanding ofsequence in narrative visualization. IEEE Transactions on Visualizationand Computer Graphics 19, 12 (2013), 2406–2415. https://doi.org/10.1109/TVCG.2013.119.
[23] Jaemin Jo, Sehi L’Yi, Bongshin Lee, and Jinwook Seo. 2017. TouchPivot:Blending WIMP & post-WIMP interfaces for data exploration on tabletdevices. In Proceedings of the ACM Conference on Human Factors inComputing Systems (CHI). 2660–2671. http://doi.org/10.1145/3025453.3025752.
[24] Nam Wook Kim, Benjamin Bach, Hyejin Im, Sasha Schriber, MarkusGross, and Hanspeter Pfister. 2018. Visualizing nonlinear narrativeswith story curves. IEEE Transactions on Visualization and ComputerGraphics (Proceedings of InfoVis) 24, 1 (2018), 595–604. http://doi.org/10.1109/TVCG.2017.2744118.
[25] Nam Wook Kim, Eston Schweickart, Zhicheng Liu, Mira Dontcheva,Wilmot Li, Jovan Popovic, and Hanspeter Pfister. 2017. Data-drivenguides: Supporting expressive design for information graphics. IEEETransactions on Visualization and Computer Graphics (Proceedings ofInfoVis) 23, 1 (2017), 491–500. http://doi.org/10.1109/TVCG.2016.2598620.
[26] Josua Krause. 2018. Bubble Sets. https://github.com/JosuaKrause/bubblesets-js. [Online; accessed 31-03-2018].
[27] Bongshin Lee, Petra Isenberg, Nathalie Henry Riche, and SheelaghCarpendale. 2012. Beyond mouse and keyboard: Expanding designconsiderations for information visualization interactions. IEEE Trans-actions on Visualization and Computer Graphics (Proceedings of InfoVis)18, 12 (2012), 2689–2698. https://doi.org/10.1109/TVCG.2012.204.
[28] Bongshin Lee, Rubaiat Habib Kazi, and Greg Smith. 2013. SketchStory:Telling more engaging stories with data through freeform sketching.IEEE Transactions on Visualization and Computer Graphics (Proceedingsof InfoVis) 19, 12 (2013), 2416–2425. http://doi.org/10.1109/TVCG.2013.191.

[29] Zhicheng Liu, John Thompson, Alan Wilson, Mira Dontcheva, JamesDelorey, Sam Grigg, Bernard Kerr, and John Stasko. 2018. Data Il-lustrator: Augmenting vector design tools with lazy data bindingfor expressive visualization authoring. In Proceedings of the ACMConference on Human Factors in Computing Systems (CHI). https://doi.org/10.1145/3173574.3173697.
[30] Scott McCloud. 1993. Understanding Comics: The Invisible Art. HarperCollins.
[31] Sean McKenna, Nathalie Henry Riche, Bongshin Lee, Jeremy Boy, andMiriah Meyer. 2017. Visual narrative flow: Exploring factors shapingdata visualization story reading experiences. Computer Graphics Forum(Proceedings of EuroVis) 36, 3 (2017), 377–387. http://doi.org/10.1111/cgf.13195.
[32] Microsoft. 2018. Use bookmarks to share insights and buildstories in Power BI. https://docs.microsoft.com/en-us/power-bi/desktop-bookmarks. [Online; accessed 13-09-2018].
[33] Meredith Ringel Morris, Jacob O. Wobbrock, and Andrew D. Wilson.2010. Understanding users’ preferences for surface gestures. In Pro-ceedings of Graphics Interface (GI). 261–268. http://dl.acm.org/citation.cfm?id=1839214.1839260.
[34] Ken Pfeuffer, Ken Hinckley, Michel Pahud, and Bill Buxton. 2017.Thumb + pen interaction on tablets. In Proceedings of the ACM Con-ference on Human Factors in Computing Systems (CHI). 3254–3266.http://doi.org/10.1145/3025453.3025567.
[35] Zening Qu and Jessica Hullman. 2018. Keeping multiple views con-sistent: Constraints, validations, and exceptions in visualization au-thoring. IEEE Transactions on Visualization and Computer Graphics(Proceedings of InfoVis) 24, 1 (2018), 468–477. http://doi.org/10.1109/TVCG.2017.2744198.
[36] Donghao Ren, Matthew Brehmer, Bongshin Lee, Tobias Höllerer, andEun Kyoung Choe. 2017. ChartAccent: Annotation for data-drivenstorytelling. In Proceedings of the IEEE Pacific Visualization Symposium(PacificVis). 230–239. http://doi.org/10.1109/PACIFICVIS.2017.8031599.
[37] Donghao Ren, Tobias Höllerer, and Xiaoru Yuan. 2014. iVisDesigner:Expressive interactive design of information visualizations. IEEE Trans-actions on Visualization and Computer Graphics (Proceedings of InfoVis)20, 12 (2014), 2092–2101. http://doi.org/10.1109/TVCG.2014.2346291.
[38] Donghao Ren, Bongshin Lee, and Matthew Brehmer. 2018. Char-ticulator: Interactive construction of bespoke chart layouts. IEEETransactions on Visualization and Computer Graphics (2018), 1–1.https://doi.org/10.1109/TVCG.2018.2865158
[39] Donghao Ren, Bongshin Lee, Matthew Brehmer, and Nathalie HenryRiche. 2018. Reflecting on the evaluation of visualization authoring sys-tems. In Workshop Proceedings of Evaluation and Beyond - Methodolog-ical Approaches for Visualization (BELIV). https://aka.ms/renbeliv18.
[40] Nathalie Henry Riche, Christophe Hurter, Sheelagh Carpendale, andNicholas Diakopoulos (Eds.). 2018. Data-Driven Storytelling. AK Peters.CRC Press. https://aka.ms/dds_book.
[41] Arvind Satyanarayan and Jeffrey Heer. 2014. Authoring narrativebisualizations with Ellipsis. Computer Graphics Forum (Proceedings ofEuroVis) 33, 3 (2014), 361–370. http://doi.org/10.1111/cgf.12392.
[42] Arvind Satyanarayan and Jeffrey Heer. 2014. Lyra: An Interactive Visu-alization Design Environment. Computer Graphics Forum (Proceedingsof EuroVis) 33, 3 (2014), 351–360. http://doi.org/10.1111/cgf.12391.
[43] Edward Segel and Jeffrey Heer. 2010. Narrative visualization: Tellingstories with data. IEEE Transactions on Visualization and ComputerGraphics (Proceedings of InfoVis) 16, 6 (2010), 1139–1148. https://doi.org/10.1109/TVCG.2010.179.
[44] Andre Suslik Spritzer, Jeremy Boy, Pierre Dragicevic, Jean-DanielFekete, and Carla Maria Dal Sasso Freitas. 2015. Towards a smoothdesign process for static communicative node-link diagrams. Com-puter Graphics Forum (Proceedings of EuroVis) 34, 3 (2015), 461–470.
http://doi.org/10.1111/cgf.12658.[45] Tableau. 2018. Story Points. https://tabsoft.co/2jxghOC. [Online;
accessed 13-09-2018].[46] Jagoda Walny, Samuel Huron, Charles Perin, Tiffany Wun, Richard
Pusch, and Sheelagh Carpendale. 2018. Active reading of visualizations.IEEE Transactions on Visualization and Computer Graphics (Proceedingsof InfoVis) 24, 1 (2018), 770–780. http://doi.org/10.1109/TVCG.2017.2745958.
[47] Zezong Wang, Shunming Wang, Matteo Farinella, Dave Murray-Rust,Nathalie Henry Riche, and Benjamin Bach. 2019. Comparing Effective-ness and Engagement of DataComics and Infographics. In Proceedingsof the ACM Conference on Human Factors in Computing Systems (CHI).
[48] Haijun Xia, Bruno Araujo, Tovi Grossman, and Daniel Wigdor. 2016.Object-oriented drawing. In Proceedings of the ACM Conference onHuman Factors in Computing Systems (CHI). 4610–4621. http://doi.org/10.1145/2858036.2858075.
[49] Haijun Xia, Bruno Araujo, and Daniel Wigdor. 2017. Collection objects:Enabling fluid formation and manipulation of aggregate selections. InProceedings of the ACM Conference on Human Factors in ComputingSystems (CHI). 5592–5604. http://doi.org/10.1145/3025453.3025554.
[50] Haijun Xia, Ken Hinckley, Michel Pahud, Xiao Tu, and Bill Buxton.2017. WritLarge: Ink unleashed by unified scope, action, and zoom. InProceedings of the ACM Conference on Human Factors in ComputingSystems (CHI). 3227–3240. http://doi.org/10.1145/3025453.3025664.
[51] Haijun Xia, Nathalie Henry Riche, Fanny Chevalier, Bruno Araujo,and Daniel Wigdor. 2018. DataInk: Direct and creative data-orienteddrawing. In Proceedings of the ACM Conference on Human Factors inComputing Systems (CHI). https://doi.org/10.1145/3173574.3173797.
[52] Emanuel Zgraggen, Robert Zeleznik, and Steven M. Drucker. 2014.PanoramicData: Data analysis through pen & touch. IEEE Transactionson Visualization and Computer Graphics (Proceedings of InfoVis) 20, 12(2014), 2112–2121. http://doi.org/10.1109/TVCG.2014.2346293.
[53] Zhenpeng Zhao, Rachael Marr, and Niklas Elmqvist. 2015. Data Comics:Sequential Art for Data-Driven Storytelling. Technical Report. HumanComputer Interaction Lab, University of Maryland. http://www.cs.umd.edu/hcil/trs/2015-15/2015-15.pdf.