Data Visualization - University of Arkansas at Little Rock · Typical Big Data Visualization...
53
Sept 26-29, 2016 (c) 2016 iCDO@UALR 1 Data Visualization Dirk Reiners Information Sciences UALR [email protected]
Transcript of Data Visualization - University of Arkansas at Little Rock · Typical Big Data Visualization...

About Me
• Dirk Reiners
• Faculty Member in Information Sciences Department at University of Arkansas Little Rock (UALR)
• Chief Scientist of the Emerging Analytics Center (EAC) at UALR
• MS and PhD in Computer Graphics from Technical University Darmstadt, Germany
• 20+ Years experience in developing Visualization and Virtual Reality software systems and applications• Worked at Fraunhofer Institute for Computer Graphics, Iowa State University
and University of Louisiana at Lafayette• Wide variety of research and business areas

Motivation
• More and more data is being collected in many areas of business and science
• Analysis of this data is becoming a critical bottleneck
• New approaches and technologies try to help solve this problem• Approaches: Big Data Mining, Deep Learning, Data Quality, ...
• Technologies: Hadoop, NoSQL DBs, ...
• In the end: decisions are made by humans, who need to understand the data
• How can we support them in understanding large and complex data?

Visualization
• Humans are visual animals• 80% of the information goes through our eyes
• 30% of the cortex’ surface dedicated to it
• Highly parallel, many automatic processing steps
• Visual representations can be quickly understood
• Have been used for a long time
• Can be used for different purposes

Possible Visualization Goals
• Help cognition
• Answer a question
• Uncover patterns
• Record
• Clarify
• Communicate
• Inspire

Effective Visualization
• Needs to take into account how we see and perceive things
• Needs to take into account what data is being visualized
• Needs to be designed correctly
Sept 26-29, 2016 (c) 2016 iCDO@UALR 6

The Eye
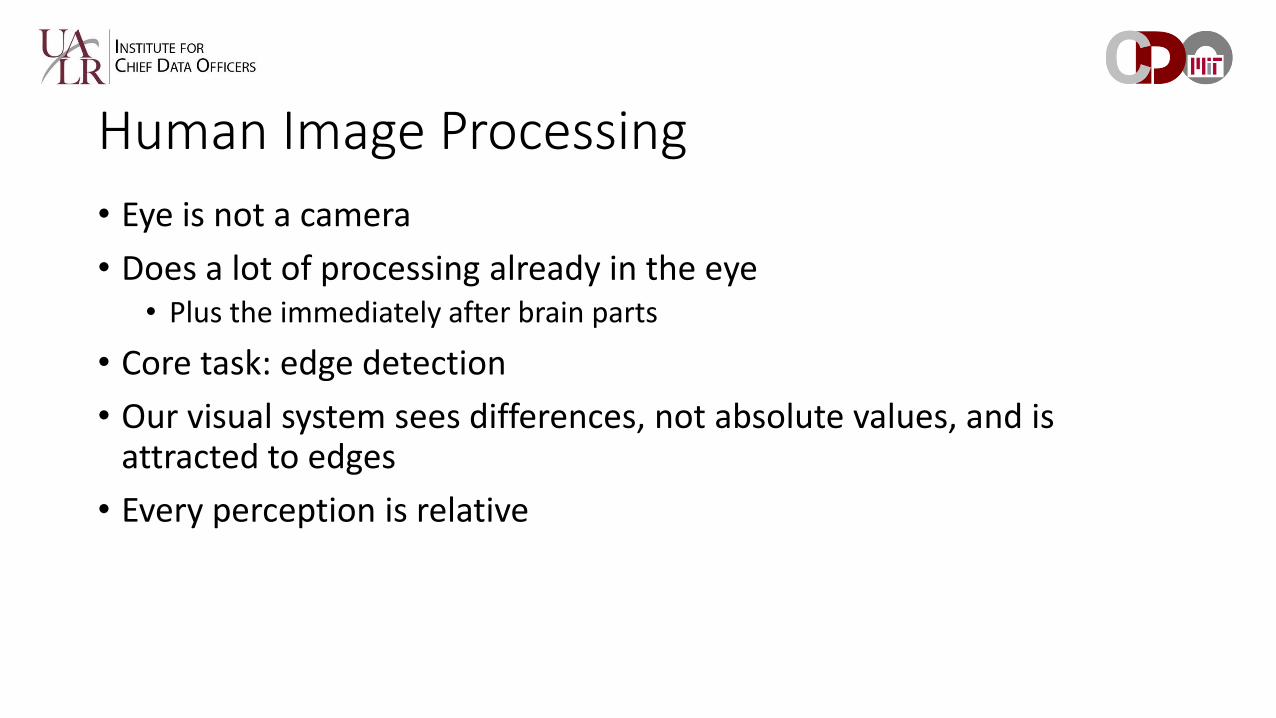
Human Image Processing
• Eye is not a camera
• Does a lot of processing already in the eye• Plus the immediately after brain parts
• Core task: edge detection
• Our visual system sees differences, not absolute values, and is attracted to edges
• Every perception is relative

Relativity of Perception
• Weber’s Law• We judge based on relative, not absolute, differences
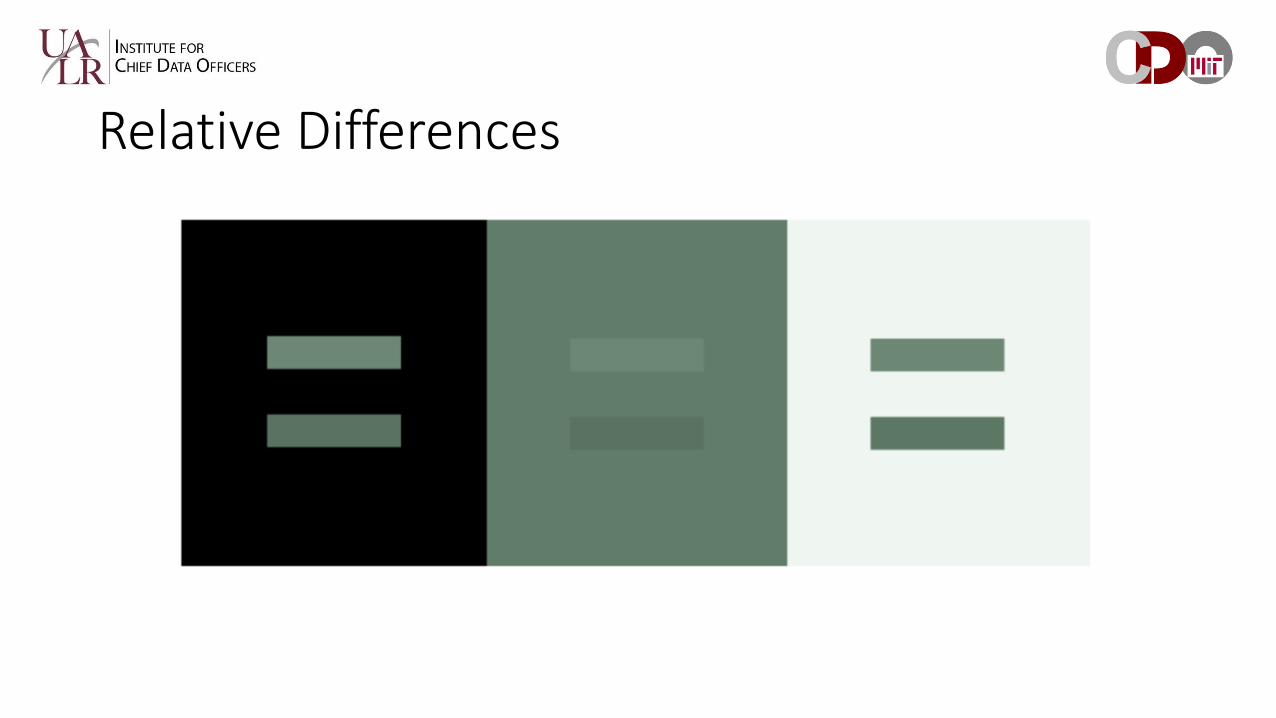
Relative Differences

Axis of Alignment

Axis of Alignment

Things that pop : Pop Quiz

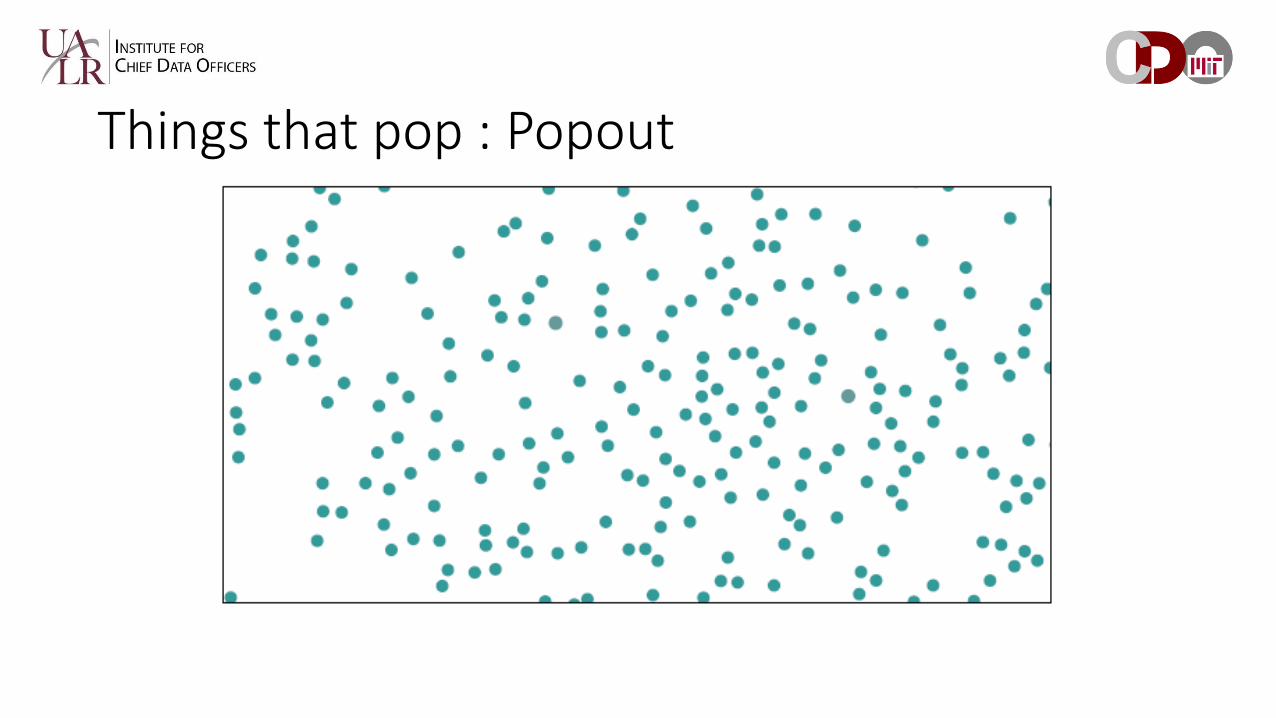
Things that pop : Popout

Things that pop : Popout

Things that pop : Popout
Things that pop : Popout

Pre-Attentive Processing
• Requires attention, despite name• Can be overcome by distraction
• Very fast: <200 ms
• What matters most is contrast between features
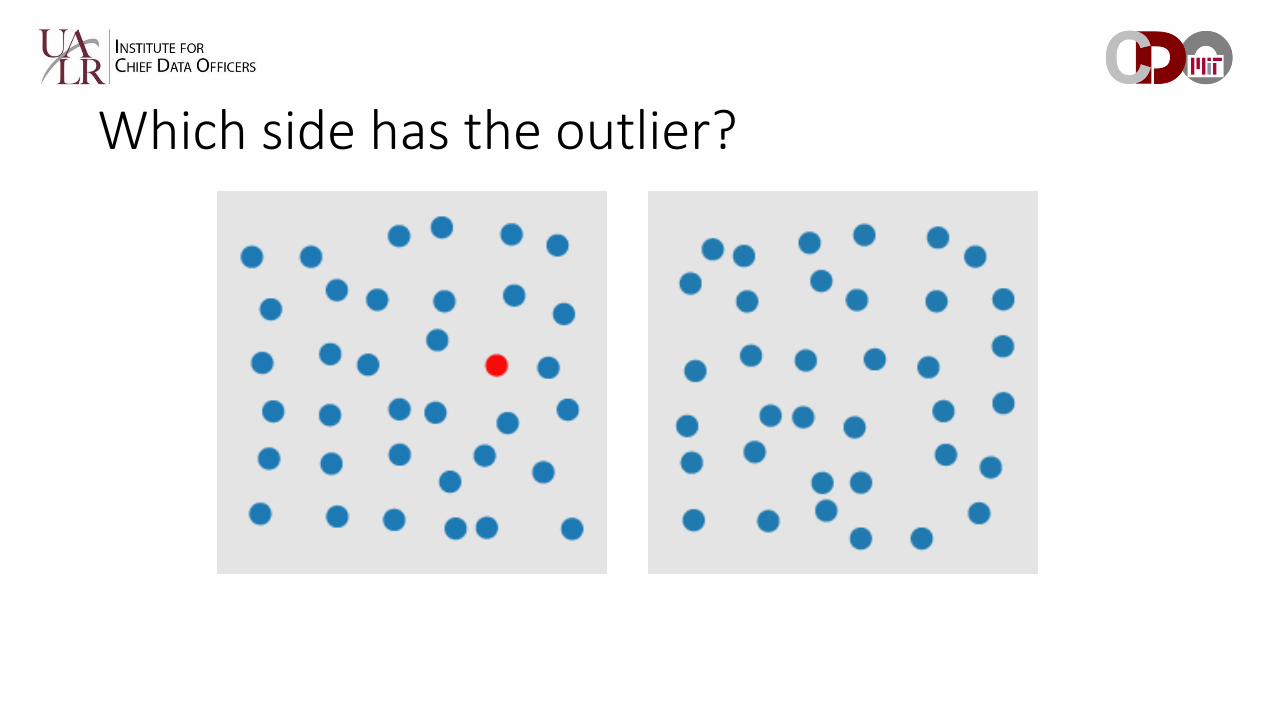
Which side has the outlier?

Which side has the outlier?

Which side has the outlier?

Conjunctionor, why to use a single channel at a time…
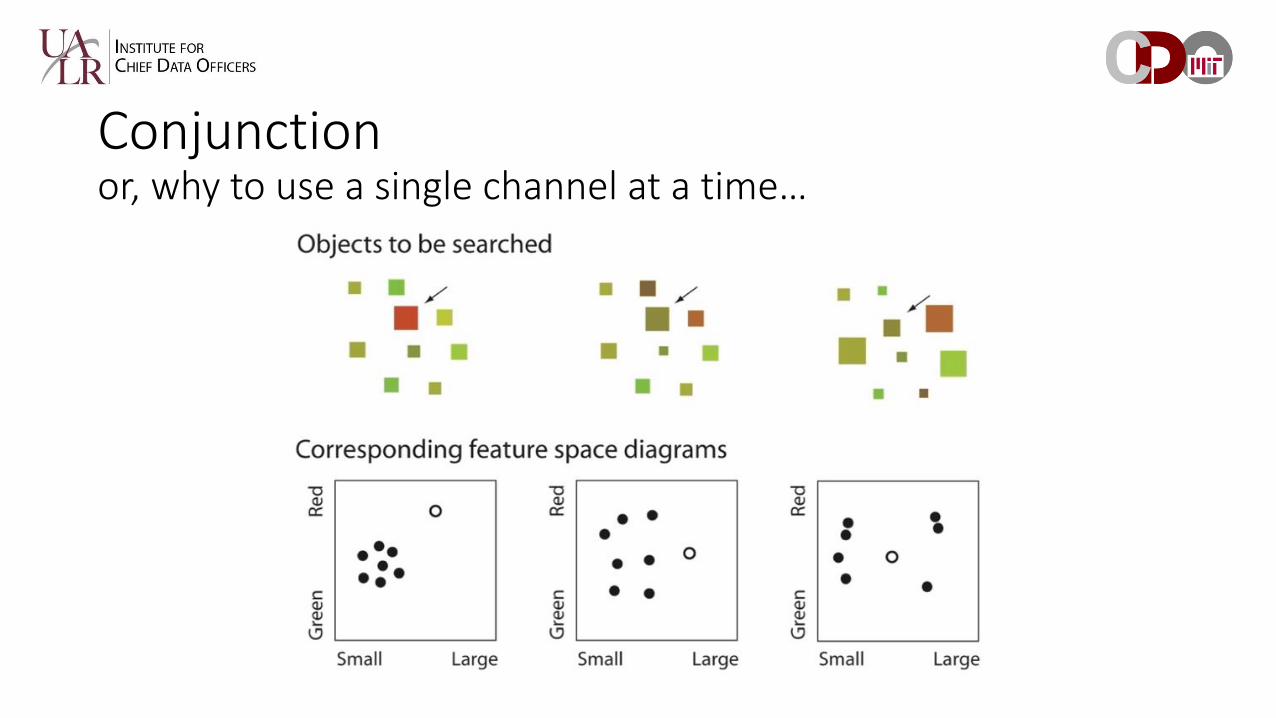
Conjunction or, why to use a single channel at a time…
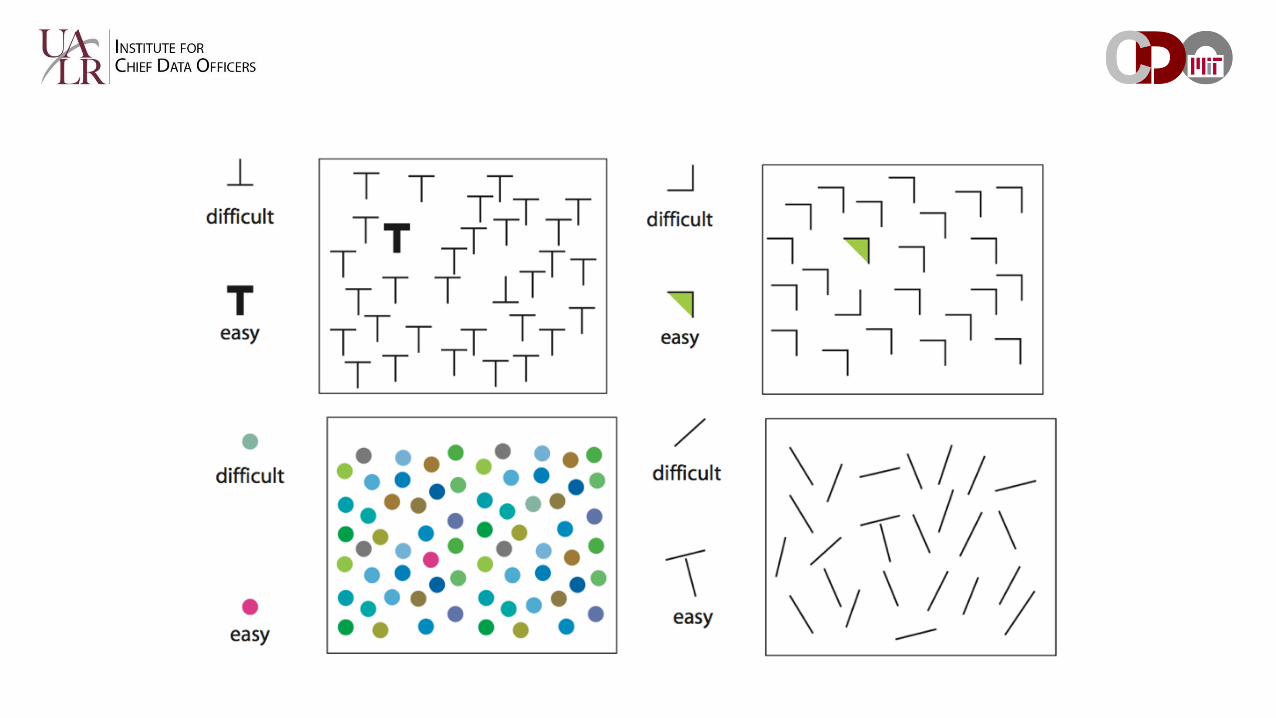
Takeaway
• We can easily see objects that are different in color and shape, or that are in motion
• Use color and shape sparingly to make the important information pop out.

Visual System Summary
• Our visual system is not a camera• Lots of processing at every level• Pretty much every perception is relative• Easy to deceive
• http://www.purveslab.net/see-for-yourself/• http://www.michaelbach.de/ot/
• Certain operations are pre-attentive• Still take attention, but almost no time• These are the useful ones!
• Mostly: perceiving outliers• Easy to overload

• Categorical• Names, Identifiers, Movie Genres, File types, …• No inherent ordering, can only compare equality
• Ordinal• Example: Shirt size, Rankings, …• Specific ordering, comparison possible• But no other operations
• Quantitative• Example: Age, Height, …• Mathematical operations possible• Sequential: range from min to max• Diverging: two opposing sequences with 0• Interval (0 arbitrary) vs. Ratio (0 fixed)
Data Attribute Types

Effectiveness

Existing Big Data Visualization Tools
• Many contenders:• D3, Google Fusion Tables, Many Eyes
• SAS, Infogram, Spotfire, Inxight
• Tableau
• Provide all the usual visualization types
• Post-processing approach
• Mostly 2D-orientedSource: http://tap-gmbh.com

Typical Big Data Visualization Process
1. Data gathering stage:• Diverse set of sources:
• Business Processes, Computational models, Laboratory experimentation, …
• Can take a long time
2. Data selection stage:• Decision on which part of the data is relevant to problem at hand
• Can produce first level of errors/misinformation:• Leave out relevant data
• Select subset that does not contain critical relationships/patterns
• Not enough data depth to capture key information
• Outdated data

Typical Big Data Visualization Process
3. Analysis stage:• Selecting “right” parameters for visualizations
• Selecting “right” set of visualizations to present
• Preparing “right” presentation order of visual information
4. Presentation to researchers:• Lots of static visualizations (some in the hundreds!)
• If listeners come up with a question about data that is not in visualization go back to analysis stage (but data may be missing all together) Significant time delay till research is completed

Human Memory
• Short term memory very small• Typically 4 ‘chunks of information’
• We’re just very good at making chunks count
• Challenge for Large/Complex Data• Screen resolution changes slowly
• Why is that a problem?• Need multiple pages/screens or scrolling
• Depend on memory for context
• Let’s look at a typical Big Data presentation…

3.0% 3.2%2.6%
1.8%
5.1%
0%
2%
4%
6%
8%
Overall Cluster 1 Cluster 2 Cluster 3 Cluster 4
% P
ati
en
ts
Pain Dx by Patient Cluster

3.1% 3.3% 3.2% 3.4% 2.2%3.7% 2.7% 2.3% 2.3%
10.2%
15.5% 16.6% 14.9% 12.5%
19.4%
76.9% 76.1% 75.4% 76.9%81.1%
0%
25%
50%
75%
100%
Overall Cluster 1 Cluster 2 Cluster 3 Cluster 4
% P
ati
en
ts
Co-Morbid Diagnoses by Patient Cluster

1.6
3.1 3.2
2.2
3.5
193 195 136 215
0
1
2
3
4
Overall Cluster 1 Cluster 2 Cluster 3 Cluster 4
# A
du
lts
Average Number of Adults per Household
1.49
0.25 0.26
0.12
0.53
17 18 8 35
0.0
0.4
0.8
1.2
1.6
Overall Cluster 1 Cluster 2 Cluster 3 Cluster 4
Avg
Nu
m.
Ch
ild
ren
per H
H
Average Number of Children Present in Household

78.6%
96.0% 94.0%
80.4%
91.3%
21.4%
3.1% 5.2%
15.4%
6.8%
0%
25%
50%
75%
100%
Overall Cluster 1 Cluster 2 Cluster 3 Cluster 4
% P
ati
en
tsResidence Status by Patient Cluster
Homeowner Renter
5.5%
1.8%
1.2%
4.6%
3.1%
32 22 56
0%
1%
2%
3%
4%
5%
6%
Overall Cluster 1 Cluster 2 Cluster 3 Cluster 4
% P
ati
en
ts
Spanish-speaking Potential by Patient Cluster

0%
5%
10%
15%
20%
25%
30%
35%
Month 3 Month 6 Month 9 Month 12 Month 15 Month 18 Month 21 Month 24
% o
f P
ati
en
ts
Persistence - 4 Cluster Solution
Overall
Cluster 1
Cluster 2
Cluster 3
Cluster 4

71.4%
84.7% 85.5%
74.4%81.9%
14.0%
3.3%6.1%
13.2%7.2%2.6%
2.8%1.2%
1.7% 1.4%8.2% 4.0% 3.0% 7.0% 5.8%
3.8% 5.3% 4.2% 3.8% 3.7%
0%
25%
50%
75%
100%
Overall Cluster 1 Cluster 2 Cluster 3 Cluster 4
% P
ati
en
ts
Ethnicity Distribution
Unspecified
Hispanic
Asian/Other
Black
White
27.7%
57.5%
37.4%
18.5%
43.4%
28.6%
20.6%
20.2%
24.0%
31.6%4.5%
2.4%
6.2%
5.0%
16.6%36.7%
17.5%
32.7%
49.9%
4.9%
2.5% 2.0% 3.5% 2.5% 3.5%
0%
25%
50%
75%
100%
Overall Cluster 1 Cluster 2 Cluster 3 Cluster 4
% P
ati
en
ts
Occupation Distribution
Other
Retired
Blue Collar
Sales
Professional
51.6%
70.8%
45.5% 48.4%41.2%
20.6%
20.6%
24.8%22.6%
23.6%
10.0%
5.5%
12.1% 11.2%
12.4%
17.7%
3.1%
17.6% 17.7%22.8%
0%
25%
50%
75%
100%
Overall Cluster 1 Cluster 2 Cluster 3 Cluster 4
% P
ati
en
ts
Geographic Distribution
Rural/Other
Small City
Medium City
Large City
$60,503
$129,956
$86,860
$62,162
$92,158
215 144 152
$0
$40,000
$80,000
$120,000
$160,000
Overall Cluster 1 Cluster 2 Cluster 3 Cluster 4
Avg
In
com
e (
US
D)
Annual Household Income

16.0%
11.9%10.1%
9.6%
8.6%
6.8%
6.6%
5.9%4.1%
20.5%
Patient Cluster 4 - Mosaic Variables
E: THRIVING BOOMERS
C: BOOMING WITH CONFIDENCE
N: PASTORAL PRIDE
D: SUBURBAN STYLE
I: FAMILY UNION
J: AUTUMN YEARS
L: BLUE SKY BOOMERS
H: MIDDLE-CLASS MELTING POT
B: FLOURISHING FAMILIES
All Other
28.7%
21.9%
11.1%
9.0%
5.5%
4.0%19.8%
Patient Cluster 1 - Mosaic Variables
C: BOOMING WITH CONFIDENCE
A: POWER ELITE
B: FLOURISHING FAMILIES
E: THRIVING BOOMERS
D: SUBURBAN STYLE
J: AUTUMN YEARS
All Other
16.0%
12.7%11.0%
10.8%
6.8%
6.6%
6.4%
6.3%4.9%
18.5%
Patient Cluster 2 - Mosaic Variables
C: BOOMING WITH CONFIDENCE
E: THRIVING BOOMERS
J: AUTUMN YEARS
Q: GOLDEN YEAR GUARDIANS
L: BLUE SKY BOOMERS
N: PASTORAL PRIDE
D: SUBURBAN STYLE
A: POWER ELITE
I: FAMILY UNION
All Other
17.1%
10.0% 9.4%
8.3%
8.0%
6.7%
6.0%
5.1%4.8%
4.7%
19.9%
Patient Cluster 3 - Mosaic Variables
Q: GOLDEN YEAR GUARDIANS
N: PASTORAL PRIDE
J: AUTUMN YEARS
E: THRIVING BOOMERS
L: BLUE SKY BOOMERS
C: BOOMING WITH CONFIDENCE
D: SUBURBAN STYLE
H: MIDDLE-CLASS MELTING POT
I: FAMILY UNION
K: SIGNIFICANT SINGLES
All Other
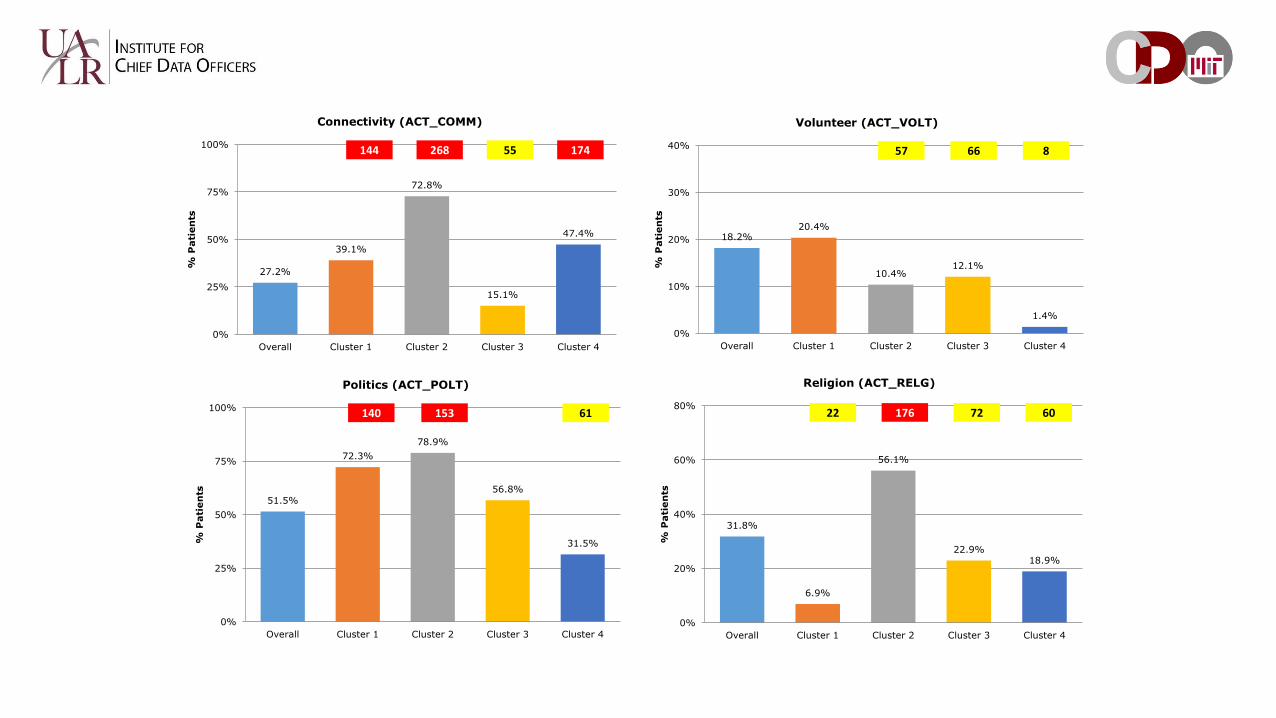
18.2%20.4%
10.4%12.1%
1.4%
0%
10%
20%
30%
40%
Overall Cluster 1 Cluster 2 Cluster 3 Cluster 4
% P
ati
en
ts
Volunteer (ACT_VOLT)
27.2%
39.1%
72.8%
15.1%
47.4%
0%
25%
50%
75%
100%
Overall Cluster 1 Cluster 2 Cluster 3 Cluster 4
% P
ati
en
ts
Connectivity (ACT_COMM)
144 268 17455 86657
51.5%
72.3%
78.9%
56.8%
31.5%
0%
25%
50%
75%
100%
Overall Cluster 1 Cluster 2 Cluster 3 Cluster 4
% P
ati
en
ts
Politics (ACT_POLT)
140 153 61
31.8%
6.9%
56.1%
22.9%18.9%
0%
20%
40%
60%
80%
Overall Cluster 1 Cluster 2 Cluster 3 Cluster 4
% P
ati
en
ts
Religion (ACT_RELG)
22 72 60176

62.5%
78.4% 81.1%
44.2%
96.5%
125 130 71 154
0%
25%
50%
75%
100%
Overall Cluster 1 Cluster 2 Cluster 3 Cluster 4
% P
ati
en
ts
Marital Status: Married*
1.8% 1.1% 1.0%
12.0%
35.1%
41.0%
22.6%16.2%
65.5%
28.5%
41.6%
41.1%
32.0%
20.2%
18.1%
13.0%
25.8%
31.1%
2.2%
18.3%
2.5%9.5%
19.7%
0%
25%
50%
75%
100%
Overall Cluster 1 Cluster 2 Cluster 3 Cluster 4
% P
ati
en
ts
Patient Age Distribution
76+
65-75
55-64
45-54
<45
12.5%
84.8% 87.5%
56.7%
95.6%
676 698 452 762
0%
25%
50%
75%
100%
Overall Cluster 1 Cluster 2 Cluster 3 Cluster 4
% P
ati
en
ts
Presence of Male(s) in Household
57.3
%
30.8
%
44.8
%
27.3
%
20.4
%
79.2
%
12.8
%
93.8
%
22.1
%
55.1
%
87.3
%
70.2
%
94.7
%
80.3
%
50.0
%
42.7
%
16.2
% 31.5
%
11.5
%
9.8
%
68.2
%
30.0
%
51.8
%
29.9
%
8.6
%
138
41
209
270
152
228
211
294
24575
53
7042
48
42
0%
25%
50%
75%
100%
Clothing/
Shoes
Dieting Fitness Spender Foreign
Travel
% P
ati
en
ts
Key Activities and Interests
Overall Cluster 1 Cluster 2 Cluster 3 Cluster 4

22.6
%11.6
%
33.0
%
764 511 524
0%
15%
30%
45%
60%
[A] [B] [C]
% P
ati
en
ts
62.5
%
78.4
%
125
0%
25%
50%
75%
100%
Overall Cluster
1
% P
ati
en
ts
57%
31% 4
5%
27% 41%
39%
20%
79%
13%
94%
22%
85%
86%
55%
138 41 209 210 219 270
0%
25%
50%
75%
100%
Clothing/
Shoes
Diet Fitness Spender Travel Domes.
Travel
Foreign
Travel
% P
ati
en
ts
Activities and Interests
Overall Cluster 1
26.4% 28.0%
2.7%2.7%
4.5%5.0%1.3%1.8%
0.0%
10.0%
20.0%
30.0%
40.0%
Overall Cluster 1
% P
ati
en
ts OTC Only
VE & HRT
HRT Only
VE Only
62.5%
78.4% 81.1%
44.2%
96.5%
125 130 71 154
0%
25%
50%
75%
100%
Overall Cluster 1 Cluster 2 Cluster 3 Cluster 4
% P
ati
en
ts
* Does not show “Single” or “Unknown”
1.8% 1.1% 1.0%
12.0%
35.1%41.0%
22.6%16.2%
65.5%28.5%
41.6%
41.1%
32.0%
20.2%
18.1%
13.0%
25.8%
31.1%
2.2%
18.3%
2.5%9.5%
19.7%
0%
25%
50%
75%
100%
Overall Cluster 1 Cluster 2 Cluster 3 Cluster 4
% P
ati
en
ts
76+
65-75
55-64
45-54
<45
12.5%
84.8% 87.5%
56.7%
95.6%
676 698 452 762
0%
25%
50%
75%
100%
Overall Cluster 1 Cluster 2 Cluster 3 Cluster 4
% P
ati
en
ts
57.3
%
30.8
%
44.8
%
27.3
%
20.4
%
79.2
%
12.8
%
93.8
%
22.1
%
55.1
%
87.3
%
70.2
%
94.7
%
80.3
%
50.0
%
42.7
%
16.2
%
31.5
%
11.5
%
9.8
%
68.2
%
30.0
% 51.8
%
29.9
%
8.6
%
138
41
209
270
152
228
211
294
24575
53
70 42 4842
0%
25%
50%
75%
100%
Clothing/Shoes
Dieting Fitness Spender ForeignTravel
% P
ati
en
ts
Overall Cluster 1 Cluster 2 Cluster 3 Cluster 4
1.6
3.1 3.2
2.2
3.5193 195 136 215
0
1
2
3
4
Overall Cluster 1 Cluster 2 Cluster 3 Cluster 4
# A
du
lts
1.49
0.25 0.26
0.12
0.53
17 18 8 35
0.0
0.4
0.8
1.2
1.6
Overall Cluster 1 Cluster 2 Cluster 3 Cluster 4
Avg
Nu
m.
Ch
ild
ren
per H
H

We don’t think this works
• Overwhelms and confuses users
• Too much time to answer a question or to follow a research thought
• Losing momentum and potential opportunities for discovery

How to solve?
• Need to put more information on one page/screen• High-resolution multi-monitors setups help
• Better:
1. Design custom, more compact/dense visualizations• Help, but still limited amount of detail information
2. Enable dynamic, interactive exploration• Show specific detail on demand
• Avoids ‘Let me come back tomorrow with more slides’ problem
• Ability to go back to overview quickly• Preserve/renew context

50 Bar Charts on One Screen…
Interactivity
• Not a well defined concept• For some people <60 sec response time is interactive…
• Our Goal: Interactive Exploration• Ability to scrub
• See responses while changing parameters• Not after change is finished
• Only effective for exploration with > 10 updates/sec
• Would like to do in a web-based system

The Case for Web-Based Systems
• Many modern systems are web-based
• Pros:• No need to write/install OS-specific software
• Effort, Support, Security, …
• Easy to update/upgrade/control access to• Data stays on the server• Interaction natural
• Cons:• Limited control over environment• Data needs to come over network – can make interactivity a challenge• Javascript…

Javascript
• Goal: scrubbing in large datasets in a browser environment• Store all data, filter needed data items, build graphical representation, display
it
• Javascript limits data sizes for interactive updates significantly• Memory & Performance overhead• Processing ~10k elements limit• Not enough…
• Better: Go graphics!
• Pass data straight through into graphics card, do everything there• Once data is on the card, almost no overhead• Problem: designed for graphics, non-trivial to use for other tasks

Does it work? What do we gain?
• Proof of concept: Parallel Coordinates• Standard technique for abstract information
visualization• Each record is represented as a line• Usage through interactive filtering
• Javascript/D3 implementation:• 10K records: ~1 update/sec• 1M records: out of memory
• Graphics card implementation:• 10K records: ~50 updates/sec• 1M records: 10 updates/sec or more• All filtering/selection/processing/drawing on the graphics card

Our vision for Big Data
• Put data at the fingertips of the users:• Interactive visualizations directly tied to computational models, simulations,
and databases
• New visual representations (capitalize on 3D and immersion)
• New methods to manage the data sizes and the throughput of the visualization system
• Take advantage of current and upcoming underlying technologies
• Embedded in standard tools
• Explore the appropriate platforms for each level of research and discovery

Our vision for Big Data – II
• “What if” scenarios with immediate feedback
• Enables wider range of alternative exploration, analysis and evaluation
• Faster and improved discovery process
• Potential to reduce misinterpretations and errors due to data omission or out-of-context interpretations
• Enhances many aspects of scientific research

Conclusion• Data is getting bigger, visual representations can help understand it• Human memory is bad, important to put as much information as possible
on one screen• Custom visualizations help
• Enable interactive exploration to analyze details on demand• Interactive: allow scrubbing, >10 updates/second• Advantageous to do in web environment
• Possible through use of Graphics Card Processing• Possible, not easy…
• More work needed to explore possibilities• Great potential for future explorations• Immersive, 3D systems for large-scale data exploration
Acknowledgements
• Visual Cortex Image by Selket: https://commons.wikimedia.org/w/index.php?curid=1679336