Data Visualization - Stanford University · Roadmap •Purpose of visualization •Exercise...
48
Data Visualization Andreas Paepcke 1
Transcript of Data Visualization - Stanford University · Roadmap •Purpose of visualization •Exercise...

Data Visualization
Andreas Paepcke
1

Roadmap
• Purpose of visualization
• Exercise
• History
• Scale types and their viz
• Multidimensional data
• Animation
• What to avoid; deception
• Exercise
2

A Piece of Rock
3

A Piece of Rock in Visualization Device
4

5

6

7
Reasons for visualizing?

Why Visualize?
Explanation
8

Why Visualize?
Convince
9

Why Visualize?
Deceive
10

Why Visualize?
Discover
11
Wait for it…
a few slides on…

Why Visualize?
Art
12 Slide cursor to bottom of black rectangle

Data to Music
13
2005 – June 2015

14

Exercise: Evidence of Alzheimer’s
15
Novel Age Distinct Words
Repeated phrases
Indefinite Words (%)
Styles 28 5027 7623 0.27
Adversary 32 5576 7320 0.39
Ackroyd 34 4833 7905 0.48
Orient 43 4692 8184 0.3 Appointment 47 4985 8071 0.39
Curtain 50 5131 7846 0.43
Towards Zero 51 4941 7680 0.5 Announced 59 5181 7596 0.45 Destination 63 5442 7426 0.36
Ordeal 67 4440 8221 0.58
Clocks 72 4827 8014 0.61
Endless 76 4159 8559 0.78
Frankfurt* 79 5583 7418 0.71
Nemesis 80 4631 8103 0.66 Elephants 81 3762 8821 1.02
Postern 82 4275 8249 1.23
“A horrible incident shocked Lord Ackley’s staff”
Indefinite words:
“Something horrible shocked Lord Ackley’s staff”
vs.
Repeated phrases:
“That sort of thing”
“All things considered”
Analysis of Agatha Christie novels

Roadmap
• Purpose of visualization
• Exercise
• History
• Scale types and their viz
• Multidimensional data
• Animation
• What to avoid; deception
• Exercise
16

John Snow: London Cholera Map
17
1854 Cholera outbreak Soho, London:

John Snow: London Cholera Map
18

Charles Minard 1869: Napoleon Expedition
19

20
Direction (color)
Distance (scale)
Location (labels)
Location/Time (relative positioning)
Temparatur (grid)
Troup strength (thickness)

Roadmap
• Purpose of visualization
• Exercise
• History
• Scale types and their viz
• Multidimensional data
• Animation
• What to avoid; deception
• Exercise
21

Variables Represent Data of Specific Types
22
World Region Europe North America Australia
Population 743M 529M 23M
Steel Production 136.792 megatons 75.516 megatons 3.265 megatons
Population and steel production in different world regions (Jan-Aug 2015):
Variable “worldRegion” {Europe, North America, Australia} Variable “population” a number >= 0 Variable “steelProduction” a number >= 0

Types of Scales
• Mutually exclusive
• No numerical significance
23
Nominal ≡ Categorical:
Green Red Yellow Color:
Products: Laptops Tables
If only two categories: Dichotomous
Nominal: “Name”

Example Visualizations
24
Nominal ≡ Categorical:
Vanilla Chocolate Strawberry
Shape:
Color:
Labels:

Types of Scales
• Order is significant…
• Difference is not
25
Ordinal:
Small Medium Large Milk shakes:
Mood: Unhappy Neutral Happy Ecstatic
Ordinal: “Order”

Example Visualizations
26
Ordinal:
Order:
Color intensity:
Dissatisfied Satisfied Highly satisfied

Types of Scales
• Order is significant…
• Differences known
• No zero value
27
10am 11am 12pm Time:
Temperature: (Fahrenheit)
70F 80F 90F 100F
Interval ≡ Continuous:
Interval: “Inter-value”

Example Visualizations
28
Interval:
Use distances:
Use height:
1 2 3 4 5 6 7
=
-1 0 -3 -2 …

Types of Scales
• Order is significant…
• Differences known
• Zero value exists
29
0in 10in 20in Width:
Temperature: (Kelvin)
Ratio:
Ratio: “Comparable”
70K 80K 90K 100K
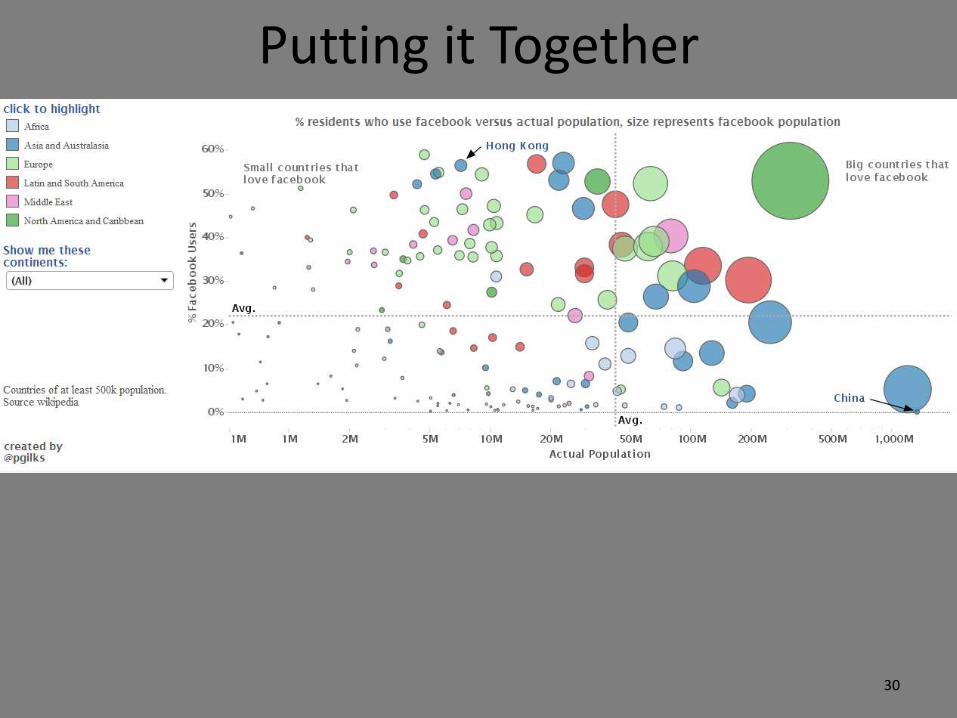
Putting it Together
30

Putting it Together
31
Position-X: Actual population; ratio Position-Y: Percentage Facebook users; ratio Color: Continents; nominal Size: Facebook population; ratio Dropline: Identify point in ratio: Avg
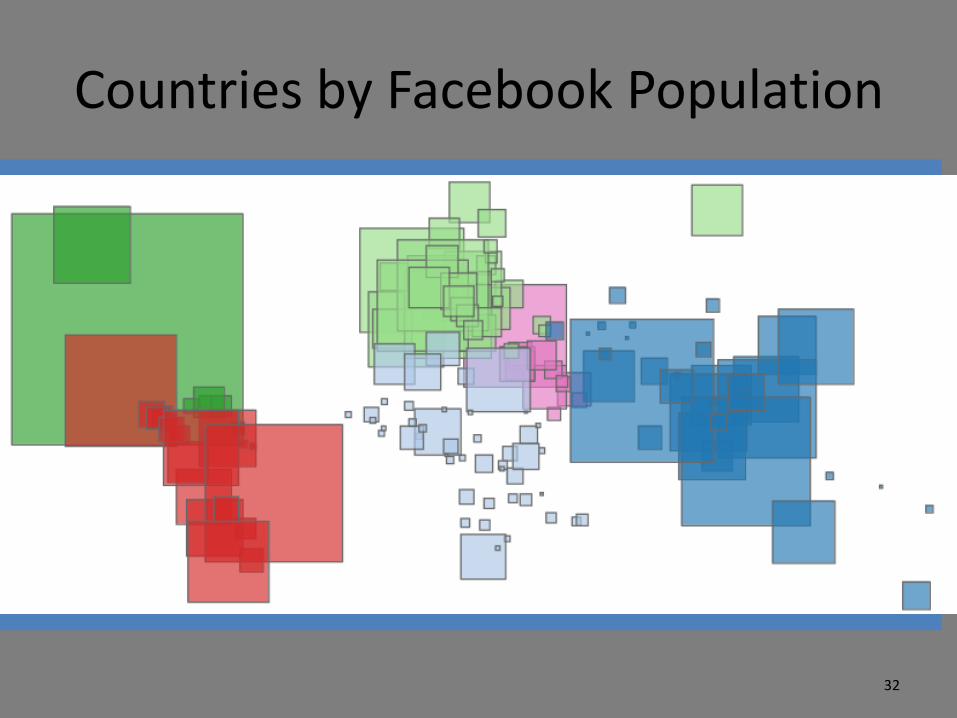
Countries by Facebook Population
32

What If I Have More Dimensions?
33
Click, and hope for
browser to appear

…or: Use Still Images
34

35

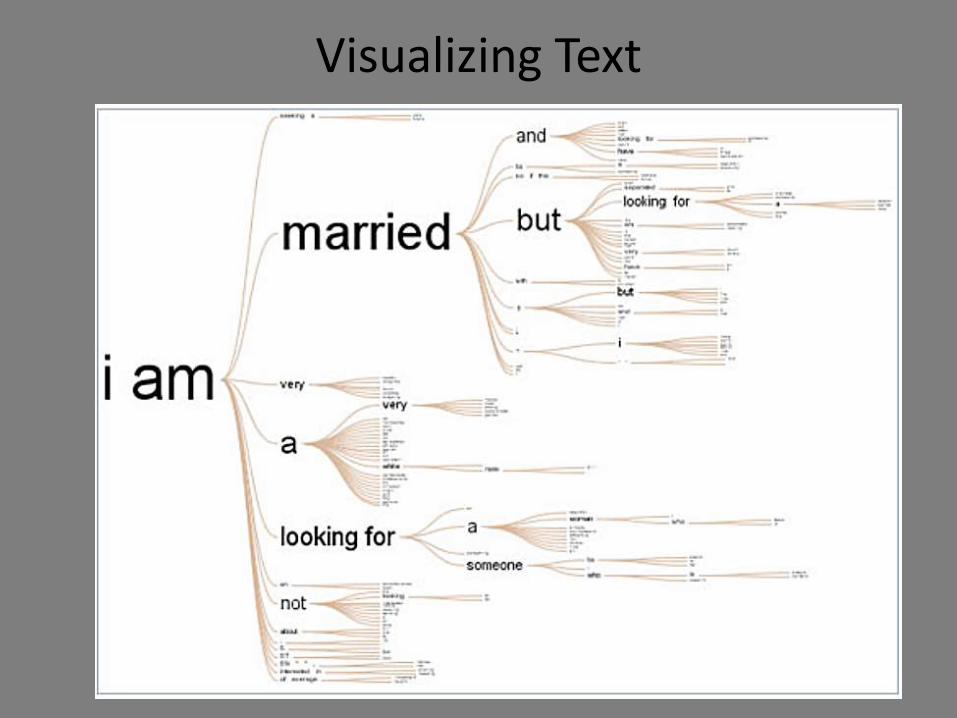
Visualizing Text
36
37
Visualizing Text

38

Roadmap
• Purpose of visualization
• Exercise
• History
• Scale types and their viz
• Multidimensional data
• Animation
• What to avoid; deception
• Exercise
39

Stop-and-Frisk Prevents Murders
40
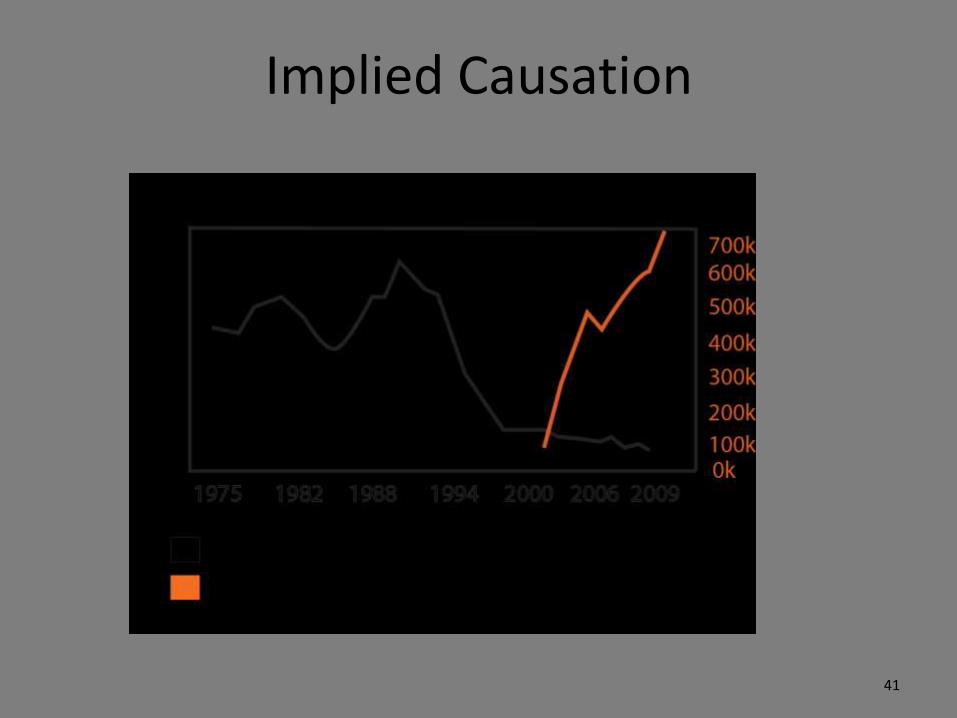
Implied Causation
41

Stanford Grads Richer Quicker
42

Partial Scale was Used
43

44
Wine sales California (2014)

45
Wine sales California (2014)
45

Careful With Color
46 Test your charts at http://bit.ly/1qSSJSu

Careful With Color
47 Test your charts at http://bit.ly/1qSSJSu
Original

Exercise: Presidential Greatness/IQ
48
Click…and hope
Click and hope
Class page: Pick up CSV data Tool: Past CSV data