Data Visualization in Social Science: Past, Present, and Future
36
Data Visualization in Social Science: Past, Present, and Future Lingfei Wu Postdoctoral Researcher Center for Behavior, Institutions and the Environment School of Human Evolution and Social Change, ASU [email protected]
Transcript of Data Visualization in Social Science: Past, Present, and Future

Data Visualization in Social Science: !Past, Present, and Future
Lingfei Wu
Postdoctoral Researcher Center for Behavior, Institutions and the Environment School of Human Evolution and Social Change, ASU

Miranda Priestly: Something funny? !!!Andy Sachs: No. No, no. Nothing's... You know, it's just that both those belts look exactly the same to me. You know, I'm still learning about all this stuff and, uh… !!!Miranda Priestly: 'This... stuff'? Oh. Okay. I see. You think this has nothing to do with you. You go to your closet and you select... I don't know... that lumpy blue sweater, for instance because you're trying to tell the world that you take yourself too seriously to care about what you put on your back. But what you don't know is that that sweater is not just blue, it's not turquoise. It's not lapis. It's actually cerulean. And you're also blithely unaware of the fact that in 2002, Oscar de la Renta did a collection of cerulean gowns. And then I think it was Yves Saint Laurent... wasn't it who showed cerulean military jackets? I think we need a jacket here. And then cerulean quickly showed up in the collections of eight different designers. And then it, uh, filtered down through the department stores and then trickled on down into some tragic Casual Corner where you, no doubt, fished it out of some clearance bin. However, that blue represents millions of dollars and countless jobs and it's sort of comical how you think that you've made a choice that exempts you from the fashion industry when, in fact, you're wearing the sweater that was selected for you by the people in this room from a pile of stuff.
http://www.imdb.com/title/tt0458352/quotes


!!!!Miranda Priestly: 'This... stuff'? Oh. Okay. I see. You think this has nothing to do with you. You go to your closet and you select... I don't know... that lumpy blue sweater, for instance because you're trying to tell the world that you take yourself too seriously to care about what you put on your back. But what you don't know is that that sweater is not just blue, it's not turquoise. It's not lapis. It's actually cerulean. And you're also blithely unaware of the fact that in 2002, Oscar de la Renta did a collection of cerulean gowns. And then I think it was Yves Saint Laurent... wasn't it who showed cerulean military jackets? I think we need a jacket here. And then cerulean quickly showed up in the collections of eight different designers. And then it, uh, filtered down through the department stores and then trickled on down into some tragic Casual Corner where you, no doubt, fished it out of some clearance bin. However, that blue represents millions of dollars and countless jobs and it's sort of comical how you think that you've made a choice that exempts you from the fashion industry when, in fact, you're wearing the sweater that was selected for you by the people in this room from a pile of stuff.

turquoise lapiscerulean
✔ ✗ ✗
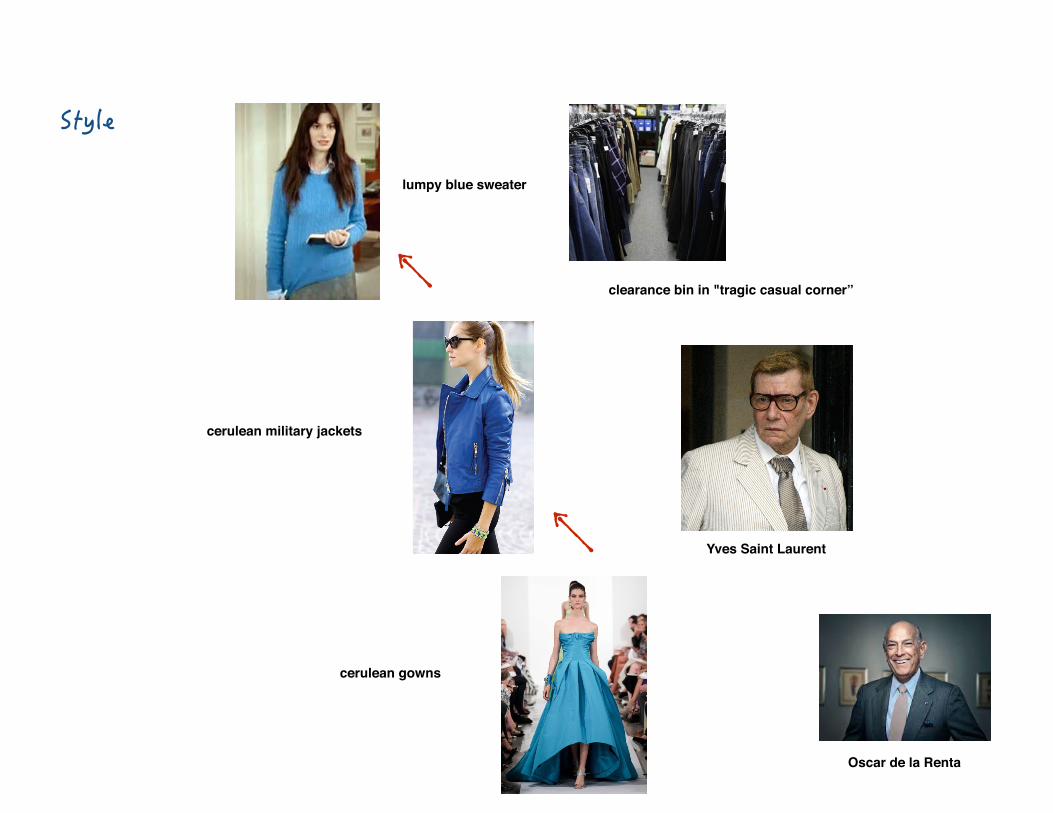
lumpy blue sweater
Oscar de la Renta
cerulean gowns
Yves Saint Laurent
cerulean military jackets
clearance bin in "tragic casual corner”


http://blog.visualmotive.com/2009/graph-visualization-edge-bundling/
http://www.aaronkoblin.com/work/flightpatterns/
Before Edge bundling
After Edge bundling
After tuning the colors and line widths
1. Be informative;
2. Be sensitive to colors and shapes;
3. Both of 1 and 2 come from practice;
4. I meant, a lot of practice;
5. Exploring the tradition helps.


http://en.wikipedia.org/wiki/Time_series
http://en.wikipedia.org/wiki/Bar_chart
http://en.wikipedia.org/wiki/Pie_chart
http://en.wikipedia.org/wiki/Correlation_and_dependence

William Playfair 1759-1823
http://en.wikipedia.org/wiki/William_Playfair
Time series
Bar chart
Pie chart
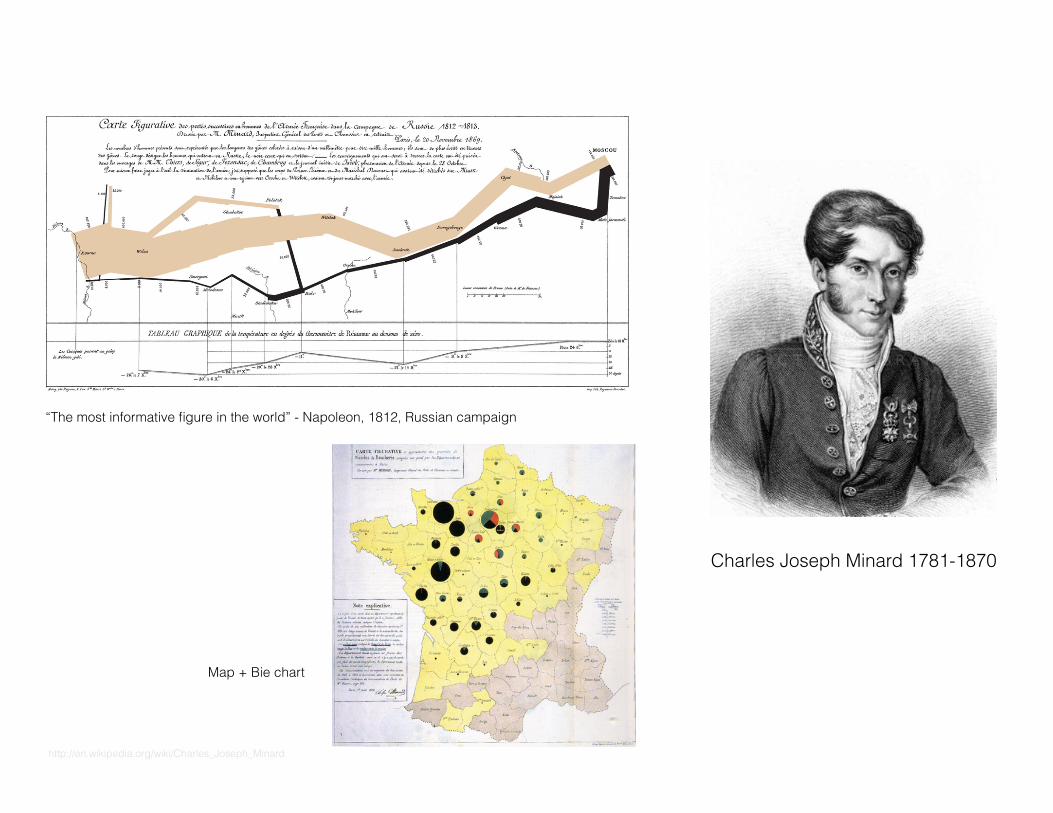
Charles Joseph Minard 1781-1870
“The most informative figure in the world” - Napoleon, 1812, Russian campaign
Map + Bie chart
http://en.wikipedia.org/wiki/Charles_Joseph_Minard

John Snow 1813-1858
http://en.wikipedia.org/wiki/John_Snow_(physician)
“Father of Modern Epidemiology” - 1854, London, Cholera

Sir Francis Galton 1822-1911
Galton's Fingerprints
http://www.galtoninstitute.org.uk/Newsletters/GINL9909/francis_galton.htm
Correlation and regression
http://en.wikipedia.org/wiki/Francis_Galton


!

http://nytlabs.com/

http
://bl
og.c
ount
er-s
trike
.net
/inde
x.ph
p/20
12/0
4/27
04/

https://www.facebook.com/note.php?note_id=469716398919

http://internet-map.net/

http
://w
ww.
aaro
nkob
lin.c
om/w
ork/
fligh
tpat
tern
s/

http
://jo
urna
ls.p
los.
org/
plos
one/
artic
le?i
d=10
.137
1/jo
urna
l.pon
e.00
0480
3

https://www.flickr.com/photos/nelsonminar/

http
s://w
ww.
flick
r.com
/pho
tos/
wal
king
sf

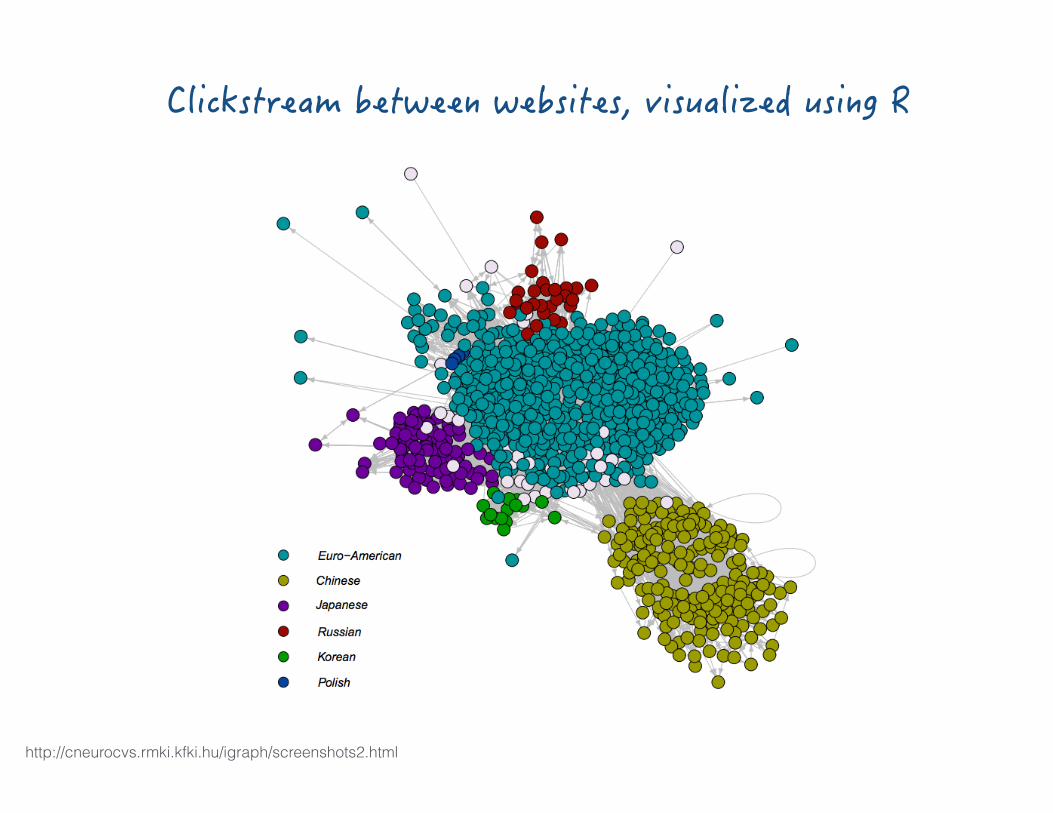
http://cneurocvs.rmki.kfki.hu/igraph/screenshots2.html

http://d3js.org/

https://www.youtube.com/watch?v=46RMw3bn2Sc&feature=youtu.be

Wu, L. (2014), Data Mining in Social Science, e-book, Available at http://lingfeiw.gitbooks.io/data-mining-in-social-science/

!
!
!
!

https://www.youtube.com/watch?v=Ew29FzodkxE