Data Verification, Analytics and Visualization · Data Verification, Analytics and Visualization...
42
Data Verification, Analytics and Visualization Wenhui Zhang, Roel Heremans, Christian Debes, Neha Thakre, Alexander Bauer, Manuel Görtz, Aleksandra Kovacevic The 2nd Asia–Pacific Water Summit Technical Workshop Chiang Mai, Thailand, 16 May 2013
Transcript of Data Verification, Analytics and Visualization · Data Verification, Analytics and Visualization...

Data Verification, Analytics and Visualization
Wenhui Zhang, Roel Heremans, Christian Debes, Neha Thakre, Alexander Bauer, Manuel Görtz, Aleksandra Kovacevic
The 2nd Asia–Pacific Water Summit Technical Workshop
Chiang Mai, Thailand, 16 May 2013
2
Agenda
• Smart sensors in water infrastructure
• Experiments and real-world implementation
• 3D sensor data visualization
• Dike stability models
• Sensor data verification and analytics
• Future extension
3
Smart sensors in water infrastructure
• Smart sensors in water infrastructure
• Need for intelligent water infrastructure management
• Enabling technologies: intelligent sensors
• Dike failure types and example monitoring
• Monitoring focus in the breach process
• Experiments and real-world implementations
• 3D sensor data visualization
• Dike stability models
• Sensor data verification and analytics
• Future extension
4
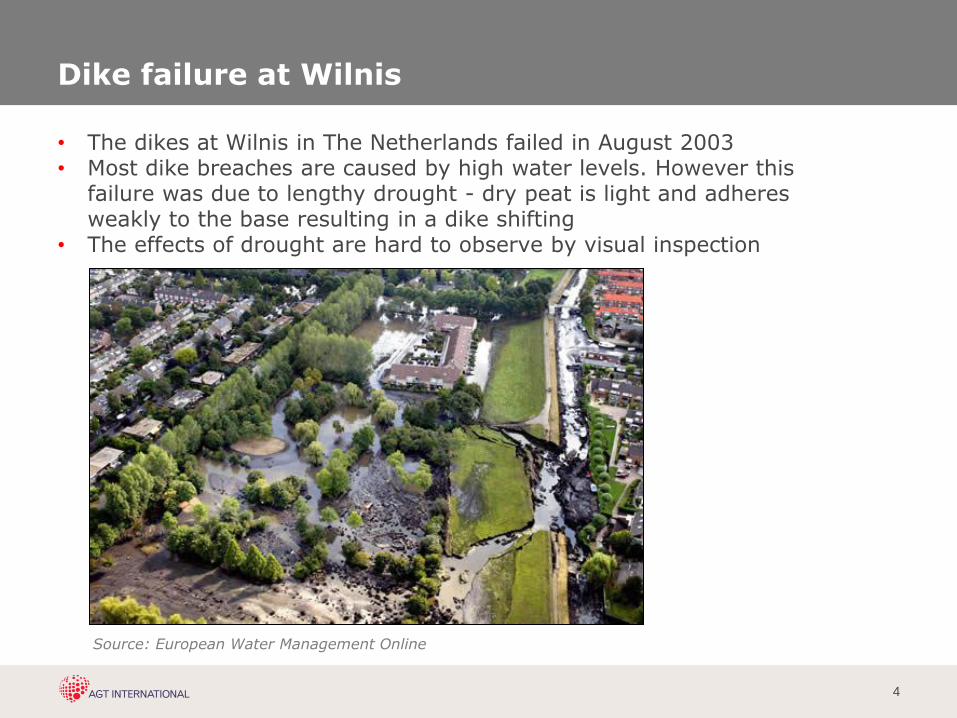
Dike failure at Wilnis
Source: European Water Management Online
• The dikes at Wilnis in The Netherlands failed in August 2003 • Most dike breaches are caused by high water levels. However this
failure was due to lengthy drought - dry peat is light and adheres weakly to the base resulting in a dike shifting
• The effects of drought are hard to observe by visual inspection
5
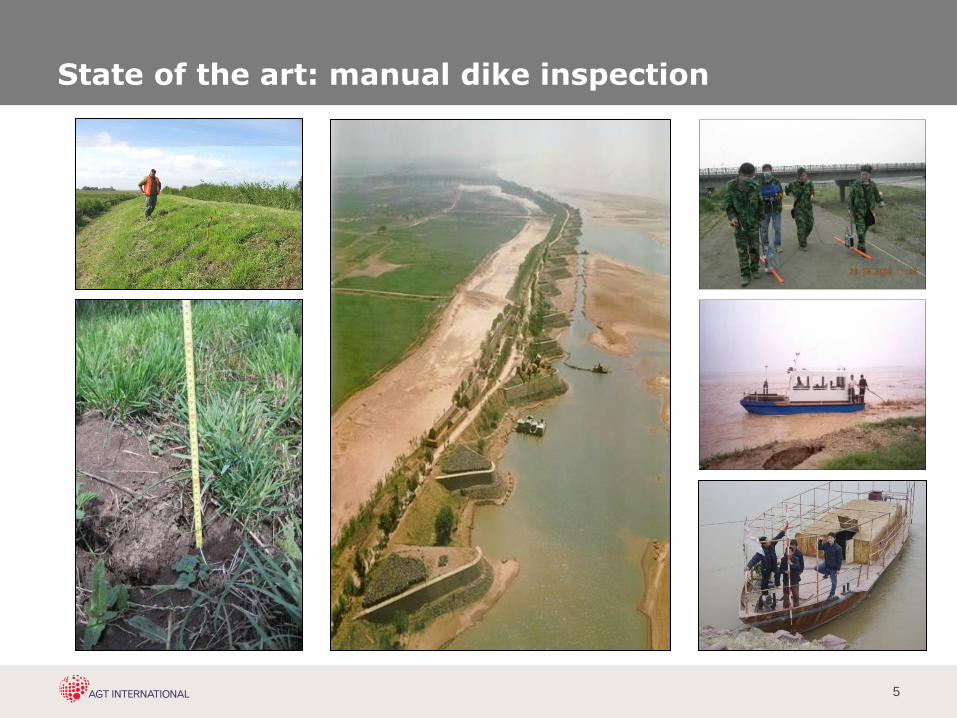
State of the art: manual dike inspection
6
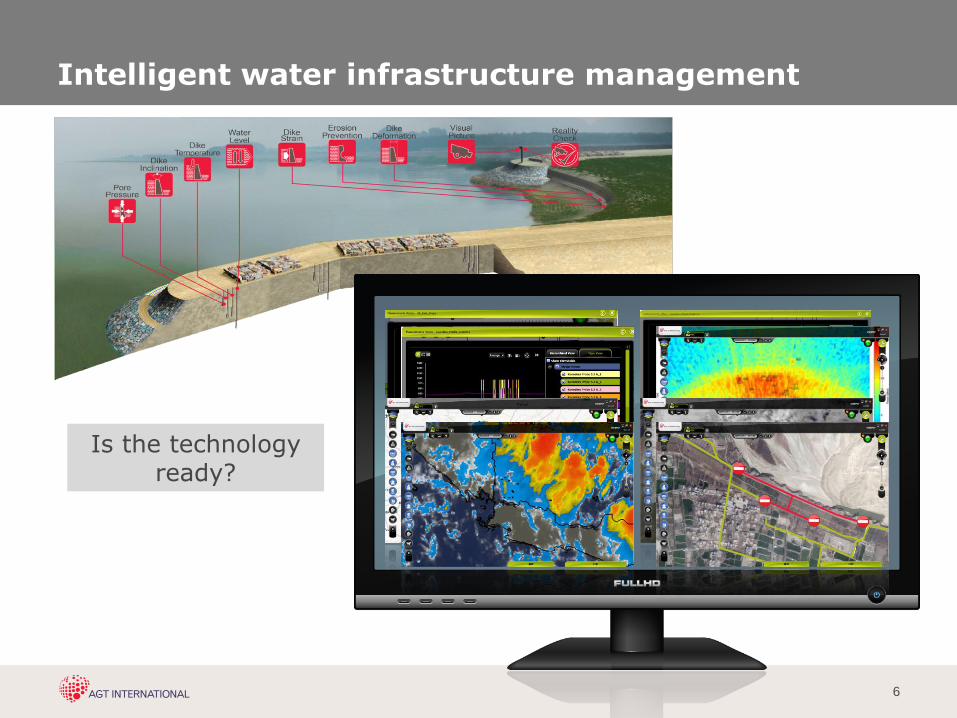
Intelligent water infrastructure management
Is the technology ready?
7
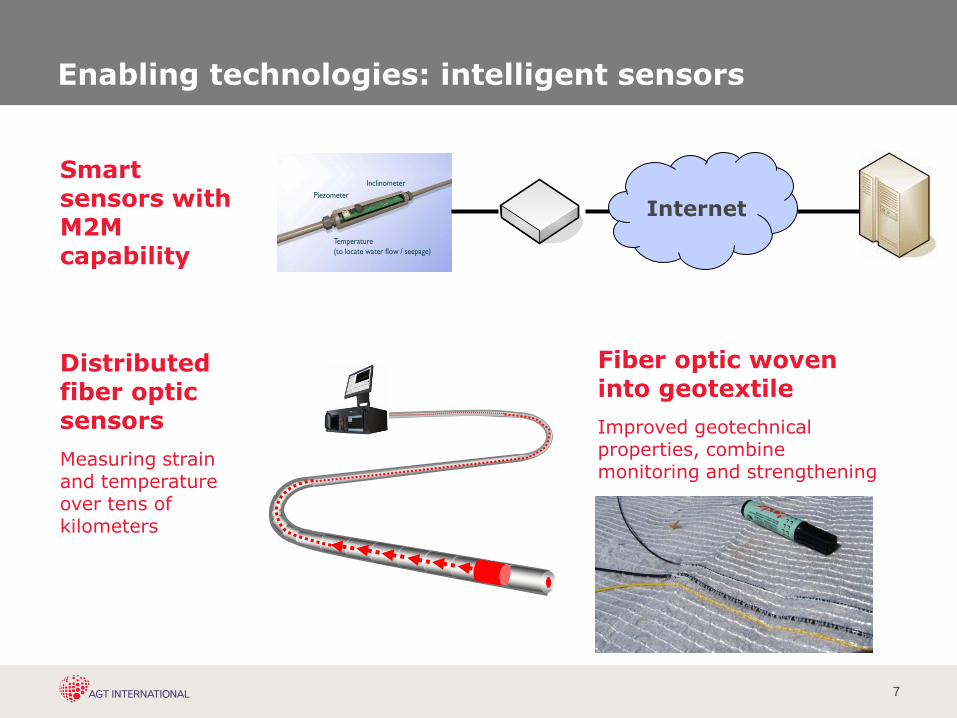
Enabling technologies: intelligent sensors
• Smart sensors with M2M capability
• Distributed fiber optic sensors
• Measuring strain and temperature over tens of kilometers
• Fiber optic woven into geotextile
• Improved geotechnical properties, combine monitoring and strengthening
Piezometer
Temperature
(to locate water flow / seepage)
Inclinometer
Internet
8
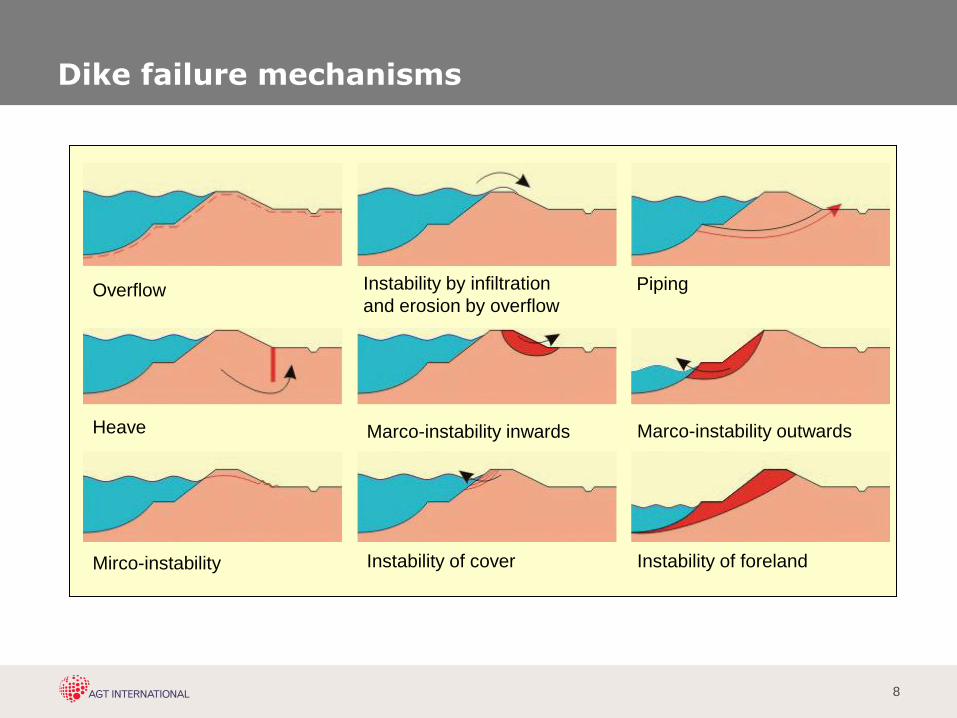
Dike failure mechanisms
Overflow Piping
Heave
Instability of cover
- instability outwards
Instability of foreland
Overflow Piping
Heave
Instability of cover
Marco-instability outwards
Instability of foreland
Instability by infiltration
and erosion by overflow
Marco-instability inwards
Mirco-instability
9
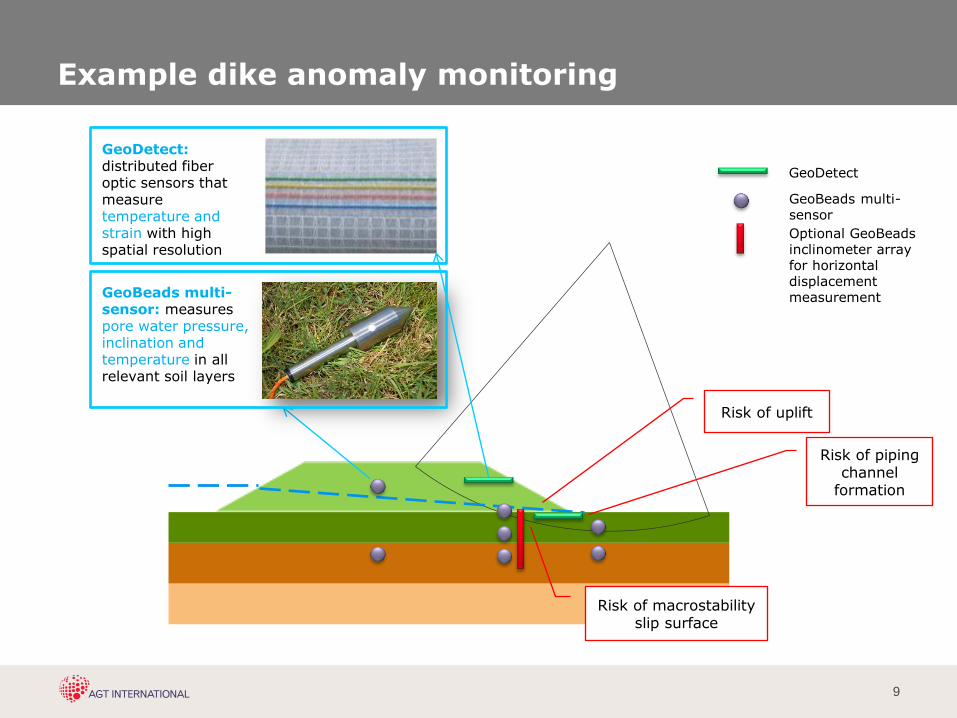
Example dike anomaly monitoring
Risk of piping channel
formation
Risk of uplift
Risk of macrostability slip surface
GeoBeads multi-sensor: measures pore water pressure, inclination and temperature in all relevant soil layers
GeoBeads multi-sensor
Optional GeoBeads inclinometer array for horizontal displacement measurement
GeoDetect
GeoDetect: distributed fiber optic sensors that measure temperature and strain with high spatial resolution
10
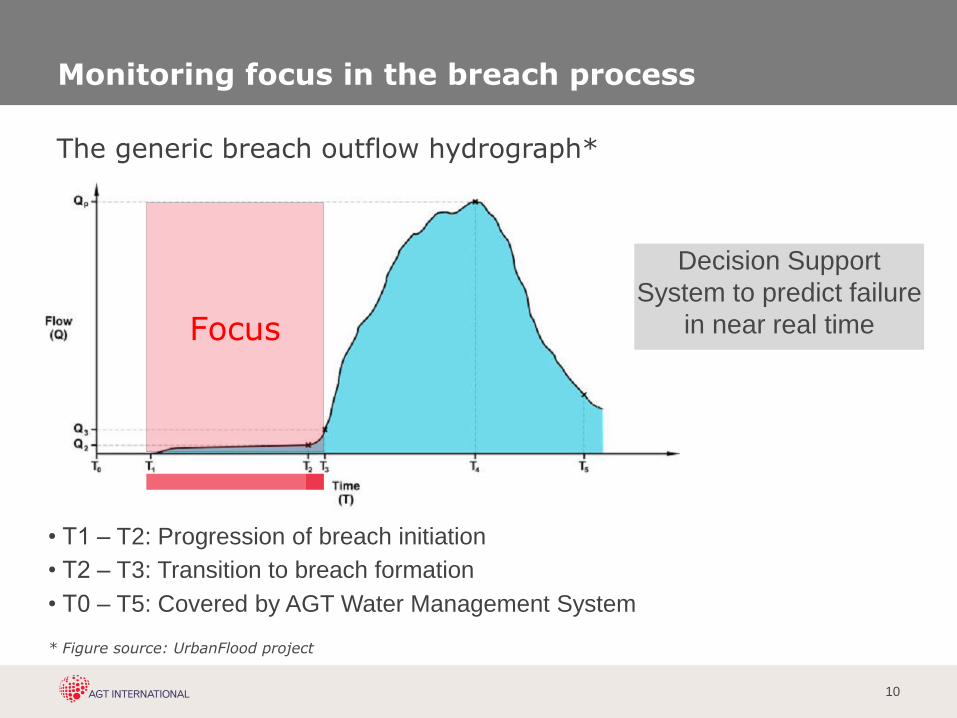
Monitoring focus in the breach process
* Figure source: UrbanFlood project
The generic breach outflow hydrograph*
Focus
• T1 – T2: Progression of breach initiation
• T2 – T3: Transition to breach formation
Decision Support
System to predict failure
in near real time
• T0 – T5: Covered by AGT Water Management System
11
Experiments and real-world implementations
• Smart sensors in water infrastructure
• Experiments and real-world implementations
• IJkdijk AIO SVT
• Yellow River project
• Livedijk Utrecht project
• 3D sensor data visualization
• Dike stability models
• Sensor data verification and analytics
• Future extension
12
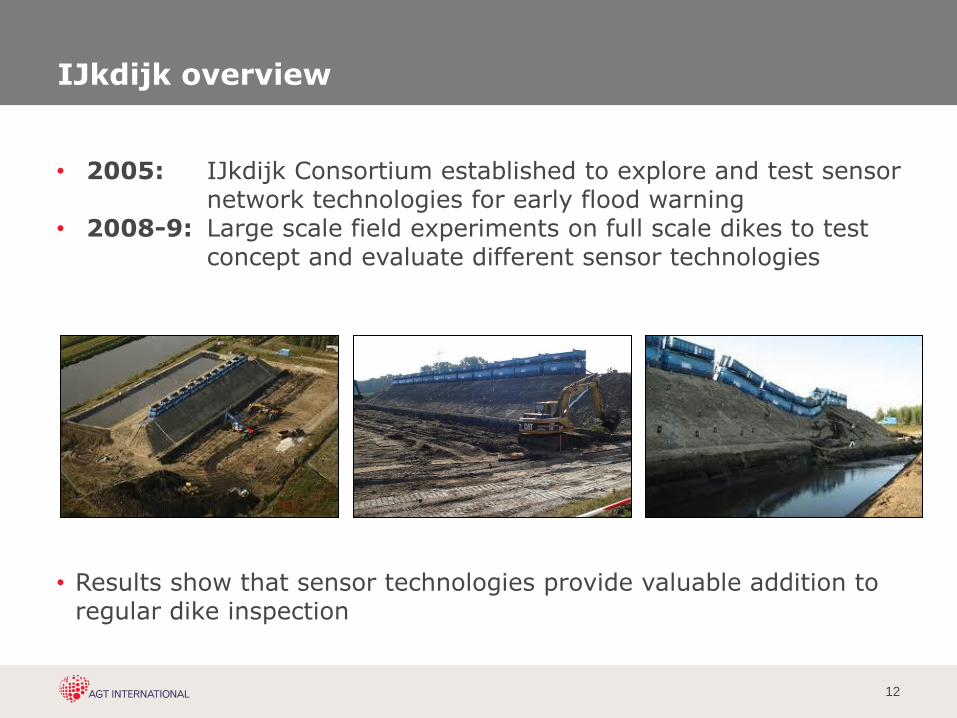
IJkdijk overview
• 2005: IJkdijk Consortium established to explore and test sensor network technologies for early flood warning
• 2008-9: Large scale field experiments on full scale dikes to test concept and evaluate different sensor technologies
• Results show that sensor technologies provide valuable addition to regular dike inspection
13
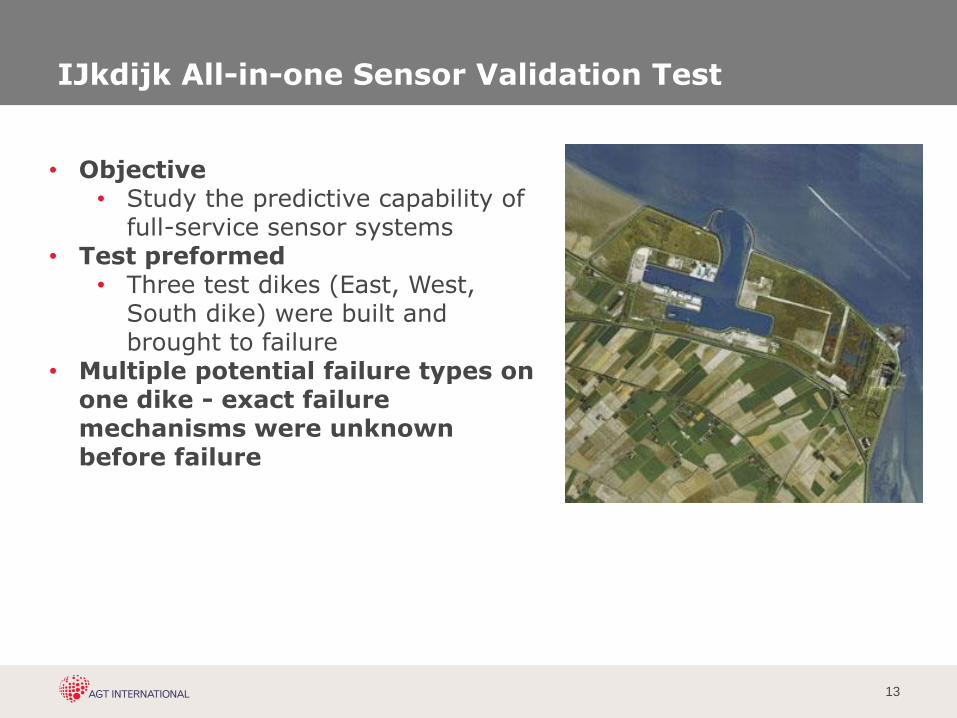
IJkdijk All-in-one Sensor Validation Test
• Objective • Study the predictive capability of
full-service sensor systems • Test preformed
• Three test dikes (East, West, South dike) were built and brought to failure
• Multiple potential failure types on one dike - exact failure mechanisms were unknown before failure
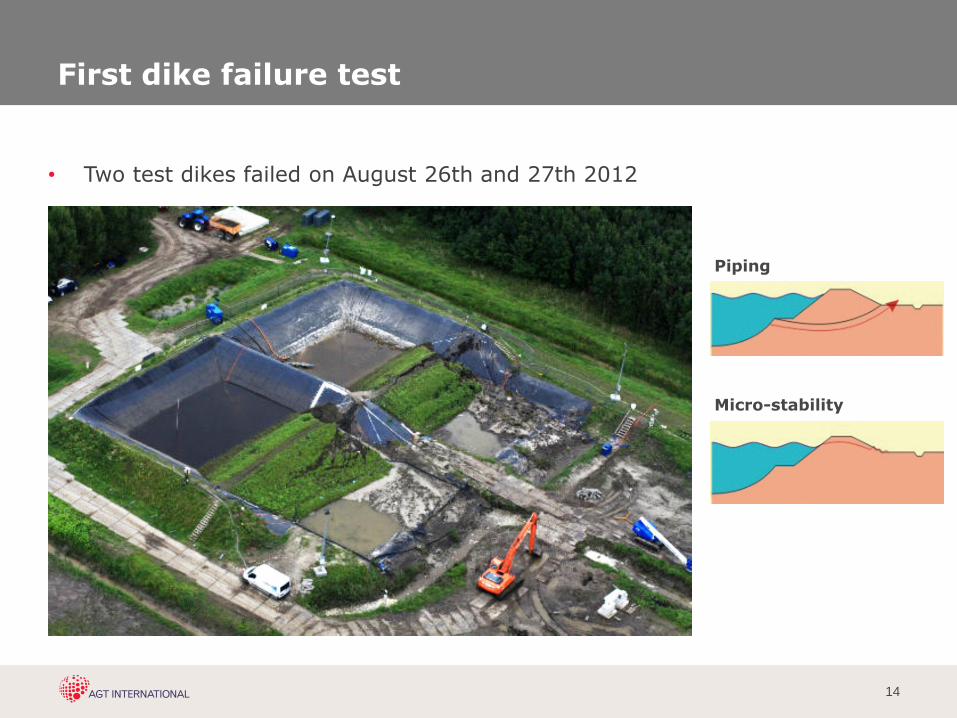
14
First dike failure test
• Two test dikes failed on August 26th and 27th 2012
Piping
Micro-stability
15
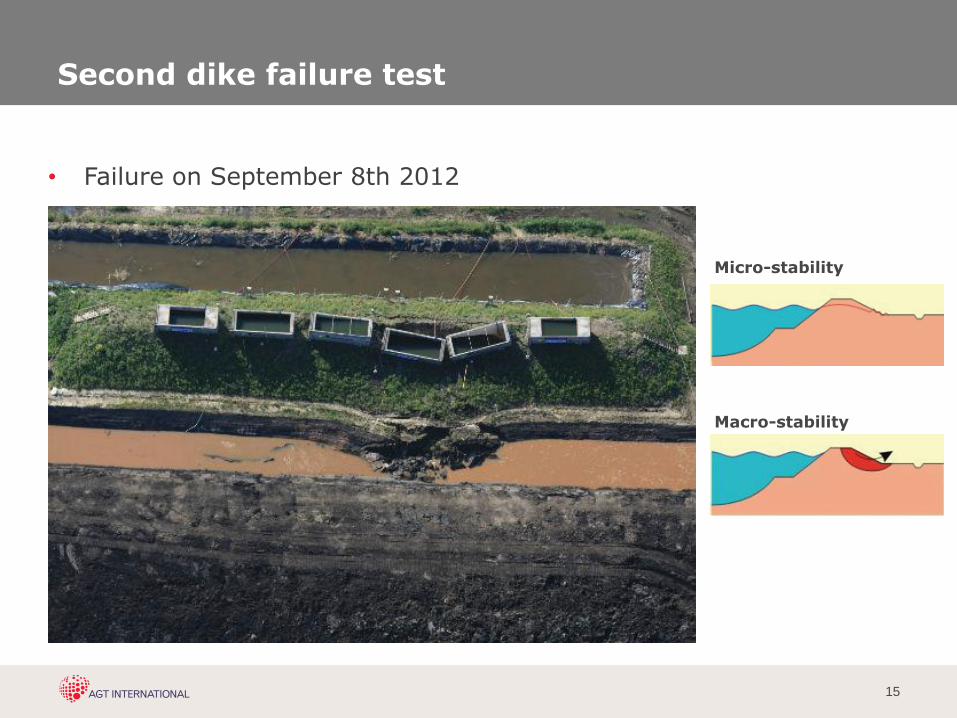
Second dike failure test
• Failure on September 8th 2012
Micro-stability
Macro-stability
16
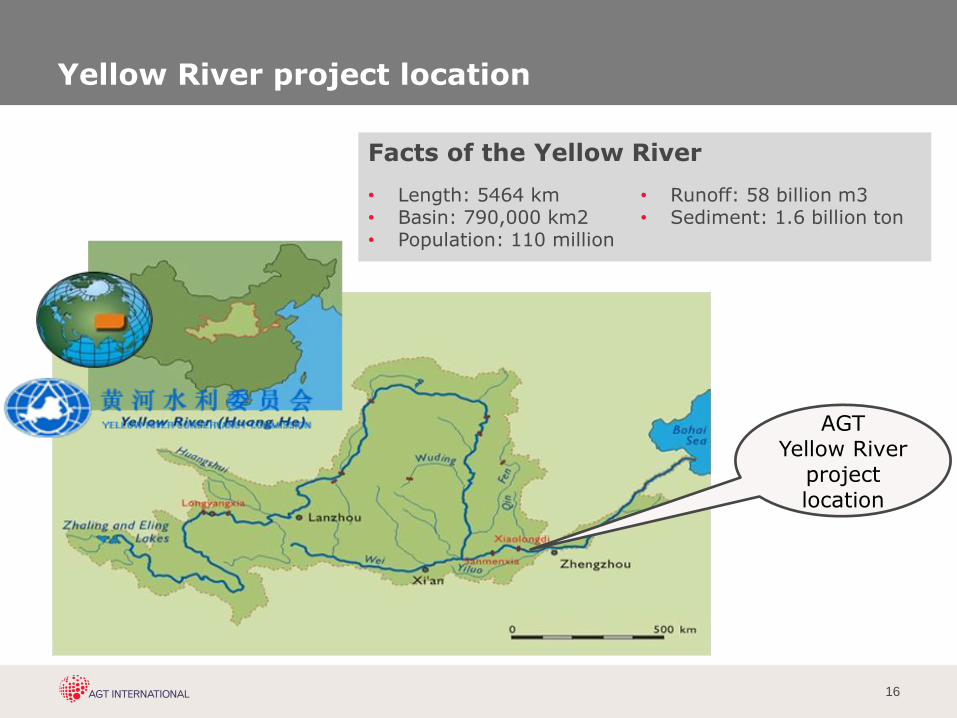
• Length: 5464 km • Basin: 790,000 km2 • Population: 110 million
• Runoff: 58 billion m3 • Sediment: 1.6 billion ton
Yellow River project location
AGT Yellow River
project location
Facts of the Yellow River
17
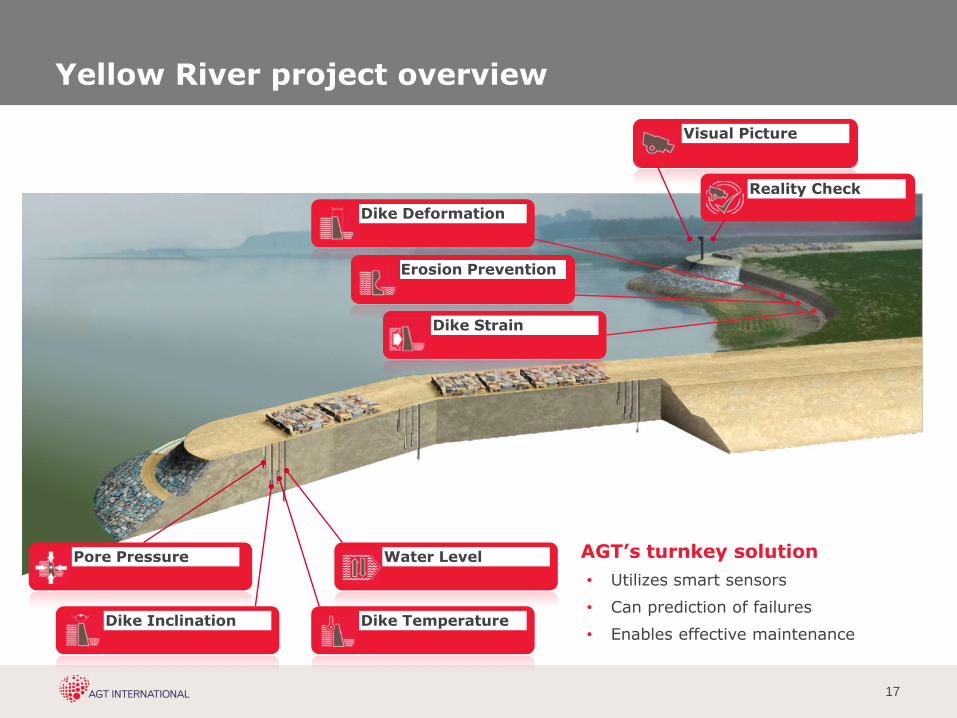
Pore Pressure
Dike Inclination Dike Temperature
Water Level
Dike Deformation
Erosion Prevention
Dike Strain
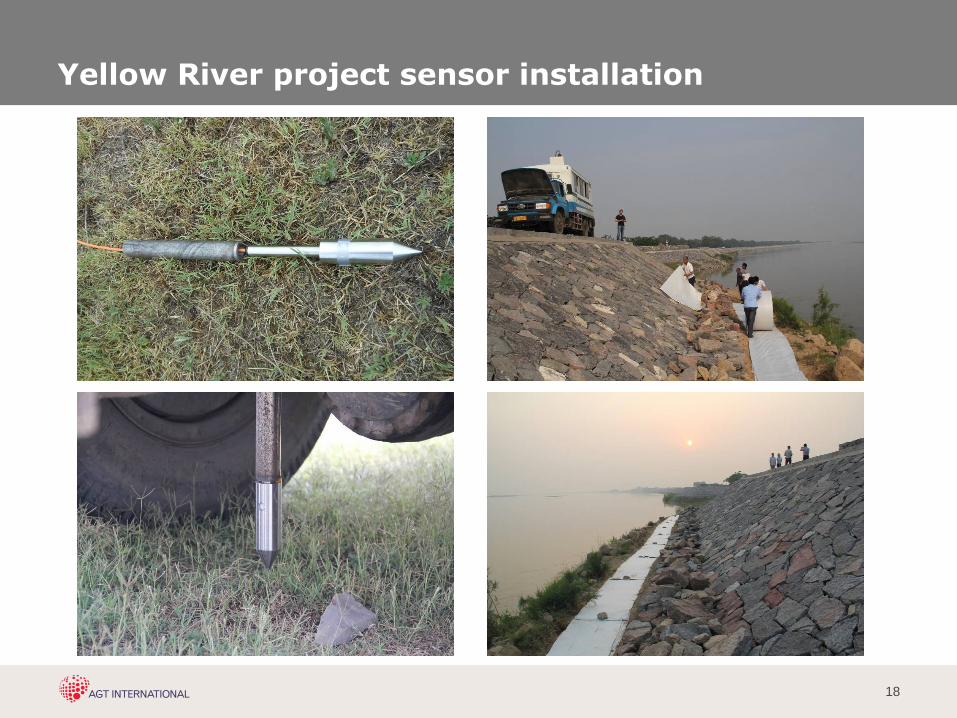
• AGT’s turnkey solution
• Utilizes smart sensors
• Can prediction of failures
• Enables effective maintenance
Yellow River project overview
Visual Picture
Reality Check
18
Yellow River project sensor installation
19
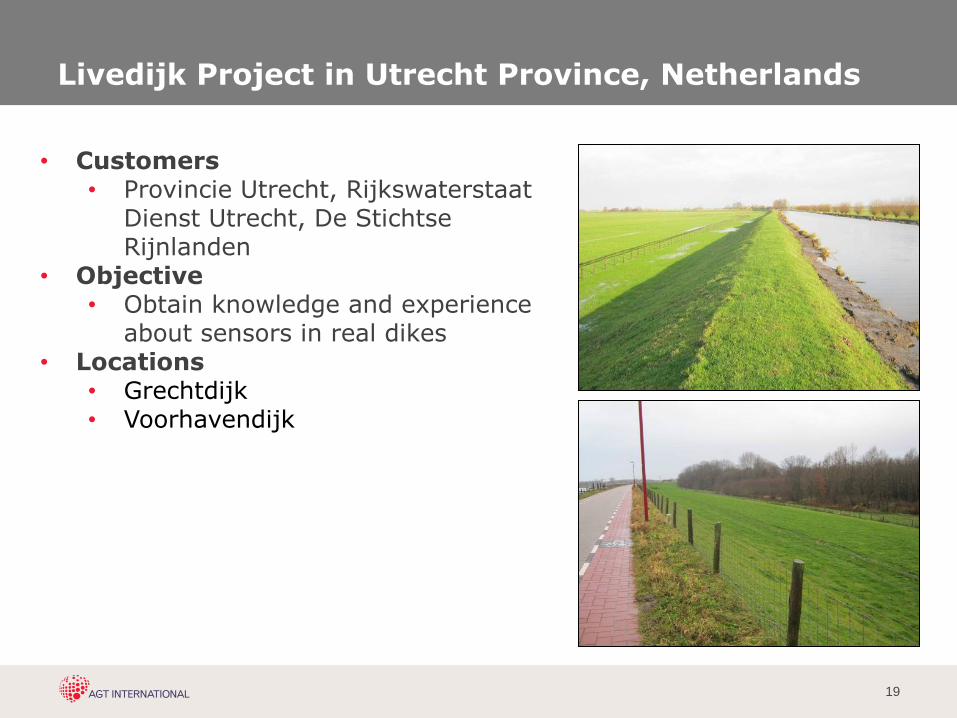
Livedijk Project in Utrecht Province, Netherlands
• Customers • Provincie Utrecht, Rijkswaterstaat
Dienst Utrecht, De Stichtse Rijnlanden
• Objective • Obtain knowledge and experience
about sensors in real dikes • Locations
• Grechtdijk • Voorhavendijk
20
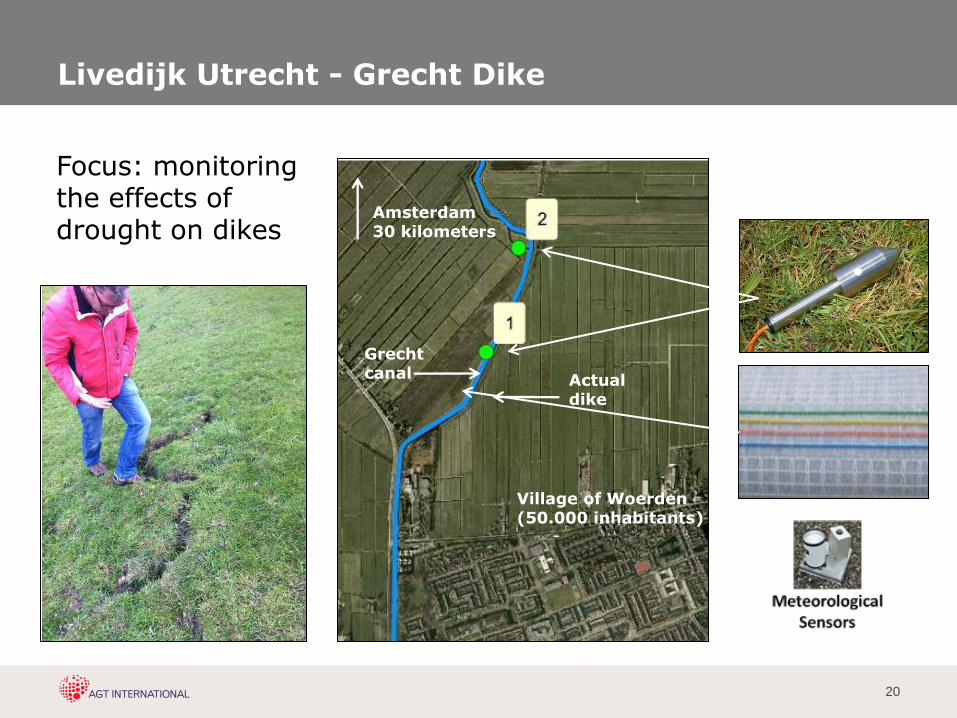
Livedijk Utrecht - Grecht Dike
Actual dike
Village of Woerden (50.000 inhabitants)
Grecht canal
Amsterdam 30 kilometers
Focus: monitoring the effects of drought on dikes
21
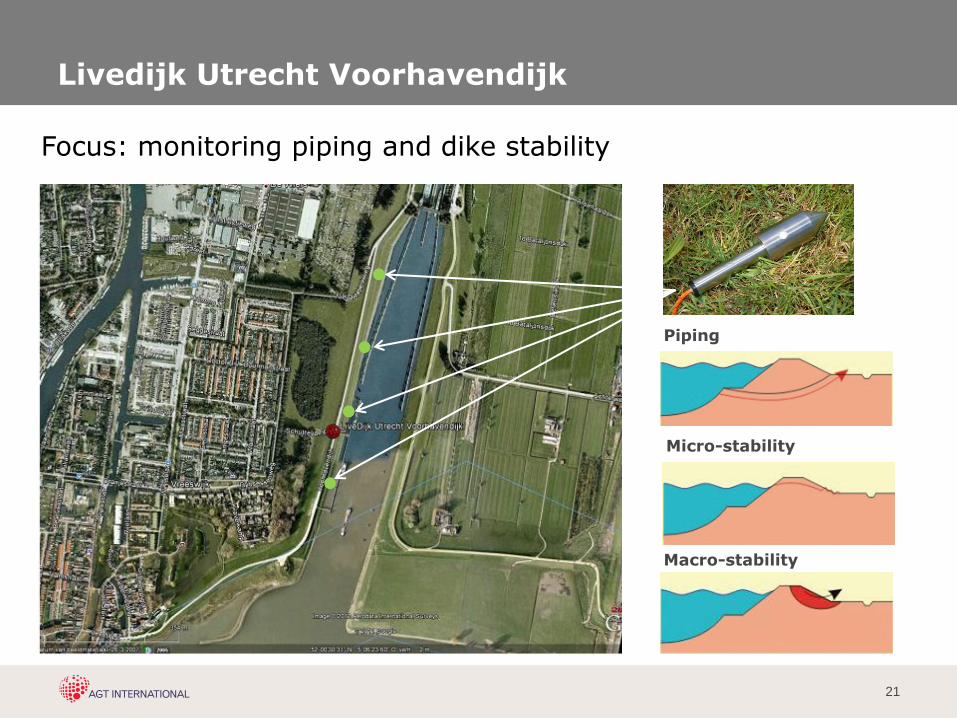
Livedijk Utrecht Voorhavendijk
Piping
Micro-stability
Macro-stability
Focus: monitoring piping and dike stability
22
3D sensor data visualization
• Smart sensors in water infrastructure
• Experiments and real-world implementations
• 3D sensor data visualization
• Sensor data verification and analytics
• Smart sensors in water infrastructure
• Future extension
23
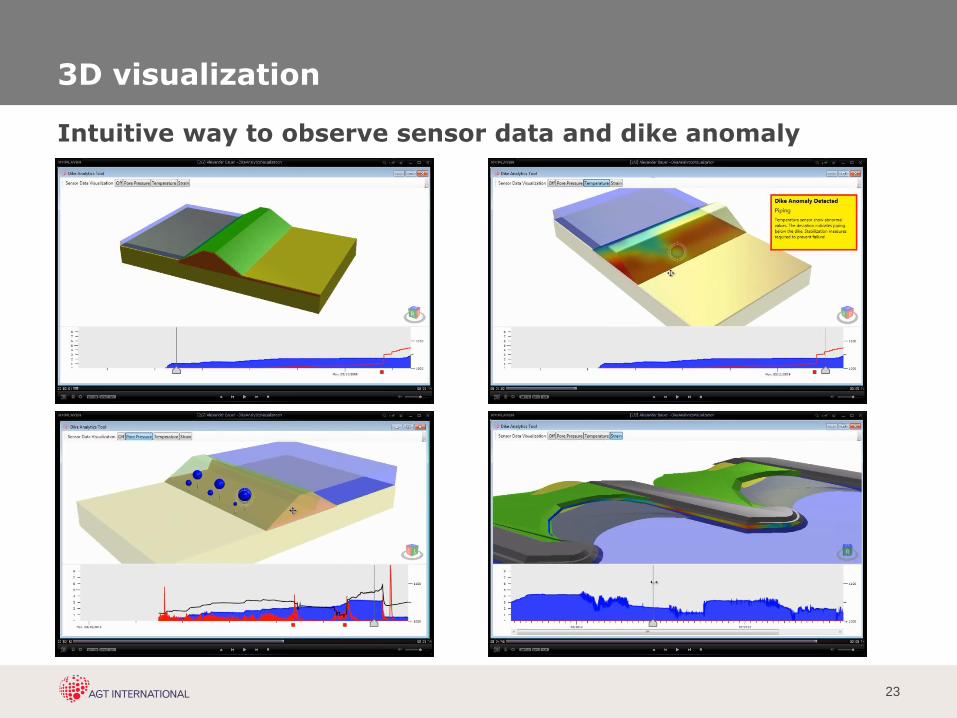
3D visualization
Intuitive way to observe sensor data and dike anomaly
24
Dike stability models
• Smart sensors in water infrastructure
• Experiments and real-world implementations
• 3D sensor data visualization
• Dike stability models
• Sensor data verification and analytics
• Future extension
25
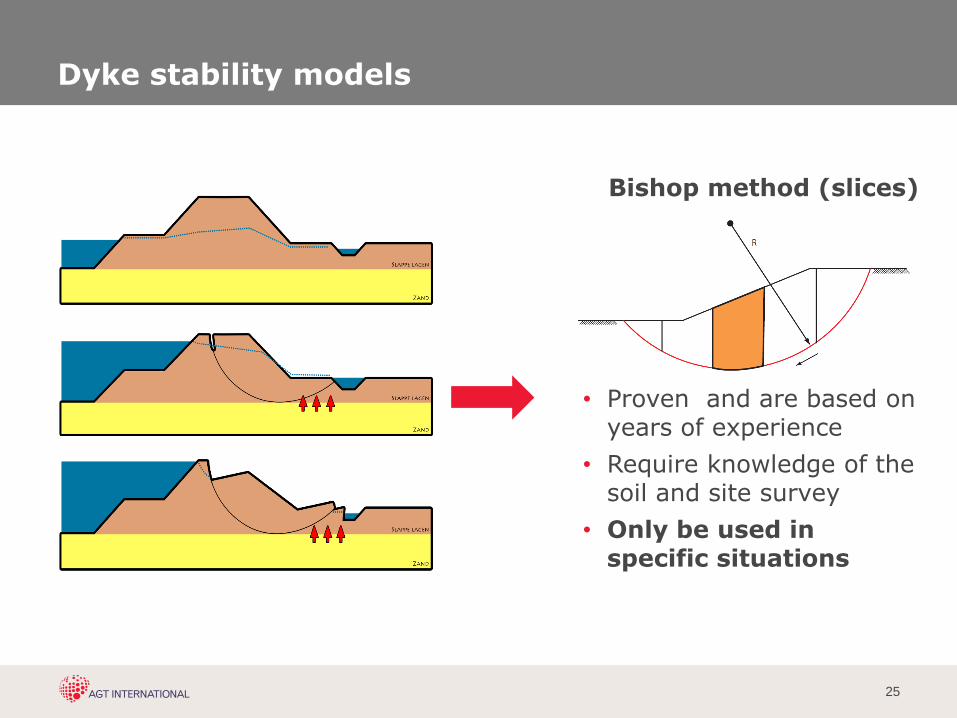
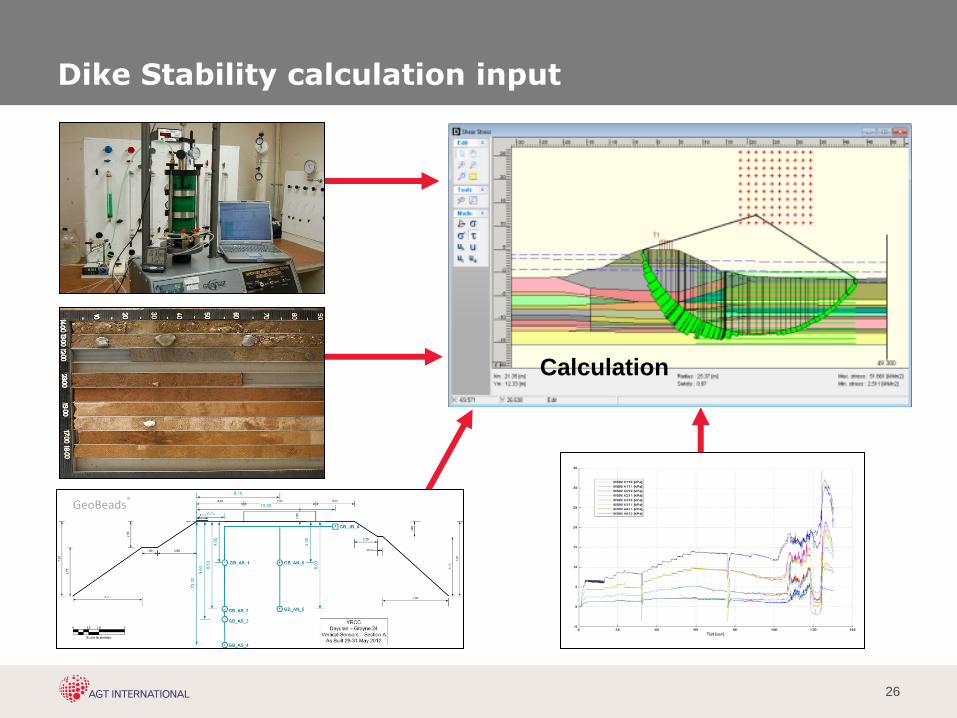
Bishop method (slices)
• Proven and are based on years of experience
• Require knowledge of the soil and site survey
• Only be used in specific situations
Dyke stability models
26
Calculation
Dike Stability calculation input
27
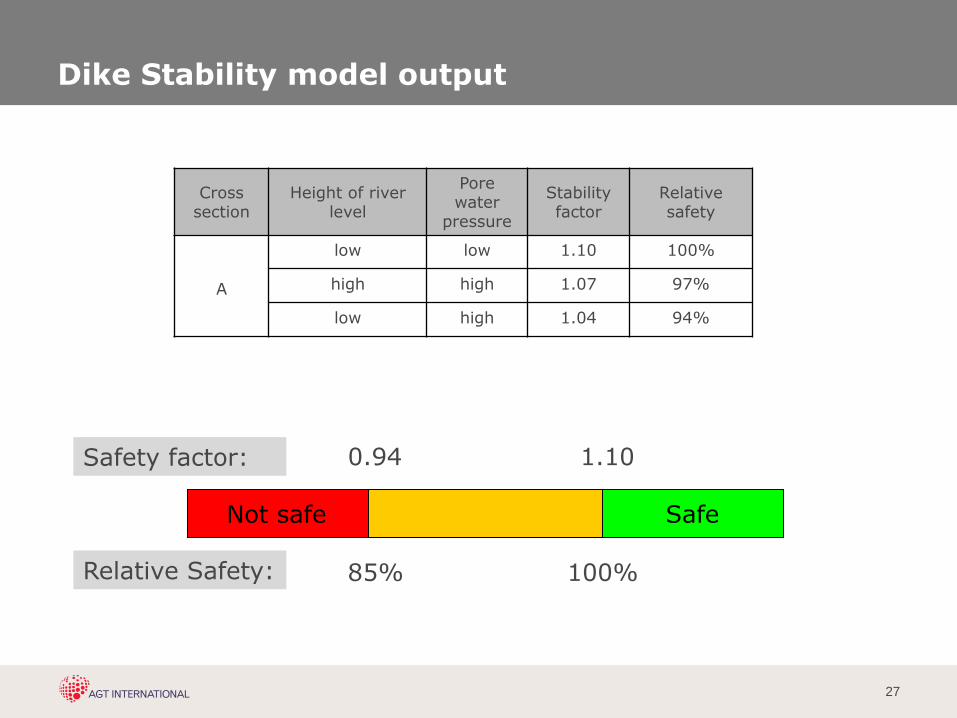
Cross section
Height of river level
Pore water
pressure
Stability factor
Relative safety
A
low low 1.10 100%
high high 1.07 97%
low high 1.04 94%
1.10 0.94 Safety factor:
85% 100%
Not safe Safe
Dike Stability model output
Relative Safety:
28
Sensor data verification and analytics
• Smart sensors in water infrastructure
• Experiments and real-world implementations
• 3D sensor data visualization
• Dike stability models
• Sensor data verification and analytics
• Data Cleansing
• Data-driven prediction
• Model-driven prediction
• Future extension
29
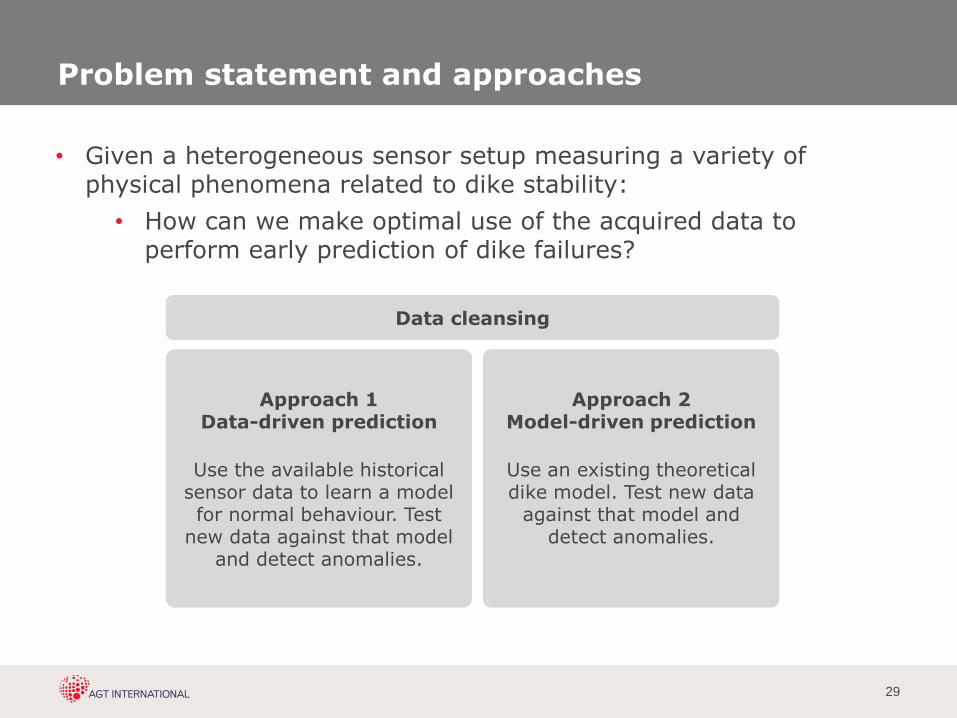
Problem statement and approaches
• Given a heterogeneous sensor setup measuring a variety of physical phenomena related to dike stability:
• How can we make optimal use of the acquired data to perform early prediction of dike failures?
Approach 1 Data-driven prediction
Use the available historical
sensor data to learn a model for normal behaviour. Test
new data against that model and detect anomalies.
Approach 2 Model-driven prediction
Use an existing theoretical dike model. Test new data
against that model and detect anomalies.
Data cleansing
30
Data pre-processing: Data cleansing
31
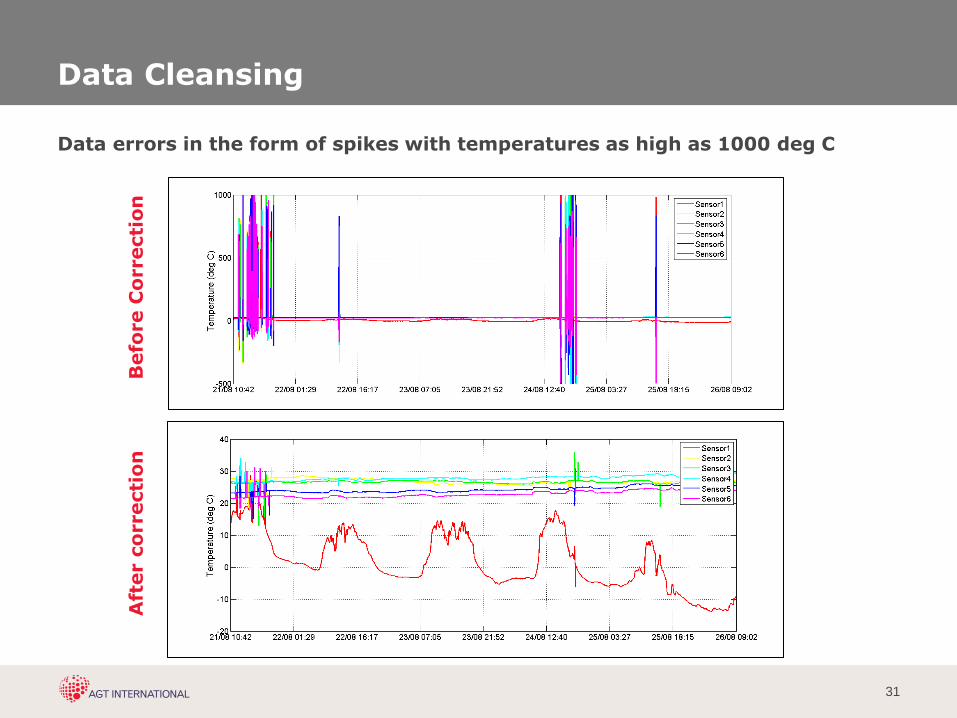
Data Cleansing
Data errors in the form of spikes with temperatures as high as 1000 deg C
•A
fter c
orrecti
on
•B
efo
re C
orrecti
on
32
Approach 1
Data-driven prediction
33
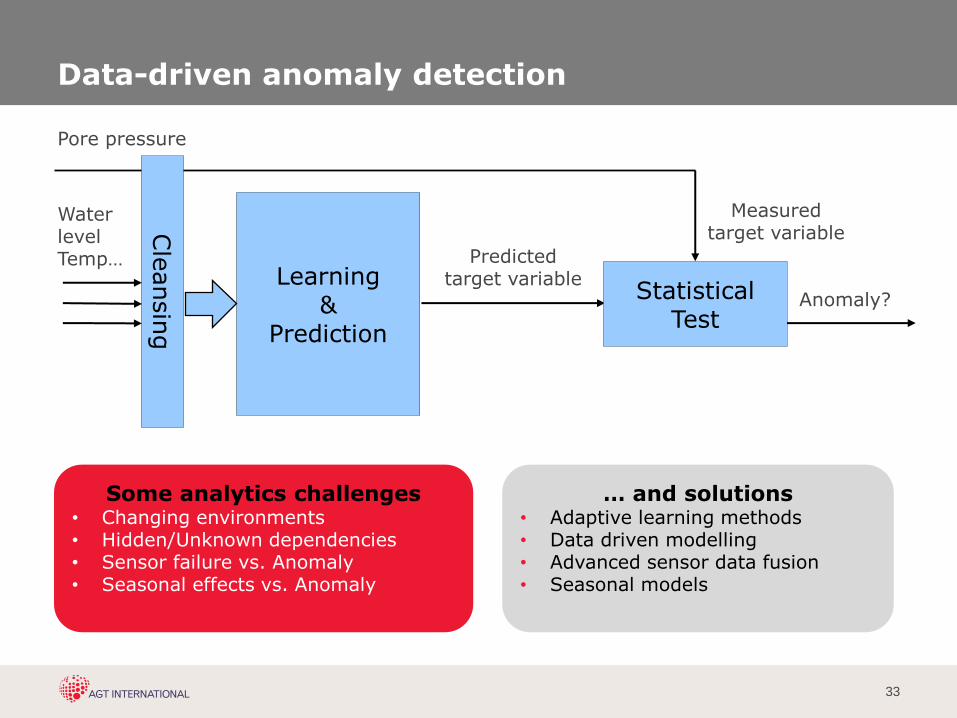
Data-driven anomaly detection
Learning &
Prediction
Water level Temp…
Pore pressure
Predicted target variable
Statistical Test
Measured target variable
Anomaly?
Some analytics challenges • Changing environments • Hidden/Unknown dependencies • Sensor failure vs. Anomaly • Seasonal effects vs. Anomaly
… and solutions • Adaptive learning methods • Data driven modelling • Advanced sensor data fusion • Seasonal models
Cle
ansin
g
34
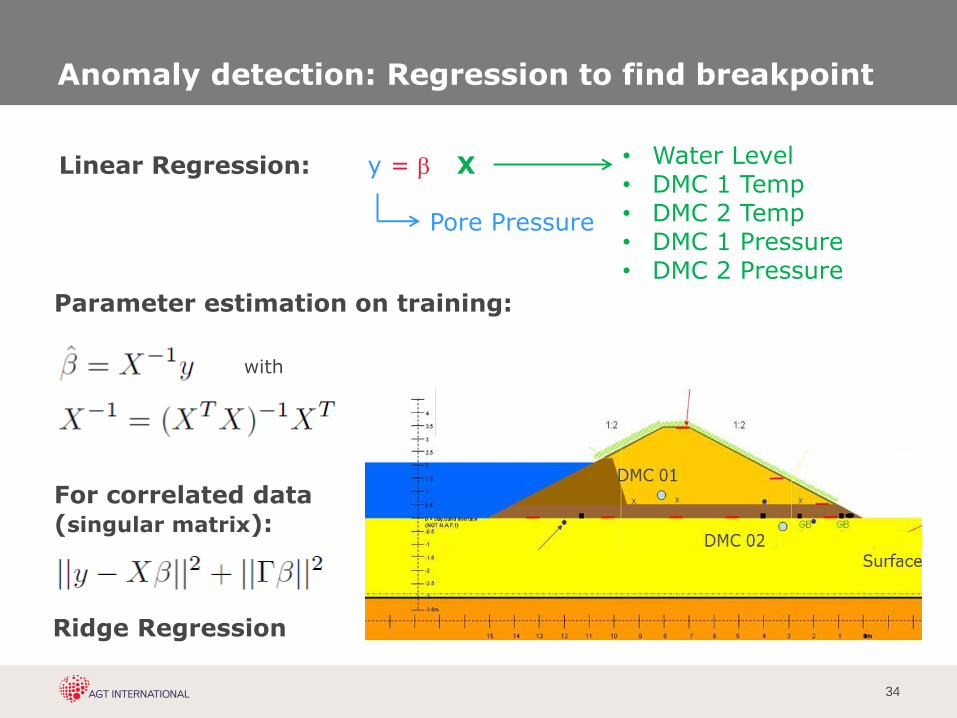
Anomaly detection: Regression to find breakpoint
Linear Regression: y = b X
Pore Pressure
• Water Level • DMC 1 Temp • DMC 2 Temp • DMC 1 Pressure • DMC 2 Pressure
Parameter estimation on training:
with
For correlated data (singular matrix):
Ridge Regression
35
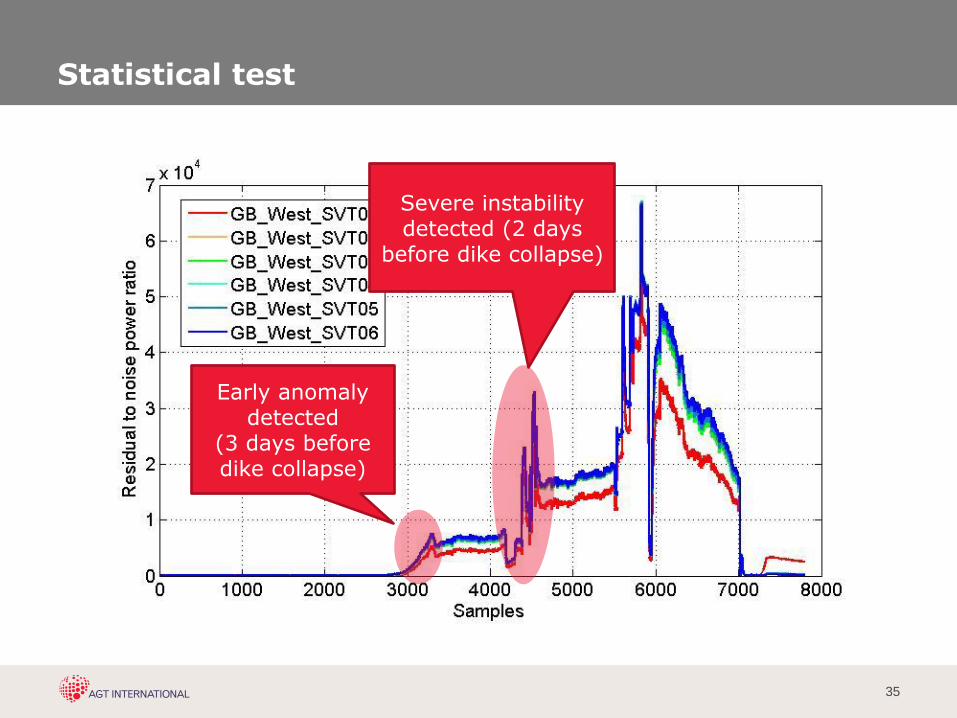
Statistical test
Early anomaly detected
(3 days before dike collapse)
Severe instability detected (2 days
before dike collapse)
36
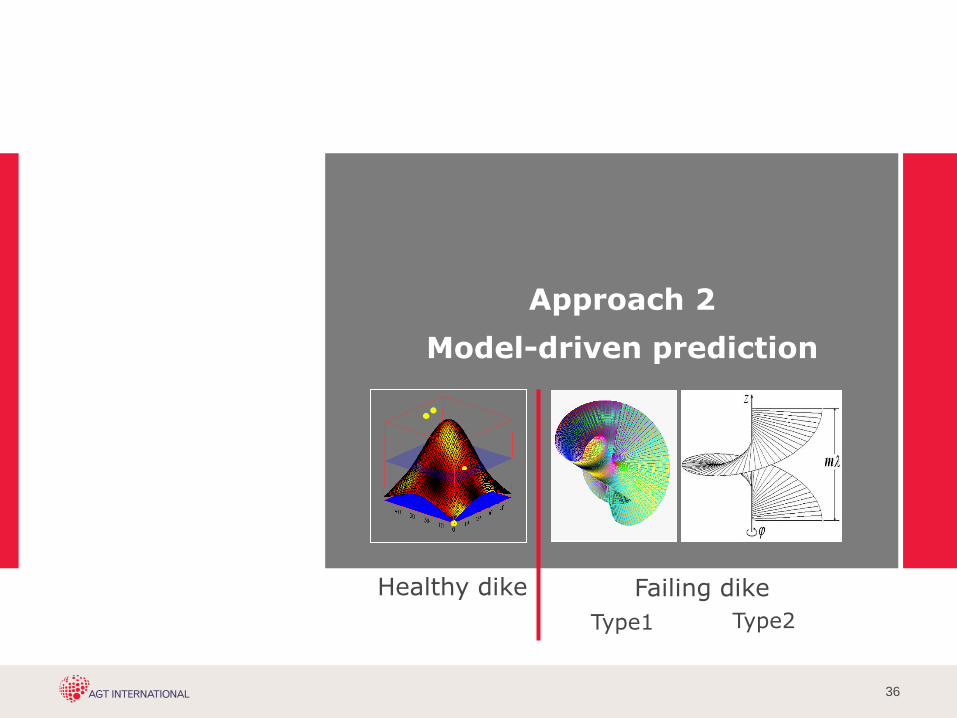
Approach 2
Model-driven prediction
Healthy dike
Type1 Type2
Failing dike
37
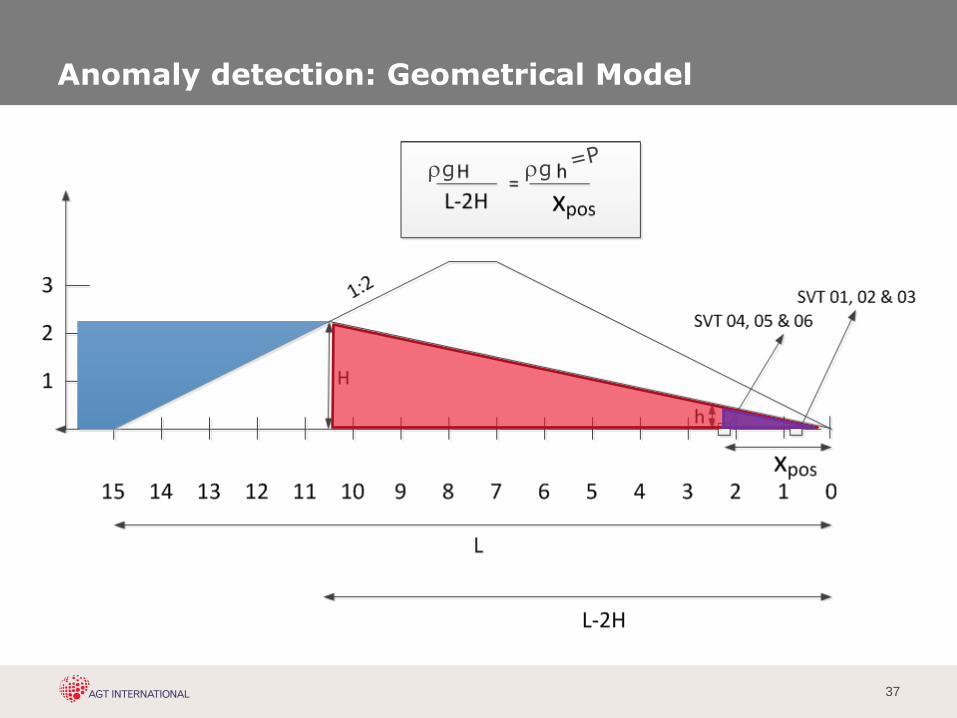
Anomaly detection: Geometrical Model
rg rg
38
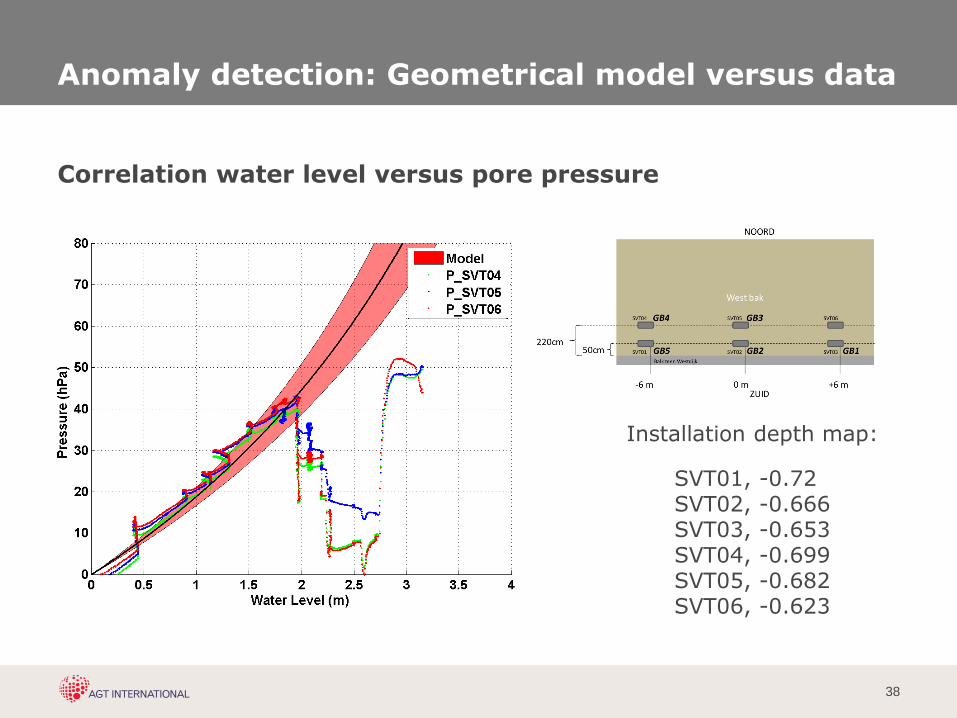
Anomaly detection: Geometrical model versus data
Correlation water level versus pore pressure
Installation depth map:
SVT01, -0.72 SVT02, -0.666 SVT03, -0.653 SVT04, -0.699 SVT05, -0.682 SVT06, -0.623
39
Future extension
• Smart sensors in water infrastructure
• Experiments and real-world implementations
• 3D sensor data visualization
• Dike stability models
• Sensor data verification and analytics
• Future extension
40
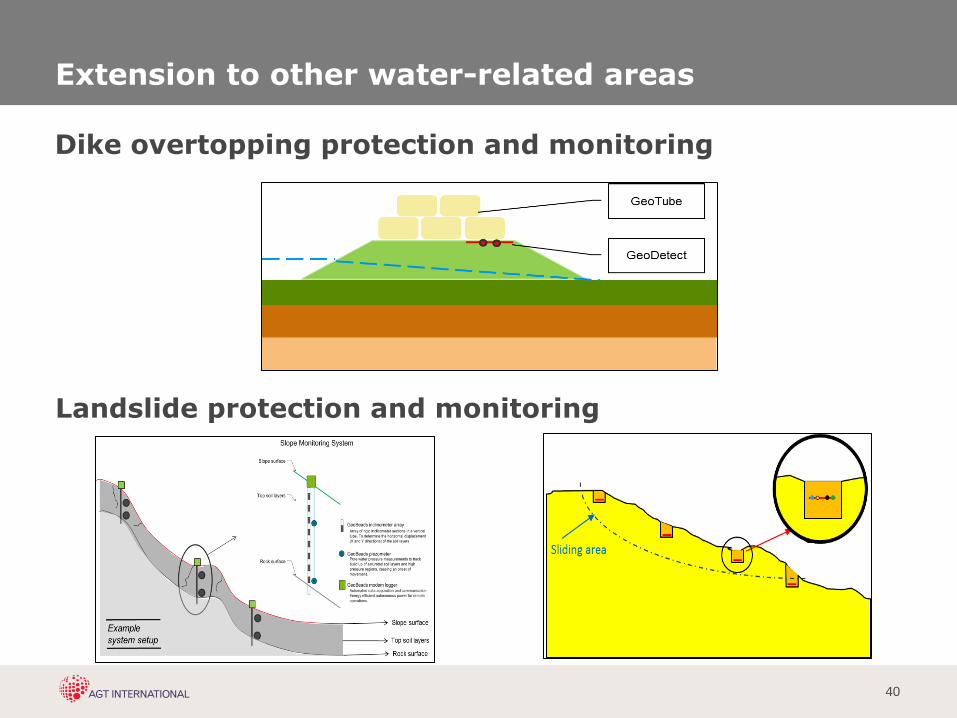
Extension to other water-related areas
Landslide protection and monitoring
Dike overtopping protection and monitoring
41
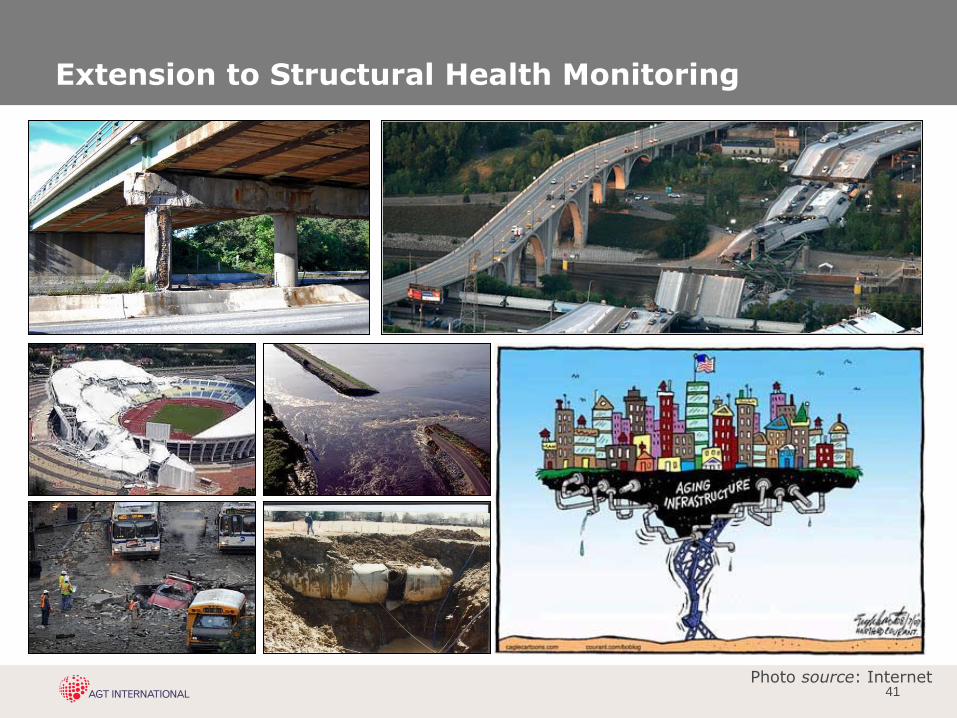
Extension to Structural Health Monitoring
Photo source: Internet

Thank you