DATA TO WISDOM - Canadian Electricity Association · quartile financial performance, and three...
36
DATA TO WISDOM Big Data and Analytics in the Canadian Electricity Industry
Transcript of DATA TO WISDOM - Canadian Electricity Association · quartile financial performance, and three...

DATA TO WISDOM
Big Data and Analytics in the Canadian Electricity Industry


Table of ContentsINTRODUCTION IV
Case Study: How Data Analytics Will Reshape How Utilities Operate in the Future 1
WELCOME TO THE DATA DELUGE 4
BIG DATA AND ANALYTICS 6
IMPACT OF BIG DATA AND ANALYTICS ON UTILITIES 7
Case Study: Solution Considerations for the Reduction of Electricity Theft and Non-Technical Loss 10
WHERE TO START 15
DATA GOVERNANCE 19
ANALYTICS MATURITY 22
RISKS AND CHALLENGES 24
Case Study: Secure Smart Grid Design 27
CONCLUSION 29

Introduction
This white paper is intended to provide real world examples of how the utilities industry uses ‘big data’ analytics to unlock grid investment value, performance and profitability. We now know that converting data
to relevant, usable wisdom is rapidly transforming how companies drive new operational efficiencies today, and define what’s needed to deliver the clean, green, secure and reliable energy required to meet future demand.
Big data and analytics is a growing topic of interest across all industries. Over 80% of organizations consider it to be a strategic priority1, and for good reasons. Companies that use analytics most effectively are five times more likely to make decisions faster than their competition, twice as much more likely to have top-quartile financial performance, and three times more likely to execute decisions as intended.2
For utilities, big data and analytics holds the potential for becoming cutting edge corporations — to go beyond the poles and wires of the traditional utility. By analyzing the right data and identifying areas of opportunity from reliability to workforce management to cost savings, utilities can identify productivity gains and improve performance across the organization. Predictive maintenance alone is expected to save utilities substantial funds. Whether it’s to better manage a fleet of generators, reduce outages or improve customer satisfaction, cost savings can be found across many departments.
1 O’Reilly, The Big Data Transformation, 2016
2 Bain and Company, “Big Data: The organizational challenge”, 2013
iv
CASE STUDY
How Data Analytics Will Reshape How Utilities Operate in the Future
There are specific industries that generate, store and sometimes utilize significant amounts of data. The obvious ones are the financial industry and the health care industry. Though utilities are also in this category. Whether the utility plays in generation, transmission or distribution they are all going to continuously learn how to extract value from big data.
Canadian utilities have always had financial data, resource data, and various types of data for operations such as asset management data. Though with the significant growth in leveraging technological innovation the amount of data being generated has increased exponentially. The continuous integration of telecommunications with SCADA systems, the use of GPS devices in vehicles, communications utilizing social media, the usage of cloud based systems, wireless devices used in the field, and even drones can create and store data.
The perfect storm that has unlocked the value in big data is the combination of a significant increase in data, reduced cost of storage, the advancement of cloud based data analytic technology, combined with the emergence of data analyst and scientist roles who know data is the new oil. Those utilities on the leading edge of data analytics are not asking what value can I get from analytics, they are asking if there are any decisions that analytics cannot help with.
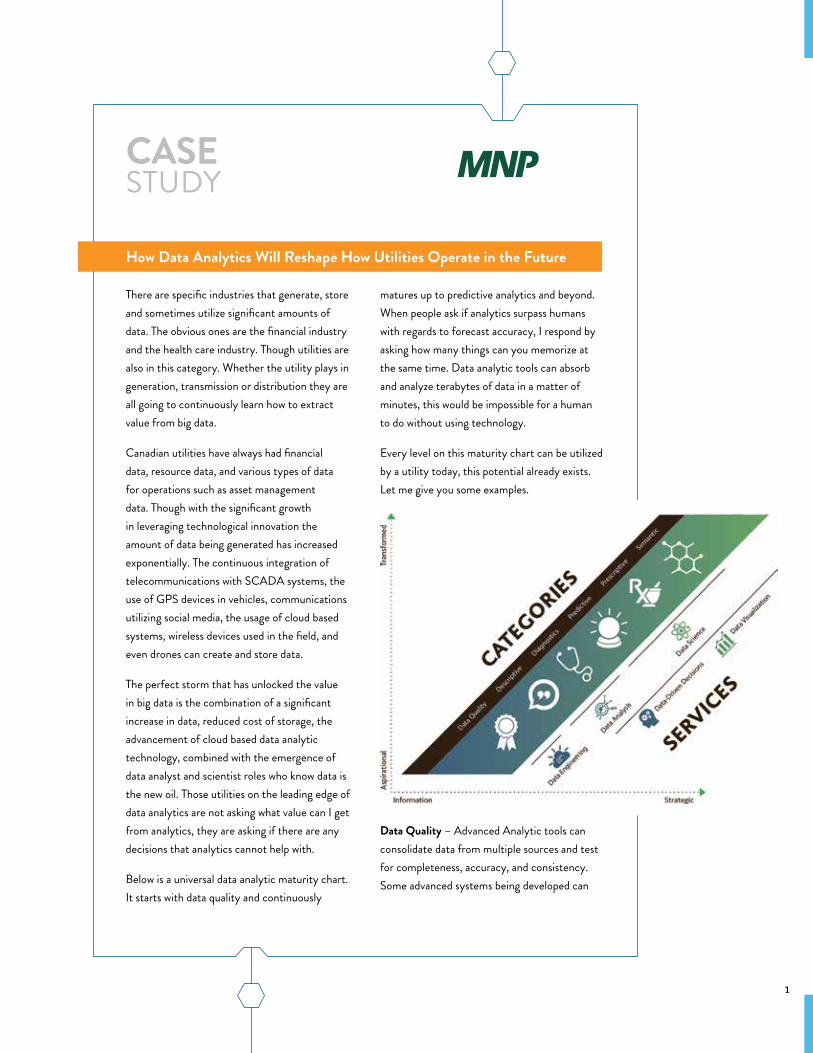
Below is a universal data analytic maturity chart. It starts with data quality and continuously
matures up to predictive analytics and beyond. When people ask if analytics surpass humans with regards to forecast accuracy, I respond by asking how many things can you memorize at the same time. Data analytic tools can absorb and analyze terabytes of data in a matter of minutes, this would be impossible for a human to do without using technology.
Every level on this maturity chart can be utilized by a utility today, this potential already exists. Let me give you some examples.
Data Quality – Advanced Analytic tools can consolidate data from multiple sources and test for completeness, accuracy, and consistency. Some advanced systems being developed can
1

also fix data quality issues as the data is being ingested. The better your data quality the better the insight to support decision making.
This category also considers data security and privacy requirements. A Canadian utility regulator with a material amount of customer and vendor data has recently chosen to undergo a project to de-identify their data that is considered personal identifiable information. Two material benefits of doing this is that by removing the data identifiers (I.e. Customer or Vendor Name) it minimizes the risk of a privacy issue in the case of a breach, and it allows internal resources who previously were not allowed to access this data to now be able to utilize the data for running data analytics.
Descriptive – This area will continuously evolve over time with structured and unstructured data. Today there is a Calgary based company that transformed the planet earth into a digital globe of connected cells based on longitude and latitude. Any data connected to a postal code or latitude/longitude can be layered onto the globe. This can allow utilities to accurately map every asset they have on the planet. Then they have unlimited options of adding more layers like rivers, roads, protected lands, sites that have had historical environmental issues, etc. Maybe add predictive weather patterns to see how this might impact future capital projects.
Diagnostic – This is using analytics to determine why something happened (factors and causes). It has often been associated with fraud detection and investigation. However innovative utilities are exploring this to understand reliability issues, drive costs savings, and to conduct audits.
A Canadian utility utilized this type of data analytics to detect capital project billing errors related to the usage of rates, hours, and asset
usage that were not in compliance to contract. The analytics provided transaction level evidence that justified reimbursement of the incorrect billing. This resulted in material cost recovery for the utility.
Predictive – Most utilities in Canada are not at this level yet. However, they could be, this type of analytic can be used for financial forecasting, reliability models, and predicting asset management issues. There are many other ways for this to provide valuable insight.
There is a correlation between specific patterns of extreme energy consumption and locations where an illegal grow-op may exist. Predictive analytics have been used by utilities to detect and investigate these situations. Also, predictive analytics can be very accurate at forecasting future customer trends and their related financial impact.
Prescriptive – After having analytics provide a prediction as to what will happen next, prescriptive analytics is dedicated to finding the best course of action for a given situation. An example might be a prediction based in changes in customer behavior that may have a very adverse impact on a utilities business model in the future. Prescriptive analytics provides insight on potential solutions.
Cognitive – This is combining analytics with cognitive computing technology such as machine learning or artificial intelligence. Innovation in this space already is available in a user-friendly format, meaning you no longer need to be a data scientist to utilize this type of analytics.
A Canadian company based in Ottawa has developed a software that combines machine learning, artificial intelligence and data analytics
2
to provide a user-friendly way to detect fraud right after it occurs. In time, it may even become smart enough to predict fraud before it happens. Given the number transactions an average utility has in a year it would be very valuable to have a real time continuous monitoring capability that gets smarter every day. The Association of Certified Fraud Examiners (ACFE) has consistently identified that the longer it takes to detect a fraud, the larger the fraudulent activity will become, and the greater the negative impact on the organization.
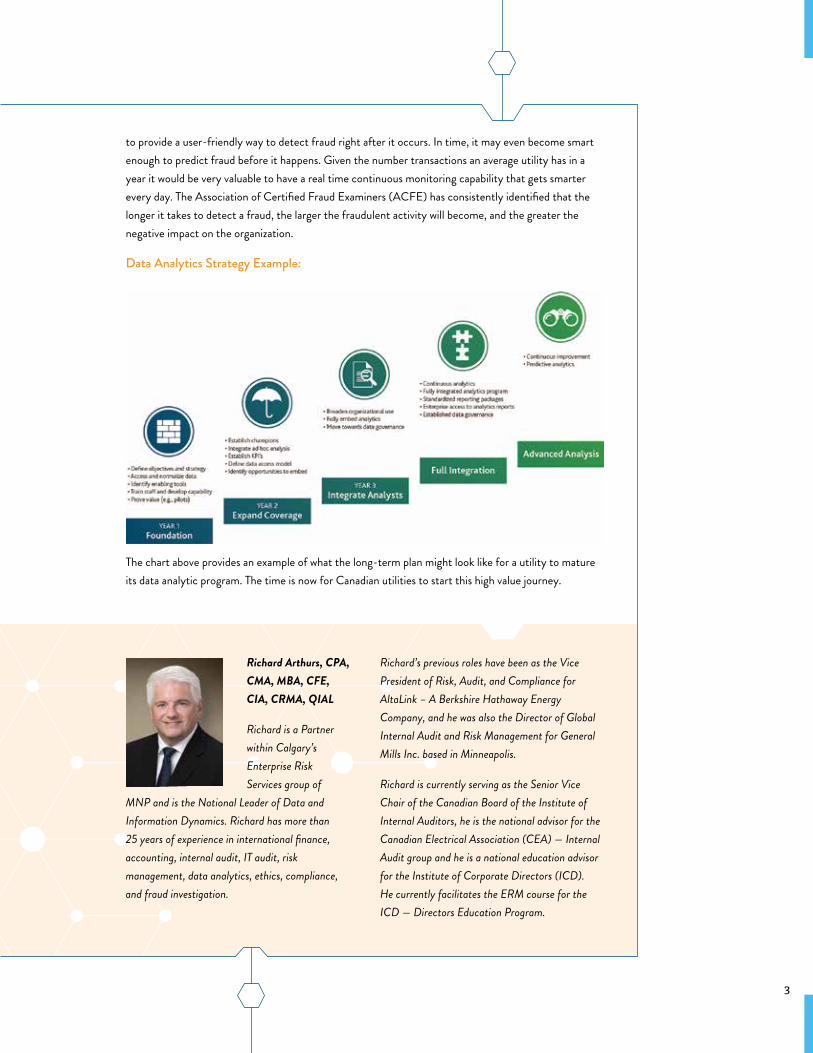
Data Analytics Strategy Example:
The chart above provides an example of what the long-term plan might look like for a utility to mature its data analytic program. The time is now for Canadian utilities to start this high value journey.
Richard Arthurs, CPA, CMA, MBA, CFE, CIA, CRMA, QIAL
Richard is a Partner within Calgary’s Enterprise Risk Services group of
MNP and is the National Leader of Data and Information Dynamics. Richard has more than 25 years of experience in international finance, accounting, internal audit, IT audit, risk management, data analytics, ethics, compliance, and fraud investigation.
Richard’s previous roles have been as the Vice President of Risk, Audit, and Compliance for AltaLink – A Berkshire Hathaway Energy Company, and he was also the Director of Global Internal Audit and Risk Management for General Mills Inc. based in Minneapolis.
Richard is currently serving as the Senior Vice Chair of the Canadian Board of the Institute of Internal Auditors, he is the national advisor for the Canadian Electrical Association (CEA) — Internal Audit group and he is a national education advisor for the Institute of Corporate Directors (ICD). He currently facilitates the ERM course for the ICD — Directors Education Program.
3

Welcome to the Data Deluge
The amount of data worldwide is doubling in size every two years3. The primary drivers behind this trend has been a steady decrease in the price of hard drives, combined with an increase in storage capacity. For example,
in 2015 a Hard Disk Drive (HDD) cost 0.03 cents per GB4. Today that cost is 0.02 cents. And the average capacity per HDD has grown from 578 GB in 2011 to 1443 GB in the first quarter of 2016.
The same has also been true for mobile data storage or flash drives, and solid-state drives (SSD). In 2013 the price per GB was $2.00, today it is estimated to be $0.20 cents.5 SSD costs are dropping and predicted to be comparable to HDD soon.
3 IDC, “The Digital Universe of Opportunities: Rich Data and the Increasing Value of the Internet of Things”, 2014
4 Canadian Electricity Association, Electric Utility Innovation; Toward Vision 2050, 2015
5 Storagecraft, Sept 2016, “What’s Causing the Flash Storage Market to Grow so Quickly?” http://www.storagecraft.com/blog/flash-storage-market/
4
UTILITY DATA GROWTH In 2015, an estimated $800 million was spent on big data and analytics projects by utilities and energy companies6, highlighting a growing trend in the industry. At the forefront of the utility related data explosion are Advanced Metering Infrastructure, or smart meters. Traditional meters were read monthly for billing purposes, but with smart meters utilities can now receive updates every 15 minutes or less. This equates to 96 meter reads per day per meter, or 2880 reads per month per meter.7
Distributed generation is another technology that’s contributing to the data explosion. It provides utilities data from rooftop solar, wind and other renewables where excess production is dropped into the grid, and plays a significant role in managing demand response and load capacities8.
The Internet of Things (IoT) is another source of growing data for utilities. Sensors and microchips embedded into everyday household items from LED lightbulbs to air conditioners allow their owners the ability to remotely monitor and control them.9 Data from IoT offers utilities greater insight into how best to operate a variety of components, from generation facilities to the tires on maintenance trucks. Collection of data from these devices will only increase as devices become more widespread. Spending on IoT connectivity devices is expected to reach $3 trillion by 2020, and IoT spending on services is also expected to reach $273 billion in 2017. This spending is dominated by operational technology.10
6 Bain and Company, The organizational challenge, 2013
7 McHann, Stanley, “Grid Analytics: How Much Data Do You Really Need?”, IEEE, 2013
8 Lexington Institute, Challenges and requirements for tomorrow’s Electrical Power Grid, June 2016
9 Rozenfeld, Monica, “LEDs Are Illuminating the Way for the Internet of Things”, The Institute-IEEE, 2017 http://theinstitute.ieee.org/technology-topics/internet-of-things/leds-are-illuminating-the-way-for-the-internet-of-things
10 Horvitz, Gal, “BPM empowering IoT business users”, Analytics Magazine, 2017
The amount of data worldwide is doubling in size every two years.
SPENDING ON IOT CONNECTIVITY DEVICES IS EXPECTED TO REACH $3 TRILLION BY 2020, AND IOT SPENDING ON SERVICES IS ALSO EXPECTED TO REACH $273 BILLION IN 2017.
5

Big Data and Analytics
Big data refers to very large and complex data sets that require analysis, and as a result it is often paired with the term analytics.11
Big data is defined by several parameters.
11 WikiPedia, Big Data, Available from: https://en.wikipedia.org/wiki/Big_data
Quantity of data.
Quality of data.Veracity
Variability
Velocity
Variety
Volume
Consistency of data.
Rate of receiving data.
Type and nature of data.
6

Analytics is a way of interpreting data elements and communicating their meanings to the appropriate users and stakeholders.12 For example, by identifying a smaller demographic in a population and noticing that those individuals are at risk to develop diabetes. Or identifying areas that are at risk of interruptions from incoming storm by overlaying asset, maintenance and outage management systems using GIS data. In each example, the insights we’ve gained from the data lead to an action. Analytics from big data are ultimately useless if no action is taken on the insights provided.
In essence, the use of data is enhanced when we add parameters around the data, and move from data to wisdom, where action can take place.
FROM TO
Data -3 Celsius Information
Information -3° Celsius At 3° Celsius it’s cold out. Knowledge
Knowledge -3° Celsius Need to dress warmly. Wisdom
After gaining an insight from the data, you must act on it. If it’s -3 degrees and you don’t wear a coat, you will suffer from the consequences of being outside without protection.
Impact of Big Data and Analytics on UtilitiesLike AirBnB in the hotel industry, “disruption” in the utility sector is happening primarily through the adoption of new technology, such as distributed generation, battery storage, smart meters and big data. The following are several examples of what big data and analytics can do to improve specific functions within utilities.
VOLTAGE MONITORINGUtilities need to enforce real-time monitoring on all equipment components in order to identify abnormal conditions as they arise, adjust power settings and prevent equipment failures. Such real-time analysis requires large volume and high-speed data processing.
12 WikiPedia, Analytics, Available from: https://en.wikipedia.org/wiki/Analytics
Analytics from big data are ultimately useless if no action is taken on the insights provided.
7
MOBILIZATION By enhancing stakeholders’ information with data from photographs of equipment damage, maintenance records, and thermograph scans through the use of mobile devices, line crews can provide real-time status updates to stakeholders. The same information can also be used by dispatch to avoid repeat visits of line crews to the same area.
BLOCKCHAINBlockchain can enable new activities within existing architectures like the Internet. Blockchain at its core is simply a different way of organizing, distributing and transacting units of value, the potential applications are nearly endless. Developers are just beginning to scratch the surface of what can be achieved or improved using Blockchain. Regardless of how you view blockchain, it is a new form of data that must be captured and managed. Even if blockchain is not in use with the transaction of electricity to distribution points (the first occurrence of this was in April 2016, Brooklyn, NY, in the form of green energy credits),13 utilities will be impacted if not in the form of energy transactions then in the form of contracts and potentially within the supply chain.14 Finally, utilities will also be able to use blockchain applications as a means of quality control, records control, theft deterrent and more.
ELECTRIC VEHICLES For utilities, hybrid and electric vehicles are a solution to lower GHG emissions. They also represent additional sources of data that can be leveraged for potentially new electric vehicle related services.
LIGHTING-AS-A-SERVICE Utilities are in a unique position, through IoT and their energy control systems, to partner with lighting companies or large facilities and create energy efficiency programs for households and businesses. Utilities may be able to position themselves into this market space as a complete solution provider.
SMART HOMES Smart Homes have been a topic of conversation for many years. Utilities with extensive networks of home sensors will able to provide consumers advanced energy efficiency programs, as well as enhance other service offerings like providing a break-down of electricity consumption within the home, by monitoring and recognizing changes in demand and identifying the household appliance responsible for that demand change.
13 Molle, Gregoire, “How Blockchain Helps Brooklyn Dwellers Use Neighbours’ Solar Energy”, All tech Considered, 2016. Available At: http://www.npr.org/sections/alltechconsidered/2016/ 07/04/482958497/how-blockchain-helps-brooklyn-dwellers-use-neighbors-solar-energy
14 Wilson, Jay, Blockchains Part II: Why they matter to Business, Canadian Electricity Association, 2017. Available At: http://powerforthefuture.ca/2017/01/blockchains-part-ii-matter-business/
8

WITH BIG DATA AND ANALYTICS, UTILITIES ARE ABLE TO PREDICT REVENUE OR LOAD FOR A GIVEN SUBSTATION OR BY TARIFF RATES SUCH AS TIME-OF-USE PRICING.
UNMANNED-AERIAL VEHICLES The use of drones is becoming a growing topic of interest within the utility industry. The data produced by these drones can help identify frayed lines and damaged insulators without putting utility employees at risk. GIS and imagery data can be used to identify problems that line crews can receive prescriptive advice based on their assessment in real-time.
VEGETATION MANAGEMENT Utilities can develop or acquire analytical capabilities that can predict the growth of vegetation based on soil type, vegetation type and precipitation levels, and identifying potential risk areas for tree contacts with transmission or distribution lines.
OPTIMIZE SMART GRID OPERATIONS With smart meters and analytical solutions, smart grid utilities can predict demand by location and segment their customers accordingly.
INTEGRATING DISTRIBUTED GENERATION With the production of wind and solar electricity expected to increase by 6,300 MW by 2020,15 utilities are facing new challenges in managing the grid. By overlaying weather patterns and forecast maps of demand and supply, utilities can better manage supply and demand, and adjust voltages accordingly.
DETECT THEFT AND FRAUD With smart technology integrated into the grid, utilities can identify in realtime any loss of energy due to faults and anomalies from transformers down to the meter in real-time.
15 CANSIA,”Roadmap 2020: Powering Canada’s Future with Solar Electricity”, 2012 Available At: http://www.cansia.ca/roadmap-2020.html
9

CASE STUDY
Solution Considerations for the Reduction of Electricity Theft and Non-Technical Loss
The complex process of detecting electricity theft has been historically dependent on a manually intensive set of solutions employed within utilities that often weren’t scalable and error prone. With mass deployment of smart meters, new innovative approaches to detecting, quantifying, and automating many of the business processes associated with power theft across an entire service population have renewed the business case for recovery of non-technical loss.
Key Requirements to Consider
Some key success criteria of a software solution that is capable of providing analysis of electricity theft over a large smart meter population should include the following points to minimize false positives, ensuring more accurate results while minimize operational costs.
Does the solution take full advantage of all measurement data, operational information and event capabilities of your end-to-end AMI infrastructure and back-office integration? Complex pattern analysis that utilizes all available sources of data can focus your investigation on the highest probability scenarios, maximizing operations expenses spend and producing better loss reduction.
Does the solution provide a feedback loop to track results and distinguish false positives from real theft? Automatic learning algorithms that adapt to theft signatures unique to your network continue
to find positive results over time without software updates or enhancements, delivering the lowest total cost of ownership.
Does the solution provide the ability to prioritize possible theft occurrences based on probability factors of theft signature elements unique to your network? Prioritization of work queues based on probability provides improvements to operations productivity by working the results with highest likelihood of finding a positive occurrence of loss using the feedback loop and automated learning defined above.
Does the solution provide a business process workflow of the investigation process? This can help to manage larger scale operations, document audit and assign responsibility for truck rolls at the correct level in your organization.
The Siemens Answer
The modernization of electricity distribution is evolving into a new smart grid, capable of enhanced monitoring, feedback, control, and new customer services. Thousands of new sources of information are available from smart meter communication networks, distributed renewable energy resources, and the convergence of Information Technology (IT) with Operational Technology (OT), creating massive amounts of data points that need to
10

be consolidated, standardized, and managed in a way that enables not only a singular business process, but the entire enterprise with information.
After more than a decade of research and development to build the most reliable and trustworthy commercially available Smart Grid data processing platform in the world, Siemens EnergyIP® delivers rapid value with a rich portfolio of applications including Revenue Protection and Grid Loss Analytics. EnergyIP is the only meter data platform with the power and flexibility to meet the challenges today’s utility will experience as it transforms the utility business across all areas and promotes rapid decision making based on analytics.
To receive a copy of Siemens whitepaper on revenue protection Analytics solutions, please send an email to: [email protected]
11

DEMAND RESPONSE With big data and analytics, utilities are able to predict revenue or load for a given substation or by tariff rates such as time-of-use pricing.
ENERGY EFFICIENCY Energy savings from energy efficiency programs are traditionally reported to executives and regulators after the program has run its course. With big data and analytical solutions in place, utilities can provide real-time results and trends to executives and regulators. They can also predict the success and/or failures of these programs.
USING CUSTOMER SEGMENTATION Utilities traditionally segment their customers into three or four groups and often based on voltage connections — residential, commercial, industrial and institutional. With more data, utilities are able to identify customers’ motivators and drivers, and segment them further into more meaningful groups. They can then develop specific programs and services that are more effective and beneficial for both customers and utilities.
Alectra Utilities16 used analytics solutions to further segment its customers in its marketing campaign for increasing registration to an energy savings program. As a result, it was able to increase the number of customers who signed up from 1% to up 18% in some segments.
USING SOCIAL BENCHMARKING Social benchmarking is the practice of providing customers their electricity consumption patterns over a period of up to 12 months. The following graph shows a customer who’s monthly consumption is less than the utility’s average, but when compared to a peer group of residents the customer in question consumes more electricity. By providing this information the customer may be encouraged to lower their usage pattern to match their immediate peers.
16 Seoni, Rupert, “Case study: Savings Energy-Money with Analytics-Powered Marketing, 2014. Available At: http://dmn.ca/case-study-horizon-utilities/
500
600
700
800
900
1000
Dec.Nov.Oct.Sep.Aug.JulyJune
(kwh
)
Your usage
Personal Consumption in Comparison
Utility Mean usage Neighbourhood Mean usage
With big data and analytical solutions in place, utilities can provide real-time results and trends to executives and regulators.
12

ASSET MANAGEMENT AND PROACTIVE MAINTENANCE With the implementation of Asset Management Standards PAS55 and ISO 55000, we will see wide use of sensors, imagery, repair forms and schedules, and GIS data. Asset management practices in the utility sector are set to be inundated with large volumes of data. Machine learning algorithms will be able to identify condition levels and prescribe proactive maintenance measures to increase the lifespan of the asset or to prevent failures. “Run-to-failure” will become an obsolete term. With enhanced data sets, asset managers will be able to identify profitability per unit or per transformer bank, greatly improving efficiency across the board.
IMPROVE OUTAGE MANAGEMENT By applying asset management practices, utilities can identify the location and condition of all assets, apply historical load and outage data, tree trimming data, upcoming weather patterns and more, in order to facilitate and predict where the next outage will occur. This information can be derived down to the feeder, transformer or even meter level and by applying the proper algorithms utilities can then deploy line crews to perform preventive maintenance.
STORM IMPACT ANALYSIS With accurate data modelling technics, utilities can translate their data into impact assessments and predict potential outages. Potential data for such assessments would include:
Weather Data Wind speed and directionAmount of rain, snow fall, and/or ice build upLightning intensity
Utility Data Asset condition and locationNumber of customers on a feederTree trimming schedules
Other external data Vegetation density and typeMunicipal arborist databases (for tree conditions)
One example of such a model is the Sperry-Plitz Ice Accumulation (SPIA) Index. An index that identifies incoming rain, lightning, snow, predicted ice build-up, and wind strength. The model overlays the data onto a service area map, and distribution companies are then able to identify service areas that are at risk of outages due to storms.17
17 Sperry, Sidney, “What is the Sperry-Piltz Ice Accumulation Index”, 2009. Available At: http://www.spia-index.com/
With accurate data modelling techniques, utilities can translate their data into impact assessments and predict potential outages.
13

IMPROVING LINE LOSS Line loss averages 6% to 2% of electricity for transmission and 4% for distribution networks.18 With volt-VAR analysis and optimization, utilities can decrease these losses through better management of voltage levels and VAR flows, and free up capacity to serve load demand.
OPTIMIZATION OF GENERATING PLANTS Information technology coupled with control systems, SCADA, and communication devices integrated with real time data analysis will provide greater insight and understanding of the equipment being used and the events that occur. With the proper technology in place, asset and workforce management systems can be updated in real-time, and maintenance schedules can also be updated and streamlined to better service the power plant of the future. Inherent benefits of such added devices and data comes in the form of predictive and prescriptive maintenance, potentially reducing unplanned downtime.
With big data and the analytics, asset managers can monitor components, units and the entire fleet of units in real time.19 Demand response technology is in a better position to optimize the supply. Analytics algorithms and applications can assist in scheduling and deployment more efficiently.
MACHINE LEARNING Machine learning is about automating automation. It’s about using algorithms to perform common tasks. With the application of sensors, algorithms and the Internet of Things comes machine learning. The widespread application of sensors will provide utilities with an abundance of data that will grow and be applied within machine learning concepts. In an industry rich in capital assets and customer consumption patterns influenced by events, weather, policy and price, this will prove to be one of the great benefits of big data and analytics.
18 WIrfs-Brock, Jordan, “Lost in Transmission: How much energy disappears between a power plant and your plug”, Inside Energy, 2015. Available At: http://insideenergy.org/2015/11/06/lost-in- transmission-how-much-electricity-disappears-between-a-power-plant-and-your-plug/
19 Reitenbach, Gail, “Big Data and the Industrial Internet Meet the Power Plant”, Power Magazine, 2016
14

Where to Start
An initial conversation about analytics should revolve around who will be involved, who will lead, and where will it sit. A fundamental concept to big data and analytics is to “Keep it Simple”.20 Simplicity will help avoid
scope creep. Analytics should be driven by a business need. The IT department will support the technological platforms and tools, but the data scientists and analysts involved in big data and analytical solutions will work within the given scope and life-cycle to deliver proven results.
20 Veeramachaneni, Kalyan, “Why You’re Not Getting Value from Your Data Science”, Harvard Business Review, 2016
15

ANALYTICS INITIATIVE LIFE CYCLE
Infancy Start with Simple Models
• Be specific
Explore the data
• Become familiar with the data• Theorize and build a hypothesis
Sample Testing
• Take samples and start small• Expand slowly to include more sample data• Identify benefits
Adulthood Automation • Identify a solution • Incorporate into operational processes through automation
In order to implement a big data and analytics initiative, it is important to first address the following questions:
Is there executive support?
Does the existing staff have the big data and analytics skill set, or do we need to look outside of the organization?
What silos need to be removed to facilitate analytics?
Can we establish an effective data management and governance program?
Can we build trust in the data and the modelling to deliver sound data-driven wisdom?
In recent years, we have seen the emergence of positions in the C-Suite and a change to the traditional role of CIO. With the use of big data, organizations are incorporating the roles of Chief Data Officer (CDO) and Chief Technology Officer (CTO). The CDO role vary from organization to organization, but they all have 3 things in common: data governance, data analytics and data architecture and technology.21
Many companies including utilities will face challenges in terms of organizational structure. Who will manage the big data and analytics initiatives? What department will they sit in? One suggested solution would be to establish a Centre of Excellence (CoE). A CoE helps in the establishment of standards and governance, promotes collaboration between users and IT support teams, assists data users, tracks and evaluates data usage, and ensures data quality.
Companies that are recognized as leaders in the field of data and analytics, like Shopify and Netflix, are introducing the C-suite to the CAO, the Chief Analytics Officer. The CAO is responsible for enterprise wide data, often managing an Analytics Centre of Excellence (ACE). The ACE is often the central point of the corporation and has the responsibility of developing data based services and solutions, and enhance corporate data related decision making.
21 PwC, “Great Expectations: The evolution of the chief data officer”, 2015
Many companies including utilities will face challenges in terms of organizational structure. Who will manage the big data and analytics initiatives?
16
KEY ELEMENTS IN IMPLEMENTING BIG DATA AND ANALYTICS INITIATIVE
1. INITIAL CHANGEOften the most difficult task for anyone let alone an entire organization or industry is to change. Utilities are faced with constant challenges, from an aging workforce to regulatory demands to political pressure and consumer unrest. A utility does not need smart meters to begin examining analytical solutions. They already have large data sets coming in from SCADA systems. Data is there, it just requires some preparation and an internal desire to go from data to wisdom and insight to action.
Utilities must look internally and identify where they will derive value. If the tools and skill sets aren’t within the utility, then there’s a need to find them either through training or hiring. Going forward, data must be treated as a corporate asset.
2. ESTABLISH GOVERNANCE AND DATA & ANALYTICS CENTRE OF EXCELLENCE
Although the long term goal should be to establish a centralized Centre of Excellence (CoE) that’s able to influence the whole organization, it is best to start small. Establish a CoE within an operational unit that’s able to access the data and identify new insights. After a few successful projects, then expand into other areas of the business.
3. LEVERAGE DATA INTO ACTIONABLE INSIGHTSOnce an insight has been identified from the analysis of big data, the utility must have the fortitude to take action and capitalize on it.
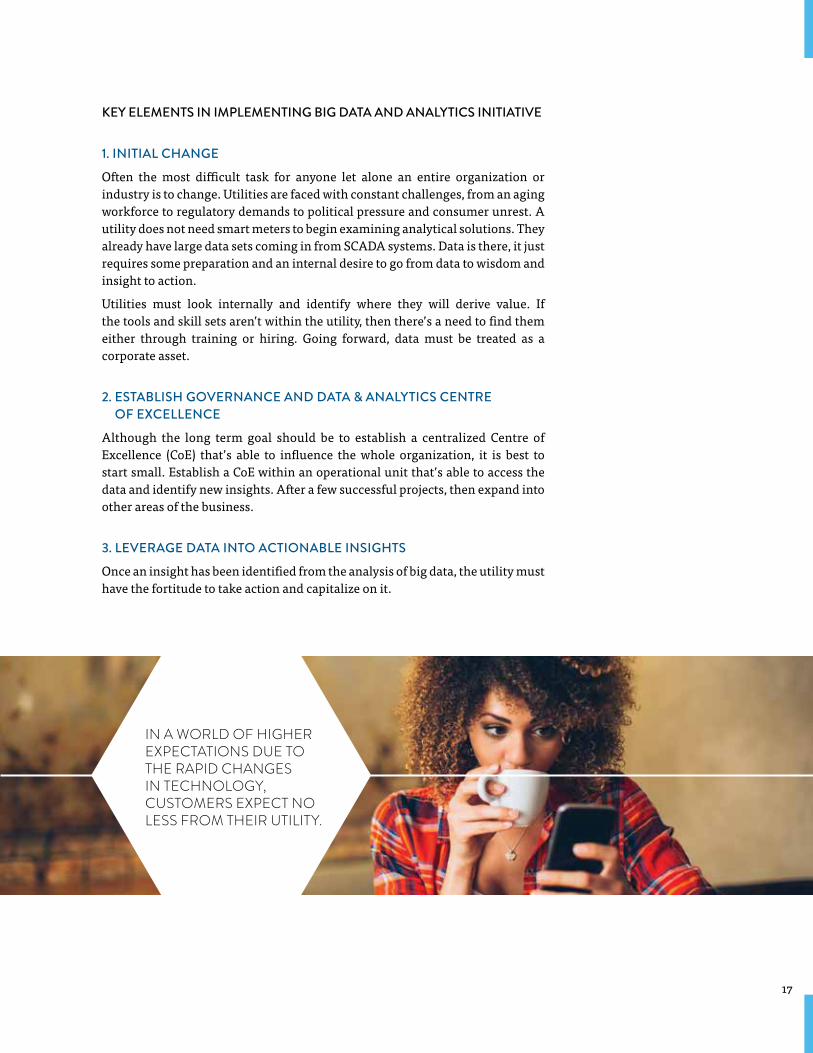
IN A WORLD OF HIGHER EXPECTATIONS DUE TO THE RAPID CHANGES IN TECHNOLOGY, CUSTOMERS EXPECT NO LESS FROM THEIR UTILITY.
17

4. IDENTIFY NEW DATA RELATED SERVICES In a world of higher expectations due to the rapid changes in technology, customers expect no less from their utility. Customers are becoming more and more sophisticated with the services they require. Big data and analytics can help develop new services that the customer will appreciate. Internally, there is a host of efficiencies big data can identify through elaborate modelling. These efficiencies, such as an enhanced maintenance program, will be felt utility wide and become a source of ingenuity that the company can derive further wisdom and benefits.
5. SHARE LESSONS LEARNEDIn an industry that will continue to see data volumes grow as electrification continues and as the IoT spreads to equipment beyond smartphones and tablets, there will be an increasing need to share best practices and knowledge within the industry. Trade associations within the industry, such as CEA are poised to facilitate that transaction of knowledge in a safe and secure environment.
6. PREPARE FOR THE FUTUREAs we progress into tomorrow, the industry is armed with insight for the future. However, predicting the future is a very difficult task. Data, patterns and trends will change as will technology, and utilities must be prepared for further disruption both beneficial and detrimental to their operations. Utilities can prepare by participating in think tanks and industry related groups, such as CEA’s reliability programs and emerging issues committee.
7. REGULATORY OVERVIEWRegulators like data, but all the potential solutions listed in this document come at a cost, both financial and time. Some costs may be too high for some utilities and therefore cannot be justified. Regulators should not push a utility to embrace big data and analytics, but allow the utility to develop solutions and offerings that fit its customer base and operational needs.
DATA, PATTERNS AND TRENDS WILL CHANGE AS WILL TECHNOLOGY. UTILITIES MUST BE PREPARED FOR FURTHER DISRUPTION, BOTH BENEFICIAL AND DETRIMENTAL TO THEIR OPERATIONS.
18

Data Governance
Applying data governance practices in any organization requires the recognition of the value of data as a corporate asset by the employees and senior leadership of the organization.
Data Governance can be defined as a collection of practices related to data that ensures security, quality, usability, availability and definitions or metadata. It is an accountability framework around the safeguarding, enhancement, publishing or visualization and usage of data in an organization. Implementing a data governance program will facilitate having the right data at the right time and place. An important factor of data governance must be that it remains flexible, otherwise it can easily become a source of restriction and frustration for data users.
19

Utilities seeking to implement a data governance program may find themselves doing so for one or several of the following reasons:
DATA GOVERNANCE BUSINESS DRIVERS
Reliable and consistent data reporting
One of the most talked about items in data governance is data quality. Data governance programs facilitate identification of poor data quality on a number of fronts.
Reduce data related costs A governance team will ensure that costs are centralized and managed appropriately.
Support regulatory compliance “Show me the data!” is a consistent theme amongst regulators in the industry. Data governance can assist utilities in meeting any regulatory compliance demands, such as SOX, reliability reporting, rate filings and more.
Enable decision-making It is not uncommon for executives or staff to question the accuracy of data. A governance team can create indicators to identify levels of quality and data confidence.
Enhance security and privacy A governance team can assist in developing the level of security required to ensure data safety.
Reduce redundancies Redundancies add to costs and create confusion when multiples of the same data are accessed by different business users.
UNIVERSAL PRINCIPLES OF DATA GOVERNANCE
Transparency Ability to communicate the data contents and upcoming changes. The governance program must be flexible and transparent to business users.
Auditability Ability to recognize and record the source of the data, its definitions and related changes to the data through system monitoring and data profiling.
Stewardship Ability to understand the business, the definitions related to the data and to maintain the standards and other metadata related to the data.
Security and Privacy Ability to secure data and prevent data leaks, and maintain customer privacy.
Change Management Ability to manage incoming changes to the datasets, tables and attributes, while ensuring cross-departmental functionality.
20

DATA QUALITYData quality is a consistent topic that does not go away. Poor data has impacted virtually all companies, including utilities included. It is believed that in the United States poor data quality costs companies over $3 trillion annually.22 The argument can be made that if Canada is 10% of the U.S.A.’s population, then in Canada alone bad data costs organizations $300 Billion. An astronomical estimate! These costs, include double billing, incorrect mailings, work performed by data knowledge workers on bad data, time spent reprocessing, decisions based on it and more.
A data governance team can facilitate greater understanding of real quality data through an examination of its accuracy, timeliness, completeness, integrity, validity and consistency.
DIMENSIONS
Completeness Are there any gaps in the data? Is all the data there?
Validity Are all the values specified by the business?
Consistency Is the data consistent from source system to decisions support system and/or reporting?
Accuracy Does the data reflect reality, what it is supposed to be?
Integrity Are the relationships between tables and attributes consistent?
Timeliness Is the data available when needed? Is it too old and irrelevant?
22 Redman, Thomas,”Bad Data Costs U.S. $3 Trillion Per Year”, Harvard Business Review, 2016. Available At: https://hbr.org/2016/09/bad-data-costs-the-u-s-3-trillion-per-year
THE ARGUMENT CAN BE MADE THAT IF CANADA IS 10% OF THE U.S.A.’S POPULATION, THEN IN CANADA ALONE BAD DATA COSTS ORGANIZATIONS $300 BILLION ANNUALLY.
21

Analytics Maturity
There are 5 key areas in an analytics maturity roadmap. All these dimensions play an integral part of implementing analytics.23
FIVE DIMENSIONS OF MATURITYUnderstanding these five areas will allow an organization to evolve from integrating and managing data, to supporting data driving decision making and innovation. Understanding an analytics maturity model is beneficial in of itself.
23 The Data Warehousing Institute, Analytics Maturity Model: The Context for Benchmark Scores, 2014
leadership, culture, value
policies, stewardship, quality, privacyGovernance
Analytics
Data Management
Infrastructure
Organization
skills, mindset, applications, delivery
processing, storage, access
technologies, architecture, integration
22

A maturity model identifies the starting point and defines goals and a vision for progress across the organization. It will also provide a methodology for measuring and monitoring the state an organization is at and what is needed to move to the next stage.
Source: TDWI, Analytics Maturity Model, 2014
Nascent Nascent organizations are generally not analytical. Analytics may come in the form of spreadsheet programs.
Pre-Adoption The organization may have moved beyond spreadsheets to database solutions and analysis.
Early Adoption Organization is looking at or adopting dashboarding solutions. Several analytical solutions may exist in separate departments (silo environments).
Chasm The chasm represents the challenges an organization will face when attempting to move from small analytical solutions to a large corporate adoption of big data and analytics. These challenges come in the face of funding, data management and governance, skills sets, culture and analytics governance.
Corporate Adoption Widespread use of various technologies. Involvement of end-users in analytical solutions where analytics begins to transform the business.
Mature Visionary At this stage, the organization is implementing new products and services, due to data governance, analytical programs and a rich data culture throughout its workforce. End-users adopt tools and can create analytical solutions themselves. Analytics may be considered a driving force beyond strategic initiatives.
In Canada, 43% of organizations use analytics in a descriptive fashion.24 These organizations fall within the nascent and pre-adoption stages. In comparison, according to a research done by the International Institute for Analytics, utilities fall within the early adoption to corporate adoption stages.25
In Canada, several utilities use data across their organization and have removed some of their ‘chasm’ challenges. These utilities can easily relate to the corporate adoption level and have managed to create an internal ecosystem that fosters innovation and decision-making. They have made the transition from data to wisdom.
24 PwC, Living digital: Taking the lead with advanced analytics, 2016
25 International Institute of Analytics, Ranking Analytics Maturity by Industry, June 2016
Nascent
Early-Adoption
Corporate AdoptionPre-
adoptionChasm
Mature
In Canada, 43% of organizations use analytics in a descriptive fashion.
23

Risks and Challenges
24

REMOVING THE SILO MENTALITYOne of the recurring challenges for companies is removal of data silos. This is not a new concept, it has been talked about and repeated over and over since the Enterprise Data Warehouse (EDW) became a concept. Utilities hold large amounts of data so it is natural that utilities will continue to maintain silos of data for specific reasons. Customer confidentiality is a perfect example of why data may need to remain protected in a silo. Often silo environments will contribute their non-confidential data into data lakes or enterprise data warehouses, to foster greater collaboration amongst business users.
C-SUITE COMMUNICATION AND SUPPORTFor big data and analytics solutions to flourish, the C-suite will need to become involved and understand the added benefits that will be offered from these initiatives. Support and involvement at the C-suite was identified as a critical factor for successful analytics efforts in 25% of organizations. This is the most critical element for success.26
RESOURCING CHALLENGESMany industries face numerous challenges in acquiring talented pools of people that can work with big data and analytics.27 While most industries suffer from a shortfall, the electricity industry sits on a talent pool of skilled, intelligent engineers that can be leveraged to great benefit. Engineers have an applied understanding of models, mathematics and statistics and therefore may leverage their abilities and transition them into business analysts and data scientists. The remaining gap would be training on specific analytical and data analysis software and tools. Companies cite various difficulties in attracting and retaining big data and analytics talent.
26 McKinsey and Company, “The need to lead in data and analaytics”, 2016
27 Ryerson University, “Closing Canada’s Big Data Talent Gap”, 2015
0
10
20
30
40
Executive leadersfor data analytics
Data scientistsor engineers
Business users withanalytics skill sets
(%)
Attract (%)
Top three identified roles with di�culties in attracting and retaining big data and analytics talent
Source: The need to lead in data and analytics, McKinsey and Company, 2016
Retain (%)
3429 29
21
12
20
For big data and analytics solutions to flourish, the C-suite will need to become involved and understand the added benefits.
25

CYBERTHREATSCyberthreats are real and capture headlines across the globe, whether it’s an attempt to steal confidential customer data or to create havoc on your operational systems, such as the Conficker or Havex worms.28 Cyberthreats are here to stay, and have an estimated annual global cost of USD $445 billion.29 Governments, regulators and corporations, in particular the electricity industry, must view them as real threats to their operations, security and reliability of their systems.
Cyberthreats are such a concern that in 2011 the US Government published a policy document aimed at improving critical infrastructure against cyberthreats. NERC has published several cybersecurity standards aimed at protecting utilities and power to their customers. For more details on these standards visit the NERC website at: http://www.nerc.com/pa/Stand/Pages/CIPStandards.aspx
It is critical that utilities safeguard their data as well as their systems and databases. A recurring and growing concern is the ability to hack a grid through the various communication devices. As seen in 2016 and again in 2017, the Ukrainian Power Grid was hacked through these devices, the same devices that deliver much needed data to control systems and system operators.30
As data becomes an increasingly important asset, it will also become a greater target. Utilities will be faced with ransomware: valuable data is encrypted and sold back to the utility at a cost. A simple solution against ransomware are backups of all data.
BIG DATA AND ANALYTICS TOOLSThe market is flooded with big data and analytics consultants, software solutions, database solutions, visualization tools, integration consultants and open source data sets. Utilities are faced with challenges in identifying the best vendor or tool to get the job done in their own environment. Discussions on solutions will encapsulate customization, integration with existing systems, training and support. Careful consideration must be giving before moving on a third-party solution, ensuring that the solution fits with the organization’s culture and data needs.
28 IBM, The Evolving Face of Cyberthreats, 2017
29 IBM, The Evolving Face of Cyberthreats, 2017
30 Zetter, Kim, “The Ukrainian Power Grid was Hacked Again”, MotherBoard, 2017. Available At: https://motherboard.vice.com/en_us/article/ukrainian-power-station-hacking-december-2016-report
It is critical that utilities safeguard their data as well as their systems and databases.
26

CASE STUDY
Secure Smart Grid Design
The power industry is seeing a rapid evolution towards smart and distributed grids. These networks are highly advanced and digitized, hosting a multitude of connected devices acting as major disruptors in the process. A key component of the smart grid consists of allowing two-way communication between distributed equipment and a central management system. This communication includes data from:
End users, about the time and quantity of electricity consumption,
The grid, concerning the status of equipment, and
Utilities, concerning time-based pricing and demand response.
At the forefront of this evolution is the integration of Advanced Metering Infrastructure (AMI). Advanced metering improves operational efficiency through remote
readings, provides advanced analytics for grid management, and bypasses the need to send field service technicians to every household. However, new challenges accompany this development, namely the ability to manage and secure these communication links.
Security:
Although AMI offers numerous advantages, it does leave critical infrastructure vulnerable to ever-increasing cyberthreats. Each connected device represents a portal into the grid network, with any security breach having the potential to bring the grid to a halt. This has been recognized as a matter of national security.
Threats are becoming more complex and targeted. In fact, certain state-sponsored malware such as Stuxnet, Havex, and most recently Industroyer (CrashOverride), have been engineered to directly attack the
“THE INTERNET OF THING(S) WILL HAVE FIVE TO 10 TIMES THE IMPACT ON SOCIETY AS THE INTERNET ITSELF.”John Chambers, chairman and former CEO, Cisco Systems, Inc.
27

supervisory control and data acquisition (SCADA) technology that operates power grids. A holistic design approach becomes critical to efficiently develop and implement the measures required to adequately secure the grid network. The three pillars of a secure design are corporate governance, IT/OT security, and physical security.
Avangrid’s Multi-Layered Security Approach
Avangrid’s Physical and Cyber Security Program exemplifies how a comprehensive design can protect critical infrastructure from all sorts of threats. Avangrid is an energy service company comprised of 8 power utilities that delivered over 37 million MWh of electricity to more than 2.8 million customers. Recognizing industry trends and increasing risks, Avangrid decided to implement an effective security design that rigorously protects critical assets well beyond standard regulatory requirements. To achieve this goal, Avangrid retained the services
of SNC-Lavalin to re-engineer the information in communications technology that supports its physical security program, SCADA systems, AMI, and over 1,000TB of data. The new multilayered infrastructure now provides world-class physical and cyber protection and improves performance.
Conclusion
The advent of AMI technology coupled with the increasing complexity of cyberthreats puts the power industry at a critical juncture. Power utilities are in the midst of this transformation, as technology and innovation disrupt traditional models. Those who do not adapt, or fail to plan for the implementation of the new technology without considering modern security threats will expose their companies, clients, and communities to great risks. Security cannot be an after-thought, and needs to be considered early-on as part of a comprehensive design.
28

Conclusion
29

Data will continue to grow exponentially. Decreasing costs of sensors will move more and more operational equipment and devices onto the Internet of Things. Utilities are in an excellent position to capitalize on big data and analytics to gain wisdom and insight into areas where efficiencies can be gained.
Analytical solutions allow utilities to mine the data and capture insight from it. Insight that will make their maintenance programs extend the life of their assets, make their energy efficiency programs a success and reduce line losses, just to name a few.
Success in analytics is based on a foundation of data, integration, insight, collaboration and innovation.
When big data arrives, if it isn’t already the case at your utility, benefits will not be derived immediately, there will be periods of trial and error before benefits are realized. The costs of implementation are high and need to be understood before implementing a big data and analytics platform. That said, it is important to act and start small!
DATA WILL CONTINUE TO GROW EXPONENTIALLY. HARNESSING ITS POWER IS ESSENTIAL TO OUR FUTURE.
30

This White Paper was prepared by Canadian Electricity Association (CEA), the national forum and voice of the evolving electricity business in Canada, in collaboration with MNP, Siemens Canada and SNC Lavalin.
ABOUT MNPMNP is a leading national accounting, tax and business consulting firm in Canada. We proudly serve and respond to the needs of our clients in the public, private and not-for-profit sectors. Through partner-led engagements, we provide a collaborative, cost-effective approach to doing business and personalized strategies to help organizations succeed across the country and around the world.
MNP 300-111 Richmond Street West Toronto, Ontario M5H 2G4 416-596-1711 www.mnp.ca
ABOUT SIEMENS CANADA Siemens Canada is a leading technology partner that has stood for engineering excellence, innovation, quality and reliability for more than 100 years. Siemens’ expertise in the fields of electrification, automation and digitalization helps make real what matters to Canada, delivering solutions for sustainable energy, intelligent infrastructure, healthcare and the future of manufacturing. One of the world’s largest producers of energy-efficient, resource-saving technologies, Siemens is a foremost supplier of power generation and power transmission solutions and a pioneer in infrastructure solutions as well as automation, drive and software solutions for industry. The company is also a leading provider of medical imaging equipment and laboratory diagnostics as well as clinical IT. The company has approximately 5,000 employees, 44 offices and 15 production facilities from coast-to-coast. Sales for Siemens Canada in fiscal 2016 (ended September 30), were $3.1 billion CAD.
Siemens Canada Limited 1577 North Service Road East Oakville, Ontario L6H 0H6 905-465-8000 www.siemens.ca
ABOUT SNC LAVALINWith over 100 years’ experience, SNC Lavalin is a leading global engineering services provider who now employs more than 50,000 professionals. Our fully integrated solutions comprise project management, financing, training, procurement, and maintenance. SNC-Lavalin maintains exceptionally high standards for health and safety, ethics and compliance and environmental protection. We are committed to delivering quality projects on budget and on schedule to the complete satisfaction of our clients.
SNC’s Telecommunications division provides comprehensive physical and cyber security solutions to clients in the power sector. Our Critical Infrastructure Protection (CIP) solutions help utility companies ensure the reliable delivery of electricity, increase operational efficiency, comply with regulations, reduce costs and environmental impacts, and drive end-user satisfaction.
SNC Lavalin Inc. 455 René-Lévesque Boulevard West Montréal, Québec H2Z1Z3 514-393-1000 www.snclavalin.com
ABOUT CEACanadian Electricity Association (CEA) members generate, transmit and distribute electrical energy to industrial, commercial, residential and institutional customers across Canada every day. From vertically integrated electric utilities, independent power producers, transmission and distribution companies, to power marketers, to the manufacturers and suppliers of materials, technology and services that keep the industry running smoothly — all are represented by this national industry association.
Canadian Electricity Association 1500-275 Slater Street Ottawa, Ontario K1P 5H9 613-230-9263 www.electricity.ca

275 Slater Street, Suite 1500 Ottawa, Ontario K1P 5H9
tel. 613 230 9263
fax. 613 230 9326
www.electricity.ca