Data Points Structure Explanatory Documentation - Eurofiling · Data Points Structure Explanatory...
17
Data Points Structure Explanatory Documentation Version: 0.2 (Public Draft) Publication date: 2009-12-08 Abstract This document contains a description of an approach for the explicit, consistent and coherent identification of reportable information. This approach, named Data Points Structure, has been developed for the purposes of the Eurofiling project and. Data Points Structure is a form of representation of reporting requirements. The reporting requirements under consideration here have been defined by the Committee of European Banking Supervisors (C-EBS). The Data Point Structure is achieved by the identification of reportable information which are then classified as data points that have a specified nature and that can be characterized using consistently applied breakdowns. Status: This document is a public draft. It may be updated during the process of the development of the taxonomy following modification of the reporting requirements and/or through introduction of additional functionalities (described in section ‘Current status of and plans for future releases of Data Points Structure’). Final version (1.0) of this document shall be released together with the FINREP taxonomy by the 31st December 2009. This project has been made possible with the financial assistance of the European Union This project can under no circumstances be regarded as reflecting the policies of the European Union
Transcript of Data Points Structure Explanatory Documentation - Eurofiling · Data Points Structure Explanatory...

Data Points Structure Explanatory Documentation
Version: 0.2 (Public Draft)
Publication date: 2009-12-08
Abstract
This document contains a description of an approach for the explicit, consistent and coherent identification of
reportable information.
This approach, named Data Points Structure, has been developed for the purposes of the Eurofiling project
and.
Data Points Structure is a form of representation of reporting requirements.
The reporting requirements under consideration here have been defined by the Committee of European
Banking Supervisors (C-EBS).
The Data Point Structure is achieved by the identification of reportable information which are then classified as
data points that have a specified nature and that can be characterized using consistently applied breakdowns.
Status:
This document is a public draft. It may be updated during the process of the development of the taxonomy
following modification of the reporting requirements and/or through introduction of additional functionalities
(described in section ‘Current status of and plans for future releases of Data Points Structure’). Final version
(1.0) of this document shall be released together with the FINREP taxonomy by the 31st December 2009.
This project has been made possible with the financial assistance of the European Union
This project can under no circumstances be regarded as reflecting the policies of the European Union

Page 2 of 17
Index
Abstract ................................................................................................................................................................... 1
Data points .............................................................................................................................................................. 3
XBRL as a data centric format ............................................................................................................................. 3
Data model and XBRL taxonomy ........................................................................................................................ 3
Definition of a data point .................................................................................................................................... 3
Identification of data points ............................................................................................................................... 4
Format and content of the Data Points Structure .................................................................................................. 8
‘Navi’ sheet ......................................................................................................................................................... 8
Breakdowns ........................................................................................................................................................ 8
‘Base’ sheet ......................................................................................................................................................... 9
‘Tables’ sheet .................................................................................................................................................... 10
Defining and reading Data Points Structure ......................................................................................................... 11
Current status of and plans for future releases of the Data Points Structure .................................................... 17

Page 3 of 17
Data points
XBRL as a data centric format
In principle XBRL is a standard for describing and exchanging business information. Dictionaries/catalogues of
reportable information are defined by means of XBRL taxonomies. Based on these taxonomies, reporting
entities create XBRL instance documents containing facts (eg monetary amounts in a specified currency for a
period or as at a particular date).
XBRL taxonomies contain definitions of reportable business concepts. Each concept is described using XBRL
syntax which results in a set of semantic information about a concept. In this regard XBRL is a data centric
format standard where the main focus is placed on explicit and exact identification of every concept.
Data model and XBRL taxonomy
The development of an XBRL taxonomy is a process of translating business requirements for reportable
information into XBRL format. These requirements are usually expressed in a textual form (standards,
guidelines, regulations, etc). For example, some of the written documentation which underpins the Eurofiling
project includes the following documents:
International Financial Reporting Standards (IFRSs) adopted by the International Accounting Standards
Board (IASB),
Regulation (EC) No 1606/2002 of the European Parliament and of the Council (19 July 2002) on the
application of international accounting standards,
Directive 2006/49/EC of the European Parliament and of the Council (14 June 2006) on the capital
adequacy of investment firms and credit institutions,
Guideline of the European Central Bank (30 July 2002) concerning certain statistical reporting
requirements of the European Central Bank and the procedures for reporting by the national central
banks of statistical information in the field of money and banking statistics (ECB/2002/5)
(2002/656/EC),
Guidelines on Financial Reporting defined by the Committee of European Banking Supervisors (C-EBS).
The textual, or written requirements for the reporting of financial information can be interpreted and
presented in a tabular form. For example, an integral part of the Guidelines on Financial Reporting defined by
the C-EBS FINREP Network is a set of tables and supporting documentation which together explicitly define the
scope and content of reportable information. This set of tables and supporting documentation constitutes the
data model which forms the foundation for the development of the taxonomy.
Definition of a data point
An XBRL taxonomy must define all the information described in the data model in a consistent and explicit
manner. Therefore the first step in the XBRL taxonomy development process is a comprehensive analysis of
the data model. The data model is thoroughly investigated in order to break down the each of the reporting
requirements into what is called a data point.
A data point is a single piece of reportable information described in either the textual documentation and/or a
cell in the tabular format of a data model.
Using reporting requirements that have been described as a set of tables and supporting textual
documentation as the basis of a process of identifying and describing the reportable piece of data assumes
combining the information from:
- underlying financial standards/regulations,
- the purpose of a table is usually expressed by its title, thus describing in general the type and
character of information required by the content of a table,
- intersection of a header of a row and a header of a column which names the required information in
context of a table,

Page 4 of 17
- location in a hierarchy in headers or rows and headers of column,
- supportive documentation, ie explanatory guidelines that are issued and published along with the data
model,
- overall analysis of all tables and supporting documentation that allows to identify implicit information
that is not explicitly expressed in an analyzed table.
At the end of this process each data point results in a financial concept. A data point as a financial concept is
characterized by defining its basic financial meaning (nature) and specifying information of breakdowns in
which it is described in different tables or paragraphs of documentation. An outcome of this process is a
complete set of data points that are required to be reported explicitly describing all characteristics and allowing
to identify relations between data points located in different tables or paragraphs of documentation.
Identification of data points
The basic financial meaning of a concept relates to its nature. A concept can be in nature of an asset, a liability,
an income, an expense, a gain (loss), etc. Additionally, a concept is described by different characteristics
depending on the purpose of a particular table in which it is placed. For example Table 1.1 of the FINREP, which
is one of the core FINREP tables, describes a major breakdown of assets. They are broken down by categories.
Some categories are further broken down by instruments and even deeper by risk type, etc. (Fig 1).
Fig 1

Page 5 of 17
In Table 1.1 presented on Fig 1, data points are cells with yellow background. Information requested in this
table is in nature of assets1. Therefore “Assets” is the basic financial meaning of all data points defined in this
table.
These “Assets” are broken down by main categories2 such as: “Cash and cash equivalents”, “Cash on hand”,
“Demand deposits and cash equivalents”, “Held for trading”, “Designated at fair value through profit or loss”,
etc. These categories are characteristics that describe and distinguish between data points of the nature of
“Assets”.
Some categories of “Assets” are further broken down by instruments. This information needs to be included
when characterizing a data point. For example “Assets” in category “Loans and receivables” are further broken
down by “Debt securities” and “Loans and advances”. It is important to stress at this point, that although
instruments breakdown plays a secondary role in Table 1.1, in other tables (eg Table 7, 20A) it becomes a
primary breakdown superior to main categories (eg in Table 7 “Equity instruments” refers jointly to “Held for
trading”, “Designated at fair value through profit or loss” and “Available for sale”).
Furthermore it is also necessary to notice, that other categories eg “Demand deposits and cash equivalents”
can also be broken down by instruments (Fig 2 presents Table 5A) but this information is not reflected in Table
1.1. It means, that although it is not explicitly defined in Table 1.1, implicitly this breakdown is applied and the
data point for “Assets” in category “Demand deposits and cash equivalents” in Table 1.1 contains a total for the
instruments breakdown applied in Table 5A.
Fig 2
Additionally, as presented on Fig 2, Table 5A contains also another classification of instruments under
“Demand deposits and cash equivalents” which is by counterparties. As a consequence, data points defined for
Tables 1.1 need to express this information.
The opposite situation, where detailed non-core tables do not contain explicit information on a breakdown that
is applied in the core tables is also possible. For example Table 15A presented on Fig 3 does not explicitly
indicate that all amounts are “Carrying amounts” but this information must be reflected when defining data
points for this table.
1 In case of this table it is described in the title but it is not a rule and some tables may contain information on
concepts with different nature. 2 We refer to these categories as “main” due to the fact, that they are detailed or referred to in most of the
tables of the data model and constitute the major breakdown for concepts with different basic financial meaning (eg assets, liabilities, income, expenses, gains, losses, impairment, allowances, etc).

Page 6 of 17
Fig 3
Another source of implicit information on breakdowns is supporting documentation. For example, Guidelines
on Implementation of the Framework for Consolidated Financial Reporting (FINREP) published by the C-EBS in
Chapter 1, Section 4 define that:
13 The scope of consolidation under FINREP is the Capital Requirements Directive scope (CRD), which shall
be applied to all templates.
14 Furthermore the following templates: 1 Consolidated Balance Sheet Statement [Statement of Financial
Position], 2 Consolidated Income Statement, 3 Derivatives held for trading, 4 Derivatives - Hedge
accounting, 13 Tangible and intangible assets, 20 Breakdown of selected items of income statement,
21 Statement of comprehensive income and 22 Statement of changes in equity can be collected using
the IFRS scope of consolidation in addition to the CRD scope of consolidation. Table 25 Scope of the
group provides information on both scopes. All other templates shall be collected using the CRD scope
of consolidation only. National supervisors shall publicly disclose the scope of consolidation for each
template. Information collected with IFRS scope of consolidation shall be consistent with public
financial disclosure.
It means, that for certain data points only the CRD scope of consolidation can be applied, for others it may be
only IFRS and for some it must be CRD but may be additionally IFRS. This characteristic must be incorporated in
the definition of a data point.
Referring back to Table 1.1 presented on Fig 2, it is important to state that some breakdowns are applicable to
all data points in a table while some can be applied only to certain data points. For example “Carrying amount”
from the amounts breakdown can be applied to all data points while instruments breakdown is applicable only
to certain categories of assets. Similar situation relates to risk type breakdown which is applied only to
instrument “Derivatives” and category “Macro [portfolio] fair value hedges” and “Macro *portfolio+ cash flow
hedges”3.
3 This classification needs to be further investigated in future releases of FINREP due to the fact that non-
derivative instruments held for hedging fall into other categories of assets.

Page 7 of 17
Breakdowns can be shared by data points of different nature. For example, Table 2 contains data points that
are of a nature of income, expenses, gains (losses), etc. and, as presented in Fig 4, can also be assigned with the
main categories breakdown (which in its origin contains primary classification of balance sheet items). This is
logically correct as sources of gains or losses are products that fall into different categories of assets and
liabilities. Similar reasoning can be applied to impairment, allowances, etc. In any case information from the
breakdown needs to be interpreted from the point of view of a basic financial meaning of a concept (its
nature).
Fig 4
Such modelling techniques allows for the explicit, consistent and coherent development of the data model. It
is explicit due to the fact, that referred breakdowns are complete which allows one to clearly identify the
required information from the set of possible values. Consistency is maintained by applying everywhere a
single breakdown. In such case a change to a breakdown is applied in all places where the breakdown is used.
Coherent modelling will for example, allow the analysis of implication of planned changes in the IFRS
classification of financial instruments in all tables where this breakdown is applied regardless of the nature of
required information (ie if is ‘Statement of financial position’, ‘Income statement’ or non-core tables).
Page 8 of 17
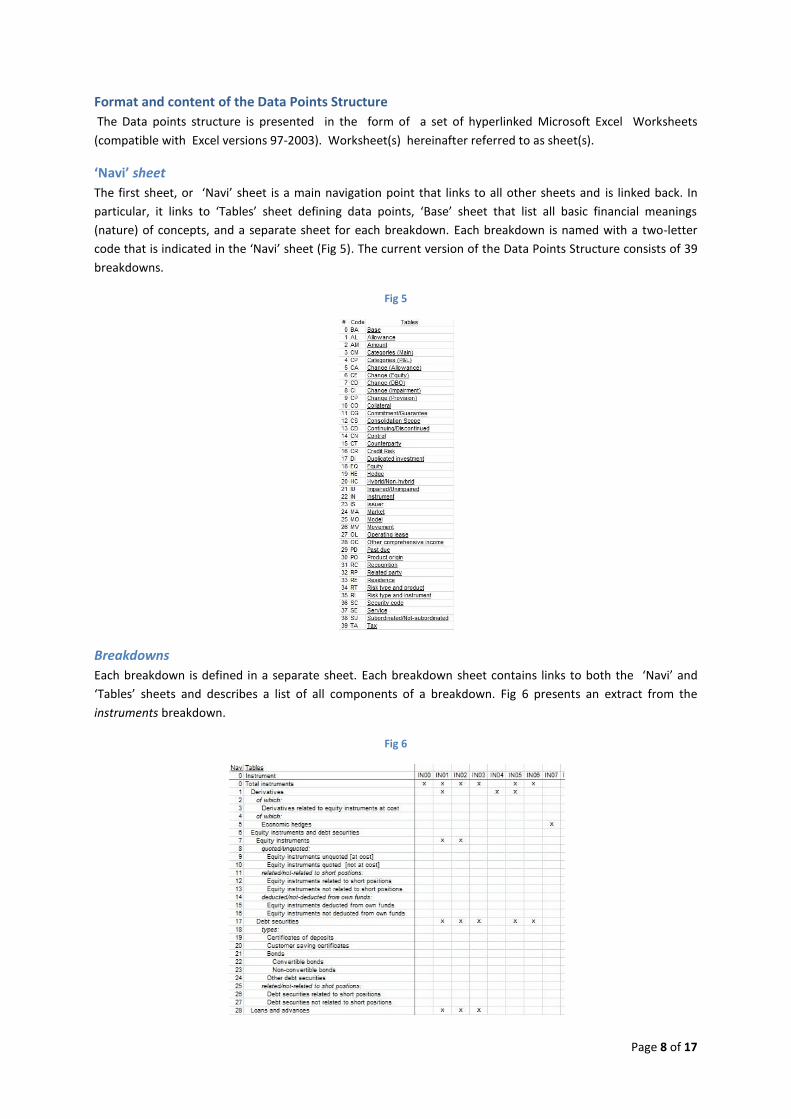
Format and content of the Data Points Structure
The Data points structure is presented in the form of a set of hyperlinked Microsoft Excel Worksheets
(compatible with Excel versions 97-2003). Worksheet(s) hereinafter referred to as sheet(s).
‘Navi’ sheet
The first sheet, or ‘Navi’ sheet is a main navigation point that links to all other sheets and is linked back. In
particular, it links to ‘Tables’ sheet defining data points, ‘Base’ sheet that list all basic financial meanings
(nature) of concepts, and a separate sheet for each breakdown. Each breakdown is named with a two-letter
code that is indicated in the ‘Navi’ sheet (Fig 5). The current version of the Data Points Structure consists of 39
breakdowns.
Fig 5
Breakdowns
Each breakdown is defined in a separate sheet. Each breakdown sheet contains links to both the ‘Navi’ and
‘Tables’ sheets and describes a list of all components of a breakdown. Fig 6 presents an extract from the
instruments breakdown.
Fig 6

Page 9 of 17
The hierarchical structure of a breakdown is created using indents. Components of a breakdown may have an
alternative structuring. For example, as presented in Fig 6, “Equity instruments” can be structured by
“quoted”/”unquoted”, “related to short positions”/”not-related to short positions” and “deducted from own
funds”/”not-deducted from own funds”. These alternatives must not be mixed together as they express
different classifications of the same thing.
It is possible that a breakdown reuses components of another breakdown. For example other comprehensive
income breakdown gathers some components from main categories (see Fig 7). Relation to another breakdown
is signalled using the two-letters code as defined in the ‘Navi’ sheet.
Fig 7
Following the normalization process some initially identified breakdowns has been merged or incorporated into
other breakdowns. For example types of hedges applying to assets and liabilities have be incorporated into
main categories breakdown while types of loans and advances, deposits and debt securities are in instruments
breakdown.
Under the current version of the Data Points Structure, breakdowns provide information on all applicable
combinations of their components. Each combination is named using a two-letters code of a breakdown
followed by two digits. This approach is called “merged” Data Point Structure. It is planned for the next releases
of the Data Point Structure to define each data point separately. In this “split” approach each component of a
breakdown will be assigned a unique code.
‘Base’ sheet
Basic financial meanings of data points (list of possible natures) is defined in ‘Base’ sheet. An extract form this
list is presented in Fig 8.
Fig 8

Page 10 of 17
This list is the result of a thorough analysis of the entire data model. Although Data Point Structure is by
definition independent from technology, some basic assumption of XBRL has been reflected in this list. This
assumption is a split of concepts into instant (stocks) and duration (flows). As a result the list contains separate
concepts for “Assets” and “Changes in assets”, “Equity” and “Changes in equity”, etc. Alternatively, this
characteristic could be expressed by another breakdown.
‘Tables’ sheet
Each Data point as a financial concept is characterized by defining its basic financial meaning (nature) and
specifying information of breakdowns in which it is described in different tables or paragraphs of
documentation. This description of data points is contained in the ‘Tables’ sheet. The general structure of the
‘Tables’ sheet is presented on Fig 9.
Fig 7
Colours used in Fig 9 represent different types of information contained in the ‘Tables’ worksheet. Red colour is
the basic financial meaning (nature), blue colour represents breakdowns and green colour contains references
to the underlying data model (identification of a table and a cell/set of cells).
Under the current version of the Data Points Structure each line represents a data point or a set of data points.
A data point or a set of data points from the data model (identified by indicating a number of a table and range
within a table in the data model) is characterized by its/their base financial meaning (from ‘Base’ sheet) and
applicable breakdowns (combinations of components from sheets on different breakdown)4.
4 It is planned for the next releases of the Data Point Structure to identify each data point separately. This shall
allows for more comprehensive analysis of data points in the ‘Tables’ sheet and more exact identification of the relationship between data points across the tables of the data model.

Page 11 of 17
Defining and reading Data Points Structure
Definition of the Data Points Structure starts with the thorough analysis of the data model. Comprehensive
study of the data model results in the identification of a list of basic financial meaning (natures) of data points
and description of all applicable breakdowns and their components. ‘Base’ sheet is filled out with basic
financial meaning (nature) of concepts and a separate sheet is created for each breakdown containing its
components in a form of a hierarchical tree structure (including alternative structures of components). The
summary information of all breakdowns is listed in the ‘Navi’ sheet. A skeleton of ‘Tables’ sheet is drafted
containing a column for identification of a basis financial meaning (nature), a column for each breakdown and
additional columns for referencing the content of the data model (‘FINREP table’ and ‘Range in FINREP tables’).
The next step comprises of analysis of the data model cell by cell and description of each data point or a set of
data points in the ‘Tables’ sheet. This process starts with determining a nature of a data point. Following this
step a data point is characterized with all applicable breakdowns including those that are explicitly identified in
a table and those are implicit (inherited from other tables, resulting from supporting documentation or
assumed by default).
This procedure is described and illustrated below using the example of an extract from Table 5A (Fig 10).
Fig 10
In the first step the nature of data points is characterized. List of all natures can be found in the ‘Base’ sheet
(Fig 11).
Fig 11
From this list an applicable nature is selected. In case of Table 5A the basic meaning of all data points is
“Assets”. This nature is input in the ‘Base’ column in “Tables” sheet (Fig 12).

Page 12 of 17
Fig 12
Current version of the Data Points Structure allows the definition of data points for each cell or a set of cells
that share common characteristics. In case of Table 5A the explicit characteristic (defined in this table) relate to
breakdowns by main categories, by instruments, by counterparties and by amount. This information can be
discovered when browsing all breakdowns by clicking on hyperlinks that are in the headers of columns in
‘Tables’ sheet and matching with the analyzed table of the data model. Some breakdowns and their
components may be applicable to all data points but some apply only to certain data points. In Table 5A all
explicitly identified breakdowns are applicable to all data points but detailing components of breakdown by
counterparties are applicable only to “Debt securities” and “Loans and advances”. Therefore Table 5A must be
described as two sets of data points.
The first set of data points has following characteristics:
- “Demand deposits and cash equivalents” from categories (main) breakdown (as indicated in the title
of Table 5A),
- “Carrying amount” from amounts breakdown,
- “Total instruments”, “Equity instruments”, “Debt instruments” and “Loans and advances” from
instruments breakdown,
- “Total counterparties” form counterparties breakdown.
This set of data points is described by cell with red background on Fig 13.
Fig 8
The second set of data points consists of:
- “Demand deposits and cash equivalents” from categories (main) breakdown (as indicated in the title
of Table 5A),
- “Carrying amount” from amounts breakdown,
- “Debt instruments” and “Loans and advances” from instruments breakdown,

Page 13 of 17
- “Total counterparties”5, “Central banks”, “General governments”, “Credit institutions”, “Other
financial corporations” and “Corporates” form counterparties breakdown.
This set of data points is presented on Fig 14 in green colour.
Fig 9
Identified the sets of data points are described in the Data Points Structure.
For the categories (main) breakdown in the first set of data points the applicable components are identified in
‘Categories (Main)’ sheet that list the entire breakdown. A cross (x) on the intersection of the components
(headers of rows) and the code (headers of columns) identifies the applicable combination. “Demand deposits
and cash equivalents” as a single component of the categories (main) breakdown is identified with the code
‘CM17’ (Fig 15).
Fig 10
This information needs to be reflected in the ‘Tables’ sheet (Fig 16).
5 In the current “merged” version of the Data Points Structure some data points can be defined twice, once
within the total of applicable breakdown and once within the detailed structure. Under the “split” version of Data Points Structure each data point will be defined separately only once for a table.

Page 14 of 17
Fig 11
In the amounts breakdown (‘Amounts’ sheet) “Carrying amount” is identified with code ‘AM02’ (Fig 17).
Fig 12
Double zero (00) in codes of combinations is reserved for a total component of a breakdown or assumed
‘default’ value. Therefore total for the counterparties breakdown (‘Counterparty’ sheet) is coded ‘CT00’.
The final explicit breakdown in the first set of data points of Table 5A is instruments and the applicable
components are “Total instruments”, “Equity instruments”, “Debt instruments” and “Loans and advances” (Fig
18).
Fig 13
All this information is reflected in the ‘Tables’ sheet by referring to codes of applicable combinations of
components of breakdowns. Additionally, the last column of the ‘Tables’ sheet contains reference to cells or a

Page 15 of 17
range of cells in the data model for which the data point or a set of data points is defined (Fig 19). The first set
of data points for Table 5A relates to range: ‘C6;C7;C13;C19’ (see Fig 13).
Fig 19
A similar procedure is conducted for the second set of data points. This set refers to identical codes of
combinations of components in amount and categories (main) breakdown but different for instruments (only
“Debt instruments” and “Loans and advances” components – see Fig 20) and counterparties breakdown (“Total
counterparties” , “Central banks”, “General governments”, “Credit institutions”, “Other financial corporations”
and “Corporates” – see Fig 21).
Fig 20
Fig 21
Additionally, to both sets of data points the implicit information on breakdowns is added. For example,
according to Table 15A all assets can be broken down by residence therefore Table 5A contains information on

Page 16 of 17
total for that breakdown. In addition to that, the supporting documentation (guidelines) allows only CRD scope
of consolidation for Table 5A so this component of consolidation scope breakdown must be applied.
Final comprehensive description of Table 5A in form of the data points is presented on Fig 22.
Fig 22

Page 17 of 17
Current status of and plans for future releases of the Data Points Structure
The current version of the Data Points Structure has been defined based on the data model provided by the C-
EBS FINREP Network on 5th
November 2009 and as updated for answers to questions raised on this version
(from 30st
November and 4th
December) as well as an updated version of the data model and supporting
documentation provided by the C-EBS FINREP Network on 30st
November. A list of question and answers is
attached to this document – AttachmentA_QuestionsAndAnswersOnFINREPTablesDataModel20091204.pdf.
For future releases it is planned that the Data Point Structure will be reviewed with the assistance of members
of the C-EBS FINREP Network.
Although the first version of the Data Points Structure has been drafted and released, the approach is still
under development and may be modified, enhanced and updated in terms of scope of functionality and
reporting requirements of FINREP.
In particular, planned but not yet implemented features and changes include:
(i) switching from the “merged” data points approach (440 data points or sets of data points) to the “split”
data points approach (over 2,700 data points) and
(ii) creating hyperlinks between the Data Points Structure and the data model.