DATA MINING USING K-MEANS CLUSTERING ALGORITHM...
13
DATA MINING USING K-MEANS CLUSTERING ALGORITHM TO DETERMINE THE REGION PROMOTION Winda Widya Ariestya*, Ida Astuti*, and Wahyu Supriyatin*** This study aims to determine the distribution of sales territories based on invoice data police vehicle sales four-wheel from January to may 2017. The purpose of the data processing business by selling the police invoice is to increase sales next month so it can be used as a basis for decision making determine the proper promotion region. The method used through several stages of data selection, preprocessing stage, data transformation, data mining uses an algorithm K-Means Clustering and the last stage is the stage of the interpretation/evaluation of results. Results showed three clusters where cluster the first consists of 4002 customers spread into 9 regions, cluster the second consists of 172 customers spread over 11 regions and cluster the third consists of 51 consumers were dispersed into 7 regions. Keyword: Data mining, K-Means Clustering, Region, Promotion 1. Introduction Advances in information technology are growing rapidly in all areas of life. Lots of data generated by advanced information technologies, ranging from the fields of industry, economy, science, and technology as well as many other areas of life. The application of information technology in the economic field can also produce abundant data about data distribution marketing area, market segmentation, product selection decisions are the most superior and others. From the data collected can generate hidden information and know the information, it is necessary to data processing. The data have been obtained was then processed to determine the pattern of these data so that we can take the hidden information from these data. Data processing methods like these are often referred to as data mining. PT. Mobilindo Palembang Branch is an automotive company engaged in sales promotion vehicle four-wheel. The area spread to different areas, so it takes a specific strategy by the marketing in marketing to find new customers in order to campaign carried out more effectively and efficiently. In this study will be carried out data processing based on the invoice police from January to May 2017 using the K-Means clustering. By using this method, the data that have been obtained can be classified into several clusters based on the similarity of these data, so that data which have the same characteristics are grouped in one cluster and which have different characteristics grouped into clusters that others who have the same characteristics. With the groupings of data, it is expected to determine the distribution of the marketing and sales area increased sales in the following months so that it can be used as a basis for a decision to determine the appropriate promotion of the region.
Transcript of DATA MINING USING K-MEANS CLUSTERING ALGORITHM...

DATA MINING USING K-MEANS CLUSTERING ALGORITHM
TO DETERMINE THE REGION PROMOTION
Winda Widya Ariestya*, Ida Astuti*, and Wahyu Supriyatin***
This study aims to determine the distribution of sales territories based on
invoice data police vehicle sales four-wheel from January to may 2017.
The purpose of the data processing business by selling the police invoice
is to increase sales next month so it can be used as a basis for decision
making determine the proper promotion region. The method used through
several stages of data selection, preprocessing stage, data transformation,
data mining uses an algorithm K-Means Clustering and the last stage is
the stage of the interpretation/evaluation of results. Results showed three
clusters where cluster the first consists of 4002 customers spread into 9
regions, cluster the second consists of 172 customers spread over 11
regions and cluster the third consists of 51 consumers were dispersed into
7 regions.
Keyword: Data mining, K-Means Clustering, Region, Promotion
1. Introduction
Advances in information technology are growing rapidly in all areas of life. Lots of data generated by advanced information technologies, ranging from the fields of industry, economy, science, and technology as well as many other areas of life. The application of information technology in the economic field can also produce abundant data about data distribution marketing area, market segmentation, product selection decisions are the most superior and others. From the data collected can generate hidden information and know the information, it is necessary to data processing. The data have been obtained was then processed to determine the pattern of these data so that we can take the hidden information from these data. Data processing methods like these are often referred to as data mining. PT. Mobilindo Palembang Branch is an automotive company engaged in sales promotion vehicle four-wheel. The area spread to different areas, so it takes a specific strategy by the marketing in marketing to find new customers in order to campaign carried out more effectively and efficiently. In this study will be carried out data processing based on the invoice police from January to May 2017 using the K-Means clustering. By using this method, the data that have been obtained can be classified into several clusters based on the similarity of these data, so that data which have the same characteristics are grouped in one cluster and which have different characteristics grouped into clusters that others who have the same characteristics. With the groupings of data, it is expected to determine the distribution of the marketing and sales area increased sales in the following months so that it can be used as a basis for a decision to determine the appropriate promotion of the region.
2. Literature Review
Marketing Should encourage other departments in the company to be customer-oriented and market-oriented, marketing or customer must convince people in the company and acquired greater to create and submit a superior customer value (Philip Kotler, 1997). Marketing is not just a department but the marketing is a process full of insight and regularly to think about and plan market. Johan Oscar Ong, 2013 , using k-means clustering algorithm, namely by classifying the data of students into several clusters based on the characteristics of this data in order to discover the information hidden from the data set of student who have graduated from President University. Hasitha Indika Arumawadu, R. M. Kapila Tharanga Rathnayaka, S. K. Illangarathne, 2015, using K-means clustering method to evaluate the cluster customers’ profitability in telecommunication industry in Sri Lanka. Furthermore, RFM model mainly used as an input variable for K-means clustering and distortion curve used to identify optimal number of initial clusters. Based on the results , telecommunication customers’ profitability in Sri Lanka mainly categorized into three levels
Data Mining Data mining is a method of processing data to find hidden patterns from data. The results of data processing by methods data mining can be used to make decisions in the future. Data mining is also known as pattern recognition (Santosa, 2007). Data mining is a large-scale data processing method therefore, data mining has an important role in the field of industry, finance, weather, science, and technology. In general, the study discusses the data mining methods such as clustering, classification, regression, variable selection, and market basket analysis (Santosa, 2007). According to (Larose, 2006), data mining is divided into several groups based on the tasks that can be done, namely: a. Description Sometimes researchers and analysis simply wanted to try to find a way to describe patterns and trends contained in the data. b. Estimates Estimates similar to the classification, unless the target variable estimation direction from the direction of the numeric category. c. Prediction Prediction is similar to the classification and estimation, except that the predictive value of the results will be there in the future. d. Classification In the classification, there are targets categorical variables. e. Clustering Clustering is a method to locate and classify data that have similar characteristics (similarity) between the data with the other data. Clustering is one method of data mining that is without direction (unsupervised).

f. Association Associations in the task data mining are to find attributes that appear in a given time. In the business world, commonly called shopping cart analysis.
The method of Data Mining According to the Larose (2006) data mining to own six phases of CRISP-DM (Cross Industry Standard Process for Data Mining);
a. Business Understanding Phase
b. Data Understanding Phase
c. Data Preparation Phase
d. Modeling Phase
e. Evaluation Phase
f. Deployment Phase
Figure 1. Process Data Mining
Clustering Basically, clustering is a method to locate and group data that have similar characteristics (similarity) between the data with the other data. Clustering is one method of data mining that is without direction (unsupervised), meaning that this method is applied in the absence of exercise (training) and without a teacher and does not require an output target. In the data mining, there are two types of clustering methods used in the grouping of data that is clustering non-hierarchical and hierarchical clustering (Santosa, 2007).
K-means clustering
The traditional K-means clustering is most used technique but it depends on selecting initial centroids and assigning of data points to nearest clusters. There are more advantages than disadvantages of the k-means clustering but it still need some improvem ents. The techniques that improves the techniques for determining initial centroids and assigning data points to its nearest clusters with more accuracy with time complexity of O(n) which is faster than the traditional k-means (Unnati R. Raval and Chaita Jani, 2016) K-means clustering algorithm in fact one of its kinds systematic modus operandi for perceiving the performance metrics for the benefit of the policy makers, scientific community and the society at large. R. S. Kamath and R. K. Kamat, 2016, has analyzed the number of research publications, patent applications and trademarks registered with reference to percentage of GDP spending on R&D. Unsupervised learning algorithm used for designing three clusters of countries based on these dataset.

K-means clustering is a method of non-hierarchical clustering of data that categorize the data in the form of one or more clusters/groups. Data that have the same characteristics are grouped into one cluster/group and data that have different characteristics grouped by cluster/group to another so the data are in one cluster/group has a small degree of variation (Agusta,2007). According to Santosa (2007), the steps do clustering with method K-Means is as follows: a. Select the number of clusters K. b. Initialize k centers cluster can be done in various ways. But most often done by random manner. Cluster centers rated beginning with random numbers. c. Allocate all data/objects to the nearest cluster. The proximity of the two objects is determined by the distance of the object. Similarly, the proximity of of data to cluster particular the specified distance between the data with the center. Cluster in this stage should be calculated within each data into each center. Cluster the greatest distance between the data with a cluster particular will determine the data included in the cluster where. To calculate the distance of all data to any point in the center of the cluster can use the theory of the Euclidean distance which is formulated as follows:
where: D (i, j) = Distance data into i to the cluster center j X ki= Data to i on attribute data into k x kj= the center point to j on attribute to k d. Recalculate center of the cluster with membership. cluster the current Center of the cluster is the average of all the data/objects in a cluster. If particular desired, you can also use the median of the cluster. So the average (mean) is not the only measure that can be used.
e. Assign each object again wear center. cluster the new If the cluster centers do not change again the process clustering is completed. Or, go back to step 3 until the center's cluster do not change anymore.
RapidMiner RapidMiner is an environment machine learning data mining, text mining and predictive analytics (Han, J, and Kamber, M).
3. The Methodology The method used through several stages of data selection, preprocessing stage, data transformation, data mining uses an algorithm K-Means Clustering and the last stage is the stage of the interpretation / evaluation of results.
4. The findings Data selection Internal data is the data collected by an organization to describe the state or activities of the organization concerned and are useful for the purposes of daily activities and internal
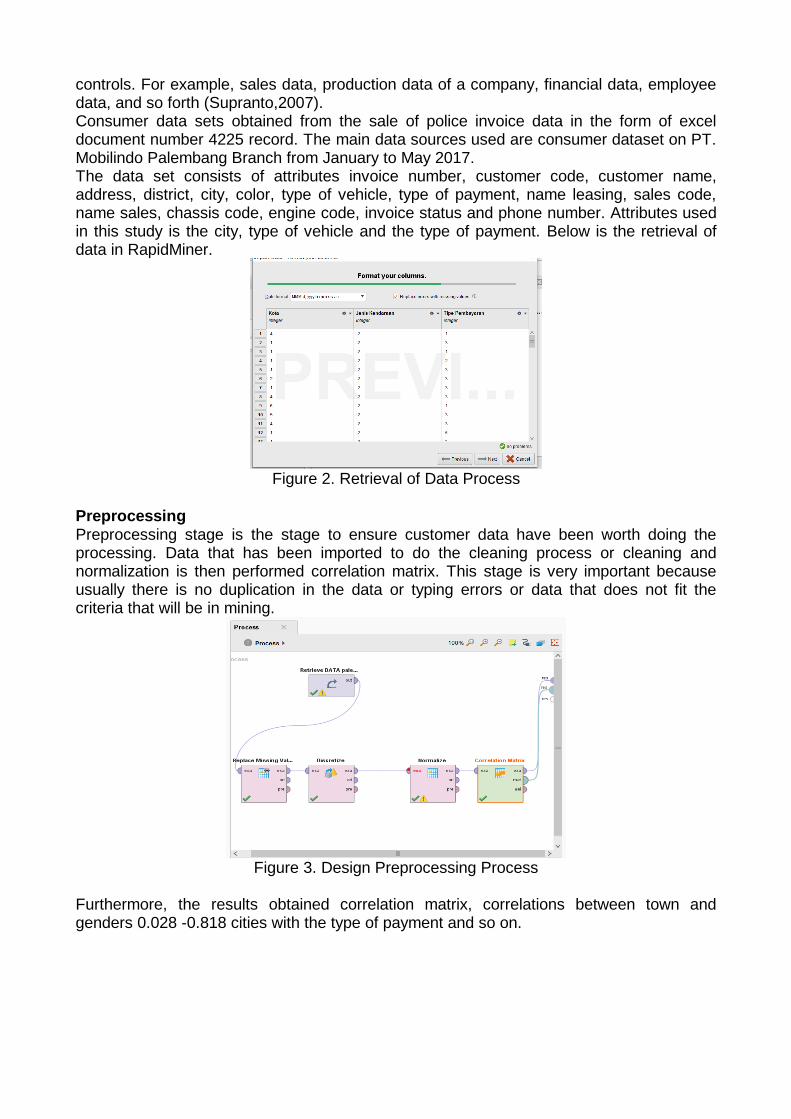
controls. For example, sales data, production data of a company, financial data, employee data, and so forth (Supranto,2007). Consumer data sets obtained from the sale of police invoice data in the form of excel document number 4225 record. The main data sources used are consumer dataset on PT. Mobilindo Palembang Branch from January to May 2017. The data set consists of attributes invoice number, customer code, customer name, address, district, city, color, type of vehicle, type of payment, name leasing, sales code, name sales, chassis code, engine code, invoice status and phone number. Attributes used in this study is the city, type of vehicle and the type of payment. Below is the retrieval of data in RapidMiner.
Figure 2. Retrieval of Data Process
Preprocessing Preprocessing stage is the stage to ensure customer data have been worth doing the processing. Data that has been imported to do the cleaning process or cleaning and normalization is then performed correlation matrix. This stage is very important because usually there is no duplication in the data or typing errors or data that does not fit the criteria that will be in mining.
Figure 3. Design Preprocessing Process
Furthermore, the results obtained correlation matrix, correlations between town and genders 0.028 -0.818 cities with the type of payment and so on.

Figure 4. Results Correlation Matrix
Figure 5. Correlation Between Attributes
Below are the results of normalization of data
Figure 6. Results of Normalization Of Data
Figure 7. Results of Normalization of Data (Statistics)
Phase Transformation of Data in the form of nominal data such as city, type of vehicle and the type of payment must be made in advance in the initialization process the data into the numerical form.
a. Initialization city

From 4225 nominal data initialization city conducted in accordance with the greatest frequency.
Table 1. Initialization City
City Frequency Initials
PALEMBANG 2865 1
BANYUASIN 455 2
MUSI BANYUASIN 374 3
OGAN ILIR 141 4
OGAN KOMERING ILIR 120 5
MUARA ENIM 88 6
OGAN KOMERING ULU 75 7
LAHAT 26 8
PRABUMULIH 25 9
JAMBI 13 10
LUBUK LINGGAU 12 11
PANGKALPINANG 11 12
EMPAT LAWANG 6 13
MUSI RAWAS 6 14
PAGARALAM 5 15
KABUPATEN PENUKAL ABAB LEMATANG
ILIR 2 16
BANGKA 1 17
b. Initialization types of vehicles
Table 2. Initialization Types
Type of Vehicle Frequency Initials
GRAN MAX 1459 1
AYLA 1343 2
XENIA 917 3
TERIOS 334 4
SIRION 82 5
LUXIO 82 6
HI MAX 8 7
c. Initialization payment types
Table 3. Initialization Payment
Type of Payment Frequency Initials
CR4 1377 1
CR3 932 2
CR5 868 3
CASH 826 4
CR2 126 5
CR6 60 6
CR1 36 7
Following multiple datasets generated
Table 4. Datasets Generated
City Type of Vehicle Type of Payment
4 2 1

1 2 3
1 2 1
1 2 2
1 2 3
2 2 3
1 2 3
4 2 3
6 2 1
5 2 3
4 2 3
3 2 3
1 2 3
1 2 3
1 2 3
1 2 2
1 2 3
1 2 1
Data Mining Modeling is the phase that directly involves technique data mining is to perform the selection techniques of data mining and determine the algorithm to be used. The tool is used RapidMiner.
Figure 8. Flowchart RapidMiner
Used K-Means algorithm, and to explain our use displays results on the design performance. The correlation matrix in connecting with clustering, meaning that the data that has been done in the previous stage is connected to be processed using the K-Means algorithm. Parameter K is used as much as 3 means division cluster on the data as much as 3. Results cluster K-Means in the rapid implementation of a miner was:

Table 5. Results Cluster K-Means
Cluster Model
cluster_
0 4002
cluster_
1 172
cluster_
2 51
Total
number
of items 4225
Here are some examples of cluster results:
Table 6. Sample Results Cluster K-Means
City Type of
Vehicle
Type of
Payment Cluster
4 2 1 cluster_0
1 2 3 cluster_0
1 2 1 cluster_0
1 2 2 cluster_0
1 2 3 cluster_0
5 2 3 cluster_0
1 5 1 cluster_1
1 5 6 cluster_1
7 5 4 cluster_1
1 2 1 cluster_0
11 2 3 cluster_2
2 2 2 cluster_0
1 2 1 cluster_0
1 2 3 cluster_0
11 2 4 cluster_2
1 2 3 cluster_0
2 2 1 cluster_0
1 2 3 cluster_0
4 2 3 cluster_0
1 2 4 cluster_0
Here is the design of data mining process using K-Means algorithm:

Figure 9. Design of Data Mining Process
Here are the results that are run clustering K-Means algorithm:
Figure 10. Result Clustering
Figure 11. Result Clustering (Statistic)

Figure 12. Result Clustering (Missing Values)
Next result vector performance as below
Figure 13. Result Vector Performance
Interpretation / result The table below shows the results of grouping based on proximity between the center point of the consumer data on each attribute. The results of analysis of cluster 1 consisting of 4002 consumers are;
Tabel 7. Results Analysis of Cluster 1
City: a. Palembang = 1557
b. Musi Banyuasin = 1104
c. Banyuasin = 890
d. Ogan Ilir = 133
e. Ogan Komering Ilir =
116
f. Muara Enim = 85
g. Ogan Komering Ulu =
67
h. Lahat = 25
i. Prabumulih = 25
Type of Vehicle: a. Gran Max = 1440
b. Ayla = 1337
c. Xenia = 897
d. Terios = 328
Type of Payment: a. Kredit 4 tahun = 1309
b. Kredit 3 tahun = 893
c. Kredit 5 tahun = 836
d. Cash =764
e. Kredit 2 tahun = 113
f. Kredit 6 tahun = 54
g. Kredit 1 tahun = 33
The results of cluster analysis 2 which consist of 172 consumers are
Tabel 8. Results Analysis of Cluster 2
City: a. Palembang = 127
b. Banyuasin = 10
c. Ogan Ilir = 8
d. Ogan Komering Ulu = 8
e. Musi Banyuasin = 6
f. Ogan Komering Ilir = 4
g. Muara Enim = 3
h. Empat Lawang = 2
i. Kab. Penukal Abab
Lematang Ilir = 2
Type of Vehicle: a. Sirion = 82
b. Luxio = 82
c. Hi Max = 8
Type of Payment: a. Kredit 4 tahun = 57
b. Cash = 36
c. Kredit 3 tahun = 33
d. Kredit 5 tahun = 25
e. Kredit 2 tahun = 12
f. Kredit 6 tahun = 6
g. Kredit 1 tahun = 3

j. Lahat = 1
k. Lubuk Linggau = 1
The results of cluster analysis of three consisting of 51 consumers are
Tabel 9. Results Analysis of Cluster 3
City: a. Jambi = 13
b. Lubuk Linggau = 11
c. Pangkalpinang = 11
d. Musi Rawas = 6
e. Pagaralam = 5
f. Empat Lawang = 4
g. Bangka = 1
Type of Vehicle: a. Xenia = 20
b. Gran Max = 19
c. Ayla = 6
d. Terios = 6
Type of Payment: a. Cash = 26
b. Kredit 4 tahun = 11
c. Kredit 5 tahun = 7
d. Kredit 3 tahun = 6
e. Kredit 2 tahun = 1
5. Summary and Conclusions
a. After grouping sales data by spreading the area by city, type of vehicle and the type of payment using the K-Means clustering are formed three clusters, namely, cluster the first consists of 4002 customers spread into 9 regions, cluster the second consists of 172 customers spread over 11 regions and cluster the third consists of 51 consumers were dispersed into 7 regions.
b. Promotion strategies for new customers are right on target for each region based on clusters formed is by sending a marketing team to perform the alignment using the promotion mix of the types of vehicles most in demand and payment types in each cluster. Grouping against sales data should be done routinely every year to avoid a decline in sales in the next year.
References
Agusta, Yudhi. 2007. ‘K-Means penerapan permasalahan dan metode terkait’. Jurnal Sistem dan Informatika, Vol 3.
Han, Jiawei & Kamber, Michelin. 2006. Data Mining: Concept and Techiques 2nd Edition. San Fransisco: Morgan Kauffman-Elsevier.
Hasitha Indika Arumawadu, R. M. Kapila Tharanga Rathnayaka, S. K. Illangarathne, 2015,
Mining Profitability of Telecommunication Customers Using K-Means Clustering, Journal of Data Analysis and Information Processing, 2015, 3, 63-71 Published Online
August 2015 , in SciRes. http://www.scirp.org/journal/jdaip
Johan Oscar Ong, 2013 , Implementasi Algoritma K-Means Clustering Untuk Menentukan
Strategi Marketing President University, Jurnal Ilmiah Teknik Industri, Vol. 12, No. 1, Juni 2013 ISSN 1412-6869
Kotler P dan Armstrong G, 1997, Dasar-dasar Pemasaran (Principles of Marketing 7e edisi
BI Jilid I) , Prenhallindo, Jakarta Larose, Daniel T, Data Mining Methods and Models. Hoboken New Jersey: Jhon Wiley &
Sons, Inc, 2006.

Unnati R. Raval and Chaita Jani, 2016, Implementing & Improvisation of K-means Clustering Algorithm, International Journal of Computer Science and Mobile Computing, Vol.5 Issue.5, May 2016, pg. 191-203
R. S. Kamath and R. K. Kamat, 2016, K-Means Clustering For Analyzing Productivity In
Light Of R&Dspillover, International Journal of Information Technology, Modeling and Computing (IJITMC) Vol. 4, No.2
Santosa, B. 2007. Data Mining: Teknik Pemanfaatan Data untuk Keperluan Bisnis.
Yogyakarta: Graha Ilmu. Supranto, J. M.A. 2000. Statistik: Teori dan Aplikasi Edisi Keenam. Jakarta: Erlangga.