DATA MINING FOR INTERFERENCE AVOIDANCE IN SMART …
12
FACTA UNIVERSITATIS Series: Automatic Control and Robotics Vol. 17, N o 1, 2018, pp. 13 - 24 https://doi.org/10.22190/FUACR1801013N DATA MINING FOR INTERFERENCE AVOIDANCE IN SMART CITIES IOT NETWORKS UDC ((004.738.5:004.451.53:004.22):004.738.5.057.4) Valentina Nejković, Nenad Milošević, Filip Jelenković, Zorica Nikolić, Milorad Tošić University of Niš, Faculty of Electronic Engineering, Niš, Republic of Serbia Abstract. Rapid growth of wireless communications and heavily occupied spectrum lead to an inevitable interference between the heterogenous systems operating in the same frequency band. Having in mind the development of the Internet of Things (IoT) services and networks and widely present WiFi networks on the one hand, and the fact that these two systems occupy the same 2.4 GHz frequency band on the other hand, it is clear that the control of the interference and the spectrum coordination are of the highest importance. The first step in the interference control is to acquire its properties. Since the simulation of a large IoT network is not entirely possible, due to the numerous factors not known in advance, the interference assessment is performed on the SmartSantander, an IoT testbed, located in Santander, Spain. This paper presents a statistical analysis of the sensor data and describes the interference properties and its influence. These results may be used for the spectrum coordination, together with the neural networks and semantic technologies. Key words: Coordination, Internet of things, semantic technologies, WiFi, ZigBee 1. INTRODUCTION Integration of computers into every aspect of human’s life is an idea that has been known for almost 40 years [1]. However, the blending of computers, as were known before, has progressed into the blending of various smart devices within a network, such as the network of sensors. This evolution in the area especially erupted in the past 20 years [2], influenced by the development of the wireless communication technologies and the Internet, establishing what we now call the Internet of Things (IoT) [3], [4]. The IoT is realized with a lot of small low-cost devices with computing capabilities, which have various actuators or sensors. Received January 24, 2018 Corresponding author: Nenad Milošević University of Niš, Faculty of Electronic Engineering, Aleksandra Medvedeva 14, 18000 Niš, Republic of Serbia E-mail: [email protected]
Transcript of DATA MINING FOR INTERFERENCE AVOIDANCE IN SMART …
FACTA UNIVERSITATIS
Series: Automatic Control and Robotics Vol. 17, No 1, 2018, pp. 13 - 24
https://doi.org/10.22190/FUACR1801013N
DATA MINING FOR INTERFERENCE AVOIDANCE
IN SMART CITIES IOT NETWORKS
UDC ((004.738.5:004.451.53:004.22):004.738.5.057.4)
Valentina Nejković, Nenad Milošević, Filip Jelenković,
Zorica Nikolić, Milorad Tošić
University of Niš, Faculty of Electronic Engineering, Niš, Republic of Serbia
Abstract. Rapid growth of wireless communications and heavily occupied spectrum
lead to an inevitable interference between the heterogenous systems operating in the
same frequency band. Having in mind the development of the Internet of Things (IoT)
services and networks and widely present WiFi networks on the one hand, and the fact
that these two systems occupy the same 2.4 GHz frequency band on the other hand, it is
clear that the control of the interference and the spectrum coordination are of the
highest importance. The first step in the interference control is to acquire its
properties. Since the simulation of a large IoT network is not entirely possible, due to
the numerous factors not known in advance, the interference assessment is performed
on the SmartSantander, an IoT testbed, located in Santander, Spain. This paper
presents a statistical analysis of the sensor data and describes the interference
properties and its influence. These results may be used for the spectrum coordination,
together with the neural networks and semantic technologies.
Key words: Coordination, Internet of things, semantic technologies, WiFi, ZigBee
1. INTRODUCTION
Integration of computers into every aspect of human’s life is an idea that has been
known for almost 40 years [1]. However, the blending of computers, as were known
before, has progressed into the blending of various smart devices within a network, such
as the network of sensors. This evolution in the area especially erupted in the past 20
years [2], influenced by the development of the wireless communication technologies and
the Internet, establishing what we now call the Internet of Things (IoT) [3], [4]. The IoT
is realized with a lot of small low-cost devices with computing capabilities, which have
various actuators or sensors.
Received January 24, 2018
Corresponding author: Nenad Milošević
University of Niš, Faculty of Electronic Engineering, Aleksandra Medvedeva 14, 18000 Niš, Republic of Serbia
E-mail: [email protected]
14 V. NEJKOVIĆ, N. MILOŠEVIĆ, F. JELENKOVIĆ, Z. NIKOLIĆ, M. TOŠIĆ
The communication subsystem makes an important part of any IoT system [5]. There
are a lot of different communication environments and application areas. Therefore, a
plethora of communication technologies exist. Some of these technologies are developed
for the specific IoT applications, such as ZigBee [6], [7] and Bluetooth low energy [8],
[9]. These communication schemes are widely used, but there is a problem: they operate
in 2.4 GHz frequency band, which is heavily used by IEEE 802.11 WiFi devices.
Apparently, the problem of interference between WiFi and ZigBee is very significant,
especially in the uncontrolled environments with a large number of devices. A good example
of such an environment is increasingly popular smart cities. A smart city is an urban area that
uses different types of electronic data collection sensors to supply information used to
manage assets and resources efficiently. This includes data collected from citizens, devices,
and assets that are processed and analyzed to monitor and manage traffic and transportation
systems, power plants, water supply networks, waste management, law enforcement,
information systems, schools, libraries, hospitals, and other community services. The smart
city concept integrates information and communication technology (ICT), and various
physical devices connected to the network (the Internet of things or IoT) to optimize the
efficiency of city operations and services and connect to citizens. The interference analysis
in smart cities may be done in three different ways. The first and the most affordable
approach is to simulate the entire environment. However, the smart city environment is very
complex and cannot be accurately described in a simulation. The other approach is to use
live commercial installation, but the experimentation in this environment would interfere
with normal operation of the system. Finally, the third methodology is to use some of the
massive online testbeds or online laboratories. In this paper, the presented analysis is based
on real smart city data collected on the FIESTA-IoT platform [10], particularly on the IoT
network in SmartSantander testbed [11]. The paper will analyze data from the ZigBee
sensors, indicate problems and suggest a possible way to solve these problems.
The rest of the paper is organized as follows. Section 2 discusses the problem of
ZigBee and WiFi coexistence. The SmartSantander testbed is described in Section 3, and
the statistical analysis of the sensor readings sequences are given in Section 4. The
concluding remarks and future work are given in Section 5.
2. ZIGBEE WIFI COEXISTENCE
ZigBee is a standard for the wireless networks that uses low-power and may be
implemented on inexpensive hardware. It is intended for the application in wireless sensor
networks (WSN), and WSNs are the first industrial IoT application. ZigBee was proposed
20 years ago with several revisions after that. ZigBee is based on the IEEE 802.15.4
standard and operates in the 2.4 GHz frequency band. At physical level ZigBee satisfies
the low-power needs of IoT networks. On the other hand, MAC level was unreliable and
with high energy consumption [12], [13]. Some improvements in the MAC level are part
of the IEEE 802.15.4-2012 revision.
WiFi is based on the IEEE 802.11 standard and its subversions. In contrast to ZigBee,
WiFi was not designed to be used in IoT applications. The main purpose of WiFi is to
provide high bandwidth to the devices that are in close proximity to each other. Also,
WiFi does not support a high number of devices connected to one access point. WiFi is

Data Mining for Interference Avoidance in Smart Cities IoT Networks 15
not used in IoT primarily because of its high energy consumption, 10 – 100 times higher
than ZigBee or Bluetooth. Recently, it has been enhanced regarding the energy
consumption, but it is still not widely used for IoT applications.
Even though WiFi is not interesting as a communication subsystem for IoT applications, it is
very significant for IoT since it causes interference to ZigBee devices. Namely, WiFi is
designed to operate in both 2.4 and 5 GHz frequency bands, with the 2.4 GHz band being
heavily used today. Since ZigBee also uses the 2.4 GHz band, mutual interference is
inevitable. To understand the potential for problems, a review of the RF spectrums and
available channels for WiFi (802.11b/g) and ZigBee (802.15.4) is shown in Fig. 1 [14].
22 MHz
Ch. 12412 MHz
Ch. 62437 MHz
Ch. 112462 MHz
Ch. 142484 MHz
802.11
3 MHz
Ch. 112405 MHz
802.15.4
Ch. 162430 MHz
Ch. 262480 MHz
Ch. 212455 MHz
5 MHz
Fig. 1 Comparison of IEEE802.15.4 and IEEE802.11 spectrum occupancy
It is well known that ZigBee communication links experience a large packet loss in
case of WiFi interference. The main reason for this packet loss is the fact that WiFi has
much higher transmission power [15]–[17]. The interference may be reduced or
completely avoided in space, time or frequency domain. Space domain interference
suppression is not very appropriate for ZigBee devices because of a large number of
devices in a large area. However, time domain interference avoidance may be used.
Although WiFi has carrier-sense multiple access with collision avoidance (CSMA/CA)
technology for the avoidance of other active users by sensing the presence of the carrier,
WiFi is not able to detect ZigBee [15] because of the ZigBee’s low transmit power. Paper
[18] proposed the use a separate transmitter, much stronger than ZigBee, that is used to
stop WiFi transmission. The drawback of this approach is the lower frequency usage
efficiency. Since there are gaps in WiFi transmission, ZigBee may use these gaps for its
own transmission [16]. Due to ZigBee devices synchronization problems, the time domain
interference avoidance may be used only for the networks of the small number of ZigBee
devices. The interference avoidance in the frequency domain is also attractive. The most
of the research is focused on ZigBee devices and its channel adjustment [19]–[23], but
recently [24] proposed that both ZigBee and WiFi change operating frequency.

16 V. NEJKOVIĆ, N. MILOŠEVIĆ, F. JELENKOVIĆ, Z. NIKOLIĆ, M. TOŠIĆ
3. SMARTSANTANDER
The SmartSantander testbed [11] is located in Santander, Spain. It is an experimental
testbed, or open online laboratory, for the research and experimentation in the area of
large-scale architectures, in the context of a smart city IoT environment.
Fig. 2 SmartSantander architecture
The SmartSantander testbed consists of around 3,000 IoT devices that use IEEE
802.15.4 communication protocol. Besides there are more than 2,000 joint Radio
Frequency Identification (RFID) tags/Quick Response (QR) code labels and more than
2,000 points of interest at massive gathering places, such as shopping centers, restaurants,
cultural events, etc. The architecture of SmartSantander, shown in detail in Fig. 2, consists
of three layers. The first layer is comprised of the IoT nodes. Each of them has a sensor
for some parameter, such as temperature, carbon-monoxide, moisture, light, car presence,
Data Mining for Interference Avoidance in Smart Cities IoT Networks 17
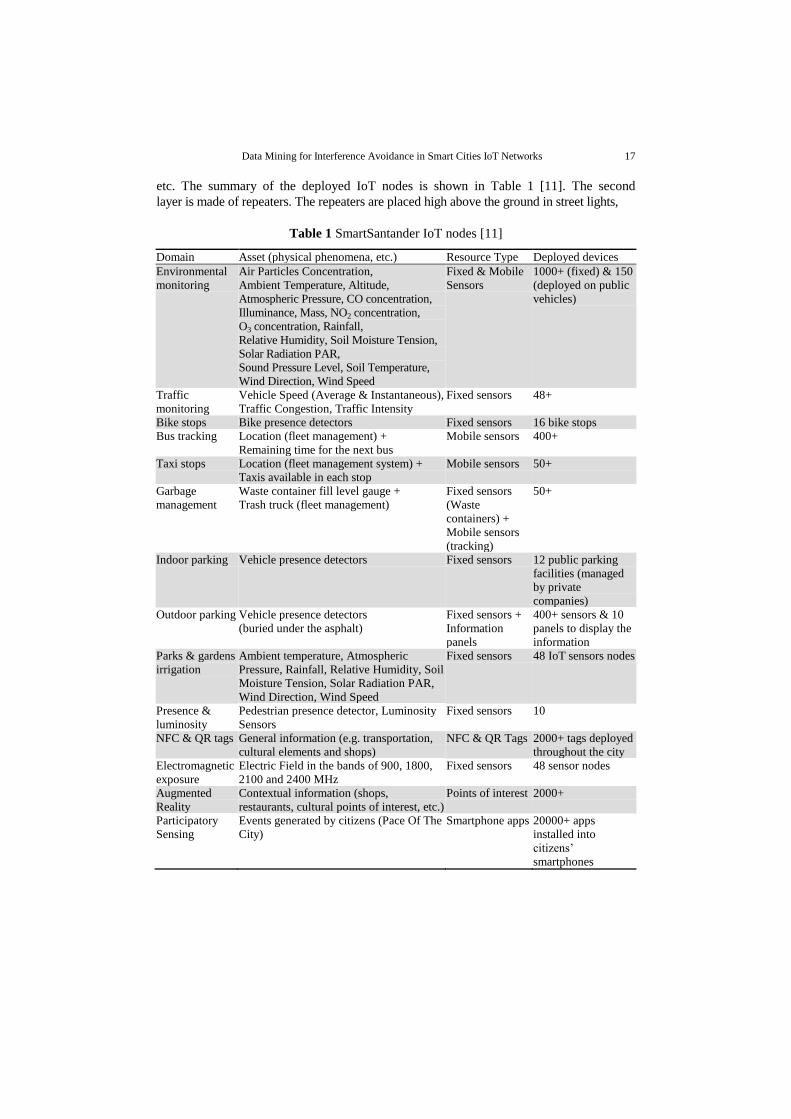
etc. The summary of the deployed IoT nodes is shown in Table 1 [11]. The second
layer is made of repeaters. The repeaters are placed high above the ground in street lights,
Table 1 SmartSantander IoT nodes [11]
Domain Asset (physical phenomena, etc.) Resource Type Deployed devices
Environmental
monitoring
Air Particles Concentration,
Ambient Temperature, Altitude,
Atmospheric Pressure, CO concentration,
Illuminance, Mass, NO2 concentration,
O3 concentration, Rainfall,
Relative Humidity, Soil Moisture Tension,
Solar Radiation PAR,
Sound Pressure Level, Soil Temperature,
Wind Direction, Wind Speed
Fixed & Mobile
Sensors
1000+ (fixed) & 150
(deployed on public
vehicles)
Traffic
monitoring
Vehicle Speed (Average & Instantaneous),
Traffic Congestion, Traffic Intensity
Fixed sensors 48+
Bike stops Bike presence detectors Fixed sensors 16 bike stops
Bus tracking Location (fleet management) +
Remaining time for the next bus
Mobile sensors 400+
Taxi stops Location (fleet management system) +
Taxis available in each stop
Mobile sensors 50+
Garbage
management
Waste container fill level gauge +
Trash truck (fleet management)
Fixed sensors
(Waste
containers) +
Mobile sensors
(tracking)
50+
Indoor parking Vehicle presence detectors Fixed sensors 12 public parking
facilities (managed
by private
companies)
Outdoor parking Vehicle presence detectors
(buried under the asphalt)
Fixed sensors +
Information
panels
400+ sensors & 10
panels to display the
information
Parks & gardens
irrigation
Ambient temperature, Atmospheric
Pressure, Rainfall, Relative Humidity, Soil
Moisture Tension, Solar Radiation PAR,
Wind Direction, Wind Speed
Fixed sensors 48 IoT sensors nodes
Presence &
luminosity
Pedestrian presence detector, Luminosity
Sensors
Fixed sensors 10
NFC & QR tags General information (e.g. transportation,
cultural elements and shops)
NFC & QR Tags 2000+ tags deployed
throughout the city
Electromagnetic
exposure
Electric Field in the bands of 900, 1800,
2100 and 2400 MHz
Fixed sensors 48 sensor nodes
Augmented
Reality
Contextual information (shops,
restaurants, cultural points of interest, etc.)
Points of interest 2000+
Participatory
Sensing
Events generated by citizens (Pace Of The
City)
Smartphone apps 20000+ apps
installed into
citizens’
smartphones

18 V. NEJKOVIĆ, N. MILOŠEVIĆ, F. JELENKOVIĆ, Z. NIKOLIĆ, M. TOŠIĆ
semaphores, information panels, etc., in order to behave as forwarding nodes. In order to
avoid forwarding and battery powering of IoT nodes, the repeaters are also equipped with
sensors, where possible. The communication between repeaters and the standalone IoT
nodes uses 802.15.4 protocol. Around 200 gateways make the third layer. Both repeaters
and the IoT nodes send all the information to the gateway using 802.15.4. Gateways use
mobile cellular network or WiFi or Ethernet to transfer the received data from sensors to
the testbed core.
4. DATA ANALYSIS OF SENSOR READING SEQUENCES
In this section we present a statistical analysis of the IoT sensors received measurement
data, based on the cross-correlation of the data. The Pearson correlation coefficient [25] is
used as the correlation measure:
2 2
1 1 1
2 2
1 1 1 1
n n n
i i i i
i i i
n n n n
i i i i
i i i i
n x y x y
r
n x x n y y
(1)
where xi and yi are i-th members of the respective datasets X and Y, whose correlation
coefficient is needed, and n is the number of samples in each dataset.
As an example of the sensors output, Fig. 3 shows temperature measurements of one
sensor over time of 37 days. It can be seen that there are some periods of time with
missing measurement data. In the following text we will show that the absence of the
measurements is a consequence of the ZigBee packet loss due to the interference at the
2.4 GHz frequency band. Since the testbed has deployed sensors for the electrical field
(EF) measurements at 2.4 GHz, these sensors might be used for the interfering signals
detection. Namely, the WiFi signal has much higher power level than the ZigBee signal.
Therefore, a high correlation of the 2.4 GHz EF measurements with the presence/absence
of some other sensor measurements would prove that 1) WiFi interference is the cause of
the missing data, 2) EF sensor might be used for the interference detection/prediction.
There is a total of 15 EF sensors in the testbed. Thus, we divided the whole network into
15 groups of sensors, and each group consists of the EF sensor and other sensors with up
to 50 meters away from the EF sensor. According to (1), Fig. 4 shows the Pearsons
correlation coefficient between EF levels and the presence/absence of the measurements
from other sensors in the group. Presence/absence of the data is mapped into a dataset X,
whose members are zeros and ones, where one means that the data is present, and zero
shows that the data is missing. EF data is mapped into the dataset Y.

Data Mining for Interference Avoidance in Smart Cities IoT Networks 19
0 2000 4000 6000 8000 10000
0
5
10
15
20
25
Te
mp
era
ture
[°C
]
Measurement No.
Fig. 3 Temperature sensor measurements over time
0 1 2 3 4 5 6 7 8 9 10 11 12 13 14 15
-1.0
-0.8
-0.6
-0.4
-0.2
0.0
0.2
0.4
0.6
0.8
1.0
2400 MHz
Pears
on c
orr
ela
tion c
oeffic
ient
Sensor group
Fig. 4 Pearson correlation coefficient between EF and other sensors presence/absence of data

20 V. NEJKOVIĆ, N. MILOŠEVIĆ, F. JELENKOVIĆ, Z. NIKOLIĆ, M. TOŠIĆ
Fig. 4 indicates that there is no correlation between the EF level and the other
measurement data. The reason for this behavior is that EF sensors are also interfered by
WiFi, and therefore they cannot measure high EF field levels. In order to prove that the
EF sensor is interfered, we will analyze the correlation between presence/absence of the
measurements for different EF sensors at one location. Namely, besides the 2400 MHz EF
sensor, there are 900, 1800 and 2100 MHz sensors at the same location. It is expected that
the interference has similar influence on all these sensors. Therefore, Fig. 5 shows the
mutual EF sensors correlation for each of the 15 EF sensors groups. It can be seen that the
correlation is very high for each EF sensors group. This confirms the assumption that the
absence of the measurements data is a consequence of the interference. In order to further
confirm this assumption, Fig. 6 shows the correlation between 2400 MHz EF sensor
presence/absence of data with the presence/absence of the data from other sensors in the
same group. The results show that, due to the high correlation, the most of the sensors are
interfered at the same time. However, there are some sensors with low Pearson correlation
coefficient. These sensors are either separated from the interference by an obstacle, or
they operate at a different ZigBee channel that is not hit by the interference. It should be
noted that the interference influences not the sensors themselves (for example, by
saturating the levels, or some other mechanism), but instead the communication of the
measured levels to the repeater or gateway.
0 2 4 6 8 10 12 14
-1.0
-0.8
-0.6
-0.4
-0.2
0.0
0.2
0.4
0.6
0.8
1.0
Pe
ars
on c
orr
ela
tion
coe
ffic
ien
t
Sensor group
Fig. 5 Mutual EF sensors correlation

Data Mining for Interference Avoidance in Smart Cities IoT Networks 21
0 1 2 3 4 5 6 7 8 9 10 11 12 13 14 15
-1.0
-0.8
-0.6
-0.4
-0.2
0.0
0.2
0.4
0.6
0.8
1.0
Pears
on c
orr
ela
tion c
oeffic
ient
Sensor group
Fig. 6 Correlation between 2400 MHz EF sensor and other sensors
in the group presence/absence of the measurement data
0 200 400 600 800 1000 1200
-0.2
0.0
0.2
0.4
0.6
0.8
1.0
Pe
ars
on c
orr
ela
tion
coe
ffic
ien
t
Distance [m]
Fig. 7 Pearson correlation coefficient as function of distance between sensors

22 V. NEJKOVIĆ, N. MILOŠEVIĆ, F. JELENKOVIĆ, Z. NIKOLIĆ, M. TOŠIĆ
Finally, Fig. 7 shows the Pearson correlation coefficient between all pairs of sensors in
the network, regardless of their type, as a function of the distance between sensors. The
correlation is averaged over the distance of 10 m. It is visible that the correlation
decreases over distance, meaning that the sensors close to each other are hit by the same
interference, while distant sensors are not.
The presented analysis strongly supports the hypothesis that the absence of the
measurement data from the sensors is a consequence of the interference, most likely the
WiFi interference. In order to avoid the interference and, consequently, avoid the loss of
data, a proactive spectrum coordination [26] might be used. The goal of the proactive
spectrum coordination is to prevent the interference between the heterogenous wireless
systems by changing the operating channel of a sensor before the interference appears.
The coordination process consists of two steps. In the first step, a neural network may be
used to analyses measurement data and predict the moment of the interference between
WiFi and ZigBee, based on the presence or absence of the data. On the basis of the
predicted interference patterns, the semantic technologies will be used for the reasoning
about the needed steps for the coordination.
5. CONCLUSION
The problem of coexistence between WiFi and ZigBee networks within the IoT
applications is discussed in this paper. WiFi devices operate at the same 2.4 GHz
frequency band as ZigBee, with much higher power, which may lead to the loss of data in
the ZigBee network. The analysis is performed on SmartSantander, a massive IoT online
testbed, located in Santander, Spain. By analyzing the sensor data, one can notice that
there are some missing measurements. It was shown that the data are missing because of
the interference. By using neural networks, the time instants of the missing data may be
predicted, and the operating frequency of the considered IoT node may be changed in
advance, for the sake of the interference avoidance, which will be the subject of the future
research.
Acknowledgement: The research leading to these results are performed within the project
“SemantiC Coordination for intelligENT sensors (2CENTs)”. This project has received funding
from the European Union’s Horizon 2020 research and innovation programme under grant
agreement No 643943. The research was performed on SmartSantander testbed.
Data Mining for Interference Avoidance in Smart Cities IoT Networks 23
REFERENCES
[1] M. Weiser, “The Computer for the 21st Century,” SIGMOBILE Mob. Comput. Commun. Rev., vol. 3,
no. 3, pp. 3–11, 1999, DOI: 10.1145/329124.329126.
[2] J. Pontin, “Bill Joy’s Six Webs,” MITTechnology Rev., vol. 29, 2005.
[3] M. R. Palattella et al., “Internet of Things in the 5G Era: Enablers, Architecture, and Business Models,”
IEEE J. Sel. Areas Commun., vol. 34, no. 3, pp. 510–527, 2016, DOI: 10.1109/JSAC.2016.2525418.
[4] J. Gubbi, R. Buyya, S. Marusic, and M. Palaniswami, “Internet of Things (IoT): A vision, architectural
elements, and future directions,” Futur. Gener. Comput. Syst., vol. 29, no. 7, pp. 1645–1660, 2013, DOI:
https://doi.org/10.1016/j.future.2013.01.010.
[5] A. Al-Fuqaha, M. Guizani, M. Mohammadi, M. Aledhari, and M. Ayyash, “Internet of Things: A Survey
on Enabling Technologies, Protocols, and Applications,” IEEE Commun. Surv. Tutorials, vol. 17, no. 4,
pp. 2347–2376, 2015, DOI: 10.1109/COMST.2015.2444095.
[6] T. Kumar and P. B. Mane, “ZigBee topology: A survey,” in 2016 International Conference on Control,
Instrumentation, Communication and Computational Technologies (ICCICCT), 2016, pp. 164–166.
[7] N. V. R. Kumar, C. Bhuvana, and S. Anushya, “Comparison of ZigBee and Bluetooth wireless
technologies-survey,” in 2017 International Conference on Information Communication and Embedded
Systems (ICICES), 2017, pp. 1–4.
[8] J. r. Lin, T. Talty, and O. K. Tonguz, “On the potential of bluetooth low energy technology for vehicular
applications,” IEEE Commun. Mag., vol. 53, no. 1, pp. 267–275, 2015, DOI: 10.1109/MCOM.2015.7010544.
[9] C. Gomez, J. Oller, and J. Paradells, “Overview and evaluation of bluetooth low energy: An emerging
low-power wireless technology,” Sensors, vol. 12, no. 9, pp. 11734–11753, 2012.
[10] “Federated Interoperable Semantic IoT Testbeds and Applications (FIESTA-IoT).” [Online]. Available:
http://fiesta-iot.eu/.
[11] L. Sanchez et al., “SmartSantander: IoT Experimentation over a Smart City Testbed,” Comput. Netw.,
vol. 61, pp. 217–238, 2014, DOI: 10.1016/j.bjp.2013.12.020.
[12] G. Anastasi, M. Conti, and M. Di Francesco, “A Comprehensive Analysis of the MAC Unreliability
Problem in IEEE 802.15.4 Wireless Sensor Networks,” IEEE Trans. Ind. Informatics, vol. 7, no. 1, pp.
52–65, Feb. 2011, DOI: 10.1109/TII.2010.2085440.
[13] P. Huang, L. Xiao, S. Soltani, M. W. Mutka, and N. Xi, “The Evolution of MAC Protocols in Wireless
Sensor Networks: A Survey,” IEEE Commun. Surv. Tutorials, vol. 15, no. 1, pp. 101–120, 2013, DOI:
10.1109/SURV.2012.040412.00105.
[14] Crossbow Inc., “Avoiding RF Interference Between WiFi and Zigbee.” [Online]. Available:
https://www.mobiusconsulting.com/papers/ZigBeeandWiFiInterference.pdf.
[15] S. Pollin, I. Tan, B. Hodge, C. Chun, and A. Bahai, “Harmful Coexistence Between 802.15.4 and
802.11: A Measurement-based Study,” in 2008 3rd International Conference on Cognitive Radio
Oriented Wireless Networks and Communications (CrownCom 2008), 2008, pp. 1–6.
[16] J. Huang, G. Xing, G. Zhou, and R. Zhou, “Beyond co-existence: Exploiting WiFi white space for
Zigbee performance assurance,” in The 18th IEEE International Conference on Network Protocols,
2010, pp. 305–314.
[17] C.-J. M. Liang, N. B. Priyantha, J. Liu, and A. Terzis, “Surviving Wi-fi Interference in Low Power
ZigBee Networks,” in Proceedings of the 8th ACM Conference on Embedded Networked Sensor
Systems, 2010, pp. 309–322.
[18] X. Zhang and K. G. Shin, “Cooperative Carrier Signaling: Harmonizing Coexisting WPAN and WLAN
Devices,” IEEE/ACM Trans. Netw., vol. 21, no. 2, pp. 426–439, Apr. 2013, DOI: 10.1109/TNET.
2012.2200499.
[19] M. S. Kang, J. W. Chong, H. Hyun, S. M. Kim, B. H. Jung, and D. K. Sung, “Adaptive Interference-
Aware Multi-Channel Clustering Algorithm in a ZigBee Network in the Presence of WLAN
Interference,” in 2007 2nd International Symposium on Wireless Pervasive Computing, 2007.
[20] S. Pollin et al., “Distributed cognitive coexistence of 802.15.4 with 802.11,” in 2006 1st International
Conference on Cognitive Radio Oriented Wireless Networks and Communications, 2006, pp. 1–5.
[21] R. Musaloiu-E. and A. Terzis, “Minimising the Effect of WiFi Interference in 802.15.4 Wireless Sensor
Networks,” Int. J. Sen. Netw., vol. 3, no. 1, pp. 43–54, 2008, DOI: 10.1504/IJSNET.2008.016461.
[22] L. Tytgat, O. Yaron, S. Pollin, I. Moerman, and P. Demeester, “Analysis and Experimental Verification
of Frequency-Based Interference Avoidance Mechanisms in IEEE 802.15.4,” IEEE/ACM Trans. Netw.,
vol. 23, no. 2, pp. 369–382, Apr. 2015, DOI: 10.1109/TNET.2014.2300114.

24 V. NEJKOVIĆ, N. MILOŠEVIĆ, F. JELENKOVIĆ, Z. NIKOLIĆ, M. TOŠIĆ
[23] J. W. Chong, C. H. Cho, H. Y. Hwang, and D. K. Sung, “An Adaptive WLAN Interference Mitigation
Scheme for ZigBee Sensor Networks,” Int. J. Distrib. Sen. Netw., vol. 2015, p. 159:159--159:159, 2015,
DOI: 10.1155/2015/851289.
[24] S. Nishikori, K. Kinoshita, Y. Tanigawa, H. Tode, and T. Watanabe, “A cooperative channel control
method of ZigBee and WiFi for IoT services,” in 2017 14th IEEE Annual Consumer Communications
Networking Conference (CCNC), 2017, pp. 1–6.
[25] A. K. Sharma, Text Book Of Correlations And Regression. New Delhi: Discovery Publishing House, 2005.
[26] D. Raychaudhuri, X. Jing, I. Seskar, K. Le, and J. B. Evans, “Cognitive radio technology: From
distributed spectrum coordination to adaptive network collaboration,” Pervasive and Mobile Computing,
vol. 4, no. 3. pp. 278–302, 2008.