Data Extraction and Analysis for LC-MS Based...
193
Data Extraction and Analysis for LC-MS Based Proteomics Instructors Gordon Anderson, Charles Ansong, Matthew Monroe, and Ashoka Polpitiya Pacific Northwest National Laboratory, Richland, WA 99354
Transcript of Data Extraction and Analysis for LC-MS Based...

Data Extraction and Analysis for LC-MS Based Proteomics
InstructorsGordon Anderson, Charles Ansong, Matthew
Monroe, and Ashoka Polpitiya
Pacific Northwest National Laboratory, Richland, WA 99354

Course OutlinePart I: Introduction and Overview of Label-Free Quantitative Proteomics (Anderson)
GoalsData and Tools AvailabilityQuantitative Proteomics: Historical Perspective
Part II: Feature Discovery in LC-MS Datasets (Monroe and Polpitiya)BreakPart III: Biological Application of the AMT tag Approach (Ansong)AMT tag Analysis Software DemoPanel Discussion
QuestionsFuture Directions
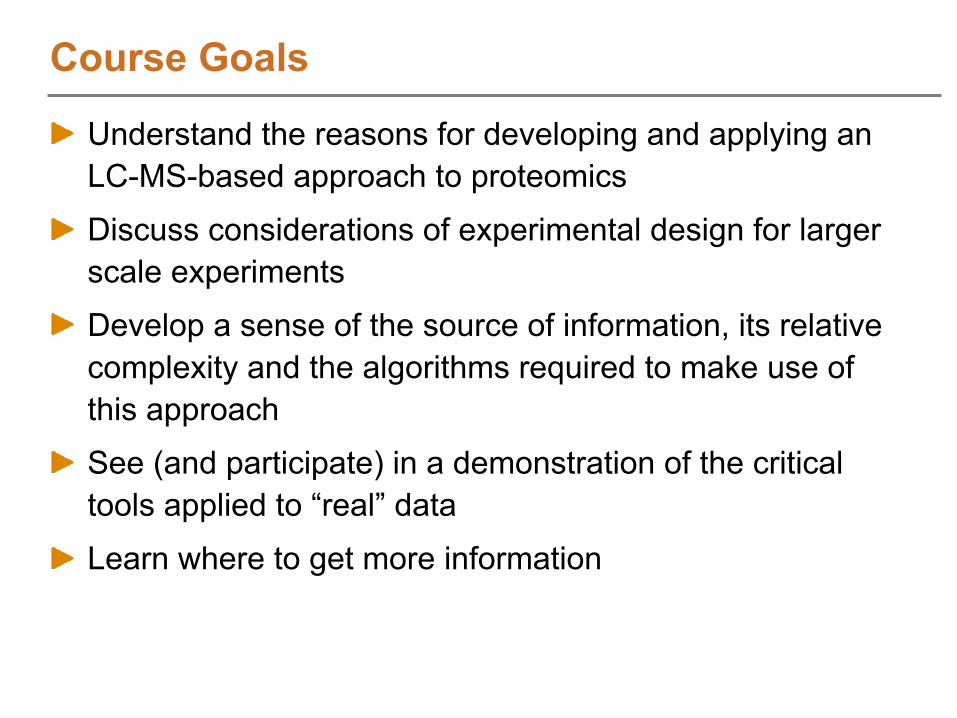
Course Goals
Understand the reasons for developing and applying an LC-MS-based approach to proteomics
Discuss considerations of experimental design for larger scale experiments
Develop a sense of the source of information, its relative complexity and the algorithms required to make use of this approach
See (and participate) in a demonstration of the critical tools applied to “real”
data
Learn where to get more information
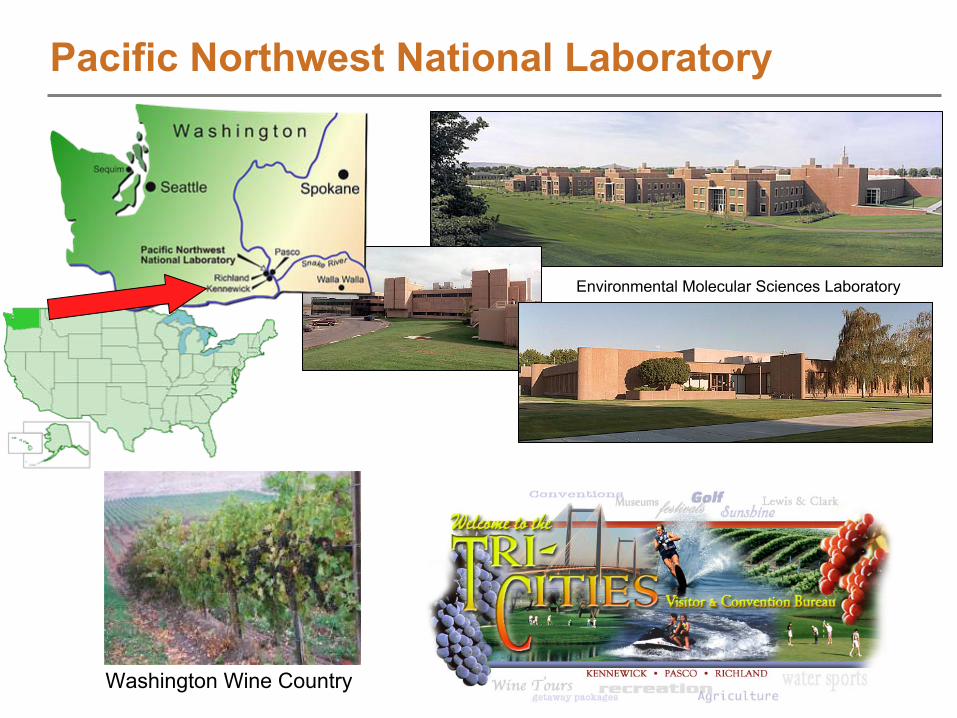
Pacific Northwest National Laboratory
Washington Wine Country
Environmental Molecular Sciences Laboratory

W.R. Wiley Environmental
Molecular SciencesLaboratory
The Guest House at PNNL for EMSL Users
PNNL
performs basic and applied research to deliver energy, environmental, and national security solutions for our nation.
EMSL MissionThe W.R. Wiley Environmental Molecular Sciences Laboratory (EMSL),
a national scientific user facility
at Pacific Northwest National Laboratory, provides integrated experimental and computational resources for discovery and technological innovation in the environmental molecular sciences to support the needs of DOE and the nation.
To find out more and request access to the resource: www.emsl.pnl.gov
Pacific Northwest National Laboratory and EMSL
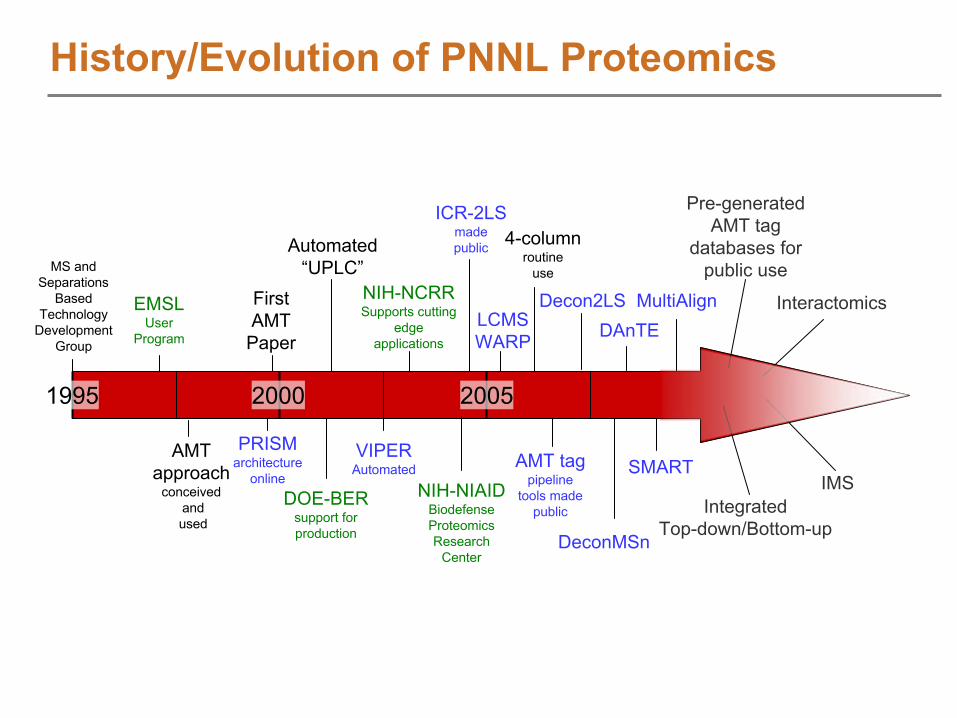
History/Evolution of PNNL Proteomics
1995 2000 2005
EMSLUser
Program
FirstAMT
Paper
PRISMarchitecture
online
Automated “UPLC”
DOE-BERsupport for production
NIH-NCRRSupports cutting
edgeapplications
NIH-NIAIDBiodefenseProteomicsResearch
Center
ICR-2LSmadepublic
AMT tagpipeline
tools madepublic
LCMSWARP
VIPERAutomated SMART
IntegratedTop-down/Bottom-up
IMS
Interactomics
Pre-generatedAMT tag
databases forpublic use
4-columnroutine
use
DAnTE
MS andSeparations
BasedTechnology
DevelopmentGroup
AMTapproach
conceivedandused
MultiAlignDecon2LS
DeconMSn
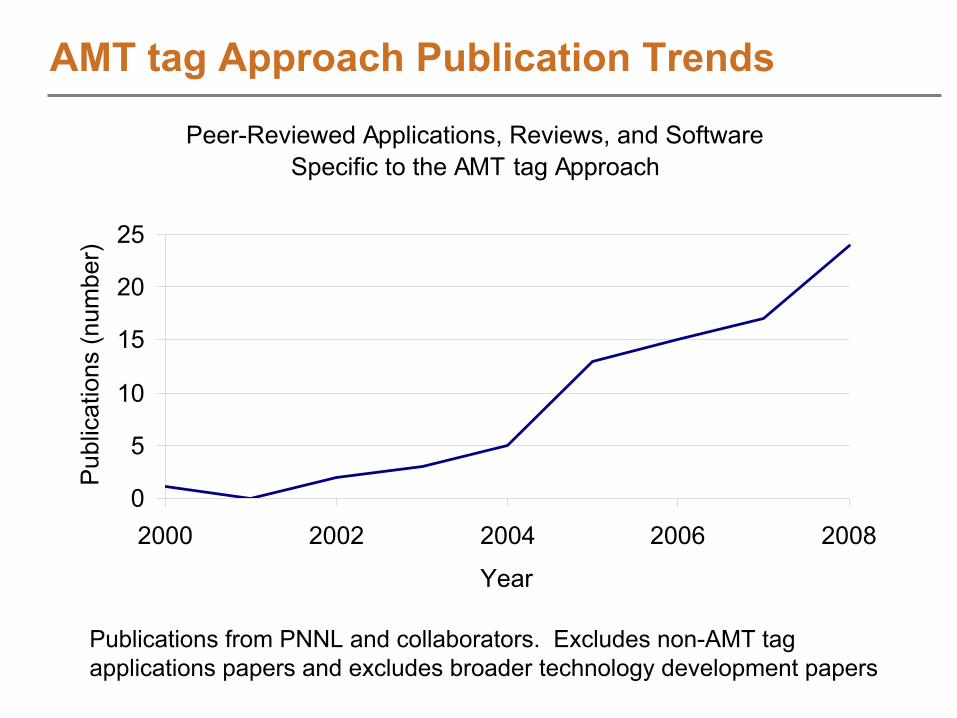
AMT tag Approach Publication Trends
Peer-Reviewed Applications, Reviews, and SoftwareSpecific to the AMT tag Approach
0
5
10
15
20
25
2000 2002 2004 2006 2008
Year
Pub
licat
ions
(num
ber)
Publications from PNNL and collaborators. Excludes non-AMT tag applications papers and excludes broader technology development papers
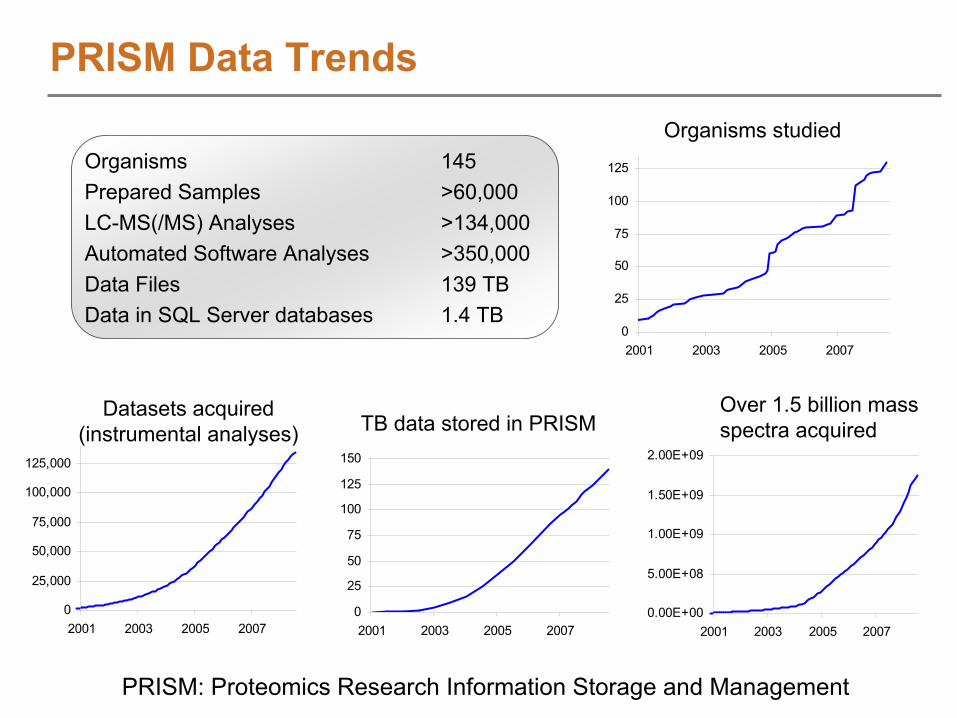
PRISM Data Trends
Organisms 145Prepared Samples >60,000LC-MS(/MS) Analyses >134,000Automated Software Analyses >350,000Data Files 139 TBData in SQL Server databases 1.4 TB
Organisms studied
TB data stored in PRISMOver 1.5 billion mass spectra acquired
Datasets acquired (instrumental analyses)
0
25
50
75
100
125
2001 2003 2005 2007
0
25,000
50,000
75,000
100,000
125,000
2001 2003 2005 20070
25
50
75
100
125
150
2001 2003 2005 20070.00E+00
5.00E+08
1.00E+09
1.50E+09
2.00E+09
2001 2003 2005 2007
PRISM: Proteomics Research Information Storage and Management

Proteomics Informatics Architecture modular and loosely coupled for flexibility
MTSDMS
Data Capture
Integrated & Automated LC-
MS(/MS) Control
Data
Archive
Manager
VIPERMultiAlign
Peak matching
Manager
Decon2LS
De-isotoping
Manager
SEQUEST
X!TandemInsPecT
Peptide ID
Manager
MASIC
SICs
Manager
NET ConversionElution time alignment
STARSuite Extractor
Q Rollup Export
Export tools
MTS Explorer
Web interface
PRISM: G.R. Kiebel et. al. Proteomics
2006, 6, 1783-1790.
DAnTE

Throughput, sensitivity, and sampling efficiencyCompared to LC-MS/MS based approaches
Shortcomings with chemical/labeling methodsMultiple species need to be sampled for each “peptide”Potentially more sample preparation steps or increased costMultiple analyses still required for statistical assessment
New challenges for experimental designStatistical blocking
and sample order randomization
Helps to minimize the effects of systematic bias
Motivations for Label-free LC-MS Proteomics
SEQUEST, X!Tandem, or
InsPecTwith filtering
Upstreamseparations
Complex mixture of proteins
TandemMS spectra
ParentMS spectra
CIDLC-MS/MS
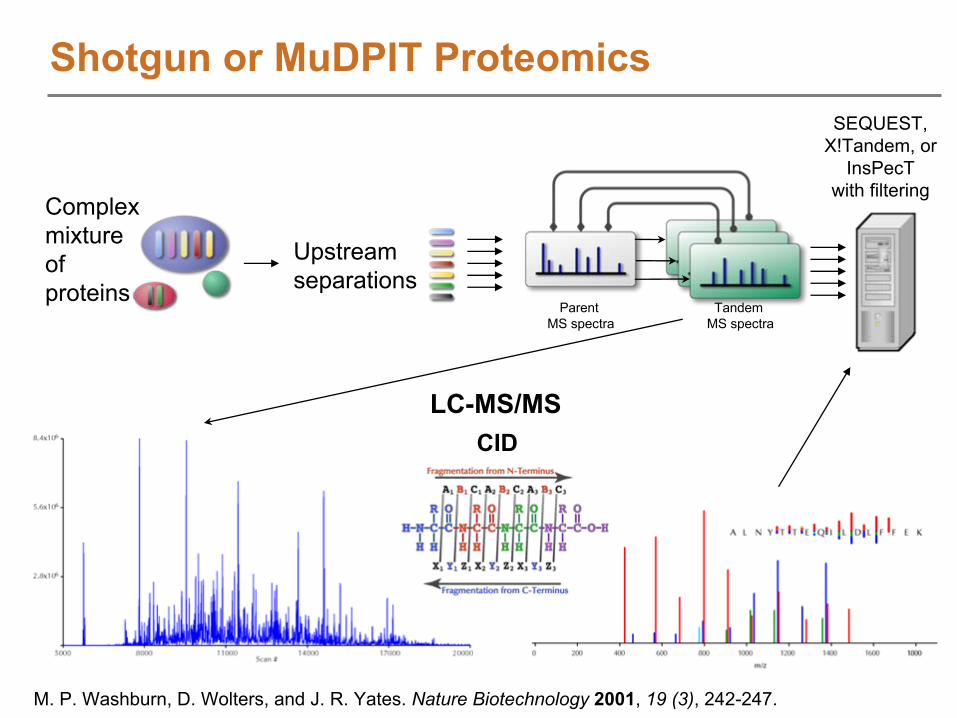
Shotgun or MuDPIT Proteomics
M. P. Washburn, D. Wolters, and J. R. Yates. Nature Biotechnology
2001, 19 (3), 242-247.
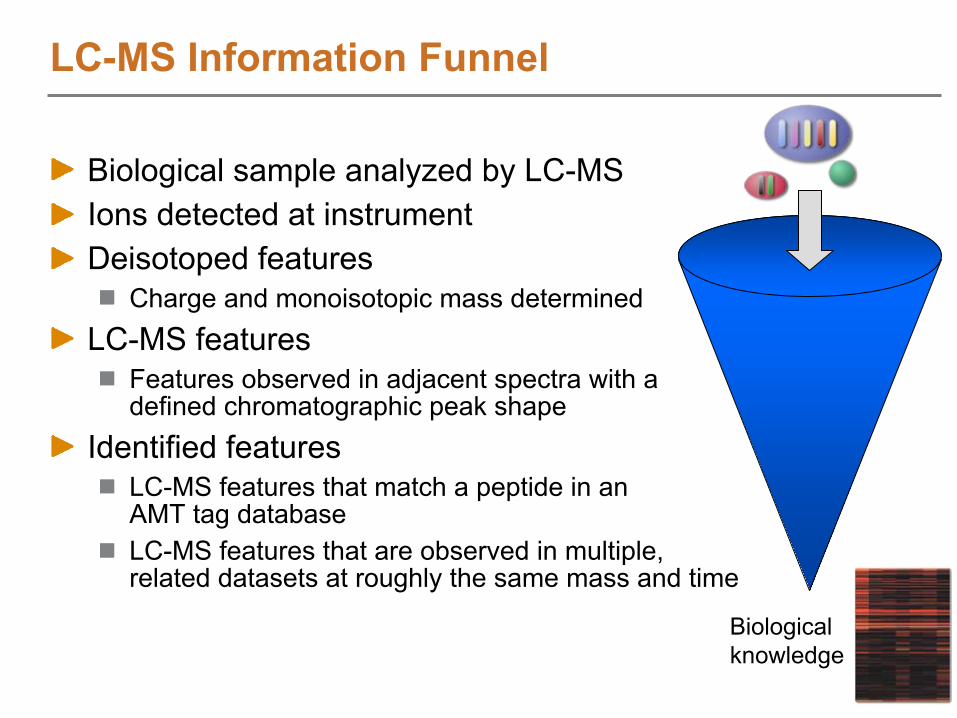
LC-MS Information Funnel
Biological sample analyzed by LC-MSIons detected at instrumentDeisotoped features
Charge and monoisotopic mass determinedLC-MS features
Features observed in adjacent spectra with a defined chromatographic peak shape
Identified featuresLC-MS features that match a peptide in an AMT tag databaseLC-MS features that are observed in multiple, related datasets at roughly the same mass and time
Biological knowledge
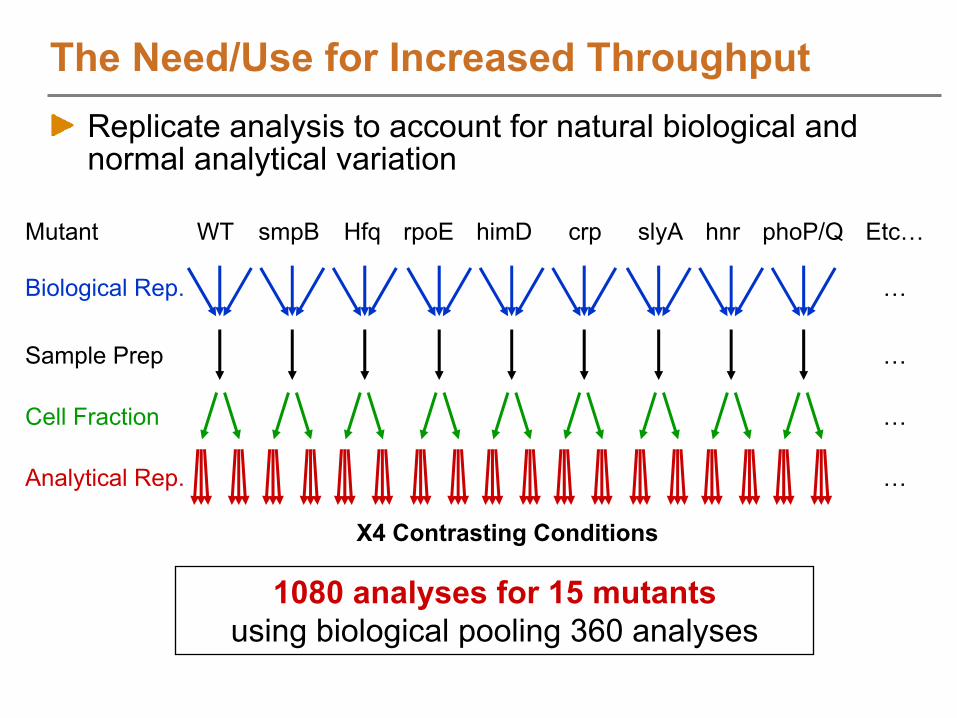
X4 Contrasting Conditions
smpBWT HfqMutant
Biological Rep.
Cell Fraction
Analytical Rep.
Sample Prep
himD phoP/QslyA hnrrpoE crp Etc…
…
…
…
…
1080 analyses for 15 mutantsusing biological pooling 360 analyses
The Need/Use for Increased ThroughputReplicate analysis to account for natural biological and normal analytical variation
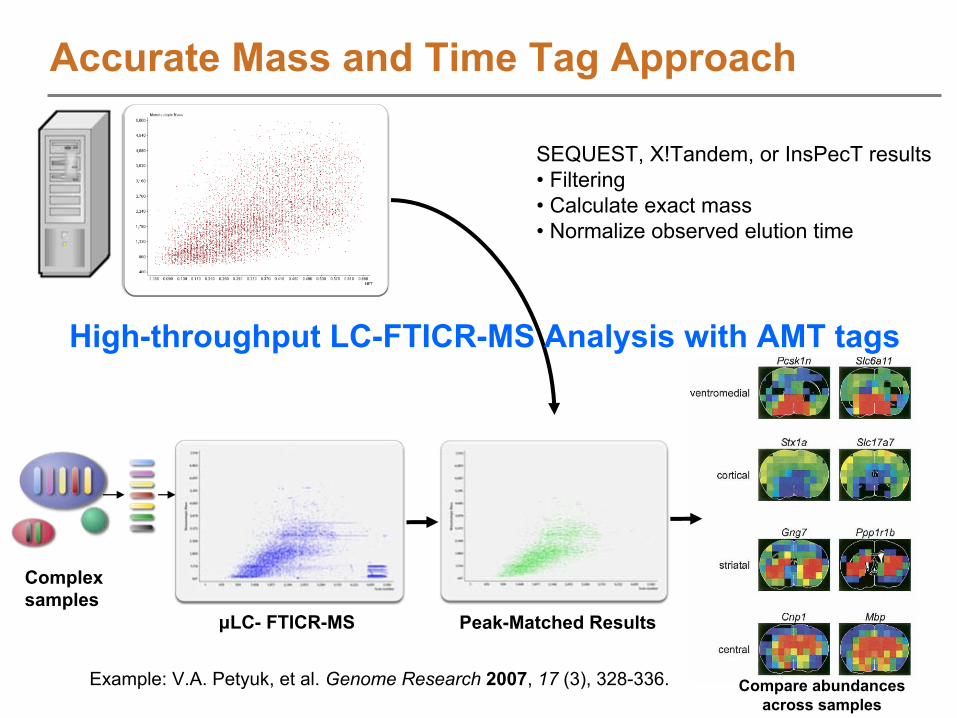
SEQUEST, X!Tandem, or InsPecT results• Filtering• Calculate exact mass• Normalize observed elution time
μLC-
FTICR-MS Peak-Matched Results
Complex samples
Compare abundancesacross samples
Example: V.A. Petyuk, et al. Genome Research
2007, 17
(3), 328-336.
High-throughput LC-FTICR-MS Analysis with AMT tags
Accurate Mass and Time Tag Approach
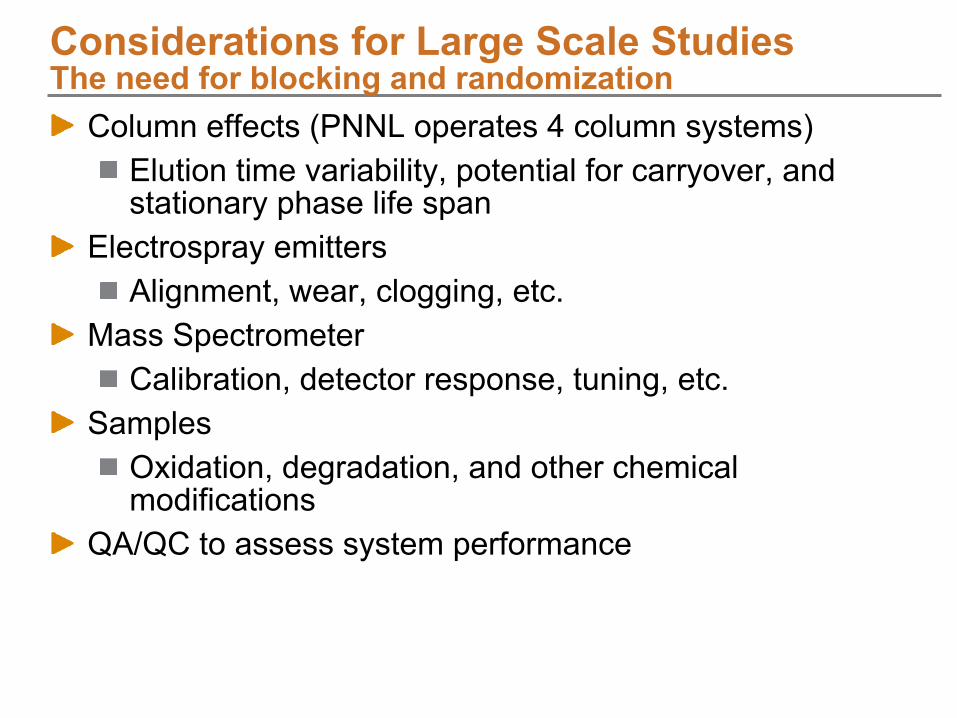
Column effects (PNNL operates 4 column systems)Elution time variability, potential for carryover, and stationary phase life span
Electrospray emittersAlignment, wear, clogging, etc.
Mass SpectrometerCalibration, detector response, tuning, etc.
SamplesOxidation, degradation, and other chemical modifications
QA/QC to assess system performance
Considerations for Large Scale Studies The need for blocking and randomization
J.S. Zimmer et. al. Mass. Spectrom. Rev.
2006, 25
(3), 450-482.
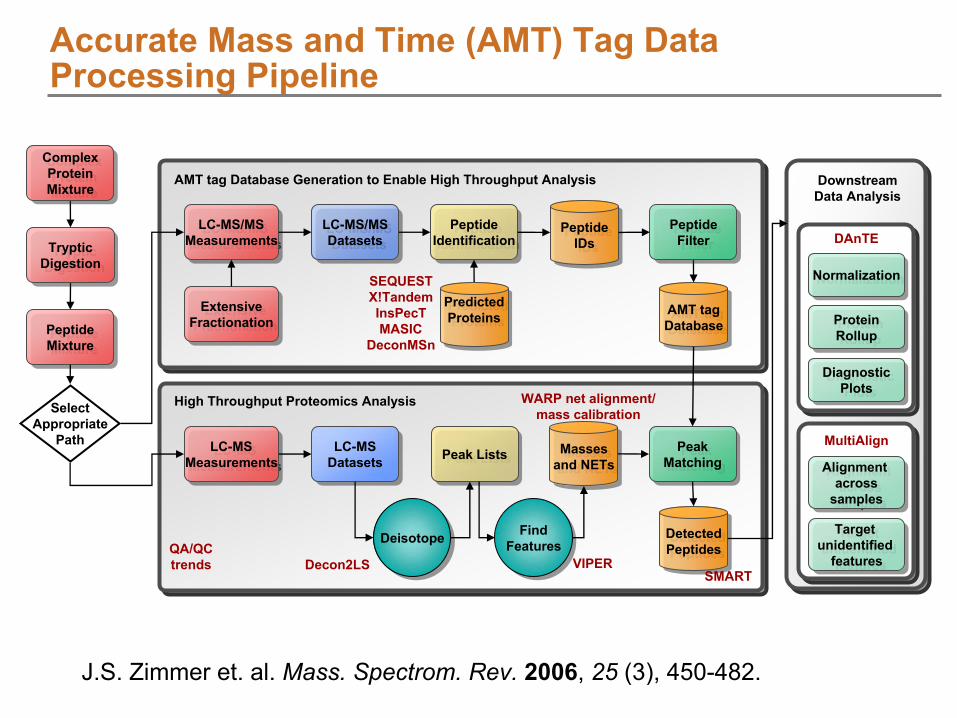
Accurate Mass and Time (AMT) Tag Data Processing
Pipeline
LC-MS/MS
Datasets
LC-MS/MS
DatasetsPeptide
Identification
Peptide
Identification
LC-MS
Datasets
LC-MS
DatasetsPeak
MatchingPeak
MatchingMasses
and NETs
Masses
and NETs
Peptide
IDs
Peptide
IDs
DeisotopeDeisotope Find
Features
Find
Features
LC-MS/MS
Measurements
LC-MS/MS
Measurements
Extensive
Fractionation
Extensive
Fractionation
LC-MS
Measurements
LC-MS
Measurements
QA/QCtrends Decon2LS
Peak ListsPeak Lists
PredictedProteins
PredictedProteins
Peptide
Filter
Peptide
Filter
AMT tagDatabaseAMT tagDatabase
AMT tag Database Generation to Enable High Throughput Analysis
High Throughput Proteomics Analysis
DetectedPeptides
DetectedPeptides
Complex
Protein
Mixture
Complex
Protein
Mixture
Tryptic
Digestion
Tryptic
Digestion
Peptide
Mixture
Peptide
Mixture
Select
Appropriate
Path
Downstream Data Analysis
DAnTE
NormalizationNormalization
Protein
Rollup
Protein
Rollup
Diagnostic
Plots
Diagnostic
Plots
MultiAlign
Alignment across
samples
Alignment across
samples
Target unidentified
features
Target unidentified
featuresVIPERSMART
WARP net alignment/mass calibration
SEQUESTX!TandemInsPecTMASIC
DeconMSn

NIAID: Salmonella
infecting host cells; small sample quantities whole proteome coverage
Analysis of “Voxels”
from mouse brains to reveal protein abundance patterns in brain structures
The Mammary Epithelial Cell Secretome and Its Regulation by Signal Transduction Pathways
Analysis of purified viral particles of Monkeypox and Vaccinia viruses
L. Shi, J.N. Adkins, et. al., J. of Biological Chem.
2006, 281, 29131-29140.
V.A. Petyuk, et al. Genome Research
2007, 17
(3), 328-336.
Recent Examples of Successful Applications using LC-MS Proteomics Approaches
J.K. Jacobs, et. al. J. Proteome Res.
2008, 7
(2), 558-569.
N.P. Manes, et. al. J. Proteome Res.
2008, 7
(3), 960-968.

Course Related Software & Data
PNNL's NCRR website
http://ncrr.pnl.gov
http://www.proteomicsresource.org
Salmonella Typhimurium data resource
http://omics.pnl.gov
PNNL’s Data and Software Distribution Website
http://www.sysbep.org/

Selected Software Resources
http://www.ms-utils.org/
(Magnus Palmblad)
http://open-ms.sourceforge.net/index.php
(European consortium)
http://tools.proteomecenter.org/SpecArray.php
(ISB)
http://fiehnlab.ucdavis.edu/staff/kind/Metabolomics/Peak_Alignment/
(Tobias Kind with Oliver Fiehn)
http://www.proteomecommons.org/tools.jsp
(Phil Andrews and Jayson Falkner)
http://www.broad.mit.edu/cancer/software/genepattern/ (Broad Institute)
https://proteomics.fhcrc.org/CPAS/ (FHCRC)
http://proteowizard.sourceforge.net/
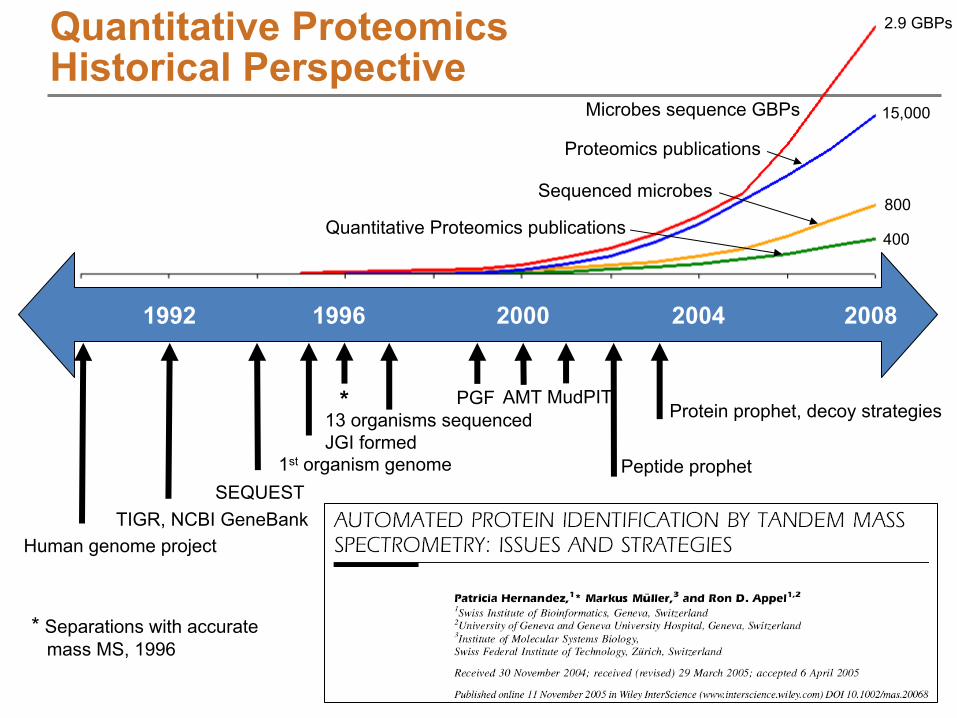
200820041992 20001996
Human genome projectTIGR, NCBI GeneBank
SEQUEST1st
organism genome
13 organisms sequencedJGI formed
PGF AMT MudPIT
Peptide prophet
Protein
prophet, decoy strategies
Proteomics publications
Quantitative Proteomics publications
Sequenced microbes
Microbes sequence GBPs
2.9 GBPs
15,000
800
400
Quantitative Proteomics Historical
Perspective
*
Separations with accuratemass MS, 1996
*

SampleProcessing
PurificationFractionationProtein extractionDigestionLabelingSpiking
Cells / Tissue
InstrumentAnalysis
LC-MSLC-MS/MS
TOFIon TrapsQ-TOFTOF-TOFFTICROrbitrap
Feature Extraction
Identification
QuantitativeAnalysis
M. Bantscheff, M. Schirle, G. Sweetman, J. Rick, and B. Kuster, "Quantitative mass spectrometry in proteomics: a critical review," Anal. Bioanal. Chem.
2007, 389 (4), 1017-1031.
Proteins in sample
Proteins identified
Proteins quantified
Protein concentration
Num
ber o
f pro
tein
s
Proteomics Workflow

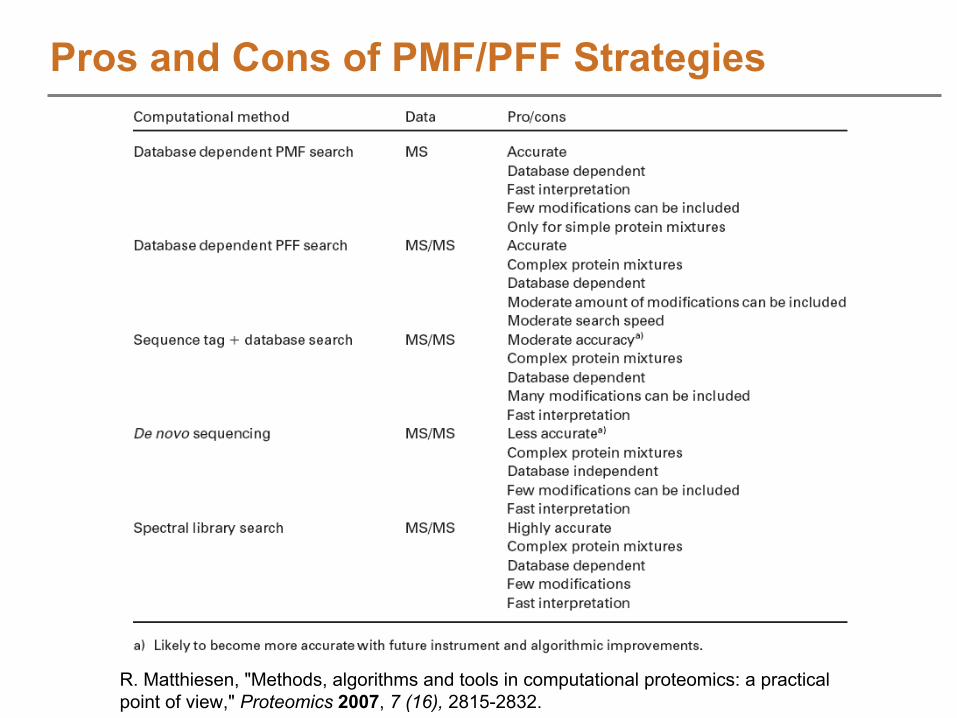
Identification StrategiesProteomics
MS (Peptide Mass Fingerprinting or PMF)Low complexity mixtures
MS/MS (Peptide Fragment Fingerprinting or PFF )Comprehensive tool set available
Accurate Mass and Time (AMT) tag approachRequires database of peptide IDs and LC elution timesHigh throughput
ValidationPeptide ID confidencePeptide to protein assignmentProtein identification confidence
MetabolomicsIdentification tools less mature
Accurate mass can be used to determine molecular formulaStructural determination
Manual analysis of MS/MS spectraNMR analysis
R. Matthiesen, "Methods, algorithms and tools in computational proteomics: a practical point of view," Proteomics
2007, 7 (16),
2815-2832.
Pros and Cons of PMF/PFF Strategies
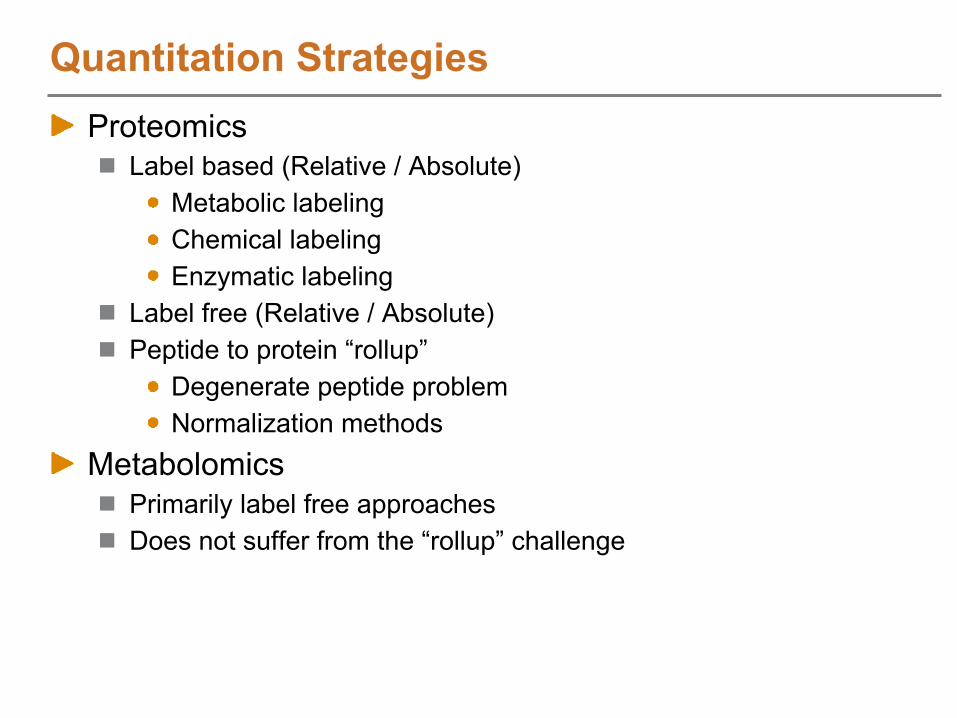
Quantitation StrategiesProteomics
Label based (Relative / Absolute)Metabolic labelingChemical labelingEnzymatic labeling
Label free (Relative / Absolute)Peptide to protein “rollup”
Degenerate peptide problemNormalization methods
MetabolomicsPrimarily label free approachesDoes not suffer from the “rollup”
challenge
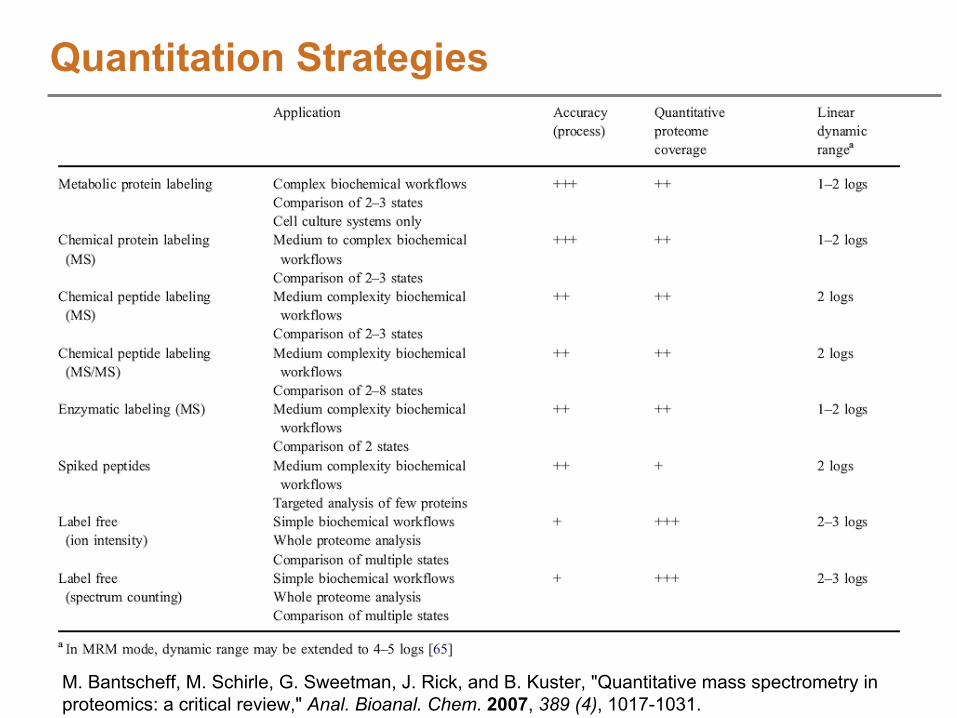
M. Bantscheff, M. Schirle, G. Sweetman, J. Rick, and B. Kuster, "Quantitative mass spectrometry in proteomics: a critical review," Anal. Bioanal. Chem.
2007, 389 (4), 1017-1031.
Quantitation Strategies
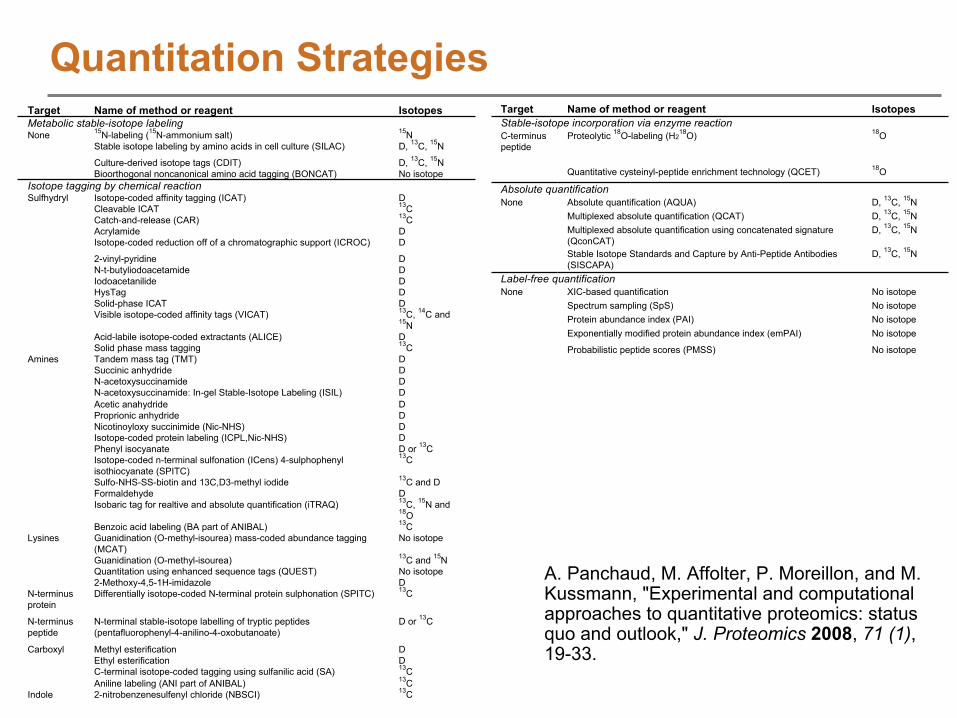
Quantitation StrategiesTarget Name of method or reagent IsotopesMetabolic stable-isotope labelingNone 15N-labeling (15N-ammonium salt) 15N
Stable isotope labeling by amino acids in cell culture (SILAC) D, 13C, 15N
Culture-derived isotope tags (CDIT) D, 13C, 15NBioorthogonal noncanonical amino acid tagging (BONCAT) No isotope
Isotope tagging by chemical reactionSulfhydryl Isotope-coded affinity tagging (ICAT) D
Cleavable ICAT 13CCatch-and-release (CAR) 13CAcrylamide DIsotope-coded reduction off of a chromatographic support (ICROC) D
2-vinyl-pyridine DN-t-butyliodoacetamide DIodoacetanilide DHysTag DSolid-phase ICAT DVisible isotope-coded affinity tags (VICAT) 13C, 14C and
15NAcid-labile isotope-coded extractants (ALICE) DSolid phase mass tagging 13C
Amines Tandem mass tag (TMT) DSuccinic anhydride DN-acetoxysuccinamide DN-acetoxysuccinamide: In-gel Stable-Isotope Labeling (ISIL) DAcetic anahydride DProprionic anhydride DNicotinoyloxy succinimide (Nic-NHS) DIsotope-coded protein labeling (ICPL,Nic-NHS) DPhenyl isocyanate D or 13CIsotope-coded n-terminal sulfonation (ICens) 4-sulphophenyl isothiocyanate (SPITC)
13C
Sulfo-NHS-SS-biotin and 13C,D3-methyl iodide 13C and DFormaldehyde DIsobaric tag for realtive and absolute quantification (iTRAQ) 13C, 15N and
18OBenzoic acid labeling (BA part of ANIBAL) 13C
Lysines Guanidination (O-methyl-isourea) mass-coded abundance tagging (MCAT)
No isotope
Guanidination (O-methyl-isourea) 13C and 15NQuantitation using enhanced sequence tags (QUEST) No isotope2-Methoxy-4,5-1H-imidazole D
N-terminus protein
Differentially isotope-coded N-terminal protein sulphonation (SPITC) 13C
N-terminus peptide
N-terminal stable-isotope labelling of tryptic peptides (pentafluorophenyl-4-anilino-4-oxobutanoate)
D or 13C
Carboxyl Methyl esterification DEthyl esterification DC-terminal isotope-coded tagging using sulfanilic acid (SA) 13CAniline labeling (ANI part of ANIBAL) 13C
Indole 2-nitrobenzenesulfenyl chloride (NBSCI) 13C
Target Name of method or reagent IsotopesStable-isotope incorporation via enzyme reactionC-terminus peptide
Proteolytic 18O-labeling (H218O) 18O
Quantitative cysteinyl-peptide enrichment technology (QCET) 18O
Absolute quantificationNone Absolute quantification (AQUA) D, 13C, 15N
Multiplexed absolute quantification (QCAT) D, 13C, 15NMultiplexed absolute quantification using concatenated signature
(QconCAT)D, 13C, 15N
Stable Isotope Standards and Capture by Anti-Peptide Antibodies (SISCAPA)
D, 13C, 15N
Label-free quantificationNone XIC-based quantification No isotope
Spectrum sampling (SpS) No isotopeProtein abundance index (PAI) No isotopeExponentially modified protein abundance index (emPAI) No isotope
Probabilistic peptide scores (PMSS) No isotope
A. Panchaud, M. Affolter, P. Moreillon, and M. Kussmann, "Experimental and computational approaches to quantitative proteomics: status quo and outlook," J. Proteomics
2008, 71 (1), 19-33.
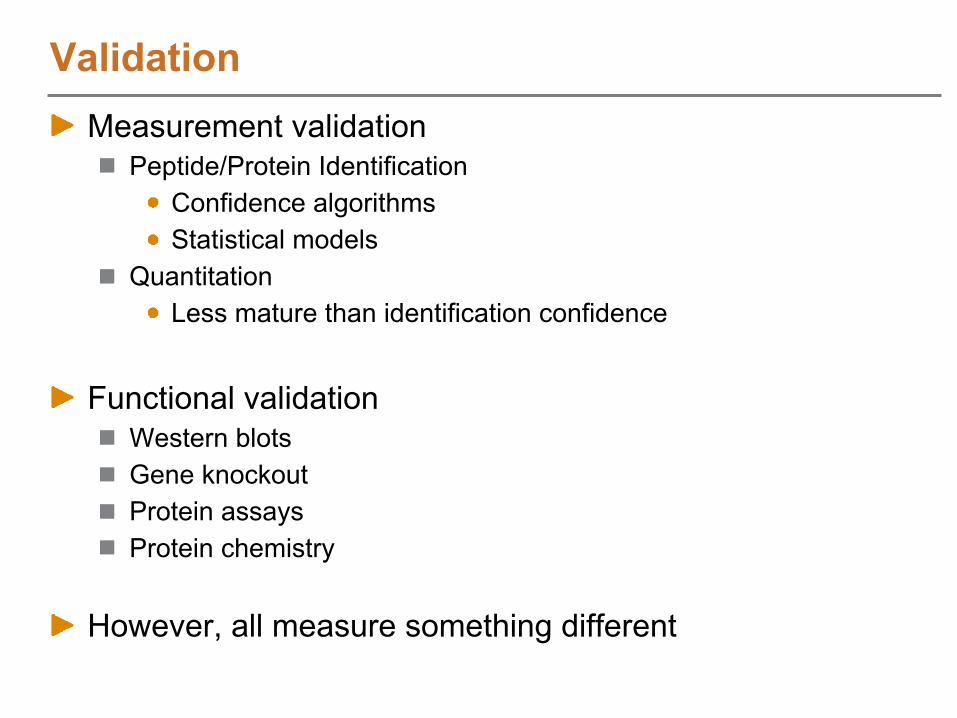
ValidationMeasurement validation
Peptide/Protein IdentificationConfidence algorithmsStatistical models
QuantitationLess mature than identification confidence
Functional validationWestern blots Gene knockoutProtein assaysProtein chemistry
However, all measure something different
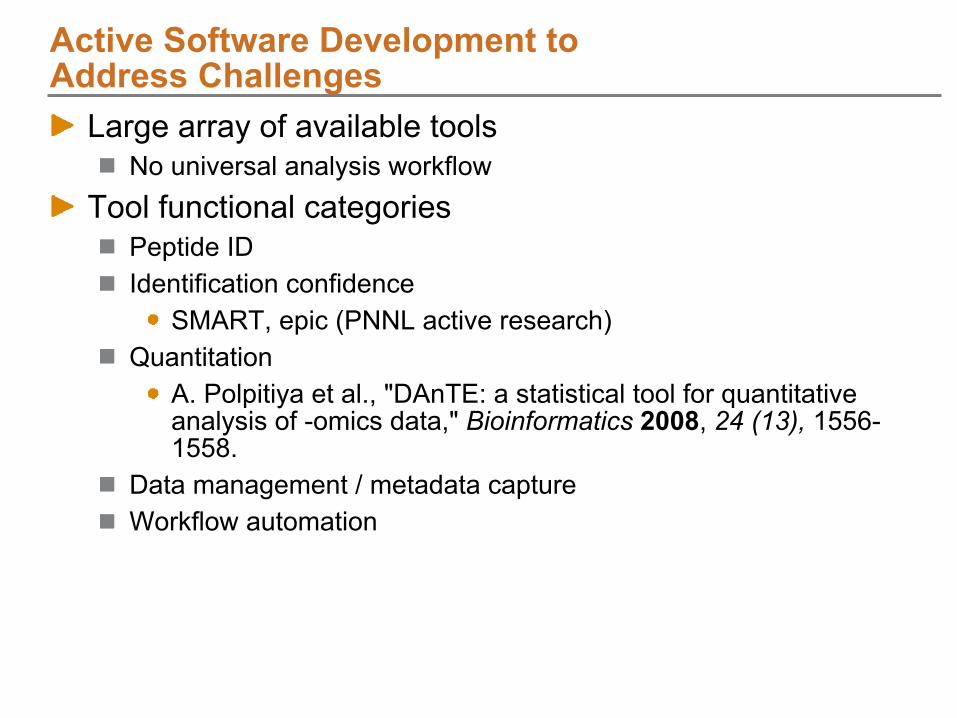
Active Software Development to Address
Challenges
Large array of available toolsNo universal analysis workflow
Tool functional categoriesPeptide IDIdentification confidence
SMART, epic (PNNL active research)Quantitation
A. Polpitiya et al., "DAnTE: a statistical tool for quantitative
analysis of -omics data," Bioinformatics
2008, 24 (13),
1556-
1558.
Data management / metadata captureWorkflow automation
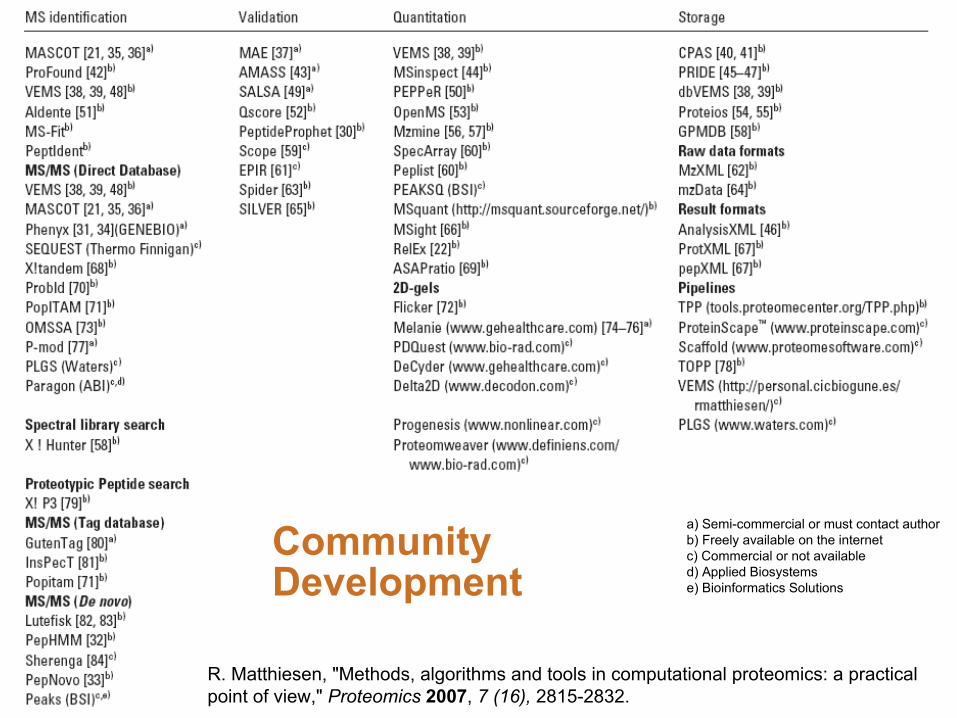
Community Development
a) Semi-commercial or must contact authorb) Freely available on the internetc) Commercial or not availabled) Applied Biosystemse) Bioinformatics Solutions
R. Matthiesen, "Methods, algorithms and tools in computational proteomics: a practical point of view," Proteomics
2007, 7 (16),
2815-2832.

PNNL Pipeline PEPPeR msInspect SuperHirn CRAWDAD Lab PNNL Broad Institute FHCRC IMSB (Swiss) Univ. Wash. Feature Picker Decon2LS/Viper Mapquant
(or any other) msInspect SuperHirn CRAWDAD
Method Spectrum de-isotoping then
clustering
Image Analysis then de-isotoping
Wavelet decomposition
then de-isotoping
Spectrum de-isotoping then
merging
m/z channel binning
RT Alignment Normalization, then linear or LCMSWARP
Relative, then linear, or
LOESS (exp)
Iterative non-linear
transformation
LOESS modeling
Dynamic time warping
m/z recalibration Yes (dynamic) Yes (quadratic) No No No Assignment of IDs to features
AMT database, normalized
elution times
AMT database, relative elution
order (Landmarks)
AMT database through user interaction
Yes, but not well
documented at present
Yes, for differences only
if they exist
Statistical Evaluation of assignment
Mass shift decoy and/or Bayesian
Statistics
Bayesian Statistics
No No No
Unidentified Feature Recognition
Stored in database for later analysis
Data-dependent tolerance-based
clustering
User specified tolerance-based
clustering
Tolerance-based merging, heuristics
Difference mapping only
Runs on Windows with GUI
Web-based (Linux or
Windows install bases)
Java with GUI Linux Linux/Windows
Software Platforms for Label-free Quantitation
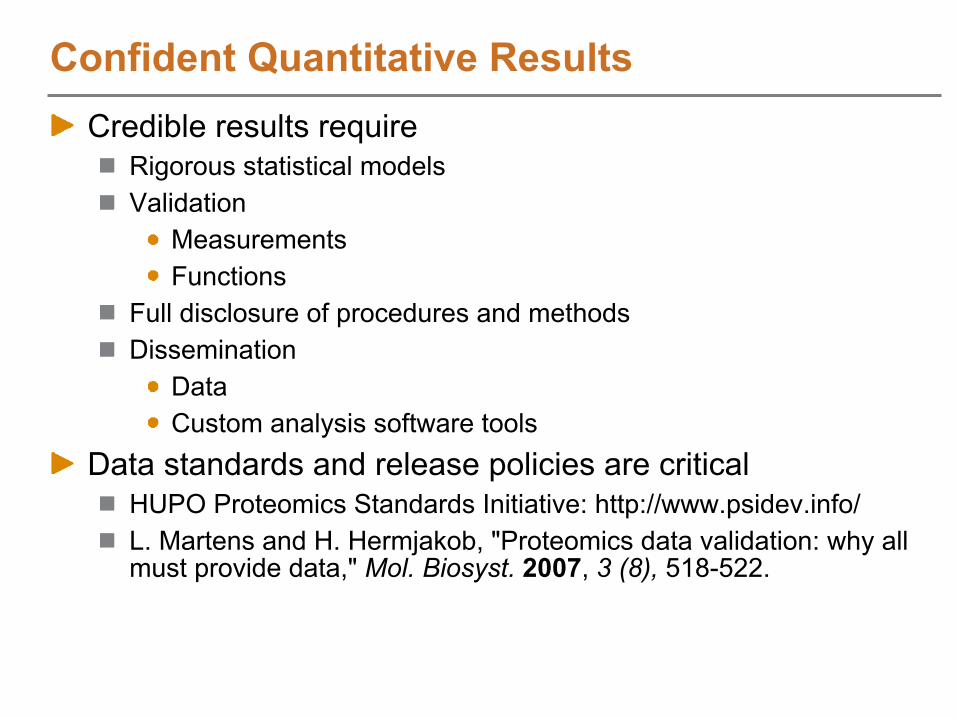
Credible results requireRigorous statistical
modelsValidation
MeasurementsFunctions
Full disclosure of procedures and methodsDissemination
DataCustom analysis software tools
Data standards and release policies are criticalHUPO Proteomics Standards Initiative: http://www.psidev.info/L. Martens and H. Hermjakob, "Proteomics data validation: why all must provide data," Mol. Biosyst.
2007, 3 (8), 518-522.
Confident Quantitative Results
ReferencesA. Panchaud, M. Affolter, P. Moreillon, and M. Kussmann, "Experimental and computational approaches to quantitative proteomics: status quo and outlook," J. Proteomics
2008, 71 (1), 19-33.A. Honda, Y. Suzuki, and K. Suzuki, "Review of molecular modification techniques for improved detection of biomolecules by mass spectrometry," Anal. Chim. Acta.
2008, 623 (1), 1-10.T.O. Metz, J.S. Page, E.S. Baker, K.Q. Tang, J. Ding, Y.F. Shen,
and R.D. Smith, "High-resolution separations and improved ion production and transmission in metabolomics," Trac-Trends in Analytical Chemistry
2008, 27 (3), 205-214.L. Martens and H. Hermjakob, "Proteomics data validation: why all must provide data," Mol. Biosyst. 2007, 3 (8), 518-522.B.J. Webb-Robertson and W.R. Cannon, "Current trends in computational inference from mass spectrometry-based proteomics," Brief Bioinform.
2007, 8 (5), 304-317.T.O. Metz, Q. Zhang, J.S. Page, Y. Shen, S.J. Callister, J.M. Jacobs, and R.D. Smith, "The future of liquid chromatography-mass spectrometry (LC-
MS) in //metabolic profiling and metabolomic studies for biomarker discovery," Biomark. Med. 2007,
1 (1), 159-185.

ReferencesR. Matthiesen, "Methods, algorithms and tools in computational proteomics: a practical point of view," Proteomics
2007,
7 (16), 2815-2832.M. Bantscheff, M. Schirle, G. Sweetman, J. Rick, and B. Kuster, "Quantitative mass spectrometry in proteomics: a critical review," Anal. Bioanal. Chem.
2007, 389 (4), 1017-1031.W. Urfer, M. Grzegorczyk, and K. Jung, "Statistics for proteomics: a review of tools for analyzing experimental data," Proteomics
2006, 6 Suppl 2, 48-55.P. Hernandez, M. Muller, and R.D. Appel, "Automated protein identification by tandem mass spectrometry: issues and strategies," Mass Spectrom. Rev.
2006, 25 (2), 235-54.J. Peng, J.E. Elias, C.C. Thoreen, L.J. Licklider, and S.P. Gygi, "Evaluation of multidimensional chromatography coupled with tandem mass spectrometry (LC/LC-MS/MS) for large-scale protein analysis: the yeast proteome," J. Proteome Res.
2003, 2 (1), 43-50.S.A. Gerber, J. Rush, O. Stemman, M.W. Kirschner, and S.P. Gygi,
"Absolute quantification of proteins and phosphoproteins from cell lysates
by tandem MS," Proc. Natl. Acad. Sci. USA
2003, 100 (12), 6940-5.R. Aebersold and M. Mann, "Mass spectrometry-based proteomics," Nature.
2003, 422 (6928), 198-207.

ReferencesR.D. Smith, G.A. Anderson, M.S. Lipton, L. Pasa-Tolic, Y. Shen, T.P. Conrads, T.D. Veenstra, and H.R. Udseth, "An accurate mass tag strategy for quantitative and high-throughput proteome measurements," Proteomics
2002, 2 (5), 513-23.R.D. Smith, L. Pasa-Tolic, M.S. Lipton, P.K. Jensen, G.A. Anderson, Y. Shen, T.P. Conrads, H.R. Udseth, R. Harkewicz, M.E. Belov, C. Masselon, and T.D. Veenstra, "Rapid quantitative measurements of proteomes by Fourier transform ion cyclotron resonance mass spectrometry," Electrophoresis
2001,
22 (9), 1652-68.T.P. Conrads, K. Alving, T.D. Veenstra, M.E. Belov, G.A. Anderson, D.J. Anderson, M.S. Lipton, L. Pasa-Tolic, H.R. Udseth, W.B. Chrisler, B.D. Thrall, and R.D. Smith, "Quantitative analysis of bacterial and mammalian proteomes using a combination of cysteine affinity tags and 15N-metabolic labeling," Anal. Chem.
2001, 73 (9), 2132-9.T.P. Conrads, G.A. Anderson, T.D. Veenstra, L. Pasa-Tolic, and R.D. Smith, "Utility of accurate mass tags for proteome-wide protein identification," Anal. Chem.
2000, 72 (14), 3349-54.J.K. Nicholson, J.C. Lindon, and E. Holmes, "Metabonomics: understanding the metabolic responses of living systems to pathophysiological stimuli via multivariate statistical analysis of biological NMR spectroscopic data," Xenobiotica
1999, 29 (11), 1181-1189.

Part II: LC-MS Feature DiscoveryPart I: Introduction and Overview of Label-Free Quantitative Proteomics (Anderson)Part II: Feature Discovery in LC-MS Datasets (Monroe and Polpitiya)
Structure of LC-MS DataFeature discovery in individual spectra (deisotoping)
Feature definition over elution time
Identifying LC-MS Features using an AMT tag DB
Extending the AMT tag approach for feature based analyses
Estimating confidence of identified LC-MS features
Downstream quantitative analysis with DAnTEBreakPart III: Biological Application of the AMT tag Approach (Ansong)AMT tag Analysis Software DemoPanel Discussion

Feature Discovery in LC-MS DatasetsTwo-dimensional views of an LC-MS dataset in different stages of data processing
Several stages of processing are required to extract biological knowledge from raw LC-MS data
Raw DataMonoisotopic
Features in Each Mass Spectrum
LC-MS Features
Characterized
Elution profile discovery
Datasets Peptide
ID
Datasets PeakMatchingFeatures
Peptide
IDs
Deiso Find
Features
LC-MS/MS
Fractions
LC-MS Peak Lists
Proteins
Filter
DB
AMT tag Database Generation
High Throughput Proteomics Analysis
DetectedPeptides
Proteins
Digest
Peptides
Path
Normalize
Rollup
Plots
Alignment
Non-ID'd features
Downstream Analysis
500
1000
1500
2000
2500
3000
500
750
1000
1250
1500
m/z
scan #
Deisotoping
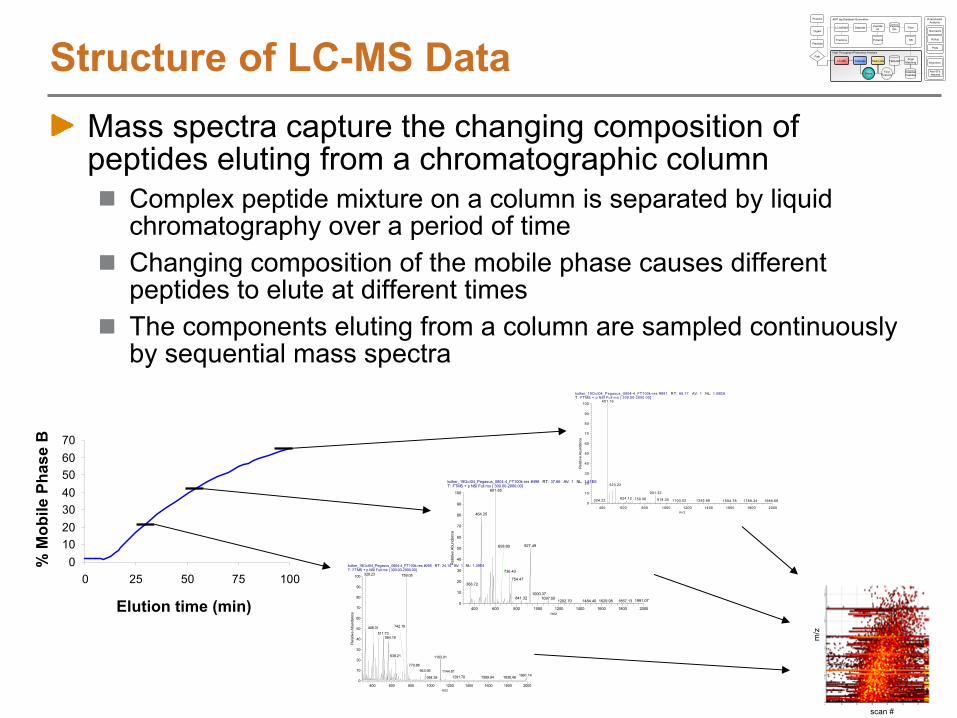
Structure of LC-MS DataMass spectra capture the changing composition of peptides eluting from a chromatographic column
Complex peptide mixture on a column is separated by liquid chromatography over a period of timeChanging composition of the mobile phase causes different peptides to elute at different timesThe components eluting from a column are sampled continuously by sequential mass spectra
010203040506070
0 25 50 75 100kolker_19Oct04_Pegasus_0804-4_FT100k-res #265 RT: 24.14 AV: 1 NL: 1.39E4T: FTMS + p NSI Full ms [ 300.00-2000.00]
400 600 800 1000 1200 1400 1600 1800 2000m/z
0
10
20
30
40
50
60
70
80
90
100
Rel
ativ
e A
bund
ance
328.23 759.05
511.73564.19
408.31
638.21 1103.01
943.96770.88
1991.14
742.19
1291.701144.81
1838.461589.94954.38
Elution time (min)
% M
obile
Pha
se B
kolker_19Oct04_Pegasus_0804-4_FT100k-res #498 RT: 37.66 AV: 1 NL: 1.81E6T: FTMS + p NSI Full ms [ 300.00-2000.00]
400 600 800 1000 1200 1400 1600 1800 2000m/z
0
10
20
30
40
50
60
70
80
90
100
Rel
ativ
e A
bund
ance
601.85
464.25
927.49
736.43
754.47368.72
658.80
841.32 1097.501000.37
1991.071202.70 1867.131484.40 1629.98
kolker_19O c t04_Pegasus_0804-4_FT100k-res #991 RT: 66.77 AV: 1 NL: 1.06E6T: FTMS + p NSI Full m s [ 300.00-2000.00]
400 600 800 1000 1200 1400 1600 1800 2000m /z
0
10
20
30
40
50
60
70
80
90
100
Rel
ativ
e Ab
unda
nce
451.16
523.22
901.32624.12 759.06 918.35324.22 1103.02 1345.68 1986.661594.78 1789.34
Datasets Peptide
ID
Datasets PeakMatchingFeatures
Peptide
IDs
Deiso Find
Features
LC-MS/MS
Fractions
LC-MS Peak Lists
Proteins
Filter
DB
AMT tag Database Generation
High Throughput Proteomics Analysis
DetectedPeptides
Proteins
Digest
Peptides
Path
Normalize
Rollup
Plots
Alignment
Non-ID'd features
Downstream Analysis
m/z
scan #

Structure of LC-MS DataEach compound is observed as an isotopic pattern
in a
mass spectrumThe pattern is dependent on the compound’s chemical composition, charge, and resolution of instrument
Theoretical Profile
939.51939.00
940.01
940.51
941.01 941.51
25
50
75
100
939 939.5 940 940.5 941 941.5
m/z
inte
nsity
Datasets Peptide
ID
Datasets PeakMatchingFeatures
Peptide
IDs
Deiso Find
Features
LC-MS/MS
Fractions
LC-MS Peak Lists
Proteins
Filter
DB
AMT tag Database Generation
High Throughput Proteomics Analysis
DetectedPeptides
Proteins
Digest
Peptides
Path
Normalize
Rollup
Plots
Alignment
Non-ID'd features
Downstream Analysis
m/z: 939.0203
Charge:
2+
Monoisotopic Mass: 1876.0054 Da
Elution range: Scans 1539 -
1593
Peptide: VKHPSEIVNVGDEINVK
Parent Protein: gi|16759851 30S ribosomal protein S1
m/z: 939.0203
Charge:
2+
Monoisotopic Mass: 1876.0054 Da
Elution range: Scans 1539 -
1593
Peptide: VKHPSEIVNVGDEINVK
Parent Protein: gi|16759851 30S ribosomal protein S1
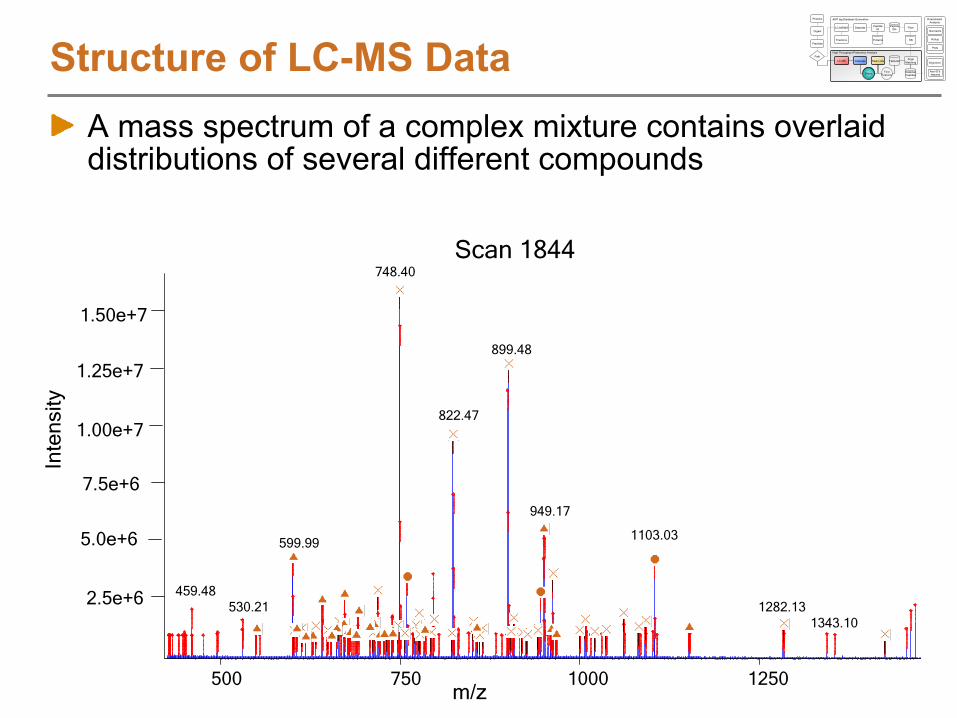
Structure of LC-MS DataA mass spectrum of a complex mixture contains overlaid distributions of several different compounds
748.40
899.48
822.47
949.17
599.991103.03
459.48530.21 1282.13
1343.10
2.5e+6
5.0e+6
7.5e+6
1.00e+7
1.25e+7
1.50e+7
500 750 1000 1250m/z
Scan 1844
Inte
nsity
Datasets Peptide
ID
Datasets PeakMatchingFeatures
Peptide
IDs
Deiso Find
Features
LC-MS/MS
Fractions
LC-MS Peak Lists
Proteins
Filter
DB
AMT tag Database Generation
High Throughput Proteomics Analysis
DetectedPeptides
Proteins
Digest
Peptides
Path
Normalize
Rollup
Plots
Alignment
Non-ID'd features
Downstream Analysis

m/z
Elution time (scan)
930
935
940
1200 1250 1600 1650
With LC as the first dimension, each compound is observed over multiple spectra, showing a three-
dimensional pattern of m/z, elution time and abundance
Structure of LC-MS DataDatasets Peptide
ID
Datasets PeakMatchingFeatures
Peptide
IDs
Deiso Find
Features
LC-MS/MS
Fractions
LC-MS Peak Lists
Proteins
Filter
DB
AMT tag Database Generation
High Throughput Proteomics Analysis
DetectedPeptides
Proteins
Digest
Peptides
Path
Normalize
Rollup
Plots
Alignment
Non-ID'd features
Downstream Analysis
Goal: Infer mass, elution time, and intensity of compounds that are present in the LC-MS dataset
Compounds are termed LC-MS features since they are inferred from a 3D pattern, yet identity is unknown
m/z: 939.0203
Charge:
2+
Monoisotopic Mass: 1876.0054 Da
Elution range: Scans 1539 -
1593
Peptide: VKHPSEIVNVGDEINVK
Parent Protein: gi|16759851 30S ribosomal protein S1
m/z: 939.0203
Charge:
2+
Monoisotopic Mass: 1876.0054 Da
Elution range: Scans 1539 -
1593
Peptide: VKHPSEIVNVGDEINVK
Parent Protein: gi|16759851 30S ribosomal protein S1

Feature Discovery in Individual SpectraDeisotoping
Process of converting a mass spectrum (m/z and intensity) into a
list of species (mass, abundance, and charge)
Deisotoping a mass spectrum of 4 overlapping species
charge Monoisotopic MW abundance2 1546.856603 5334672 1547.705048 1946072 1547.887682 6719472 1548.799612 426939
m/z
inte
nsity
Datasets Peptide
ID
Datasets PeakMatchingFeatures
Peptide
IDs
Deiso Find
Features
LC-MS/MS
Fractions
LC-MS Peak Lists
Proteins
Filter
DB
AMT tag Database Generation
High Throughput Proteomics Analysis
DetectedPeptides
Proteins
Digest
Peptides
Path
Normalize
Rollup
Plots
Alignment
Non-ID'd features
Downstream Analysis
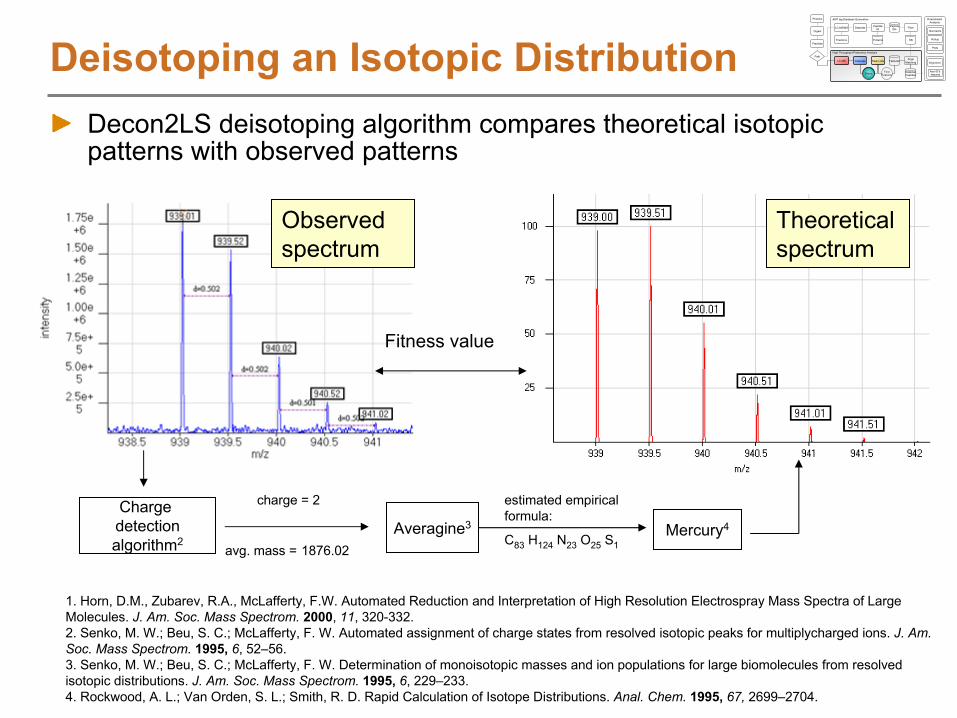
Deisotoping an Isotopic DistributionDecon2LS deisotoping algorithm compares theoretical isotopic patterns with observed patterns
avg. mass =
1876.02
Charge detectionalgorithm2
Fitness value
Averagine3
estimated empirical formula:
C83
H124
N23
O25
S1Mercury4
charge = 2
Observed spectrum
1. Horn, D.M., Zubarev, R.A., McLafferty, F.W. Automated Reduction and Interpretation of High Resolution Electrospray Mass Spectra of Large Molecules. J. Am. Soc. Mass Spectrom.
2000, 11, 320-332.2. Senko, M. W.; Beu, S. C.; McLafferty, F. W. Automated assignment of charge states from resolved isotopic peaks for multiplycharged ions. J. Am. Soc. Mass Spectrom. 1995, 6, 52–56.3. Senko, M. W.; Beu, S. C.; McLafferty, F. W. Determination of monoisotopic masses and ion populations for large biomolecules from resolved isotopic distributions. J. Am. Soc. Mass Spectrom. 1995, 6, 229–233.4. Rockwood, A. L.; Van Orden, S. L.; Smith, R. D. Rapid Calculation of Isotope Distributions. Anal. Chem. 1995, 67, 2699–2704.
Theoretical spectrum
Datasets Peptide
ID
Datasets PeakMatchingFeatures
Peptide
IDs
Deiso Find
Features
LC-MS/MS
Fractions
LC-MS Peak Lists
Proteins
Filter
DB
AMT tag Database Generation
High Throughput Proteomics Analysis
DetectedPeptides
Proteins
Digest
Peptides
Path
Normalize
Rollup
Plots
Alignment
Non-ID'd features
Downstream Analysis

Deisotoping an Isotopic DistributionPatterson (Autocorrelation) algorithm
to detect charge of a peak in a complex spectrum
Mercury algorithm used to guess an
average empirical formula for a given mass
Fitness (fit) functions to quantitate quality of match between theoretical and observed profiles
For additional details, see the slides presented at 2007 US HUPO, available at http://ncrr.pnl.gov/training/workshops/
9 3 8 . 5 9 3 9 9 3 9 . 5 9 4 0 9 4 0 . 5 9 4 1 9 4 1 . 50
0 . 5
1
1 . 5
2
2 . 5
3
3 . 5x 1 0 6
Averagine empirical formula of C4.9384
H7.7583
N1.3577
O1.4773
S0.0417
C83
H124
N23 O25 S for 1876.02 Da
Datasets Peptide
ID
Datasets PeakMatchingFeatures
Peptide
IDs
Deiso Find
Features
LC-MS/MS
Fractions
LC-MS Peak Lists
Proteins
Filter
DB
AMT tag Database Generation
High Throughput Proteomics Analysis
DetectedPeptides
Proteins
Digest
Peptides
Path
Normalize
Rollup
Plots
Alignment
Non-ID'd features
Downstream Analysis
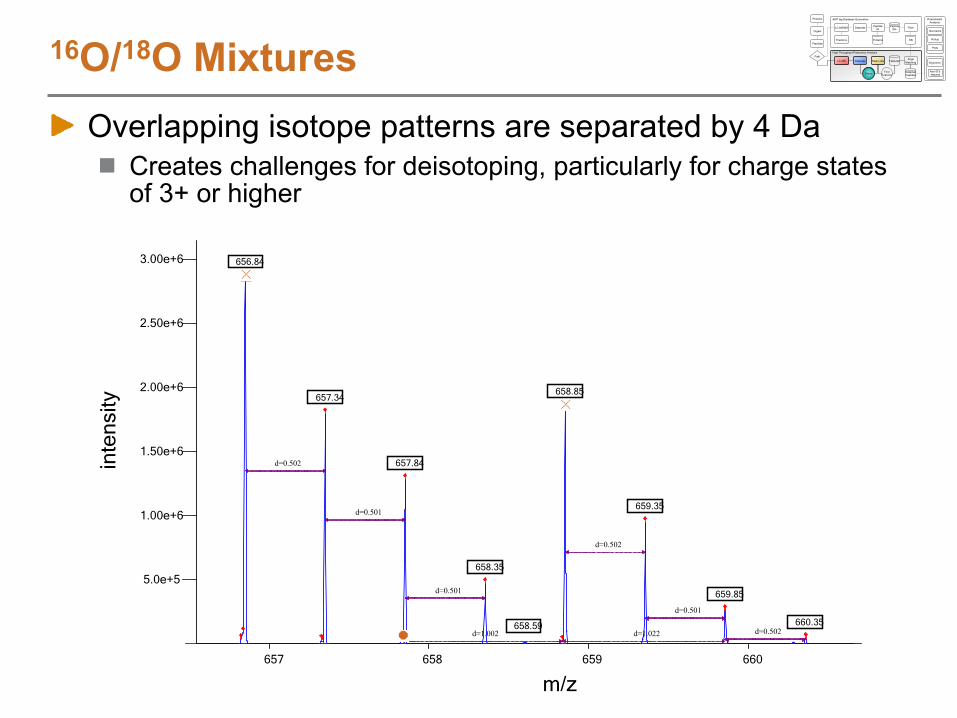
16O/18O MixturesOverlapping isotope patterns are separated by 4 Da
Creates challenges for deisotoping, particularly for charge states of 3+ or higher
656.84
658.85657.34
657.84
659.35
658.35
659.85
660.35658.59
d=0.502
d=0.501
d=0.501
d=0.502
d=0.501
d=0.502d=1.002 d=1.022
5.0e+5
1.00e+6
1.50e+6
2.00e+6
2.50e+6
3.00e+6
657 658 659 660
m/z
inte
nsity
Datasets Peptide
ID
Datasets PeakMatchingFeatures
Peptide
IDs
Deiso Find
Features
LC-MS/MS
Fractions
LC-MS Peak Lists
Proteins
Filter
DB
AMT tag Database Generation
High Throughput Proteomics Analysis
DetectedPeptides
Proteins
Digest
Peptides
Path
Normalize
Rollup
Plots
Alignment
Non-ID'd features
Downstream Analysis
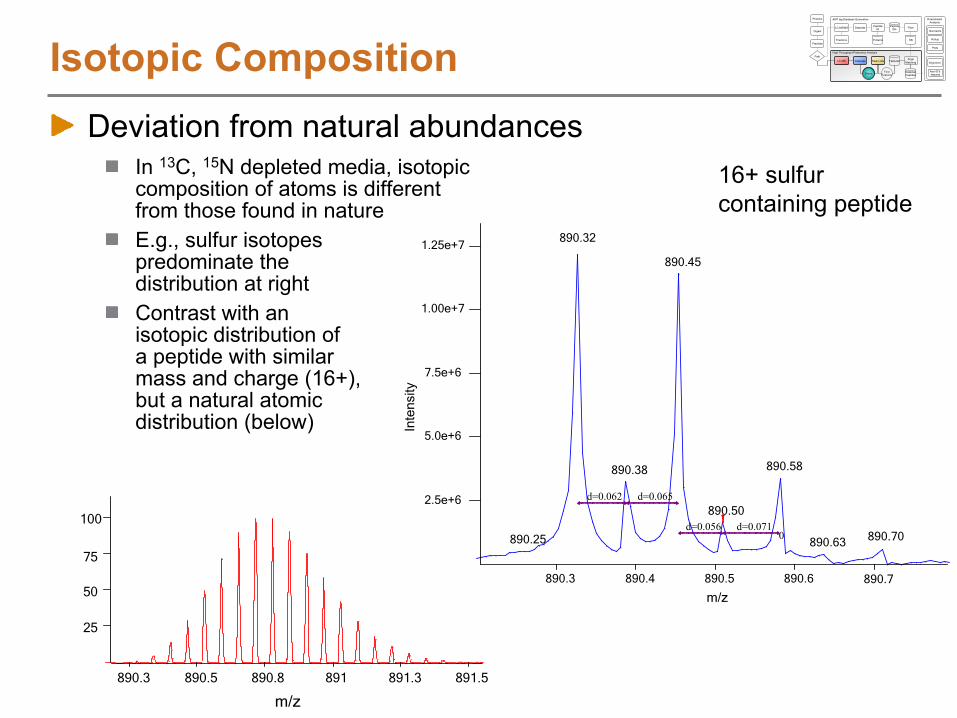
Isotopic CompositionDeviation from natural abundances
25
50
75
100
890.3 890.5 890.8 891 891.3 891.5
m/z
In 13C, 15N depleted media, isotopic composition of atoms is different from those found in natureE.g., sulfur isotopes predominate the distribution at rightContrast with an isotopic distribution of a peptide with similar mass and charge (16+), but a natural atomic distribution (below)
890.32
890.45
890.58890.38
890.50
890.70890.25 890.630
d=0.062 d=0.065
d=0.056 d=0.071
2.5e+6
5.0e+6
7.5e+6
1.00e+7
1.25e+7
890.3 890.4 890.5 890.6 890.7
m/z
Inte
nsity
Datasets Peptide
ID
Datasets PeakMatchingFeatures
Peptide
IDs
Deiso Find
Features
LC-MS/MS
Fractions
LC-MS Peak Lists
Proteins
Filter
DB
AMT tag Database Generation
High Throughput Proteomics Analysis
DetectedPeptides
Proteins
Digest
Peptides
Path
Normalize
Rollup
Plots
Alignment
Non-ID'd features
Downstream Analysis
16+ sulfur containing peptide
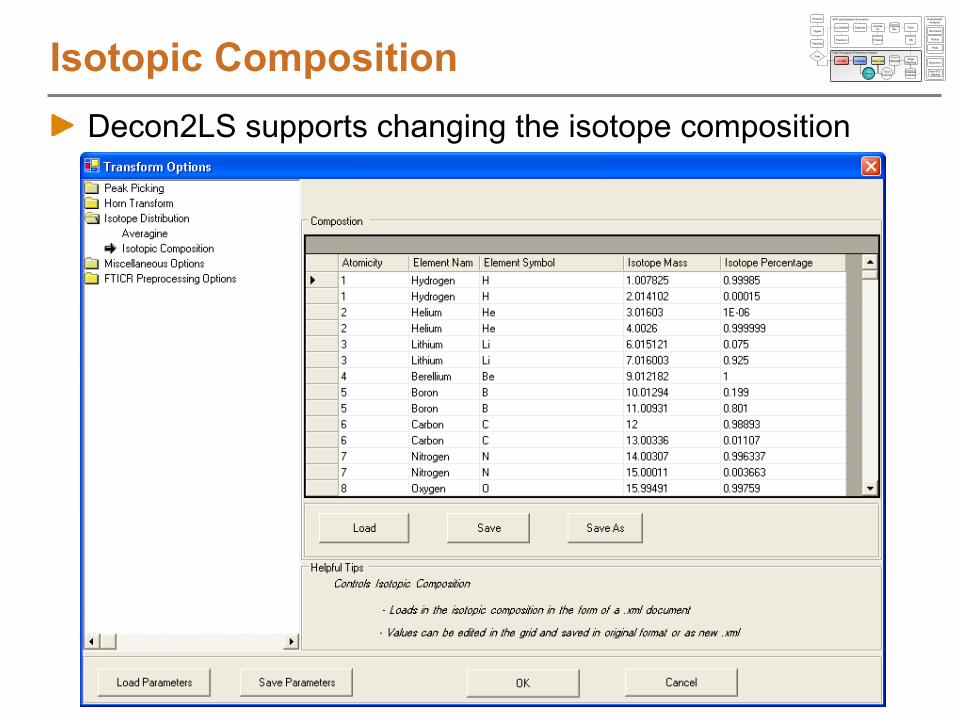
Isotopic CompositionDecon2LS supports changing the isotope composition
Datasets Peptide
ID
Datasets PeakMatchingFeatures
Peptide
IDs
Deiso Find
Features
LC-MS/MS
Fractions
LC-MS Peak Lists
Proteins
Filter
DB
AMT tag Database Generation
High Throughput Proteomics Analysis
DetectedPeptides
Proteins
Digest
Peptides
Path
Normalize
Rollup
Plots
Alignment
Non-ID'd features
Downstream Analysis

Part II: LC-MS Feature DiscoveryPart I: Introduction and Overview of Label-Free Quantitative Proteomics (Anderson)Part II: Feature Discovery in LC-MS Datasets (Monroe and Polpitiya)
Structure of LC-MS DataFeature discovery in individual spectra (deisotoping)
Feature definition over elution time
Identifying LC-MS Features using an AMT tag DB
Extending the AMT tag approach for feature based analyses
Estimating confidence of identified LC-MS features
Downstream quantitative analysis with DAnTEBreakPart III: Biological Application of the AMT tag Approach (Ansong)AMT tag Analysis Software DemoPanel Discussion

Feature Definition over Elution TimeDeisotoping collapses original data into data lists
Goal: Given series of deisotoped mass spectra, group related data across elution time
Look for repeated monoisotopic mass values in sequential spectra, allowing for missing dataCan also look for expected chromatographic peak shape
scan num charge abundance mz fit average mwmonoiso
mwmost abu.
mw fwhm signal noise1500 1 2772933 759.0649 0.0716 758.5222 758.0576 758.0576 0.0106 718.831500 1 2614913 1103.033 0.1111 1102.698 1102.026 1102.026 0.0222 74.041500 1 2422829 864.4919 0.0156 864.0073 863.4846 863.4846 0.0137 74.751500 2 2297822 563.3253 0.012 1125.322 1124.636 1124.636 0.006 77.941500 1 1213607 943.9815 0.1025 943.5518 942.9742 942.9742 0.0165 120.361500 3 988761 675.0246 0.02 2023.375 2022.052 2023.0549 0.0086 79.221500 2 734070 688.392 0.0384 1375.694 1374.77 1374.7695 0.009 92.091500 2 663954 642.3243 0.0253 1283.417 1282.634 1282.6341 0.0076 109.011500 1 661477 730.1117 0.024 729.5461 729.1045 729.1045 0.0096 39.061500 2 630657 689.3645 0.0446 1377.64 1376.715 1376.7145 0.0088 57.521500 2 569896 591.8343 0.0198 1182.379 1181.654 1181.6541 0.0065 111.21500 2 503993 757.8854 0.0706 1513.762 1512.753 1512.7533 0.0105 80.41500 2 451007 936.9389 0.0296 1873.091 1871.863 1872.8662 0.0156 46.74
Datasets Peptide
ID
Datasets PeakMatchingFeatures
Peptide
IDs
Deiso Find
Features
LC-MS/MS
Fractions
LC-MS Peak Lists
Proteins
Filter
DB
AMT tag Database Generation
High Throughput Proteomics Analysis
DetectedPeptides
Proteins
Digest
Peptides
Path
Normalize
Rollup
Plots
Alignment
Non-ID'd features
Downstream Analysis

Can visualize deisotoped data in two-dimensions
Feature Definition over Elution Time
•
Plotting monoisotopic mass•
Color is based on charge of the original data point seen
•
Monoisotopic Mass =
(m/z x charge) -
1.00728 x charge
Time
Mas
s
Datasets Peptide
ID
Datasets PeakMatchingFeatures
Peptide
IDs
Deiso Find
Features
LC-MS/MS
Fractions
LC-MS Peak Lists
Proteins
Filter
DB
AMT tag Database Generation
High Throughput Proteomics Analysis
DetectedPeptides
Proteins
Digest
Peptides
Path
Normalize
Rollup
Plots
Alignment
Non-ID'd features
Downstream Analysis

Zoom-in view of speciesSame species in multiple spectra need to be grouped together
Feature Definition over Elution Time
Related peaks found using a weighted Euclidean distance; considers:
MassAbundanceElution timeIsotopic Fit
Determine 6 separate groups
Datasets Peptide
ID
Datasets PeakMatchingFeatures
Peptide
IDs
Deiso Find
Features
LC-MS/MS
Fractions
LC-MS Peak Lists
Proteins
Filter
DB
AMT tag Database Generation
High Throughput Proteomics Analysis
DetectedPeptides
Proteins
Digest
Peptides
Path
Normalize
Rollup
Plots
Alignment
Non-ID'd features
Downstream Analysis
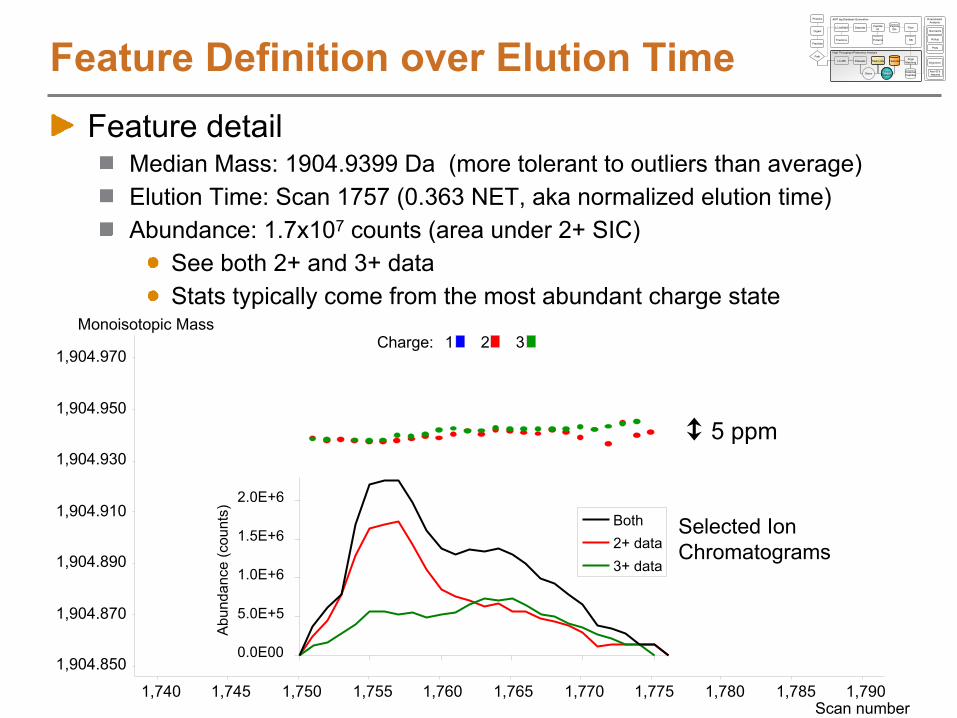
Feature Definition over Elution TimeFeature detail
Median Mass: 1904.9399 Da (more tolerant to outliers than average)Elution Time: Scan 1757 (0.363 NET, aka normalized elution time)Abundance: 1.7x10⁷
counts (area under 2+ SIC)See both 2+ and 3+ dataStats typically come from the most abundant charge state
Scan number
Monoisotopic Mass
1,904.850
1,904.870
1,904.890
1,904.910
1,904.930
1,904.950
1,904.970
1,740 1,745 1,750 1,755 1,760 1,765 1,770 1,775 1,780 1,785 1,790
5 ppm
1 2 3Charge:
Selected Ion Chromatograms
0.0E00
5.0E+5
1.0E+6
1.5E+6
2.0E+6
Abu
ndan
ce (c
ount
s) Both2+ data3+ data
Datasets Peptide
ID
Datasets PeakMatchingFeatures
Peptide
IDs
Deiso Find
Features
LC-MS/MS
Fractions
LC-MS Peak Lists
Proteins
Filter
DB
AMT tag Database Generation
High Throughput Proteomics Analysis
DetectedPeptides
Proteins
Digest
Peptides
Path
Normalize
Rollup
Plots
Alignment
Non-ID'd features
Downstream Analysis

Second exampleLC-MS feature eluting over 7.5 minutes
Feature Definition over Elution Time
Clustering algorithm allows for missing data, common with chromatographic tailing
Datasets Peptide
ID
Datasets PeakMatchingFeatures
Peptide
IDs
Deiso Find
Features
LC-MS/MS
Fractions
LC-MS Peak Lists
Proteins
Filter
DB
AMT tag Database Generation
High Throughput Proteomics Analysis
DetectedPeptides
Proteins
Digest
Peptides
Path
Normalize
Rollup
Plots
Alignment
Non-ID'd features
Downstream Analysis

Second example, feature detailMedian Mass: 2068.1781 DaElution Time: Scan 1809 (0.380 NET)Abundance: 8.7x10⁷
counts (area under 3+ SIC)See both 2+ and 3+ data, though 3+ is more prevalent
Feature Definition over Elution Time
Scan number
Monoisotopic Mass
2,068.075
2,068.095
2,068.115
2,068.135
2,068.155
2,068.175
2,068.195
1,775 1,800 1,825 1,850 1,875 1,900 1,925 1,950 1,975 2,000 2,025 2,050
1 2 3Charge:
5 ppm
0.0E+0
1.0E+6
2.0E+6
3.0E+6
4.0E+6
Abu
ndan
ce (c
ount
s)
Both2+ data3+ data
Selected Ion Chromatograms
Datasets Peptide
ID
Datasets PeakMatchingFeatures
Peptide
IDs
Deiso Find
Features
LC-MS/MS
Fractions
LC-MS Peak Lists
Proteins
Filter
DB
AMT tag Database Generation
High Throughput Proteomics Analysis
DetectedPeptides
Proteins
Digest
Peptides
Path
Normalize
Rollup
Plots
Alignment
Non-ID'd features
Downstream Analysis

Feature Definition over Elution TimeExample: S. Typhimurium dataset on 11T FTICR
• 100 minute LC-MS analysis (3360 mass spectra)• 67 cm, 150 μm I.D. column with 5 μm C18
particles• 78,641 deisotoped peaks• Group into 5910 LC-MS Features
Datasets Peptide
ID
Datasets PeakMatchingFeatures
Peptide
IDs
Deiso Find
Features
LC-MS/MS
Fractions
LC-MS Peak Lists
Proteins
Filter
DB
AMT tag Database Generation
High Throughput Proteomics Analysis
DetectedPeptides
Proteins
Digest
Peptides
Path
Normalize
Rollup
Plots
Alignment
Non-ID'd features
Downstream Analysis

Isotopic Pairs ProcessingPaired features typically have identical sequences, with and without an isotopic label
e.g. 16O/18O pairs have 4 Da spacing due to two 18O atoms
LC-FTICR-MS
Control(16O water)
Perturbed(18O water)
Datasets Peptide
ID
Datasets PeakMatchingFeatures
Peptide
IDs
Deiso Find
Features
LC-MS/MS
Fractions
LC-MS Peak Lists
Proteins
Filter
DB
AMT tag Database Generation
High Throughput Proteomics Analysis
DetectedPeptides
Proteins
Digest
Peptides
Path
Normalize
Rollup
Plots
Alignment
Non-ID'd features
Downstream Analysis
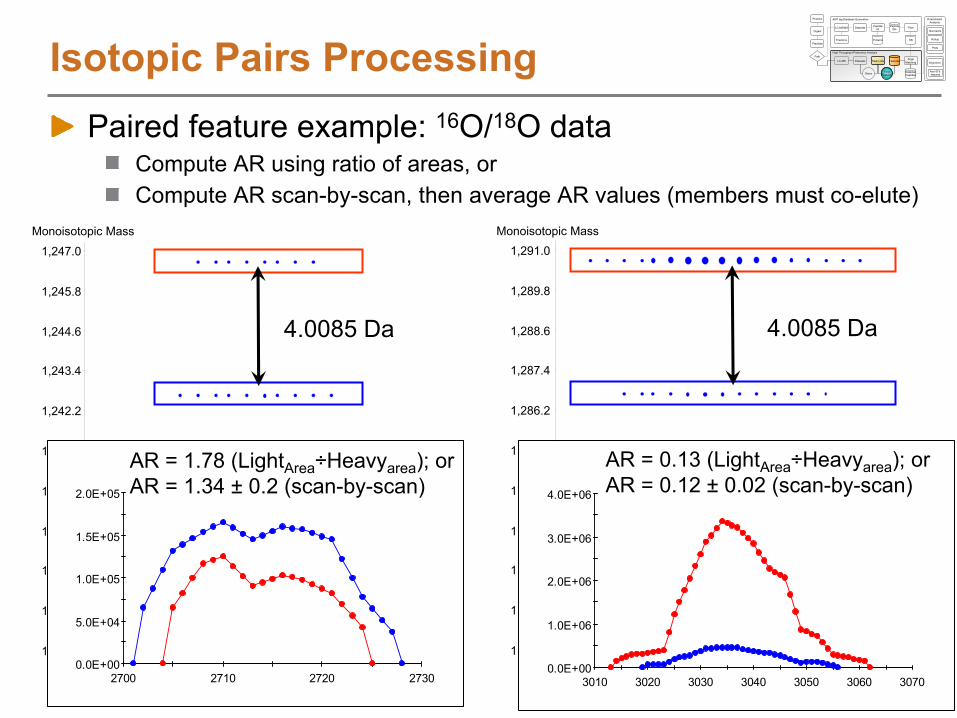
Paired feature example: 16O/18O data
Isotopic Pairs Processing
Monoisotopic Mass
Scan number
1,235.0
1,236.2
1,237.4
1,238.6
1,239.8
1,241.0
1,242.2
1,243.4
1,244.6
1,245.8
1,247.0
2,688 2,700 2,712 2,724 2,7360.0E+00
5.0E+04
1.0E+05
1.5E+05
2.0E+05
2700 2710 2720 2730
Pair #424; Charge used = 2AR = 1.78 (LightArea
÷Heavyarea
); or
AR = 1.34 ±
0.2 (scan-by-scan)
4.0085 Da
Scan number
Monoisotopic Mass
1,279.0
1,280.2
1,281.4
1,282.6
1,283.8
1,285.0
1,286.2
1,287.4
1,288.6
1,289.8
1,291.0
3,010 3,026 3,042 3,058
4.0085 Da
0.0E+00
1.0E+06
2.0E+06
3.0E+06
4.0E+06
3010 3020 3030 3040 3050 3060 3070
Pair #460; Charge used = 2AR = 0.13 (LightArea
÷Heavyarea
); or
AR = 0.12 ±
0.02 (scan-by-scan)
Compute AR using ratio of areas, or Compute AR scan-by-scan, then average AR values (members must co-elute)
Datasets Peptide
ID
Datasets PeakMatchingFeatures
Peptide
IDs
Deiso Find
Features
LC-MS/MS
Fractions
LC-MS Peak Lists
Proteins
Filter
DB
AMT tag Database Generation
High Throughput Proteomics Analysis
DetectedPeptides
Proteins
Digest
Peptides
Path
Normalize
Rollup
Plots
Alignment
Non-ID'd features
Downstream Analysis

Feature Definition over Elution TimeNumerous options in VIPER for clustering data to form LC-MS features and for finding paired features
Datasets Peptide
ID
Datasets PeakMatchingFeatures
Peptide
IDs
Deiso Find
Features
LC-MS/MS
Fractions
LC-MS Peak Lists
Proteins
Filter
DB
AMT tag Database Generation
High Throughput Proteomics Analysis
DetectedPeptides
Proteins
Digest
Peptides
Path
Normalize
Rollup
Plots
Alignment
Non-ID'd features
Downstream Analysis

Part II: LC-MS Feature DiscoveryPart I: Introduction and Overview of Label-Free Quantitative Proteomics (Anderson)Part II: Feature Discovery in LC-MS Datasets (Monroe and Polpitiya)
Structure of LC-MS DataFeature discovery in individual spectra (deisotoping)
Feature definition over elution time
Identifying LC-MS Features using an AMT tag DB
Extending the AMT tag approach for feature based analyses
Estimating confidence of identified LC-MS features
Downstream quantitative analysis with DAnTEBreakPart III: Biological Application of the AMT tag Approach (Ansong)AMT tag Analysis Software DemoPanel Discussion

Accurate Mass and Time (AMT) tagUnique peptide sequence whose monoisotopic mass and normalized elution time are accurately knownAMT tags also track any modified residues in peptide
AMT tag DBCollection of AMT tags
AMT tag approach articlesR.D. Smith et. al., Proteomics
2002, 2, 513-523.J.S. Zimmer, M.E. Monroe et. al., Mass Spec. Reviews
2006, 25, 450-482.L. Shi, J.N. Adkins, et. al., J. of Biological Chem.
2006, 281, 29131-29140.
Assembling an AMT tag DBDatasets Peptide
ID
Datasets PeakMatchingFeatures
Peptide
IDs
Deiso Find
Features
LC-MS/MS
Fractions
LC-MS Peak Lists
Proteins
Filter
DB
AMT tag Database Generation
High Throughput Proteomics Analysis
DetectedPeptides
Proteins
Digest
Peptides
Path
Normalize
Rollup
Plots
Alignment
Non-ID'd features
Downstream Analysis
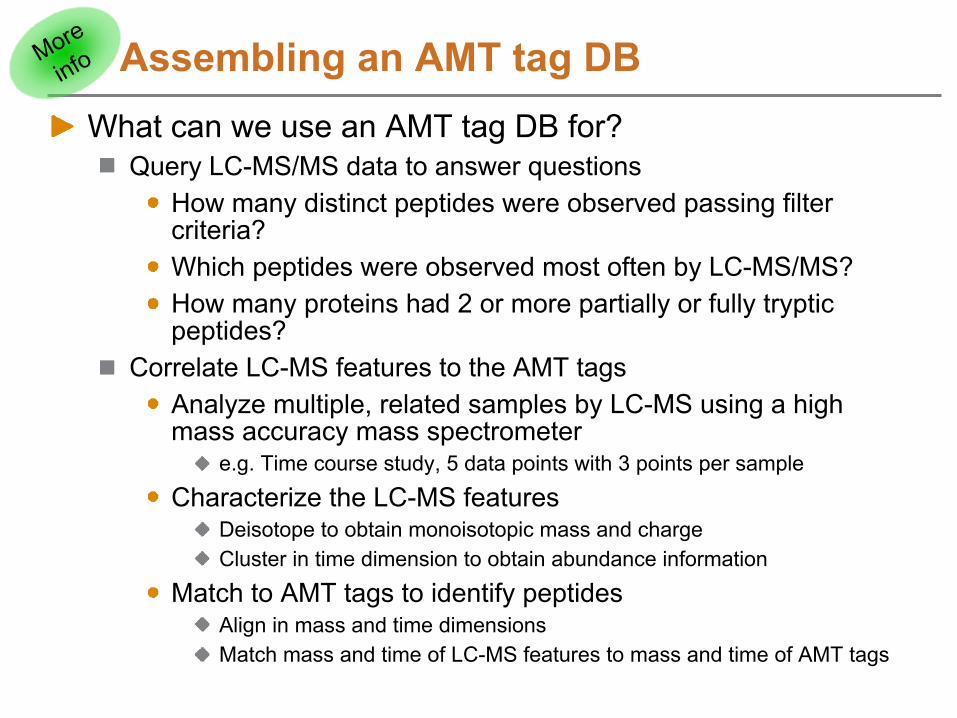
What can we use an AMT tag DB for?Query LC-MS/MS data to answer questions
How many distinct peptides were observed passing filter criteria?Which peptides were observed most often by LC-MS/MS?How many proteins had 2 or more partially or fully tryptic peptides?
Correlate LC-MS features to the AMT tagsAnalyze multiple, related samples by LC-MS using a high mass accuracy mass spectrometer
e.g. Time course study, 5 data points with 3 points per sample
Characterize the LC-MS featuresDeisotope to obtain monoisotopic mass and chargeCluster in time dimension to obtain abundance information
Match to AMT tags to identify peptidesAlign in mass and time dimensionsMatch mass and time of LC-MS features to mass and time of AMT tags
Assembling an AMT tag DBMore
info
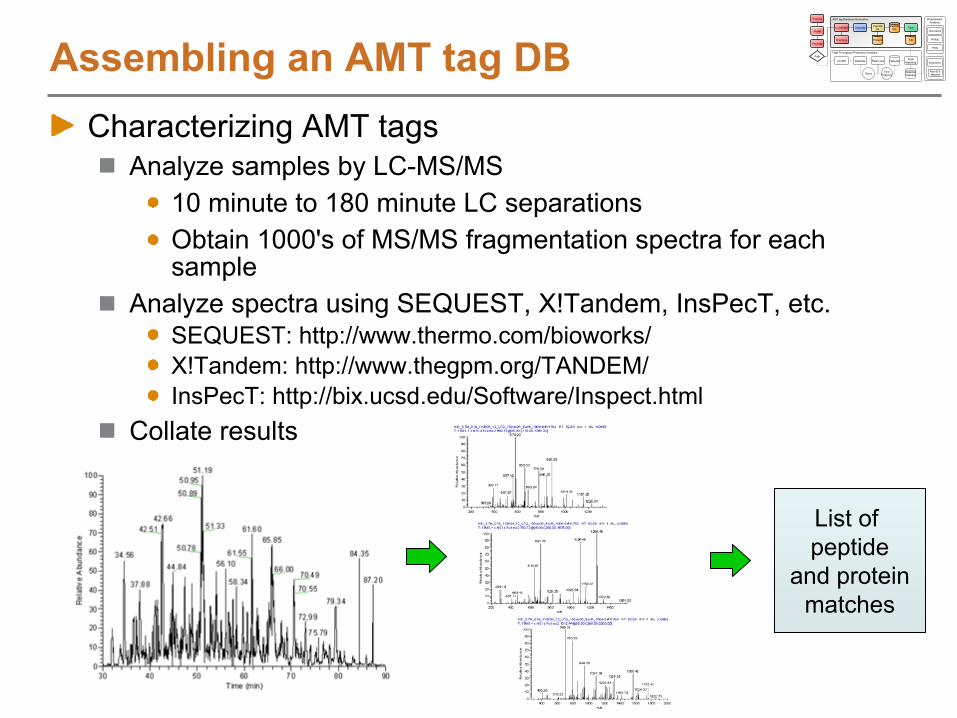
Assembling an AMT tag DBCharacterizing AMT tags
Analyze samples by LC-MS/MS10 minute to 180 minute LC separationsObtain 1000's of MS/MS fragmentation spectra for each sample
Analyze spectra using SEQUEST, X!Tandem, InsPecT, etc.SEQUEST: http://www.thermo.com/bioworks/ X!Tandem: http://www.thegpm.org/TANDEM/InsPecT: http://bix.ucsd.edu/Software/Inspect.html
Collate results
List of peptide
and protein
matches
Datasets Peptide
ID
Datasets PeakMatchingFeatures
Peptide
IDs
Deiso Find
Features
LC-MS/MS
Fractions
LC-MS Peak Lists
Proteins
Filter
DB
AMT tag Database Generation
High Throughput Proteomics Analysis
DetectedPeptides
Proteins
Digest
Peptides
Path
Normalize
Rollup
Plots
Alignment
Non-ID'd features
Downstream Analysis
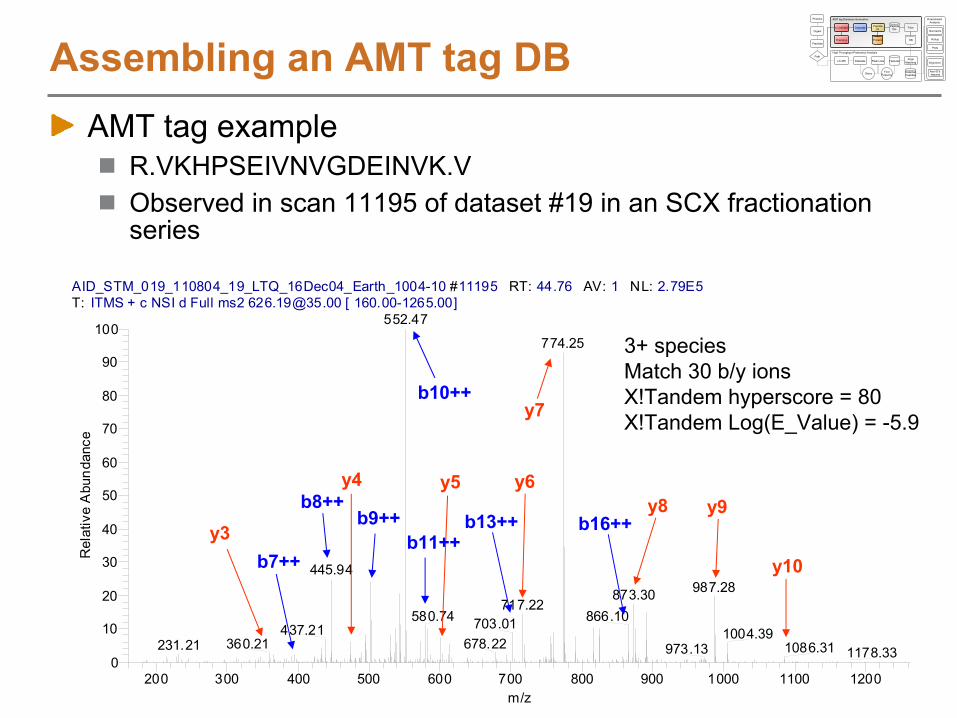
AID_STM_019_110804_19_LTQ_16Dec04_Earth_1004-10 #11195 RT: 44.76 AV: 1 NL: 2.79E5T: ITMS + c NSI d Full ms2 [email protected] [ 160.00-1265.00]
200 300 400 500 600 700 800 900 1000 1100 1200m/z
0
10
20
30
40
50
60
70
80
90
100
Rel
ativ
e A
bund
ance
552.47
774.25
445.94987.28873.30
717.22580.74 866.10703.01437.21 1004.39
360.21 678.22231.21 1086.31973.13 1178.33
Assembling an AMT tag DBAMT tag example
R.VKHPSEIVNVGDEINVK.VObserved in scan 11195 of dataset #19 in an SCX fractionation series
3+ species
Match 30 b/y ions
X!Tandem hyperscore = 80
X!Tandem Log(E_Value) = -5.9
y3
y4 y5 y6
y7
y8 y9
y10
b8++b9++
b10++
b11++b13++ b16++
b7++
Datasets Peptide
ID
Datasets PeakMatchingFeatures
Peptide
IDs
Deiso Find
Features
LC-MS/MS
Fractions
LC-MS Peak Lists
Proteins
Filter
DB
AMT tag Database Generation
High Throughput Proteomics Analysis
DetectedPeptides
Proteins
Digest
Peptides
Path
Normalize
Rollup
Plots
Alignment
Non-ID'd features
Downstream Analysis

Assembling an AMT tag DBAMT tag example
R.VKHPSEIVNVGDEINVK.VObserved in scan 11195 of dataset #19 in an SCX fractionation series
3+ species
Match 30 b/y ions
X!Tandem hyperscore = 80
X!Tandem Log(E_Value) = -5.9
More
info
Datasets Peptide
ID
Datasets PeakMatchingFeatures
Peptide
IDs
Deiso Find
Features
LC-MS/MS
Fractions
LC-MS Peak Lists
Proteins
Filter
DB
AMT tag Database Generation
High Throughput Proteomics Analysis
DetectedPeptides
Proteins
Digest
Peptides
Path
Normalize
Rollup
Plots
Alignment
Non-ID'd features
Downstream Analysis
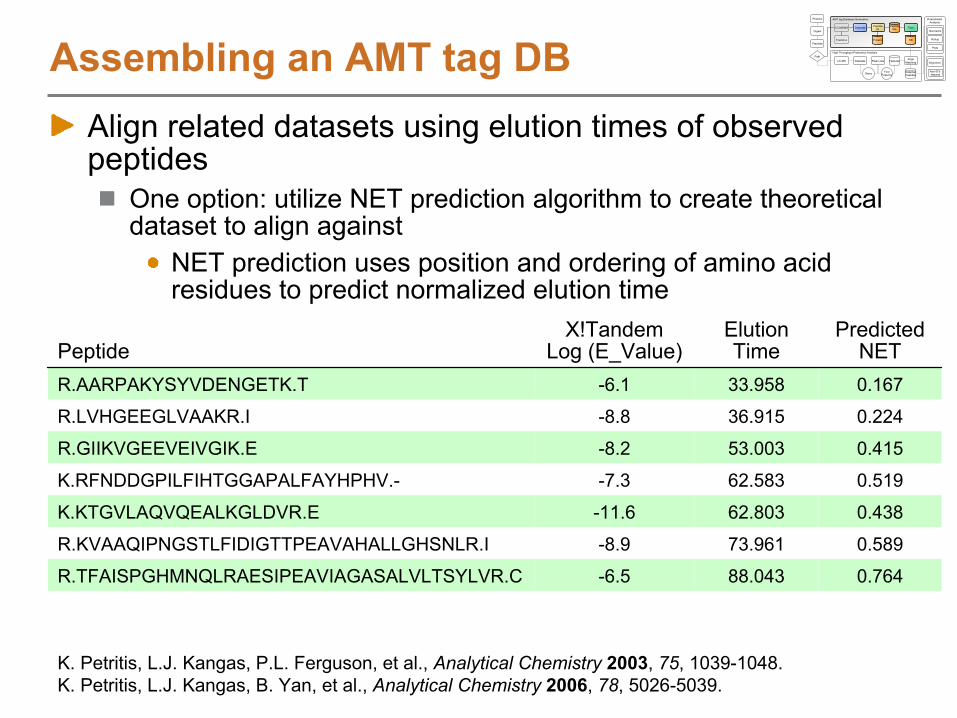
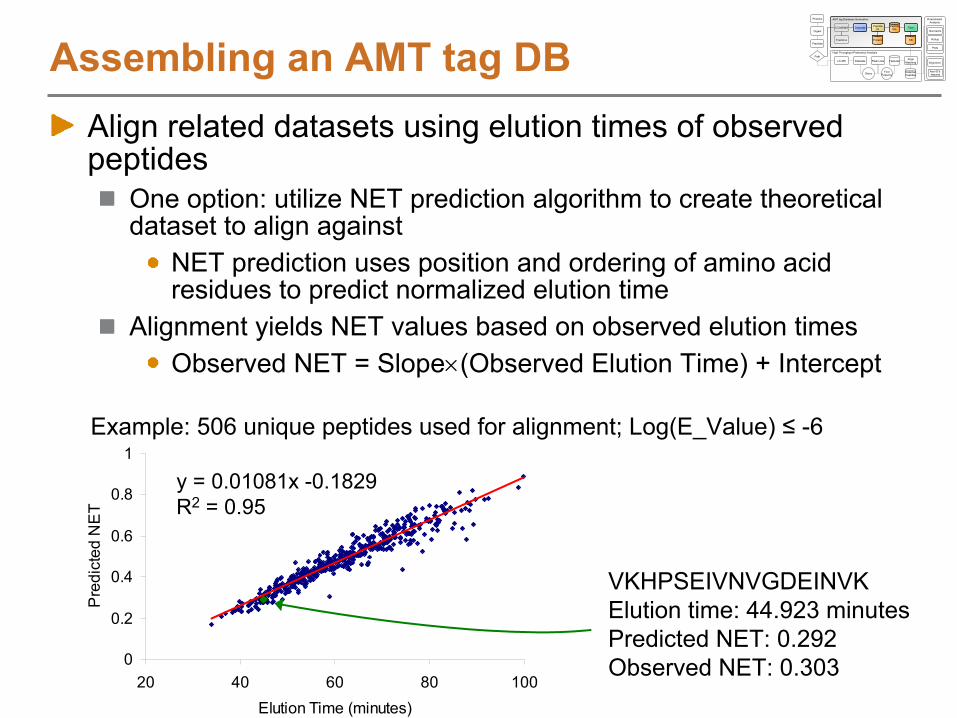
Assembling an AMT tag DBAlign related datasets using elution times of observed peptides
One option: utilize NET prediction algorithm to create theoretical dataset to align against
NET prediction uses position and ordering of amino acid residues to predict normalized elution time
PeptideX!Tandem
Log (E_Value)
Elution Time
Predicted NET
R.AARPAKYSYVDENGETK.T -6.1 33.958 0.167
R.LVHGEEGLVAAKR.I -8.8 36.915 0.224
R.GIIKVGEEVEIVGIK.E -8.2 53.003 0.415
K.RFNDDGPILFIHTGGAPALFAYHPHV.- -7.3 62.583 0.519
K.KTGVLAQVQEALKGLDVR.E -11.6 62.803 0.438
R.KVAAQIPNGSTLFIDIGTTPEAVAHALLGHSNLR.I -8.9 73.961 0.589
R.TFAISPGHMNQLRAESIPEAVIAGASALVLTSYLVR.C -6.5 88.043 0.764
K. Petritis, L.J. Kangas, P.L. Ferguson, et al., Analytical Chemistry
2003, 75, 1039-1048. K. Petritis, L.J. Kangas, B. Yan, et al., Analytical Chemistry
2006, 78, 5026-5039.
Datasets Peptide
ID
Datasets PeakMatchingFeatures
Peptide
IDs
Deiso Find
Features
LC-MS/MS
Fractions
LC-MS Peak Lists
Proteins
Filter
DB
AMT tag Database Generation
High Throughput Proteomics Analysis
DetectedPeptides
Proteins
Digest
Peptides
Path
Normalize
Rollup
Plots
Alignment
Non-ID'd features
Downstream Analysis
0
0.2
0.4
0.6
0.8
1
20 40 60 80 100Elution Time (minutes)
Pre
dict
ed N
ET
y = 0.01081x -0.1829R2
= 0.95
Example: 506 unique peptides used for alignment; Log(E_Value) ≤
-6
Assembling an AMT tag DBAlign related datasets using elution times of observed peptides
One option: utilize NET prediction algorithm to create theoretical dataset to align against
NET prediction uses position and ordering of amino acid residues to predict normalized elution time
Alignment yields NET values based on observed elution timesObserved NET = Slope(Observed Elution Time) + Intercept
VKHPSEIVNVGDEINVKElution time: 44.923 minutesPredicted NET: 0.292Observed NET: 0.303
Datasets Peptide
ID
Datasets PeakMatchingFeatures
Peptide
IDs
Deiso Find
Features
LC-MS/MS
Fractions
LC-MS Peak Lists
Proteins
Filter
DB
AMT tag Database Generation
High Throughput Proteomics Analysis
DetectedPeptides
Proteins
Digest
Peptides
Path
Normalize
Rollup
Plots
Alignment
Non-ID'd features
Downstream Analysis
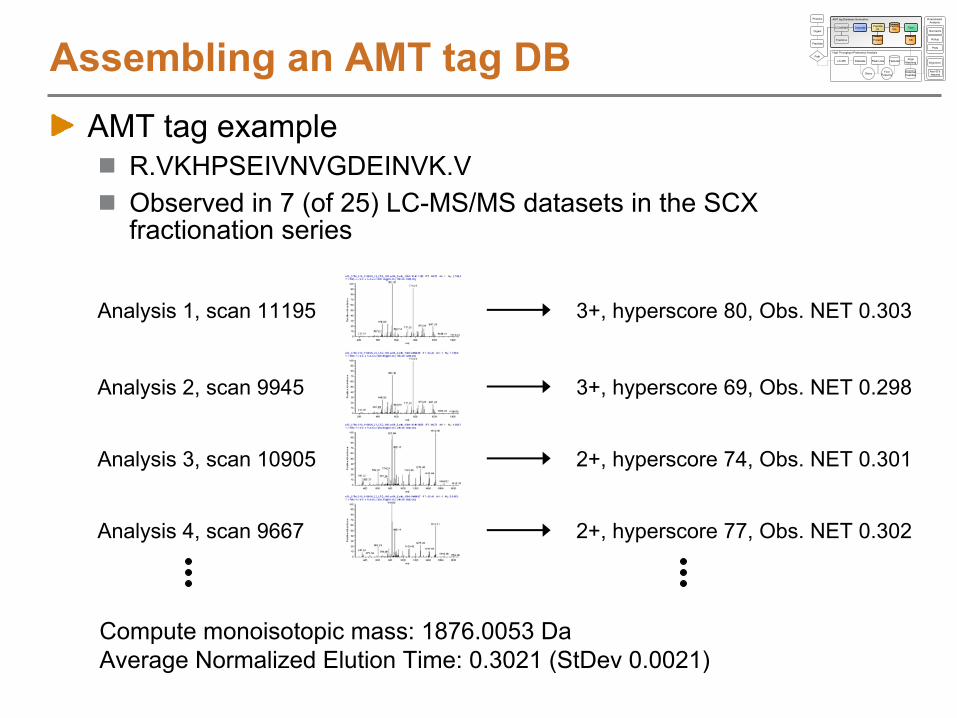
Assembling an AMT tag DBAMT tag example
R.VKHPSEIVNVGDEINVK.VObserved in 7 (of 25) LC-MS/MS datasets in the SCX fractionation series
Analysis 1, scan 11195 3+, hyperscore 80, Obs. NET 0.303
Compute monoisotopic mass: 1876.0053 Da
Average Normalized Elution Time: 0.3021 (StDev 0.0021)
Analysis 2, scan 9945 3+, hyperscore 69, Obs. NET 0.298
Analysis 3, scan 10905 2+, hyperscore 74, Obs. NET 0.301
Analysis 4, scan 9667 2+, hyperscore 77, Obs. NET 0.302
Datasets Peptide
ID
Datasets PeakMatchingFeatures
Peptide
IDs
Deiso Find
Features
LC-MS/MS
Fractions
LC-MS Peak Lists
Proteins
Filter
DB
AMT tag Database Generation
High Throughput Proteomics Analysis
DetectedPeptides
Proteins
Digest
Peptides
Path
Normalize
Rollup
Plots
Alignment
Non-ID'd features
Downstream Analysis

Assembling an AMT tag DBMass and Time Tag Database
Repository for AMT tagsMass, elution time, modified residues, and supporting information for each AMT tag
Allows samples of unknown composition to be matched quickly and efficiently, without needing to perform tandem MSAssembled by analyzing a control set of samples, cataloging each
peptide identification until subsequent analyses no longer provide new identifications
MT Tag ID PeptideLC-MS/MS Obs. Count
Calculated Monoisotopic
Mass
Average Observed
NET
Observed NET
StDev
1662039 MTGRELKPHDR 1 1338.6826 0.143 0.000
17683899 SSALNTLTNQK 3 1175.6146 0.235 0.005
36609588 HRDLLGATNP…TLR 5 1960.0602 0.379 0.002
36715875 WVKVDGWDN…FER 11 2590.2815 0.459 0.011
36843675 MYGHLKGEVA…QER 8 2533.2304 0.557 0.005
Datasets Peptide
ID
Datasets PeakMatchingFeatures
Peptide
IDs
Deiso Find
Features
LC-MS/MS
Fractions
LC-MS Peak Lists
Proteins
Filter
DB
AMT tag Database Generation
High Throughput Proteomics Analysis
DetectedPeptides
Proteins
Digest
Peptides
Path
Normalize
Rollup
Plots
Alignment
Non-ID'd features
Downstream Analysis

Assembling an AMT tag DBMini AMT tag DB
Database constructed from a relatively small number of datasetse.g. 25 SCX fractionation samples from S.
Typhimurium, each analyzed by LC-MS/MS and then by X!TandemProtein database: S_typhimurium_LT2_2004-09-19
4550 proteins and 1.4 million residues
>STM1834 putative YebN family transport protein (yebN) {Salmonella typhimurium LT2}
MFAGGSDVFNGYPGQDVVMHFTATVLLAFGMSMDAFAASIGKGATLHKPKFSEALRTGLI
FGAVETLTPLIGWGLGILASKFVLEWNHWIAFVLLIFLGGRMIIEGIRGGSDEDETPLRR
HSFWLLVTTAIATSLDAMAVGVGLAFLQVNIIATALAIGCATLIMSTLGMMIGRFIGPML
GKRAEILGGVVLIGIGVQILWTHFHG
>STM1835 23S rRNA m1G745 methyltransferase (rrmA) {Salmonella typhimurium LT2}
MSFTCPLCHQPLTQINNSVICPQRHQFDVAKEGYINLLPVQHKRSRDPGDSAEMMQARRA
FLDAGHYQPLRDAVINLLRERLDQSATAILDIGCGEGYYTHAFAEALPGVTTFGLDVAKT
AIKAAAKRYSQVKFCVASSHRLPFADASMDAVIRIYAPCKAQELARVVKPGGWVVTATPG
PHHLMELKGLIYDEVRLHAPYTEQLDGFTLQQSTRLAYHMQLTAEAAVALLQMTPFAWRA
RPDVWEQLAASAGLSCQTDFNLHLWQRNR
Datasets Peptide
ID
Datasets PeakMatchingFeatures
Peptide
IDs
Deiso Find
Features
LC-MS/MS
Fractions
LC-MS Peak Lists
Proteins
Filter
DB
AMT tag Database Generation
High Throughput Proteomics Analysis
DetectedPeptides
Proteins
Digest
Peptides
Path
Normalize
Rollup
Plots
Alignment
Non-ID'd features
Downstream Analysis
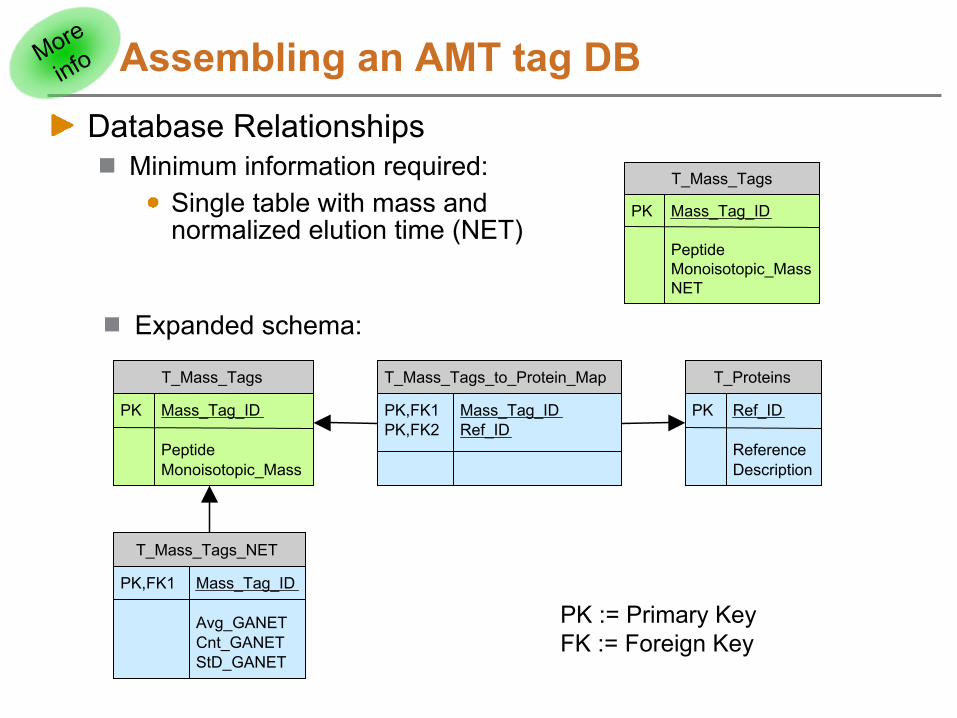
Assembling an AMT tag DBDatabase Relationships
Minimum information required:Single table with mass and normalized elution time (NET)
T_Mass_Tags
PK Mass_Tag_ID
PeptideMonoisotopic_MassNET
Expanded schema:
T_Proteins
PK Ref_ID
ReferenceDescription
T_Mass_Tags
PK Mass_Tag_ID
PeptideMonoisotopic_Mass
T_Mass_Tags_NET
PK,FK1 Mass_Tag_ID
Avg_GANETCnt_GANETStD_GANET
T_Mass_Tags_to_Protein_Map
PK,FK1 Mass_Tag_IDPK,FK2 Ref_ID
PK := Primary KeyFK := Foreign Key
More
info

Assembling an AMT tag DBMicrosoft Access DB Relationships
Full schema to track individual peptide observations
V_Filter_Set_Overview_Ex
Filter_TypeFilter_Set_IDExtra_InfoFilter_Set_NameFilter_Set_Description
T_Analysis_Description
PK Job
DatasetDataset_IDDataset_Created_DMSDataset_Acq_Time_StartDataset_Acq_Time_EndDataset_Scan_CountExperimentCampaignOrganismInstrument_ClassInstrumentAnalysis_ToolParameter_File_NameSettings_File_NameOrganism_DB_NameProtein_Collection_ListProtein_Options_ListCompletedResultTypeSeparation_Sys_TypeScanTime_NET_SlopeScanTime_NET_InterceptScanTime_NET_RSquaredScanTime_NET_Fit
T_Mass_Tags
PK Mass_Tag_ID
PeptideMonoisotopic_MassMultiple_ProteinsCreatedLast_AffectedNumber_Of_PeptidesPeptide_Obs_Count_Passing_FilterHigh_Normalized_ScoreHigh_Peptide_Prophet_ProbabilityMod_CountMod_DescriptionPMT_Quality_Score
T_Mass_Tags_NET
PK,FK1 Mass_Tag_ID
Min_GANETMax_GANETAvg_GANETCnt_GANETStD_GANETStdError_GANETPNET
T_Proteins
PK Ref_ID
ReferenceDescriptionProtein_SequenceProtein_Residue_CountMonoisotopic_MassProtein_Collection_IDLast_Affected
T_Mass_Tags_to_Protein_Map
PK,FK1 Mass_Tag_IDPK,FK2 Ref_ID
Mass_Tag_NameCleavage_StateFragment_NumberFragment_SpanResidue_StartResidue_EndRepeat_CountTerminus_StateMissed_Cleavage_Count
T_Peptides
PK Peptide_ID
FK1 Analysis_IDScan_NumberNumber_Of_ScansCharge_StateMHMultiple_ProteinsPeptide
FK2 Mass_Tag_IDGANET_ObsScan_Time_Peak_ApexPeak_AreaPeak_SN_Ratio
T_Score_Discriminant
PK,FK1 Peptide_ID
Peptide_Prophet_FScorePeptide_Prophet_Probability
T_Score_Sequest
PK,FK1 Peptide_ID
XCorrDelCnSpDelM
T_Score_XTandem
PK,FK1 Peptide_ID
HyperscoreLog_EValueDeltaCn2Y_ScoreY_IonsB_ScoreB_IonsDelMIntensityNormalized_Score
More
info
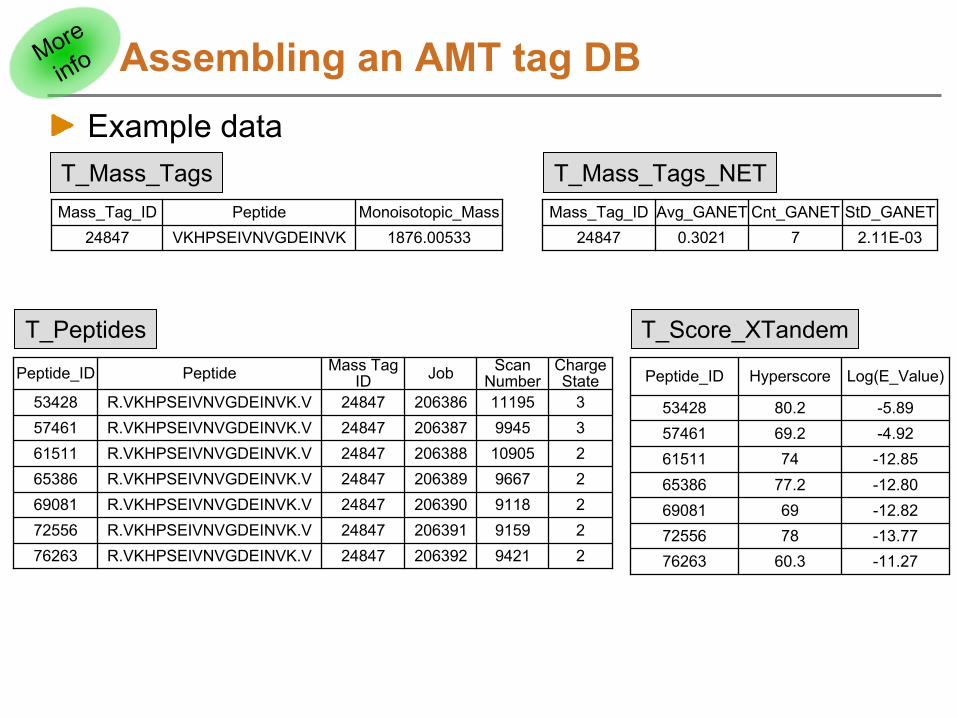
Assembling an AMT tag DBExample data
Mass_Tag_ID Peptide Monoisotopic_Mass24847 VKHPSEIVNVGDEINVK 1876.00533
Peptide_ID Peptide Mass Tag ID Job Scan
NumberCharge State
53428 R.VKHPSEIVNVGDEINVK.V 24847 206386 11195 357461 R.VKHPSEIVNVGDEINVK.V 24847 206387 9945 361511 R.VKHPSEIVNVGDEINVK.V 24847 206388 10905 265386 R.VKHPSEIVNVGDEINVK.V 24847 206389 9667 269081 R.VKHPSEIVNVGDEINVK.V 24847 206390 9118 272556 R.VKHPSEIVNVGDEINVK.V 24847 206391 9159 276263 R.VKHPSEIVNVGDEINVK.V 24847 206392 9421 2
Peptide_ID Hyperscore Log(E_Value)
53428 80.2 -5.8957461 69.2 -4.9261511 74 -12.8565386 77.2 -12.8069081 69 -12.8272556 78 -13.7776263 60.3 -11.27
Mass_Tag_ID Avg_GANET Cnt_GANET StD_GANET24847 0.3021 7 2.11E-03
T_Mass_Tags_NETT_Mass_Tags
T_Peptides T_Score_XTandem
More
info

Assembling an AMT tag DBProcessing steps
Thermo-Finnigan LTQ .Raw files
MS/MS spectra files
Convert to .Dta files or single _Dta.txt file using DeconMSn.exe. DeconMSn is similar to Thermo’s Extract_MSn but has better support for data from LTQ-Orbitrap or LTQ-FT instruments.
Peptide ID Results
Process _Dta.txt file with X!Tandem or .Dta files with SEQUEST. Use the Peptide File Extractor to convert SEQUEST .Out files to Synopsis (_Syn.txt) files.
Tab delimited text files
Convert X!Tandem .XML output files or SEQUEST _Syn.txt file to tab-delimited files using the Peptide Hit Results Processor (PHRP) application.
Summarized result files
Microsoft Access DB
Align datasets using the MTDB Creator application
Load into database using MTDB Creator
Datasets Peptide
ID
Datasets PeakMatchingFeatures
Peptide
IDs
Deiso Find
Features
LC-MS/MS
Fractions
LC-MS Peak Lists
Proteins
Filter
DB
AMT tag Database Generation
High Throughput Proteomics Analysis
DetectedPeptides
Proteins
Digest
Peptides
Path
Normalize
Rollup
Plots
Alignment
Non-ID'd features
Downstream Analysis

DeconMSnDetermines the monoisotopic mass and charge state of each parent ion chosen for fragmentation on a hybrid LC-
MS/MS instrument using Decon2LS algorithmsReplacement for the Extract_MSn.exe tool provided with SEQUEST and Bioworks
Datasets Peptide
ID
Datasets PeakMatchingFeatures
Peptide
IDs
Deiso Find
Features
LC-MS/MS
Fractions
LC-MS Peak Lists
Proteins
Filter
DB
AMT tag Database Generation
High Throughput Proteomics Analysis
DetectedPeptides
Proteins
Digest
Peptides
Path
Normalize
Rollup
Plots
Alignment
Non-ID'd features
Downstream Analysis
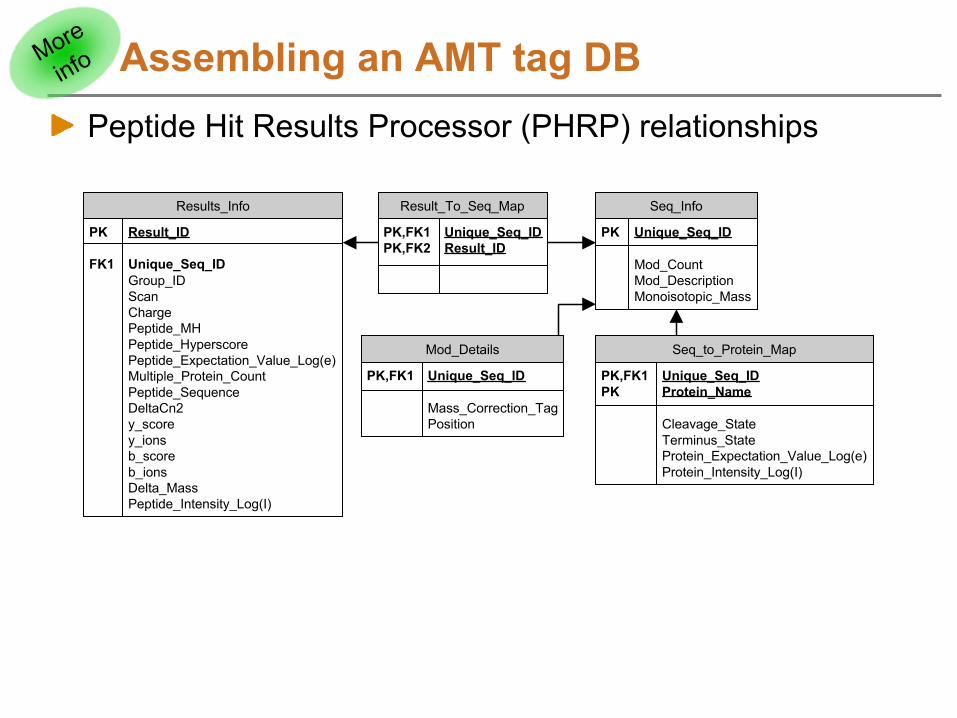
Assembling an AMT tag DBPeptide Hit Results Processor (PHRP) relationships
Results_Info
PK Result_ID
FK1 Unique_Seq_IDGroup_IDScanChargePeptide_MHPeptide_HyperscorePeptide_Expectation_Value_Log(e)Multiple_Protein_CountPeptide_SequenceDeltaCn2y_scorey_ionsb_scoreb_ionsDelta_MassPeptide_Intensity_Log(I)
Result_To_Seq_Map
PK,FK1 Unique_Seq_IDPK,FK2 Result_ID
Seq_Info
PK Unique_Seq_ID
Mod_CountMod_DescriptionMonoisotopic_Mass
Mod_Details
PK,FK1 Unique_Seq_ID
Mass_Correction_TagPosition
Seq_to_Protein_Map
PK,FK1 Unique_Seq_IDPK Protein_Name
Cleavage_StateTerminus_StateProtein_Expectation_Value_Log(e)Protein_Intensity_Log(I)
More
info
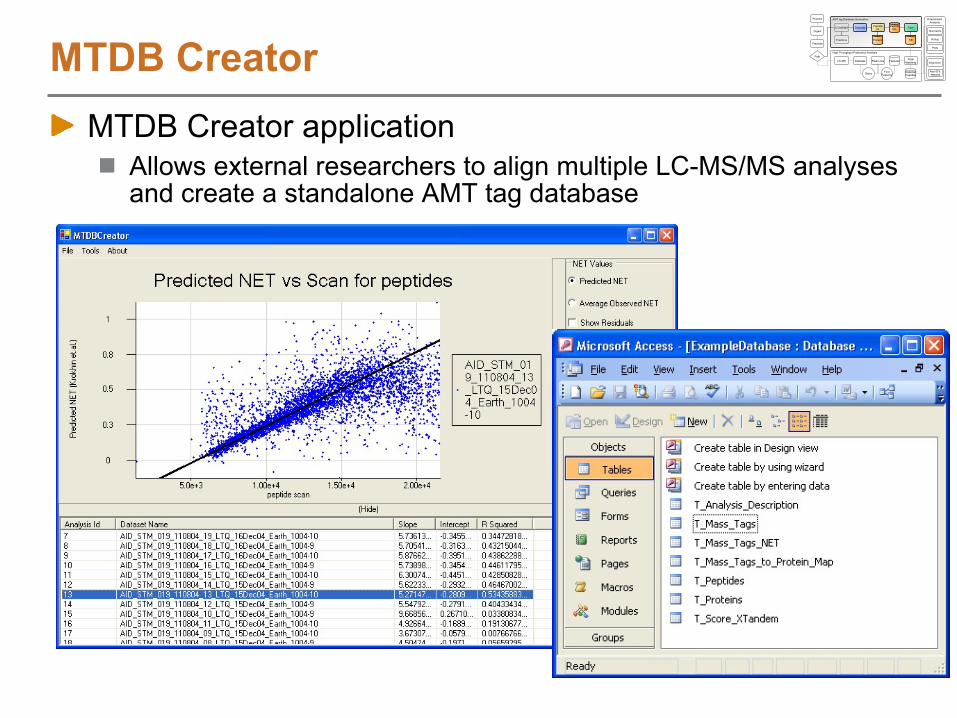
MTDB CreatorMTDB Creator application
Allows external researchers to align multiple LC-MS/MS analyses and create a standalone AMT tag database
Datasets Peptide
ID
Datasets PeakMatchingFeatures
Peptide
IDs
Deiso Find
Features
LC-MS/MS
Fractions
LC-MS Peak Lists
Proteins
Filter
DB
AMT tag Database Generation
High Throughput Proteomics Analysis
DetectedPeptides
Proteins
Digest
Peptides
Path
Normalize
Rollup
Plots
Alignment
Non-ID'd features
Downstream Analysis
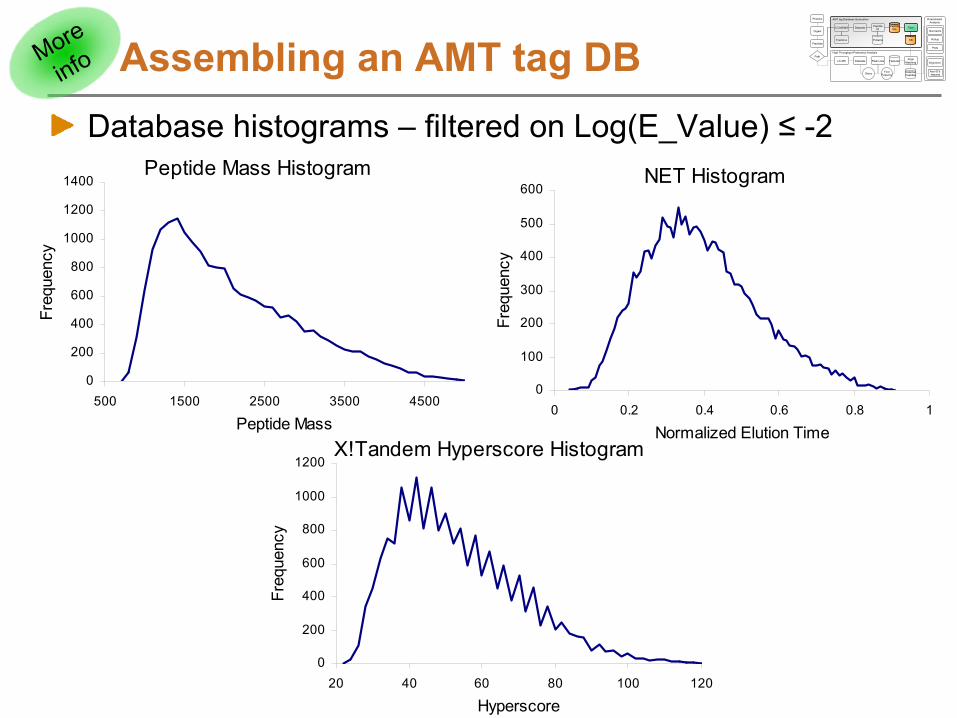
Assembling an AMT tag DBDatabase histograms –
filtered on Log(E_Value) ≤
-2
Peptide Mass Histogram
0
200
400
600
800
1000
1200
1400
500 1500 2500 3500 4500
Peptide Mass
Freq
uenc
y
NET Histogram
0
100
200
300
400
500
600
0 0.2 0.4 0.6 0.8 1
Normalized Elution Time
Freq
uenc
y
X!Tandem Hyperscore Histogram
0
200
400
600
800
1000
1200
20 40 60 80 100 120
Hyperscore
Freq
uenc
y
More
info
Datasets Peptide
ID
Datasets PeakMatchingFeatures
Peptide
IDs
Deiso Find
Features
LC-MS/MS
Fractions
LC-MS Peak Lists
Proteins
Filter
DB
AMT tag Database Generation
High Throughput Proteomics Analysis
DetectedPeptides
Proteins
Digest
Peptides
Path
Normalize
Rollup
Plots
Alignment
Non-ID'd features
Downstream Analysis

0
5000
10000
15000
20000
0 5 10 15 20 25Dataset Count
Pep
tide
Cou
nt
0
15000
30000
45000
60000
0 100 200 300 400 500 600Dataset Count
Pep
tide
Cou
nt
AMT tag DB Growth TrendTrend for Mini AMT tag DB
25 SCX fractionation datasets of a single growth condition
Trend for Mature AMT tag DB
521 different samples from several
different growth conditionsSlope of curve decreases as more datasets are added and as fewer new peptides are seen
Filtered on Log(E_Value) ≤
-2
Filtered on Peptide Prophet Probability
≥
0.99
Datasets Peptide
ID
Datasets PeakMatchingFeatures
Peptide
IDs
Deiso Find
Features
LC-MS/MS
Fractions
LC-MS Peak Lists
Proteins
Filter
DB
AMT tag Database Generation
High Throughput Proteomics Analysis
DetectedPeptides
Proteins
Digest
Peptides
Path
Normalize
Rollup
Plots
Alignment
Non-ID'd features
Downstream Analysis
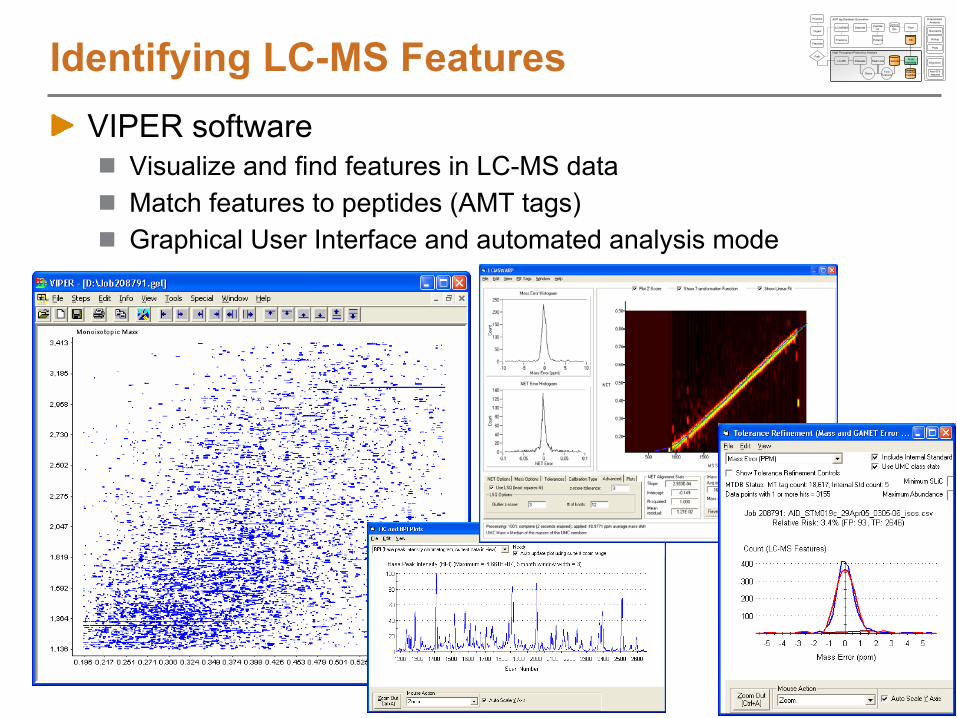
Identifying LC-MS FeaturesVIPER software
Visualize and find features in LC-MS dataMatch features to peptides (AMT tags)Graphical User Interface and automated analysis mode
Datasets Peptide
ID
Datasets PeakMatchingFeatures
Peptide
IDs
Deiso Find
Features
LC-MS/MS
Fractions
LC-MS Peak Lists
Proteins
Filter
DB
AMT tag Database Generation
High Throughput Proteomics Analysis
DetectedPeptides
Proteins
Digest
Peptides
Path
Normalize
Rollup
Plots
Alignment
Non-ID'd features
Downstream Analysis

Peak Matching StepsLoad LC-MS peak lists from Decon2LSFilter dataFeature definition over elution timeSelect AMT tags to match againstOptionally, find paired features (e.g. 16O/18O pairs)Align LC-MS features to AMT tags using LCMSWarpBroad AMT tag DB searchSearch tolerance refinementFinal AMT tag DB searchReport results
Identifying LC-MS FeaturesDatasets Peptide
ID
Datasets PeakMatchingFeatures
Peptide
IDs
Deiso Find
Features
LC-MS/MS
Fractions
LC-MS Peak Lists
Proteins
Filter
DB
AMT tag Database Generation
High Throughput Proteomics Analysis
DetectedPeptides
Proteins
Digest
Peptides
Path
Normalize
Rollup
Plots
Alignment
Non-ID'd features
Downstream Analysis

AMT tag database selection
Identifying LC-MS Features
Connect to mass tag system (MTS) if inside PNNL or use standalone Microsoft Access DB
Datasets Peptide
ID
Datasets PeakMatchingFeatures
Peptide
IDs
Deiso Find
Features
LC-MS/MS
Fractions
LC-MS Peak Lists
Proteins
Filter
DB
AMT tag Database Generation
High Throughput Proteomics Analysis
DetectedPeptides
Proteins
Digest
Peptides
Path
Normalize
Rollup
Plots
Alignment
Non-ID'd features
Downstream Analysis
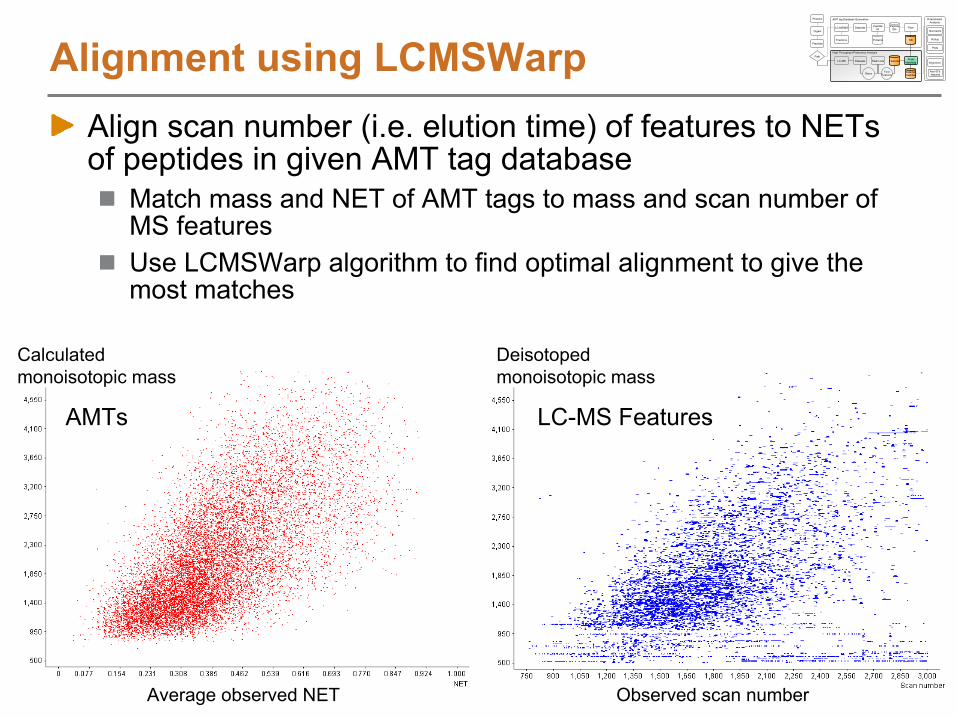
Alignment using LCMSWarp
Calculated monoisotopic mass
Average observed NET
AMTs
Deisotoped monoisotopic mass
Observed scan number
LC-MS Features
Align scan number (i.e. elution time) of features to NETs of peptides in given AMT tag database
Match mass and NET of AMT tags to mass and scan number of MS featuresUse LCMSWarp algorithm to find optimal alignment to give the most matches
Datasets Peptide
ID
Datasets PeakMatchingFeatures
Peptide
IDs
Deiso Find
Features
LC-MS/MS
Fractions
LC-MS Peak Lists
Proteins
Filter
DB
AMT tag Database Generation
High Throughput Proteomics Analysis
DetectedPeptides
Proteins
Digest
Peptides
Path
Normalize
Rollup
Plots
Alignment
Non-ID'd features
Downstream Analysis

Scan number
Alig
nmen
t S
core Best score = 0.00681
Scan = 1113
Shift = 113
Alignment using LCMSWarp
N. Jaitly, M.E. Monroe et. al., Analytical Chemistry
2006, 78, 7397-7409.
LCMSWarp computes a similarity score from conserved local mass and retention time patterns
Datasets Peptide
ID
Datasets PeakMatchingFeatures
Peptide
IDs
Deiso Find
Features
LC-MS/MS
Fractions
LC-MS Peak Lists
Proteins
Filter
DB
AMT tag Database Generation
High Throughput Proteomics Analysis
DetectedPeptides
Proteins
Digest
Peptides
Path
Normalize
Rollup
Plots
Alignment
Non-ID'd features
Downstream Analysis
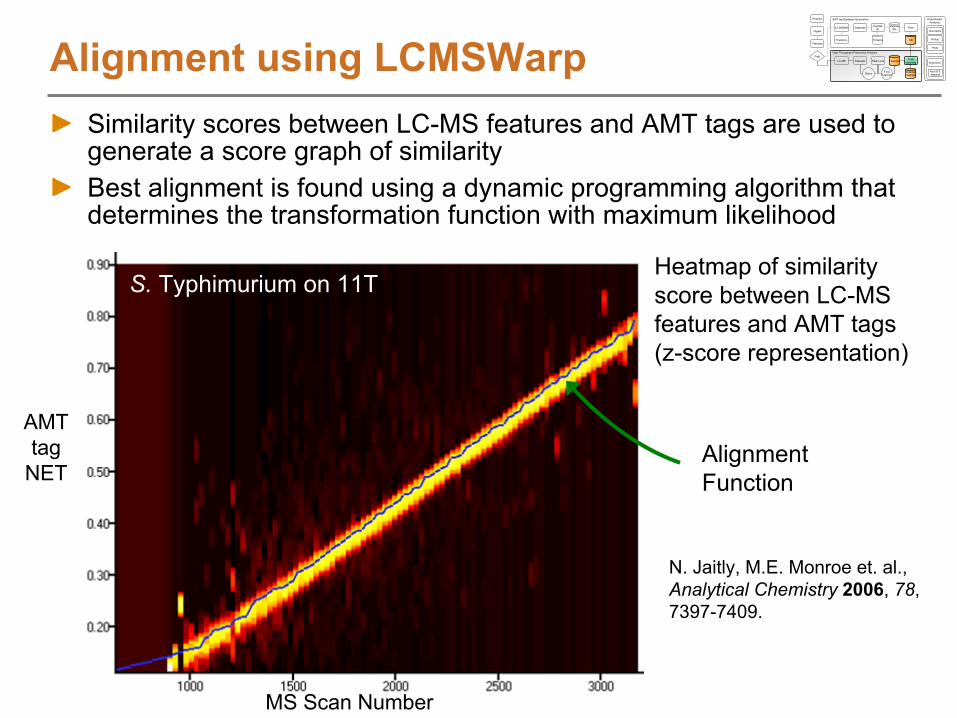
Alignment Function
Heatmap of similarity score between LC-MS features and AMT tags (z-score representation)
Alignment using LCMSWarpSimilarity scores between LC-MS features and AMT tags are used to generate a score graph of similarityBest alignment is found using a dynamic programming algorithm that determines the transformation function with maximum likelihood
AMT tag
NET
MS Scan Number
S. Typhimurium on 11T
N. Jaitly, M.E. Monroe et. al., Analytical Chemistry
2006, 78, 7397-7409.
Datasets Peptide
ID
Datasets PeakMatchingFeatures
Peptide
IDs
Deiso Find
Features
LC-MS/MS
Fractions
LC-MS Peak Lists
Proteins
Filter
DB
AMT tag Database Generation
High Throughput Proteomics Analysis
DetectedPeptides
Proteins
Digest
Peptides
Path
Normalize
Rollup
Plots
Alignment
Non-ID'd features
Downstream Analysis

Alignment using LCMSWarpTransformation function is used to convert from scan number to NET
Features centered at same scan number get the same obs. NET valueWhen matching LC-MS features to AMTs, we will search +/-
a NET tolerance, which effectively allows for LC-MS features to shift around a little in elution time
LC-MS Feature
Scan
Matching
AMT tag
NET
LC-MS Feature
NET1011 0.1519 0.15691019 0.1626 0.15891019 0.1507 0.15891021 0.1653 0.15941027 0.1509 0.16091037 0.1519 0.16331042 0.183 0.16451055 0.1652 0.16771056 0.1862 0.16791056 0.1697 0.16791056 0.1682 0.1679 0
0.10.20.30.40.50.60.70.80.9
750 1250 1750 2250 2750 3250LC-MS Feature Scan
LC-M
S F
eatu
re N
ET
Datasets Peptide
ID
Datasets PeakMatchingFeatures
Peptide
IDs
Deiso Find
Features
LC-MS/MS
Fractions
LC-MS Peak Lists
Proteins
Filter
DB
AMT tag Database Generation
High Throughput Proteomics Analysis
DetectedPeptides
Proteins
Digest
Peptides
Path
Normalize
Rollup
Plots
Alignment
Non-ID'd features
Downstream Analysis
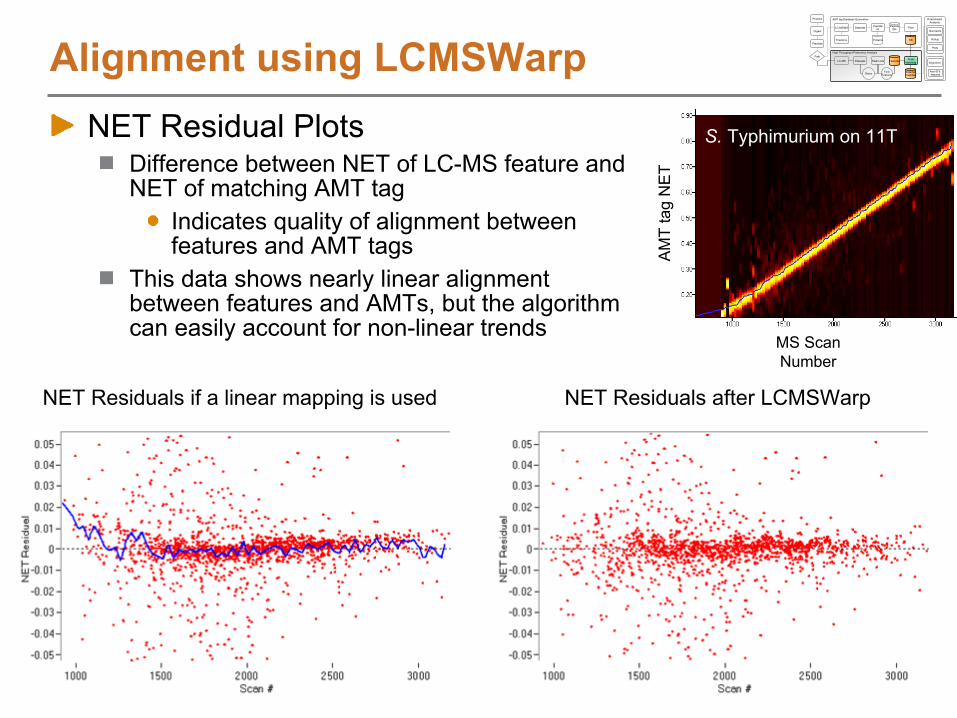
Alignment using LCMSWarpNET Residual Plots
Difference between NET of LC-MS feature and NET of matching AMT tag
Indicates quality of alignment between features and AMT tags
This data shows nearly linear alignment between features and AMTs, but the algorithm can easily account for non-linear trends
NET Residuals if a linear mapping is used NET Residuals after LCMSWarp
AM
T ta
g N
ET
MS Scan Number
S. Typhimurium on 11T
Datasets Peptide
ID
Datasets PeakMatchingFeatures
Peptide
IDs
Deiso Find
Features
LC-MS/MS
Fractions
LC-MS Peak Lists
Proteins
Filter
DB
AMT tag Database Generation
High Throughput Proteomics Analysis
DetectedPeptides
Proteins
Digest
Peptides
Path
Normalize
Rollup
Plots
Alignment
Non-ID'd features
Downstream Analysis
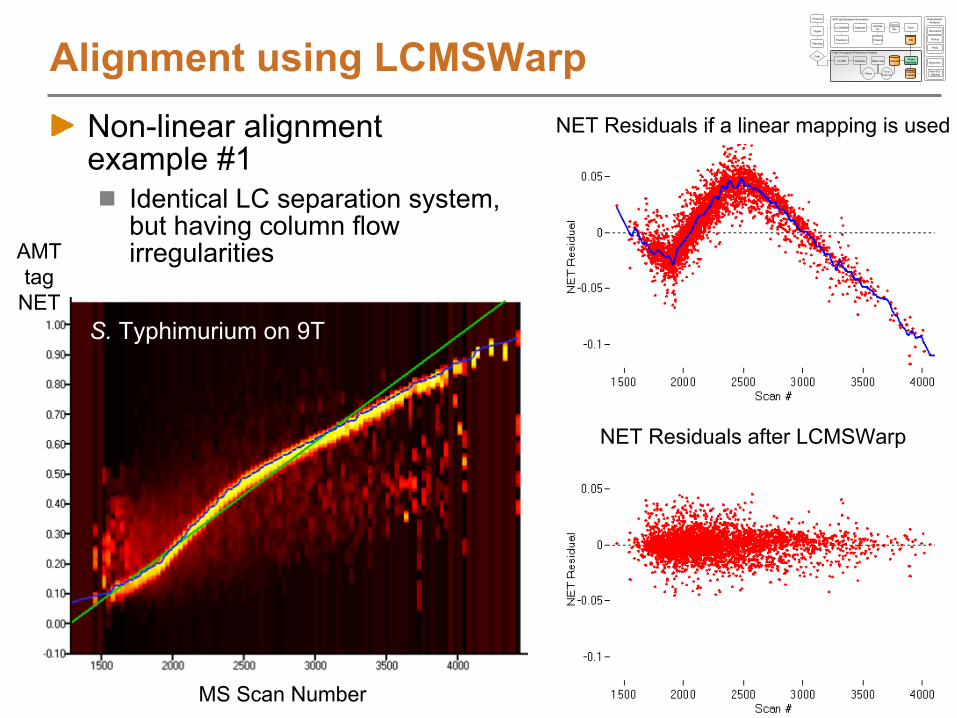
Non-linear alignment example #1
Identical LC separation system, but having column flow irregularities
Alignment using LCMSWarp
AMT tag
NET
MS Scan Number
S. Typhimurium on 9T
NET Residuals after LCMSWarp
NET Residuals if a linear mapping is used
Datasets Peptide
ID
Datasets PeakMatchingFeatures
Peptide
IDs
Deiso Find
Features
LC-MS/MS
Fractions
LC-MS Peak Lists
Proteins
Filter
DB
AMT tag Database Generation
High Throughput Proteomics Analysis
DetectedPeptides
Proteins
Digest
Peptides
Path
Normalize
Rollup
Plots
Alignment
Non-ID'd features
Downstream Analysis
Non-linear alignment example #2
AMT tag DB from C18
LC-MS/MS analyses using ISCO-based LC (exponential dilution
gradient)LC-MS analysis used C18
LC-MS via Agilent linear gradient
pump
Alignment using LCMSWarp
NET Residuals after LCMSWarp
NET Residuals if a linear mapping is used
S. oneidensis
on LTQ-Orbitrap
Datasets Peptide
ID
Datasets PeakMatchingFeatures
Peptide
IDs
Deiso Find
Features
LC-MS/MS
Fractions
LC-MS Peak Lists
Proteins
Filter
DB
AMT tag Database Generation
High Throughput Proteomics Analysis
DetectedPeptides
Proteins
Digest
Peptides
Path
Normalize
Rollup
Plots
Alignment
Non-ID'd features
Downstream Analysis
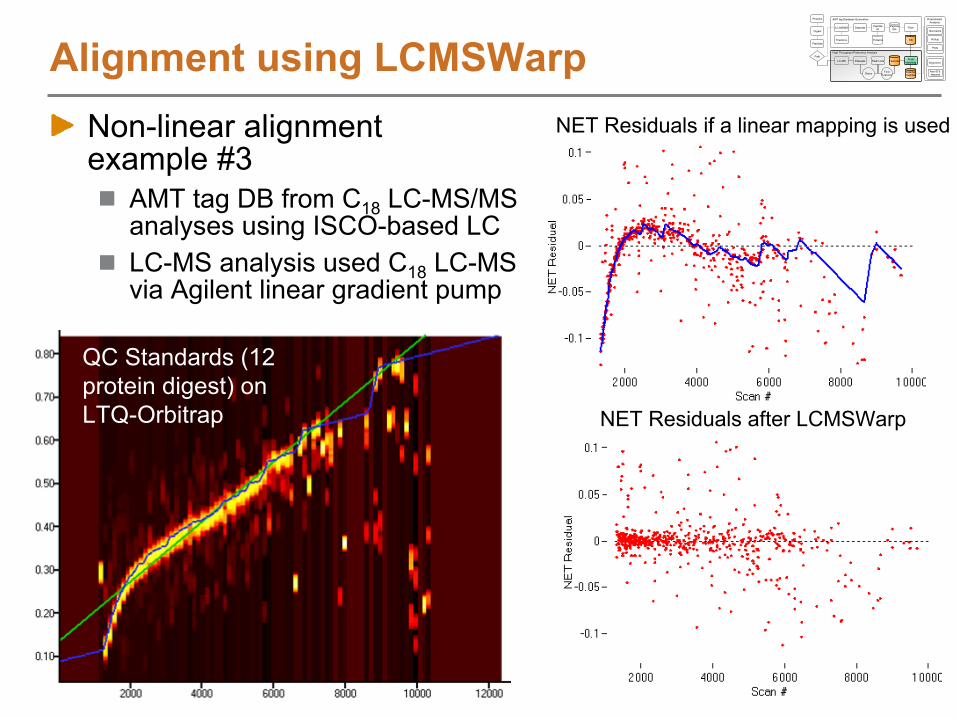
Non-linear alignment example #3
AMT tag DB from C18
LC-MS/MS analyses using ISCO-based LCLC-MS analysis used C18
LC-MS via Agilent linear gradient pump
Alignment using LCMSWarp
NET Residuals after LCMSWarp
NET Residuals if a linear mapping is used
QC Standards (12 protein digest) on LTQ-Orbitrap
Datasets Peptide
ID
Datasets PeakMatchingFeatures
Peptide
IDs
Deiso Find
Features
LC-MS/MS
Fractions
LC-MS Peak Lists
Proteins
Filter
DB
AMT tag Database Generation
High Throughput Proteomics Analysis
DetectedPeptides
Proteins
Digest
Peptides
Path
Normalize
Rollup
Plots
Alignment
Non-ID'd features
Downstream Analysis
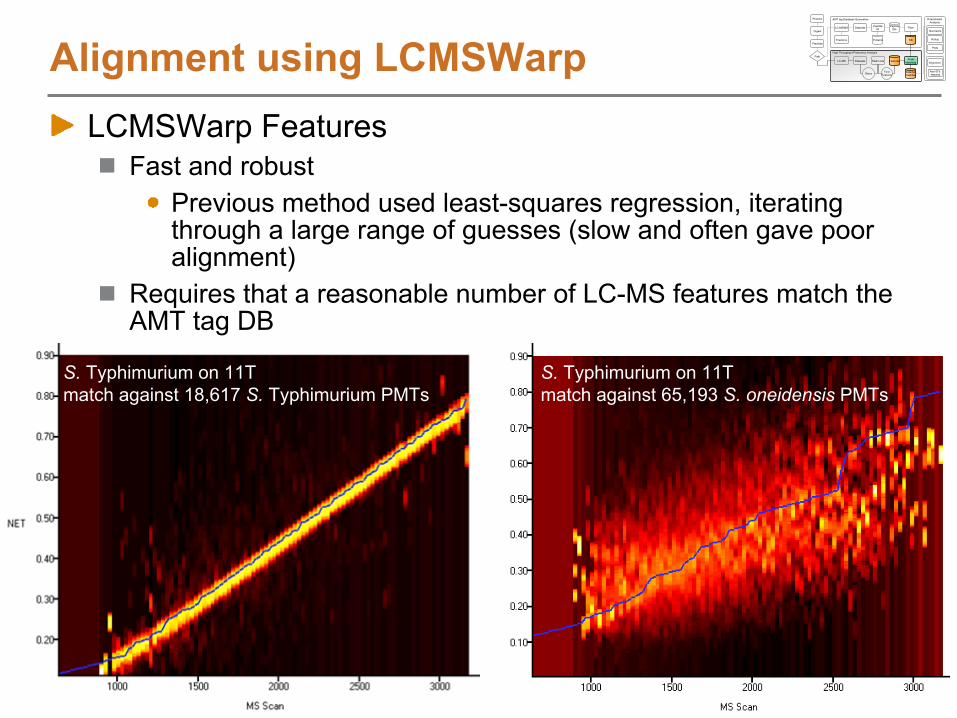
Alignment using LCMSWarpLCMSWarp Features
Fast and robustPrevious method used least-squares regression, iterating through a large range of guesses (slow and often gave poor alignment)
Requires that a reasonable number of LC-MS features match the AMT tag DB
S. Typhimurium on 11Tmatch against 18,617 S. Typhimurium PMTs
S. Typhimurium on 11Tmatch against 65,193 S. oneidensis
PMTs
Datasets Peptide
ID
Datasets PeakMatchingFeatures
Peptide
IDs
Deiso Find
Features
LC-MS/MS
Fractions
LC-MS Peak Lists
Proteins
Filter
DB
AMT tag Database Generation
High Throughput Proteomics Analysis
DetectedPeptides
Proteins
Digest
Peptides
Path
Normalize
Rollup
Plots
Alignment
Non-ID'd features
Downstream Analysis
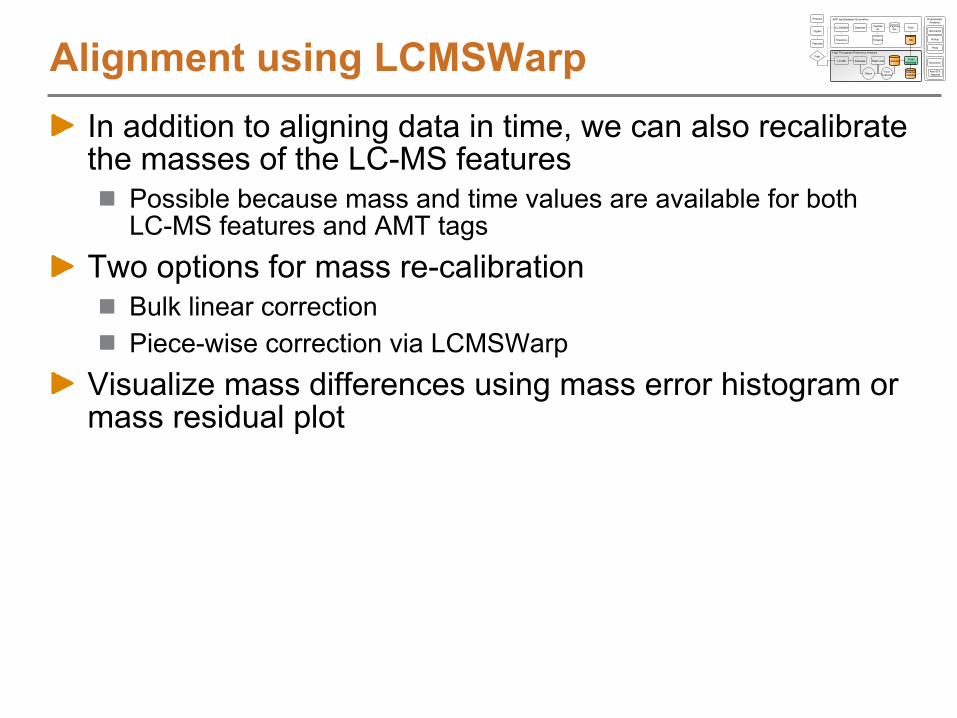
Alignment using LCMSWarpIn addition to aligning data in time, we can also recalibrate the masses of the LC-MS features
Possible because mass and time values are available for both LC-MS features and AMT tags
Two options for mass re-calibrationBulk linear correctionPiece-wise correction via LCMSWarp
Visualize mass differences using mass error histogram or mass residual plot
Datasets Peptide
ID
Datasets PeakMatchingFeatures
Peptide
IDs
Deiso Find
Features
LC-MS/MS
Fractions
LC-MS Peak Lists
Proteins
Filter
DB
AMT tag Database Generation
High Throughput Proteomics Analysis
DetectedPeptides
Proteins
Digest
Peptides
Path
Normalize
Rollup
Plots
Alignment
Non-ID'd features
Downstream Analysis

Match TolerancesMass: ±25 ppm
NET: ±0.05 NET
Mass Error HistogramList of binned mass error values
Difference between feature's mass and matching AMT tag's massBin values to generate a histogramTypically observe background false positive level
LC-MS Feature
Mass (Da)
AMT tag Mass (Da)
Delta Mass (Da)
Mass Error (ppm)
1570.9005 1570.883 0.01745 11.11571.74325 1571.726 0.01770 11.31571.8498 1571.831 0.01912 12.21571.9107 1571.892 0.01848 11.81573.8381 1573.832 0.00569 3.6
100
200
300
400
-10 0 10 20
Count (LC-MS Features)
Mass Error (ppm)
Likely false positive
identifications
Likely true positive
identifications
Datasets Peptide
ID
Datasets PeakMatchingFeatures
Peptide
IDs
Deiso Find
Features
LC-MS/MS
Fractions
LC-MS Peak Lists
Proteins
Filter
DB
AMT tag Database Generation
High Throughput Proteomics Analysis
DetectedPeptides
Proteins
Digest
Peptides
Path
Normalize
Rollup
Plots
Alignment
Non-ID'd features
Downstream Analysis
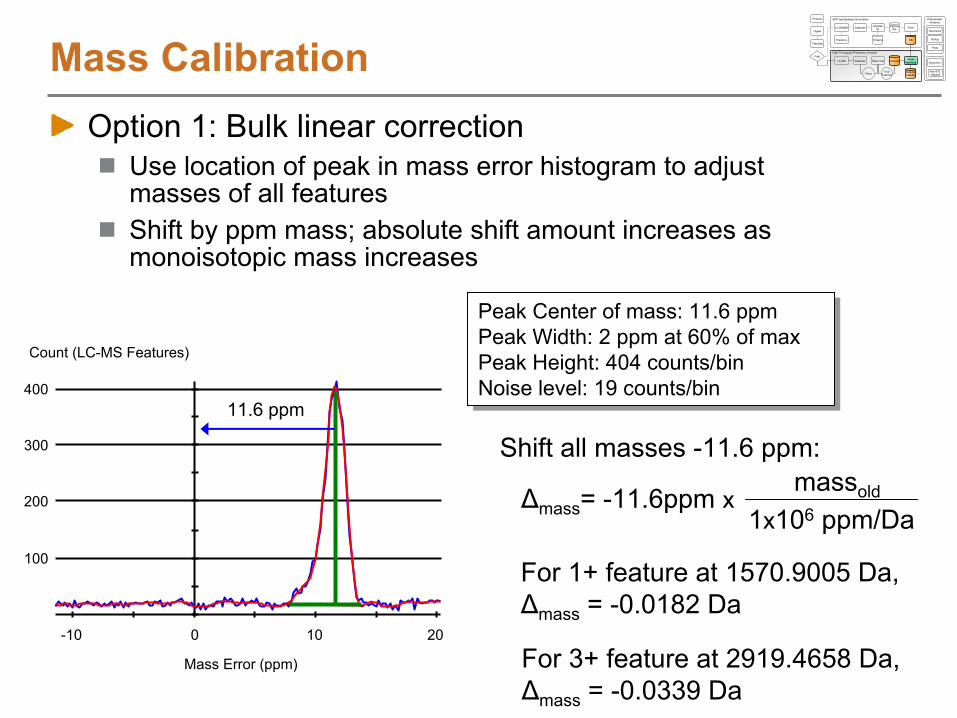
Option 1: Bulk linear correctionUse location of peak in mass error histogram to adjust masses of all featuresShift by ppm mass; absolute shift amount increases as monoisotopic mass increases
Shift all masses -11.6 ppm:
Δmass
= -11.6ppm x massold
1x10⁶
ppm/Da
For 1+ feature at 1570.9005 Da,
Δmass
= -0.0182 Da
For 3+ feature at 2919.4658 Da,
Δmass
= -0.0339 Da
Mass Calibration
100
200
300
400
-10 0 10 20
Count (LC-MS Features)
Mass Error (ppm)
Peak Center of mass: 11.6 ppmPeak Width: 2 ppm at 60% of maxPeak Height: 404 counts/binNoise level: 19 counts/bin
Peak Center of mass: 11.6 ppmPeak Width: 2 ppm at 60% of maxPeak Height: 404 counts/binNoise level: 19 counts/bin
11.6 ppm
Datasets Peptide
ID
Datasets PeakMatchingFeatures
Peptide
IDs
Deiso Find
Features
LC-MS/MS
Fractions
LC-MS Peak Lists
Proteins
Filter
DB
AMT tag Database Generation
High Throughput Proteomics Analysis
DetectedPeptides
Proteins
Digest
Peptides
Path
Normalize
Rollup
Plots
Alignment
Non-ID'd features
Downstream Analysis

Mass Calibration
MS Scan Number
Mass Residual
Mass Error (ppm) vs. Scan Number
Option 2: Piece-wise correction via LCMSWarpUse smoothing splines to determine a smooth calibration curve which is a function of scan number
Mass Error (ppm) vs. Scan Number after correction
MS Scan Number
S. Typhimurium on 11T
Datasets Peptide
ID
Datasets PeakMatchingFeatures
Peptide
IDs
Deiso Find
Features
LC-MS/MS
Fractions
LC-MS Peak Lists
Proteins
Filter
DB
AMT tag Database Generation
High Throughput Proteomics Analysis
DetectedPeptides
Proteins
Digest
Peptides
Path
Normalize
Rollup
Plots
Alignment
Non-ID'd features
Downstream Analysis
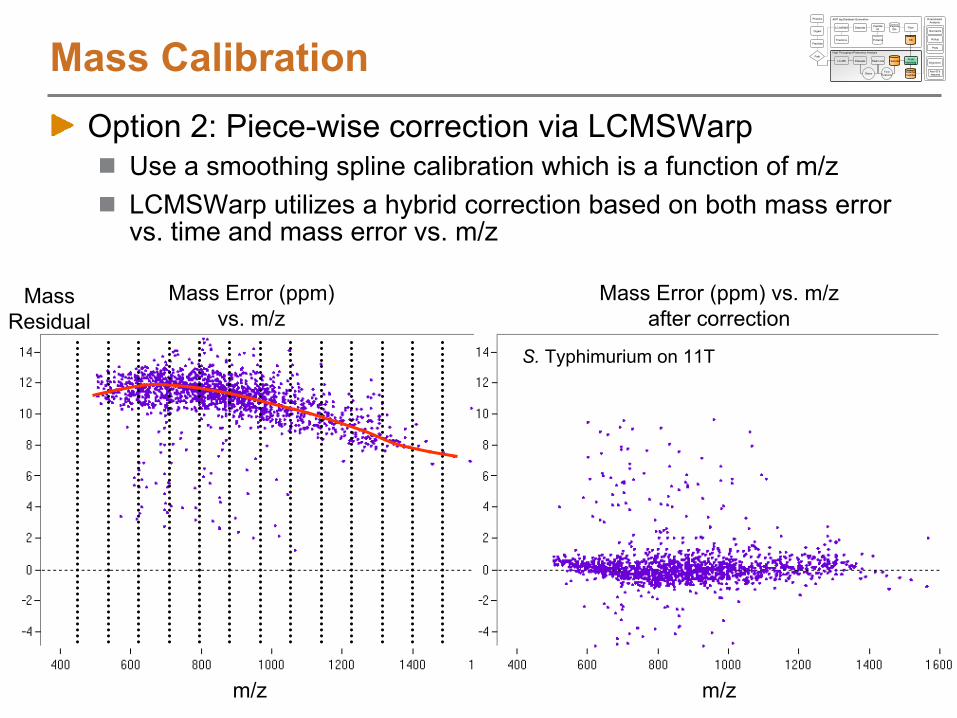
Mass Calibration
Mass Error (ppm) vs. m/z
m/z
Mass Residual
Option 2: Piece-wise correction via LCMSWarpUse a smoothing spline calibration which is a function of m/zLCMSWarp utilizes a hybrid correction based on both mass error vs. time and mass error vs. m/z
Mass Error (ppm) vs. m/z
after correction
m/z
S. Typhimurium on 11T
Datasets Peptide
ID
Datasets PeakMatchingFeatures
Peptide
IDs
Deiso Find
Features
LC-MS/MS
Fractions
LC-MS Peak Lists
Proteins
Filter
DB
AMT tag Database Generation
High Throughput Proteomics Analysis
DetectedPeptides
Proteins
Digest
Peptides
Path
Normalize
Rollup
Plots
Alignment
Non-ID'd features
Downstream Analysis
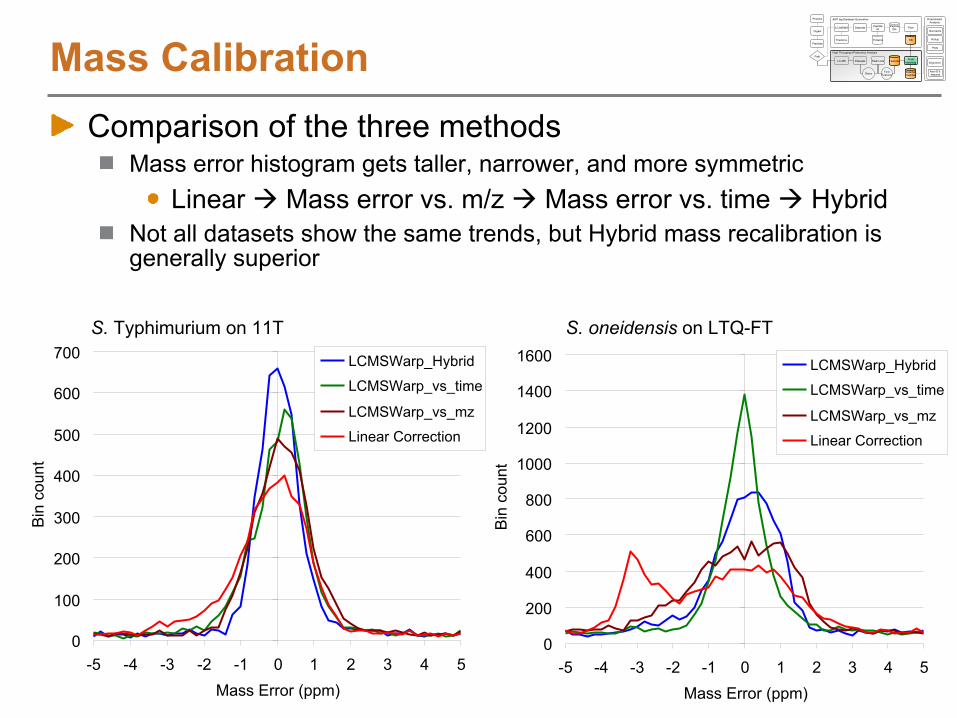
Mass CalibrationComparison of the three methods
Mass error histogram gets taller, narrower, and more symmetricLinear Mass error vs. m/z Mass error vs. time Hybrid
Not all datasets show the same trends, but Hybrid mass recalibration is generally superior
0
100
200
300
400
500
600
700
-5 -4 -3 -2 -1 0 1 2 3 4 5Mass Error (ppm)
Bin
cou
nt
LCMSWarp_Hybrid
LCMSWarp_vs_time
LCMSWarp_vs_mz
Linear Correction
S. Typhimurium on 11T
0
200
400
600
800
1000
1200
1400
1600
-5 -4 -3 -2 -1 0 1 2 3 4 5Mass Error (ppm)
Bin
cou
nt
LCMSWarp_Hybrid
LCMSWarp_vs_time
LCMSWarp_vs_mz
Linear Correction
S. oneidensis
on LTQ-FT
Datasets Peptide
ID
Datasets PeakMatchingFeatures
Peptide
IDs
Deiso Find
Features
LC-MS/MS
Fractions
LC-MS Peak Lists
Proteins
Filter
DB
AMT tag Database Generation
High Throughput Proteomics Analysis
DetectedPeptides
Proteins
Digest
Peptides
Path
Normalize
Rollup
Plots
Alignment
Non-ID'd features
Downstream Analysis
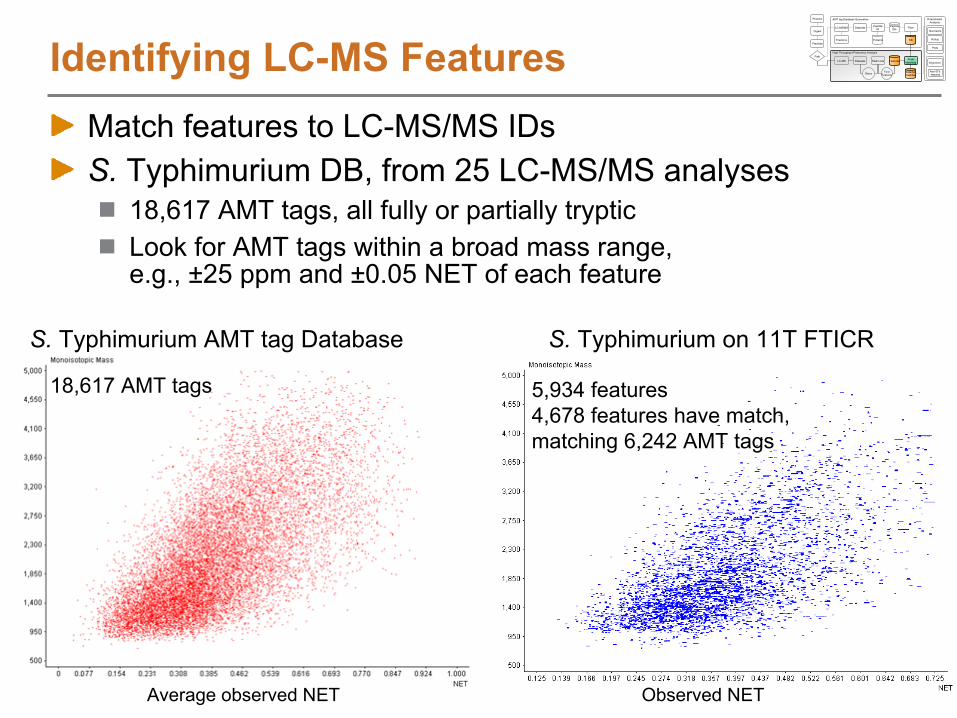
Identifying LC-MS FeaturesMatch features to LC-MS/MS IDsS. Typhimurium DB, from 25 LC-MS/MS analyses
18,617 AMT tags, all fully or partially trypticLook for AMT tags within a broad mass range, e.g., ±25 ppm and ±0.05 NET of each feature
Average observed NET
S. Typhimurium on 11T FTICRS. Typhimurium AMT tag Database
18,617 AMT tags 5,934 features5,934 features4,678 features have match,matching 6,242 AMT tags
Observed NET
Datasets Peptide
ID
Datasets PeakMatchingFeatures
Peptide
IDs
Deiso Find
Features
LC-MS/MS
Fractions
LC-MS Peak Lists
Proteins
Filter
DB
AMT tag Database Generation
High Throughput Proteomics Analysis
DetectedPeptides
Proteins
Digest
Peptides
Path
Normalize
Rollup
Plots
Alignment
Non-ID'd features
Downstream Analysis

Search Tolerance RefinementCan use mass error and NET error histograms to determine optimal search tolerances
Examine distribution of errors to determine optimal tolerance using expectation maximization algorithm
Examine distribution of errors to determine optimal tolerance using expectation maximization algorithm
±1.76 ppm
Datasets Peptide
ID
Datasets PeakMatchingFeatures
Peptide
IDs
Deiso Find
Features
LC-MS/MS
Fractions
LC-MS Peak Lists
Proteins
Filter
DB
AMT tag Database Generation
High Throughput Proteomics Analysis
DetectedPeptides
Proteins
Digest
Peptides
Path
Normalize
Rollup
Plots
Alignment
Non-ID'd features
Downstream Analysis

Repeat search with final search tolerances5,934 features
Identifying LC-MS Features
Observed NET
Datasets Peptide
ID
Datasets PeakMatchingFeatures
Peptide
IDs
Deiso Find
Features
LC-MS/MS
Fractions
LC-MS Peak Lists
Proteins
Filter
DB
AMT tag Database Generation
High Throughput Proteomics Analysis
DetectedPeptides
Proteins
Digest
Peptides
Path
Normalize
Rollup
Plots
Alignment
Non-ID'd features
Downstream Analysis

Match TolerancesMass: ±25 ppm
NET: ±0.05 NET
Repeat search with final search tolerances5,934 features3,866 features with matches
Identifying LC-MS Features
Observed NET
Datasets Peptide
ID
Datasets PeakMatchingFeatures
Peptide
IDs
Deiso Find
Features
LC-MS/MS
Fractions
LC-MS Peak Lists
Proteins
Filter
DB
AMT tag Database Generation
High Throughput Proteomics Analysis
DetectedPeptides
Proteins
Digest
Peptides
Path
Normalize
Rollup
Plots
Alignment
Non-ID'd features
Downstream Analysis

Match TolerancesMass: ±1.76 ppm
NET: ±0.0203 NET
Repeat search with final search tolerances5,934 features3,866 features with matches3,958 out of 18,617 AMT tags matched using ±1.76 ppm
Identifying LC-MS Features
Observed NET
Datasets Peptide
ID
Datasets PeakMatchingFeatures
Peptide
IDs
Deiso Find
Features
LC-MS/MS
Fractions
LC-MS Peak Lists
Proteins
Filter
DB
AMT tag Database Generation
High Throughput Proteomics Analysis
DetectedPeptides
Proteins
Digest
Peptides
Path
Normalize
Rollup
Plots
Alignment
Non-ID'd features
Downstream Analysis

NET
Monoisotopic Mass
1,767.960
1,767.964
1,767.968
1,767.972
1,767.976
1,767.980
1,767.984
0.350 0.358 0.366 0.374 0.382 0.390 0.398 0.407
Caveat: given feature can match more than one AMT tagNeed measure of ambiguity
1767.9727 DaNET: 0.383
1767.9727 DaNET: 0.383
AMT Tag ID Peptide Mass (Da) NET35896216 T.RALMQLDEALRPSLR.S 1767.9777 0.373
105490 K.DLETIVGLQTDAPLKR.A 1767.9730 0.38036259992 R.SIGIAPDVLICRGDRAI.P 1767.9664 0.392
Match TolerancesMass: ±4 ppm
NET: ±0.02 NET
Δ
mass
= 2.8 ppm
Δ
NET = -0.010
Δ
mass
= 0.17 ppm
Δ
NET = -0.003
Δ
mass
= -3.5 ppm
Δ
NET = 0.009
Identifying LC-MS Features
1.6 ppm
Datasets Peptide
ID
Datasets PeakMatchingFeatures
Peptide
IDs
Deiso Find
Features
LC-MS/MS
Fractions
LC-MS Peak Lists
Proteins
Filter
DB
AMT tag Database Generation
High Throughput Proteomics Analysis
DetectedPeptides
Proteins
Digest
Peptides
Path
Normalize
Rollup
Plots
Alignment
Non-ID'd features
Downstream Analysis

σmj
= 4 ppm, σtj
= 0.025
2
2
2
22 )()(
tj
tji
mj
mjiij
tmd
N
kiktkmk
ijtjmjij
d
dp
1
21
21
)2/exp()(
)2/exp()(
Numerator pij
6273.3 0.16
27042.5 0.70
5521.4 0.14
Sum: 38837.2
AMT Tag ID Mass (Da) NET dij2
35896216 1767.9777 0.373 3.012
105490 1767.9730 0.380 0.090
36259992 1767.9664 0.392 3.267
K.K. Anderson, M.E. Monroe, and D.S. Daly. Proteome Science
2006, 4, 1.
dij
NET
Monoisotopic Mass
1,767.960
1,767.964
1,767.968
1,767.972
1,767.976
1,767.980
1,767.984
0.350 0.358 0.366 0.374 0.382 0.390 0.398 0.407
Match TolerancesMass: ±4 ppm
NET: ±0.02 NET
0.70
0.16
0.14
Identifying LC-MS FeaturesMore
info
Datasets Peptide
ID
Datasets PeakMatchingFeatures
Peptide
IDs
Deiso Find
Features
LC-MS/MS
Fractions
LC-MS Peak Lists
Proteins
Filter
DB
AMT tag Database Generation
High Throughput Proteomics Analysis
DetectedPeptides
Proteins
Digest
Peptides
Path
Normalize
Rollup
Plots
Alignment
Non-ID'd features
Downstream Analysis

VIPER reports a score that measures the uniqueness of each match
AMT Tag ID Peptide Mass (Da) NETSLiC Score
Average XCorr
Avg Disc
Score35896216 T.RALMQLDEALRPSLR.S 1767.9777 0.373 0.16 3.13 0.61
105490 K.DLETIVGLQTDAPLKR.A 1767.9730 0.380 0.70 3.68 0.97
36259992 R.SIGIAPDVLICRGDRAI.P 1767.9664 0.392 0.14 2.15 0.06
NET
Monoisotopic Mass
1,767.960
1,767.964
1,767.968
1,767.972
1,767.976
1,767.980
1,767.984
0.350 0.358 0.366 0.374 0.382 0.390 0.398 0.407
0.16
0.14
0.70
Identifying LC-MS Features
K.K. Anderson, M.E. Monroe, and D.S. Daly. Proteome Science
2006, 4, 1.
Datasets Peptide
ID
Datasets PeakMatchingFeatures
Peptide
IDs
Deiso Find
Features
LC-MS/MS
Fractions
LC-MS Peak Lists
Proteins
Filter
DB
AMT tag Database Generation
High Throughput Proteomics Analysis
DetectedPeptides
Proteins
Digest
Peptides
Path
Normalize
Rollup
Plots
Alignment
Non-ID'd features
Downstream Analysis

Effect of search tolerances on Mass Error histogramIf mass error plot not centered at 0, then narrow mass windows exclude valid dataDecreasing mass and/or NET tolerance reduces background false positive level
Search Tolerance Refinement
0
100
200
300
400
-6 -4 -2 0 2 4 6
Mass Error (ppm)
Cou
nt (F
eatu
res)
±25 ppm; ±0.05 NET±25 ppm; ±0.02 NET±3 ppm; ±0.02 NET±1.5 ppm; ±0.02 NET
0
25
50
75
100
-6 -4 -2 0 2 4 6
Mass Error (ppm)
Cou
nt (F
eatu
res)
±25 ppm; ±0.05 NET±25 ppm; ±0.02 NET±3 ppm; ±0.02 NET±1.5 ppm; ±0.02 NET
Mass error histograms with linear mass correction
Mass error histograms with LCMSWarp mass correction
Datasets Peptide
ID
Datasets PeakMatchingFeatures
Peptide
IDs
Deiso Find
Features
LC-MS/MS
Fractions
LC-MS Peak Lists
Proteins
Filter
DB
AMT tag Database Generation
High Throughput Proteomics Analysis
DetectedPeptides
Proteins
Digest
Peptides
Path
Normalize
Rollup
Plots
Alignment
Non-ID'd features
Downstream Analysis

Automated processing using VIPERProcessing steps and parameters defined in .Ini file
Separate .Ini file for 14N/15N pairs and 16O/18O pairs
Automated Peak MatchingDatasets Peptide
ID
Datasets PeakMatchingFeatures
Peptide
IDs
Deiso Find
Features
LC-MS/MS
Fractions
LC-MS Peak Lists
Proteins
Filter
DB
AMT tag Database Generation
High Throughput Proteomics Analysis
DetectedPeptides
Proteins
Digest
Peptides
Path
Normalize
Rollup
Plots
Alignment
Non-ID'd features
Downstream Analysis
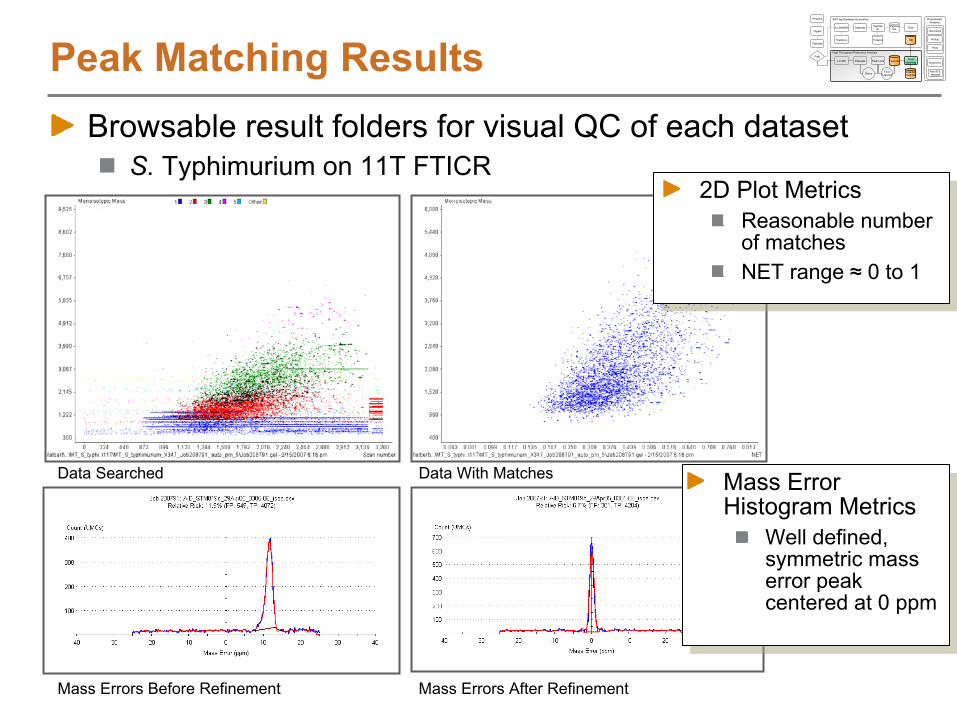
Browsable result folders for visual QC of each datasetS. Typhimurium on 11T FTICR
Data Searched Data With Matches
Mass Errors Before Refinement Mass Errors After Refinement
2D Plot MetricsReasonable number of matches
NET range ≈
0 to 1
2D Plot MetricsReasonable number of matchesNET range ≈
0 to 1
Peak Matching Results
Mass Error Histogram Metrics
Well defined, symmetric mass error peak centered at 0 ppm
Mass Error Histogram Metrics
Well defined, symmetric mass error peak centered at 0 ppm
Datasets Peptide
ID
Datasets PeakMatchingFeatures
Peptide
IDs
Deiso Find
Features
LC-MS/MS
Fractions
LC-MS Peak Lists
Proteins
Filter
DB
AMT tag Database Generation
High Throughput Proteomics Analysis
DetectedPeptides
Proteins
Digest
Peptides
Path
Normalize
Rollup
Plots
Alignment
Non-ID'd features
Downstream Analysis

Browsable result folders for visual QC of each datasetS. Typhimurium on 11T FTICR
Peak Matching Results
Total Ion Chromatogram (TIC)
NET Errors Before Refinement NET Errors After Refinement
Base Peak Intensity (BPI) Chromatogram
NET Error Histogram Metrics
Well defined, symmetric NET error peak centered at 0
NET Error Histogram Metrics
Well defined, symmetric NET error peak centered at 0
Chromatogram Metrics
Narrow peaks evenly distributed throughout separation window
Chromatogram Metrics
Narrow peaks evenly distributed throughout separation window
Datasets Peptide
ID
Datasets PeakMatchingFeatures
Peptide
IDs
Deiso Find
Features
LC-MS/MS
Fractions
LC-MS Peak Lists
Proteins
Filter
DB
AMT tag Database Generation
High Throughput Proteomics Analysis
DetectedPeptides
Proteins
Digest
Peptides
Path
Normalize
Rollup
Plots
Alignment
Non-ID'd features
Downstream Analysis
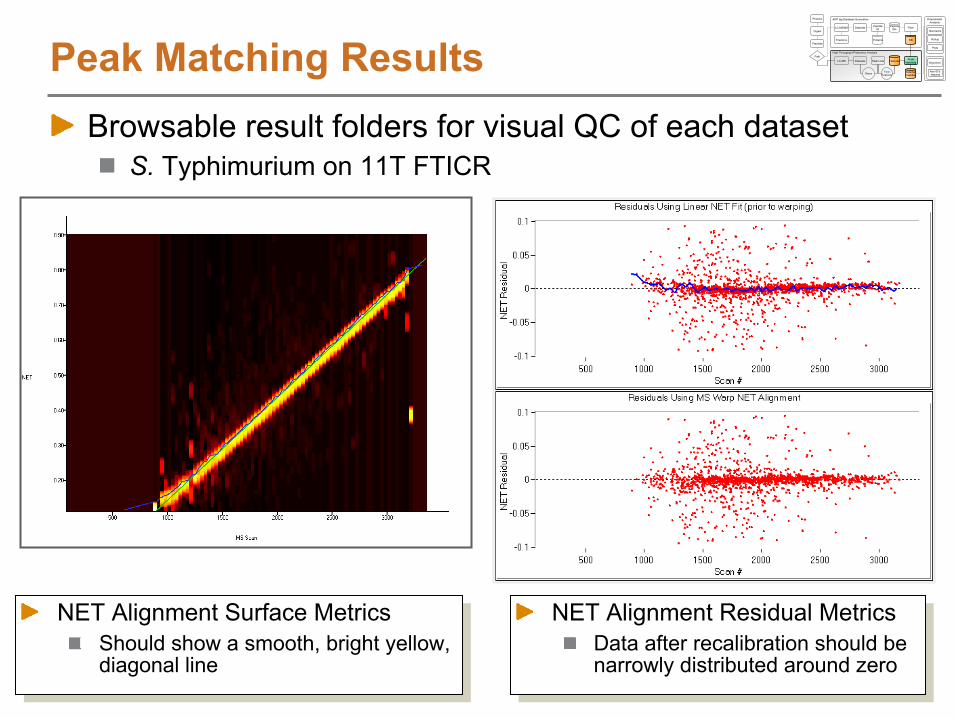
Browsable result folders for visual QC of each datasetS. Typhimurium on 11T FTICR
Peak Matching Results
NET Alignment Surface MetricsShould show a smooth, bright yellow, diagonal line
NET Alignment Surface MetricsShould show a smooth, bright yellow, diagonal line
NET Alignment Residual MetricsData after recalibration should be narrowly distributed around zero
NET Alignment Residual MetricsData after recalibration should be narrowly distributed around zero
Datasets Peptide
ID
Datasets PeakMatchingFeatures
Peptide
IDs
Deiso Find
Features
LC-MS/MS
Fractions
LC-MS Peak Lists
Proteins
Filter
DB
AMT tag Database Generation
High Throughput Proteomics Analysis
DetectedPeptides
Proteins
Digest
Peptides
Path
Normalize
Rollup
Plots
Alignment
Non-ID'd features
Downstream Analysis

Peptide identification listPeptides (and thus proteins) identified in each samplePeptide abundance estimates (relative abundance)Confidence metrics
Next, need to compare peptide abundances (and/or protein abundances) between samples to reveal biological information
Peak Matching Results
μLC-FTICR-MS Peak-matched resultsCompare abundances
across multiple proteomes
Complex samples
Datasets Peptide
ID
Datasets PeakMatchingFeatures
Peptide
IDs
Deiso Find
Features
LC-MS/MS
Fractions
LC-MS Peak Lists
Proteins
Filter
DB
AMT tag Database Generation
High Throughput Proteomics Analysis
DetectedPeptides
Proteins
Digest
Peptides
Path
Normalize
Rollup
Plots
Alignment
Non-ID'd features
Downstream Analysis

Part II: LC-MS Feature DiscoveryPart I: Introduction and Overview of Label-Free Quantitative Proteomics (Anderson)Part II: Feature Discovery in LC-MS Datasets (Monroe and Polpitiya)
Structure of LC-MS DataFeature discovery in individual spectra (deisotoping)
Feature definition over elution time
Identifying LC-MS Features using an AMT tag DB
Extending the AMT tag approach for feature based analyses
Estimating confidence of identified LC-MS features
Downstream quantitative analysis with DAnTEBreakPart III: Biological Application of the AMT tag Approach (Ansong)AMT tag Analysis Software DemoPanel Discussion
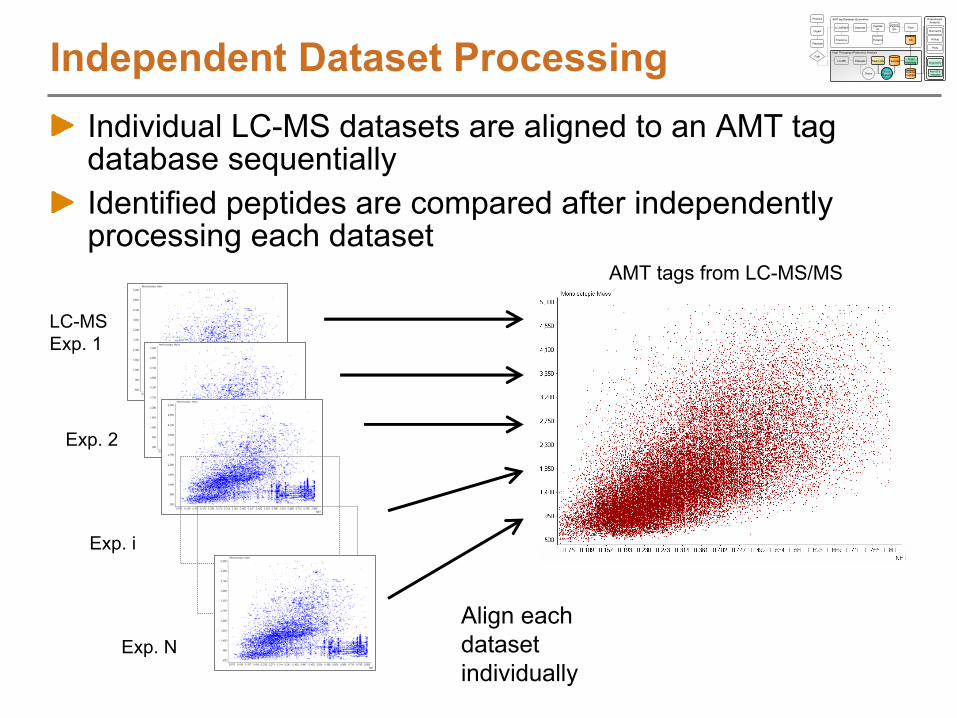
Independent Dataset ProcessingIndividual LC-MS datasets are aligned to an AMT tag database sequentiallyIdentified peptides are compared after independently processing each dataset
AMT tags from LC-MS/MS
LC-MS
Exp. 1
Exp. 2
Exp. i
Align each dataset individually
Datasets Peptide
ID
Datasets PeakMatchingFeatures
Peptide
IDs
Deiso Find
Features
LC-MS/MS
Fractions
LC-MS Peak Lists
Proteins
Filter
DB
AMT tag Database Generation
High Throughput Proteomics Analysis
DetectedPeptides
Proteins
Digest
Peptides
Path
Normalize
Rollup
Plots
Alignment
Non-ID'd features
Downstream Analysis
Exp. N

Independent Dataset ProcessingLC-MS features without matches may represent useful information, but are effectively ignored
AMT tags from LC-MS/MS
All features
Identified
features
LC-FTICR-MS
Datasets Peptide
ID
Datasets PeakMatchingFeatures
Peptide
IDs
Deiso Find
Features
LC-MS/MS
Fractions
LC-MS Peak Lists
Proteins
Filter
DB
AMT tag Database Generation
High Throughput Proteomics Analysis
DetectedPeptides
Proteins
Digest
Peptides
Path
Normalize
Rollup
Plots
Alignment
Non-ID'd features
Downstream Analysis

Independent Dataset ProcessingIndependent processing of each dataset results in more missing data
For example, if a low abundance peptide is not identified as an LC-MS feature in a given dataset, then that peptide identification is missing from that dataset
Lower abundance features suffer more, but are not the only casualties
43%
14%
11%
13%
19%
5 of 5 datasets4 of 5 datasets3 of 5 datasets2 of 5 datasets1 of 5 datasets
FrequencyNumber of Peptides
Seen in all 5 3079
4 of 5 974
3 of 5 766
2 of 5 926
1 of 5 1332
5 of 5
4 of 5
3 of 5
2 of 5
1 of 5
Peptide Detection Reproducibility in Replicate Datasets
Datasets Peptide
ID
Datasets PeakMatchingFeatures
Peptide
IDs
Deiso Find
Features
LC-MS/MS
Fractions
LC-MS Peak Lists
Proteins
Filter
DB
AMT tag Database Generation
High Throughput Proteomics Analysis
DetectedPeptides
Proteins
Digest
Peptides
Path
Normalize
Rollup
Plots
Alignment
Non-ID'd features
Downstream Analysis
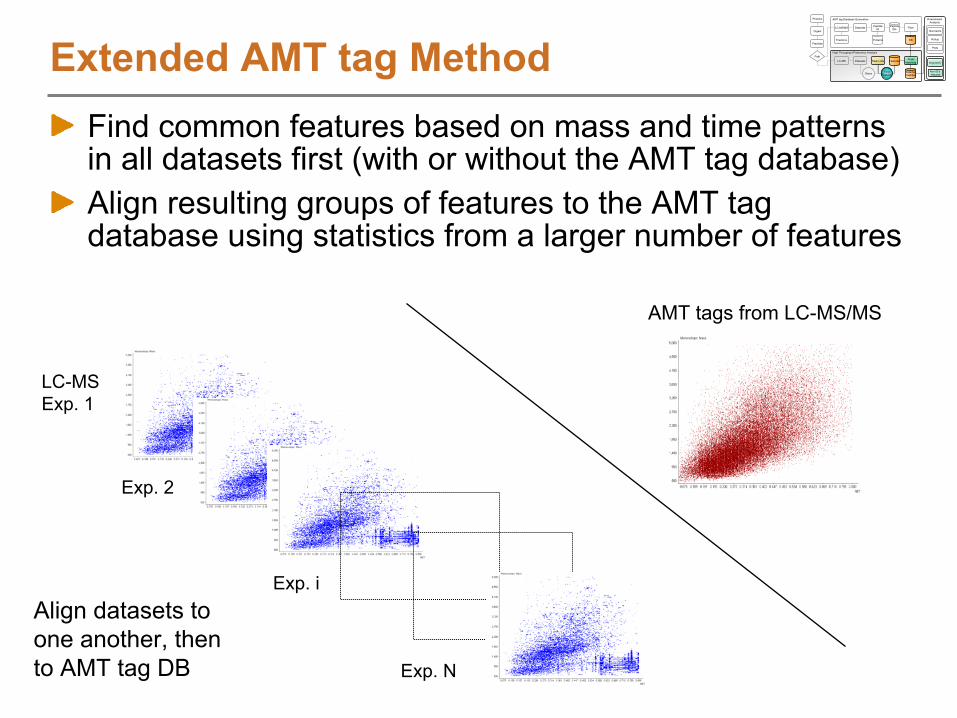
Extended AMT tag Method
AMT tags from LC-MS/MS
Find common features based on mass and time patterns in all datasets first (with or without the AMT tag database)Align resulting groups of features to the AMT tag database using statistics from a larger number of features
LC-MS
Exp. 1
Exp. 2
Exp. i
Exp. N
Align datasets to one another, then to AMT tag DB
Datasets Peptide
ID
Datasets PeakMatchingFeatures
Peptide
IDs
Deiso Find
Features
LC-MS/MS
Fractions
LC-MS Peak Lists
Proteins
Filter
DB
AMT tag Database Generation
High Throughput Proteomics Analysis
DetectedPeptides
Proteins
Digest
Peptides
Path
Normalize
Rollup
Plots
Alignment
Non-ID'd features
Downstream Analysis
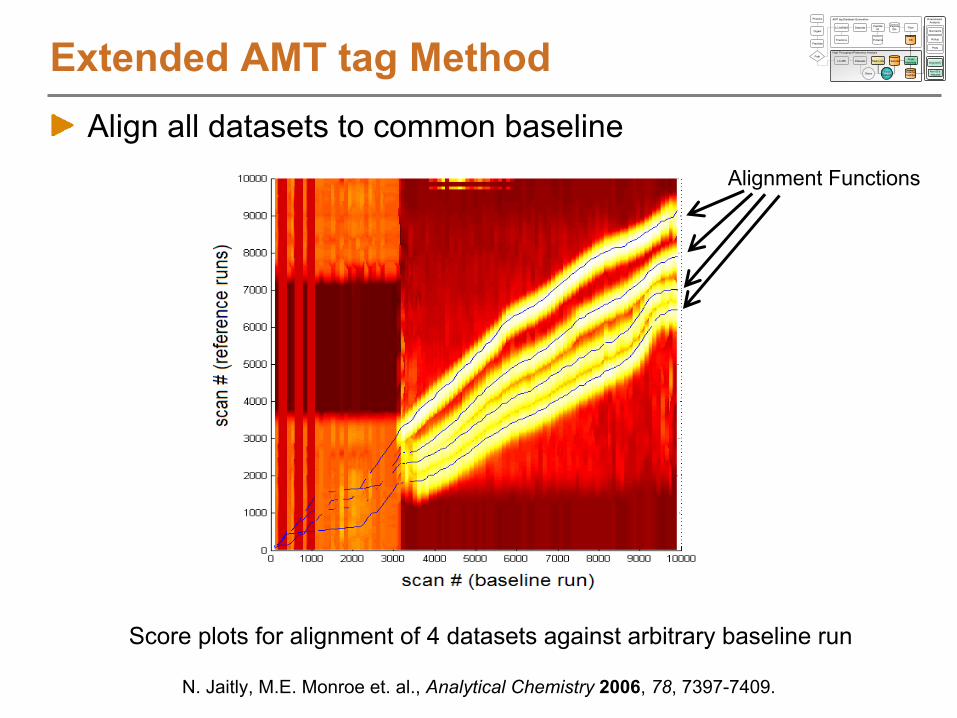
Extended AMT tag Method
Score plots for alignment of 4 datasets against arbitrary baseline run
Alignment Functions
N. Jaitly, M.E. Monroe et. al., Analytical Chemistry
2006, 78, 7397-7409.
Datasets Peptide
ID
Datasets PeakMatchingFeatures
Peptide
IDs
Deiso Find
Features
LC-MS/MS
Fractions
LC-MS Peak Lists
Proteins
Filter
DB
AMT tag Database Generation
High Throughput Proteomics Analysis
DetectedPeptides
Proteins
Digest
Peptides
Path
Normalize
Rollup
Plots
Alignment
Non-ID'd features
Downstream Analysis
Align all datasets to common baseline
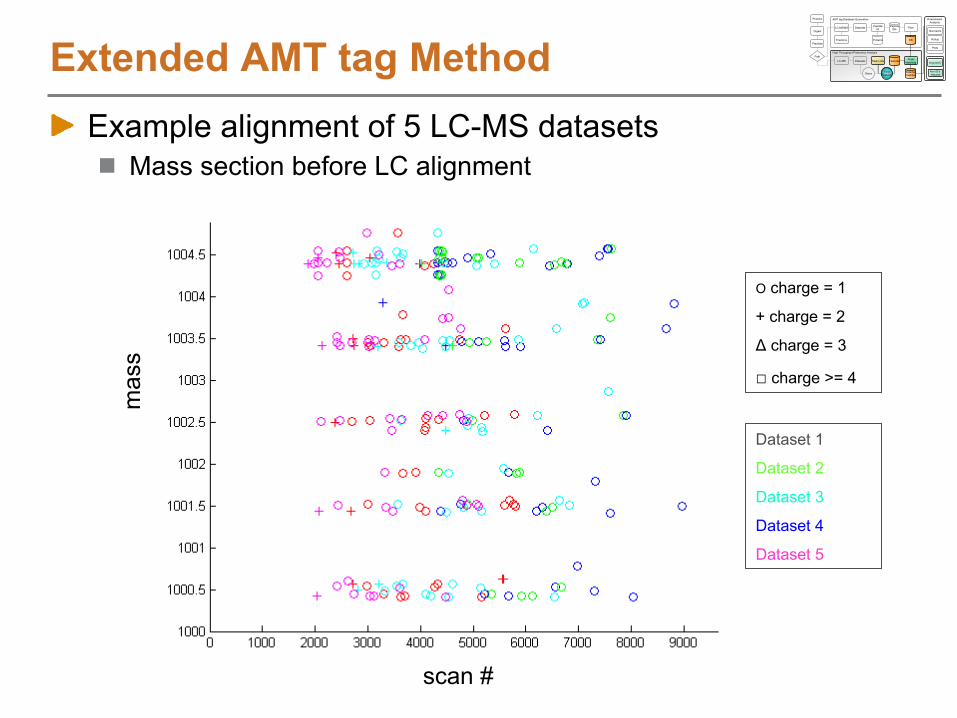
Extended AMT tag Method
scan #
mas
s
O
charge = 1
+ charge = 2
Δ
charge = 3
□
charge >= 4
Dataset 1
Dataset 2
Dataset 3
Dataset 4
Dataset 5
Example alignment of 5 LC-MS datasetsMass section before LC alignment
Datasets Peptide
ID
Datasets PeakMatchingFeatures
Peptide
IDs
Deiso Find
Features
LC-MS/MS
Fractions
LC-MS Peak Lists
Proteins
Filter
DB
AMT tag Database Generation
High Throughput Proteomics Analysis
DetectedPeptides
Proteins
Digest
Peptides
Path
Normalize
Rollup
Plots
Alignment
Non-ID'd features
Downstream Analysis
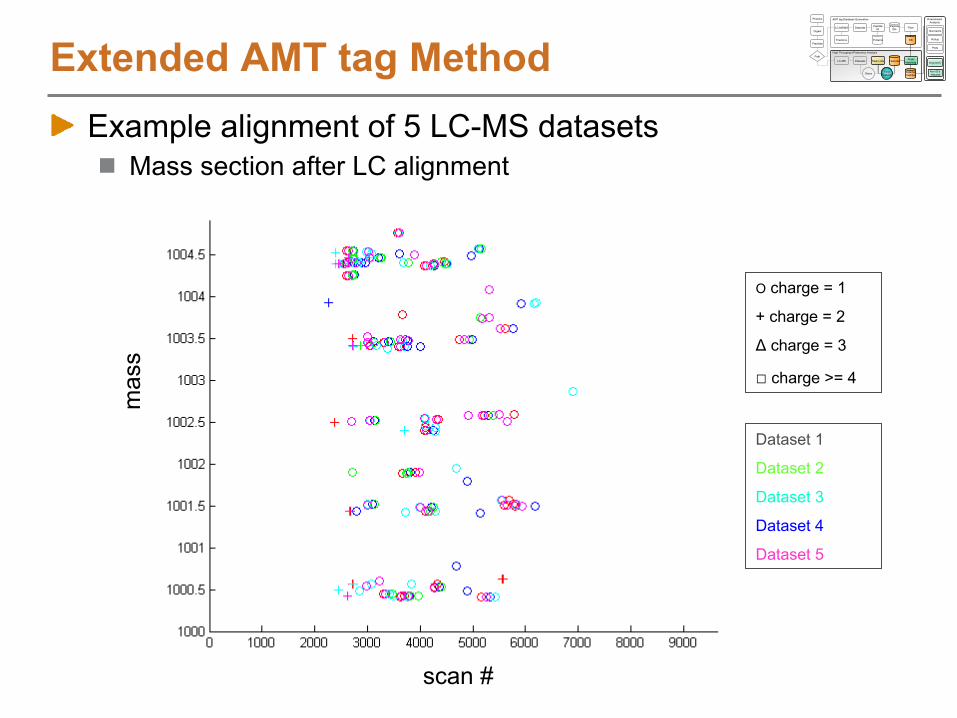
Extended AMT tag Methodm
ass
O
charge = 1
+ charge = 2
Δ
charge = 3
□
charge >= 4
Dataset 1
Dataset 2
Dataset 3
Dataset 4
Dataset 5
scan #
Example alignment of 5 LC-MS datasetsMass section after LC alignment
Datasets Peptide
ID
Datasets PeakMatchingFeatures
Peptide
IDs
Deiso Find
Features
LC-MS/MS
Fractions
LC-MS Peak Lists
Proteins
Filter
DB
AMT tag Database Generation
High Throughput Proteomics Analysis
DetectedPeptides
Proteins
Digest
Peptides
Path
Normalize
Rollup
Plots
Alignment
Non-ID'd features
Downstream Analysis
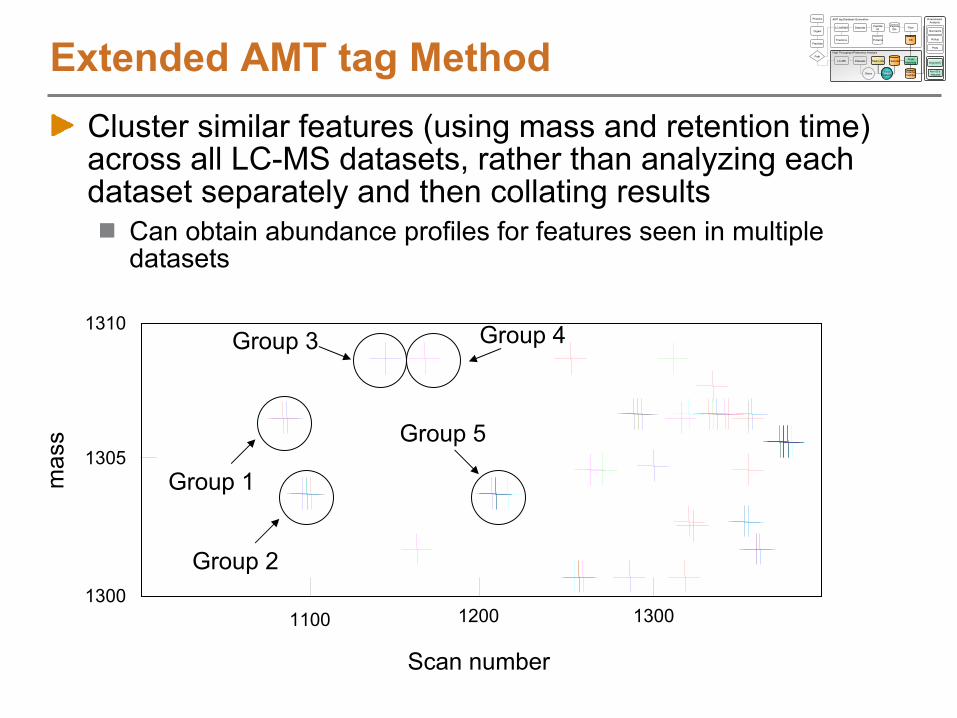
Extended AMT tag MethodCluster similar features (using mass and retention time) across all LC-MS datasets, rather than analyzing each dataset separately and then collating results
Can obtain abundance profiles for features seen in multiple datasets
1100 1200 13001300
1305
1310
mas
s
Scan number
Group 1
Group 2
Group 3 Group 4
Group 5
Datasets Peptide
ID
Datasets PeakMatchingFeatures
Peptide
IDs
Deiso Find
Features
LC-MS/MS
Fractions
LC-MS Peak Lists
Proteins
Filter
DB
AMT tag Database Generation
High Throughput Proteomics Analysis
DetectedPeptides
Proteins
Digest
Peptides
Path
Normalize
Rollup
Plots
Alignment
Non-ID'd features
Downstream Analysis
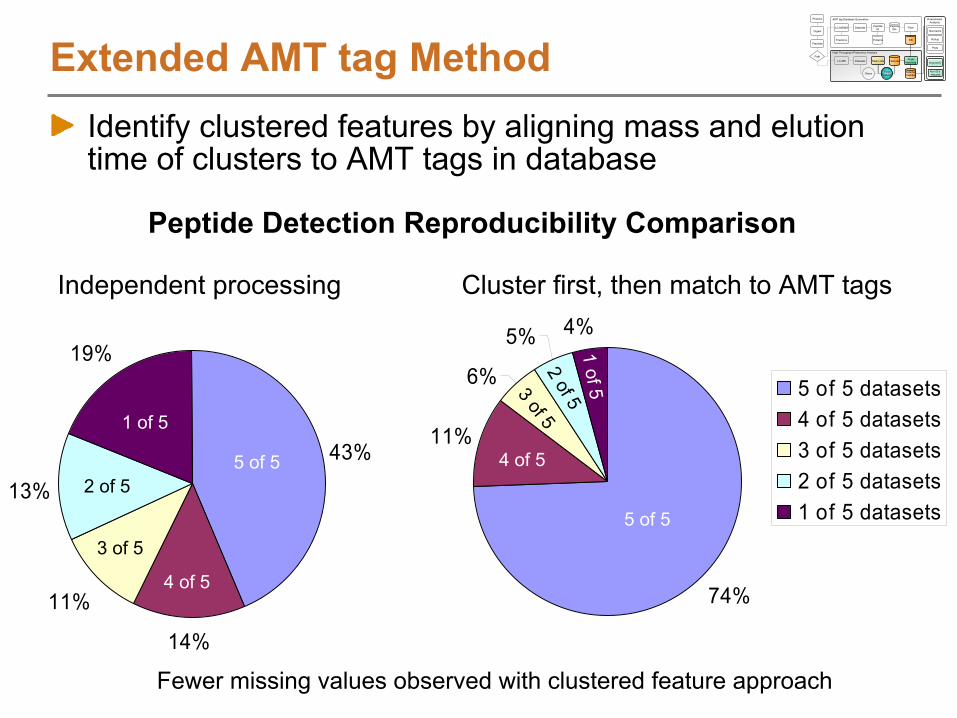
Extended AMT tag MethodIdentify clustered features by aligning mass and elution time of clusters to AMT tags in database
Fewer missing values observed with clustered feature approach
43%
14%
11%
13%
19%
74%
11%
6%
5% 4%
5 of 5 datasets4 of 5 datasets3 of 5 datasets2 of 5 datasets1 of 5 datasets
Peptide Detection Reproducibility Comparison
Independent processing Cluster first, then match to AMT tags
Datasets Peptide
ID
Datasets PeakMatchingFeatures
Peptide
IDs
Deiso Find
Features
LC-MS/MS
Fractions
LC-MS Peak Lists
Proteins
Filter
DB
AMT tag Database Generation
High Throughput Proteomics Analysis
DetectedPeptides
Proteins
Digest
Peptides
Path
Normalize
Rollup
Plots
Alignment
Non-ID'd features
Downstream Analysis
5 of 5
4 of 5
3 of 5
2 of 5
1 of 5
5 of 5
4 of 53 of 5
2 of 51 of 5

MultiAlignRepresents next version of the feature identification processAlong with MTDB Creator it represents a standalone, redistributable version of the AMT tag process
Datasets Peptide
ID
Datasets PeakMatchingFeatures
Peptide
IDs
Deiso Find
Features
LC-MS/MS
Fractions
LC-MS Peak Lists
Proteins
Filter
DB
AMT tag Database Generation
High Throughput Proteomics Analysis
DetectedPeptides
Proteins
Digest
Peptides
Path
Normalize
Rollup
Plots
Alignment
Non-ID'd features
Downstream Analysis
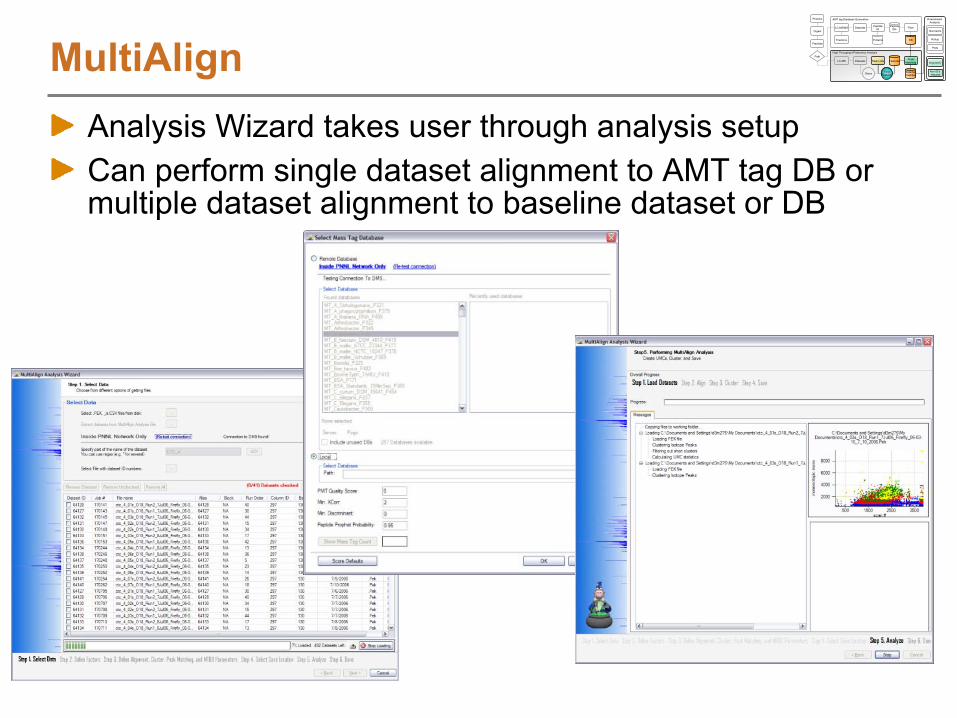
MultiAlignAnalysis Wizard takes user through analysis setupCan perform single dataset alignment to AMT tag DB or multiple dataset alignment to baseline dataset or DB
Datasets Peptide
ID
Datasets PeakMatchingFeatures
Peptide
IDs
Deiso Find
Features
LC-MS/MS
Fractions
LC-MS Peak Lists
Proteins
Filter
DB
AMT tag Database Generation
High Throughput Proteomics Analysis
DetectedPeptides
Proteins
Digest
Peptides
Path
Normalize
Rollup
Plots
Alignment
Non-ID'd features
Downstream Analysis

MultiAlignDataset summary pages and overview are available for visual QC
Datasets Peptide
ID
Datasets PeakMatchingFeatures
Peptide
IDs
Deiso Find
Features
LC-MS/MS
Fractions
LC-MS Peak Lists
Proteins
Filter
DB
AMT tag Database Generation
High Throughput Proteomics Analysis
DetectedPeptides
Proteins
Digest
Peptides
Path
Normalize
Rollup
Plots
Alignment
Non-ID'd features
Downstream Analysis

Similar approaches and software tools: High Res LC-MSCRAWDAD
G.L. Finney et al. Analytical Chemistry
2008, 80, 961-971.msInspect
M. Bellew et. al. Bioinformatics
2006, 22, 1902-1909.PEPPeR
J. Jaffe et.al. Mol. Cell. Proteomics
2006, 5, 1927-1941.SpecArray (Pep3D, mzXML2dat, PepList, PepMatch, PepArray)
X.-J. Li, et. al. Mol Cell Proteomics
2005, 4, 1328-1340.SuperHIRN
L.N. Mueller et al. Proteomics
2007, 7, 3470-3480.Surromed label-free quantitation software (MassView)
W. Wang et al. Analytical Chemistry
2003, 75, 4818-4826.XCMS (for Metabolite profiling)
C.A. Smith et. al. Analytical Chemistry
2006, 78, 779-787.
LC-MS Feature DiscoveryMore
info

Similar approaches and software tools: Low Res LC-MSSignal maps software
A. Prakash et. al. Mol. Cell Proteomics
2006, 5, 423-432.Informatics platform for global proteomic profiling using LC-MS
D. Radulovic, et al. Mol. Cell. Proteomics
2004, 3, 984-997.Computational Proteomics Analysis System (CPAS)
A. Rauch et. al. J. Proteome Research
2006, 5, 112-121.
LC-MS Feature DiscoveryMore
info
Part II: LC-MS Feature DiscoveryPart I: Introduction and Overview of Label-Free Quantitative Proteomics (Anderson)Part II: Feature Discovery in LC-MS Datasets (Monroe and Polpitiya)
Structure of LC-MS DataFeature discovery in individual spectra (deisotoping)
Feature definition over elution time
Identifying LC-MS Features using an AMT tag DB
Extending the AMT tag approach for feature based analyses
Estimating confidence of identified LC-MS features
Downstream quantitative analysis with DAnTEBreakPart III: Biological Application of the AMT tag Approach (Ansong)AMT tag Analysis Software DemoPanel Discussion
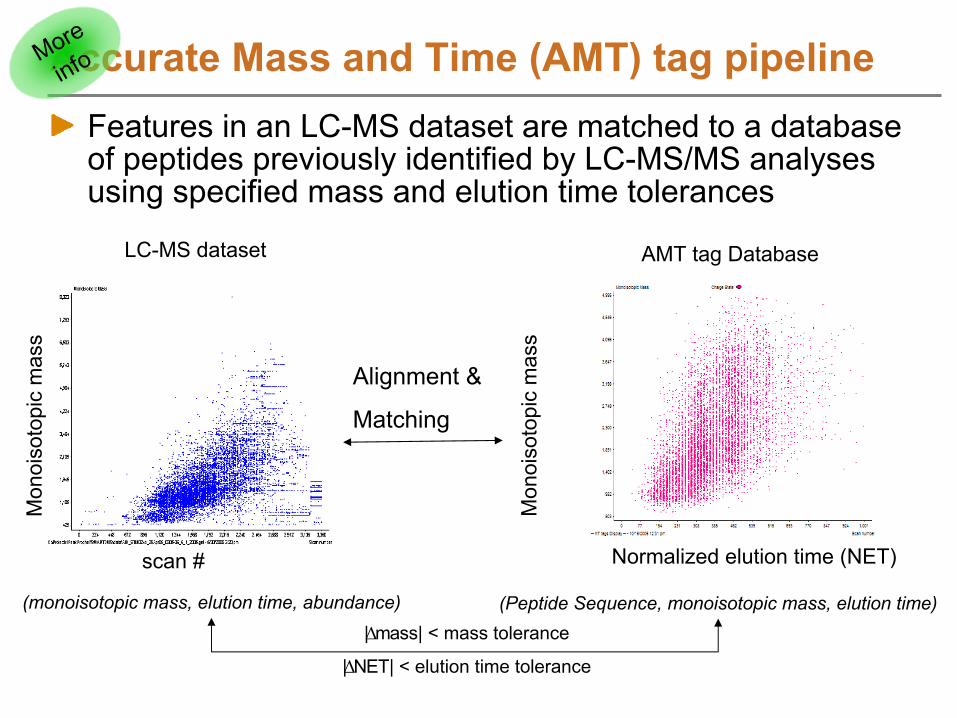
Accurate Mass and Time (AMT) tag pipeline Features in an LC-MS dataset are matched to a database of peptides previously identified by LC-MS/MS analyses using specified mass and elution time tolerances
scan #
Mon
oiso
topi
c m
ass
Normalized elution time (NET)M
onoi
soto
pic
mas
s
Alignment &
Matching
LC-MS dataset AMT tag Database
(monoisotopic mass, elution time, abundance) (Peptide Sequence, monoisotopic mass, elution time)|Δmass| < mass tolerance
|ΔNET| < elution time tolerance
More
info

Current Method for Assessing and Controlling Rate of Random Matches
Decoy database searching is often used to assess rate of random AMT tag matches
Shift database (or features) by some mass, and re-match to databaseThe number of matches reflects the random rate of errors
Rate of error controlled byBuilding more stringent LC-MS/MS databases (higher XCorr, hyperscore, Mascot score, Peptide Prophet score, etc)Reducing mass and elution time tolerances
Overall method consists of iteratively controlling and assessing error to choose “optimal”
parameters
Datasets Peptide
ID
Datasets PeakMatchingFeatures
Peptide
IDs
Deiso Find
Features
LC-MS/MS
Fractions
LC-MS Peak Lists
Proteins
Filter
DB
AMT tag Database Generation
High Throughput Proteomics Analysis
DetectedPeptides
Proteins
Digest
Peptides
Path
Normalize
Rollup
Plots
Alignment
Non-ID'd features
Downstream Analysis

Challenges with Current MethodBalancing false positives and false negatives is a tricky game
Building more confident LC-MS/MS database decreases background false positives, but increases false negativesReducing mass and elution time tolerances has a similar effectManually chosen parameters may look suitable, but in reality be sub-optimal
Each identification is either accepted or rejectedIn reality some identifications are better than others –
higher MS/MS confidence, lower mass and elution time differences, etc.
Datasets Peptide
ID
Datasets PeakMatchingFeatures
Peptide
IDs
Deiso Find
Features
LC-MS/MS
Fractions
LC-MS Peak Lists
Proteins
Filter
DB
AMT tag Database Generation
High Throughput Proteomics Analysis
DetectedPeptides
Proteins
Digest
Peptides
Path
Normalize
Rollup
Plots
Alignment
Non-ID'd features
Downstream Analysis
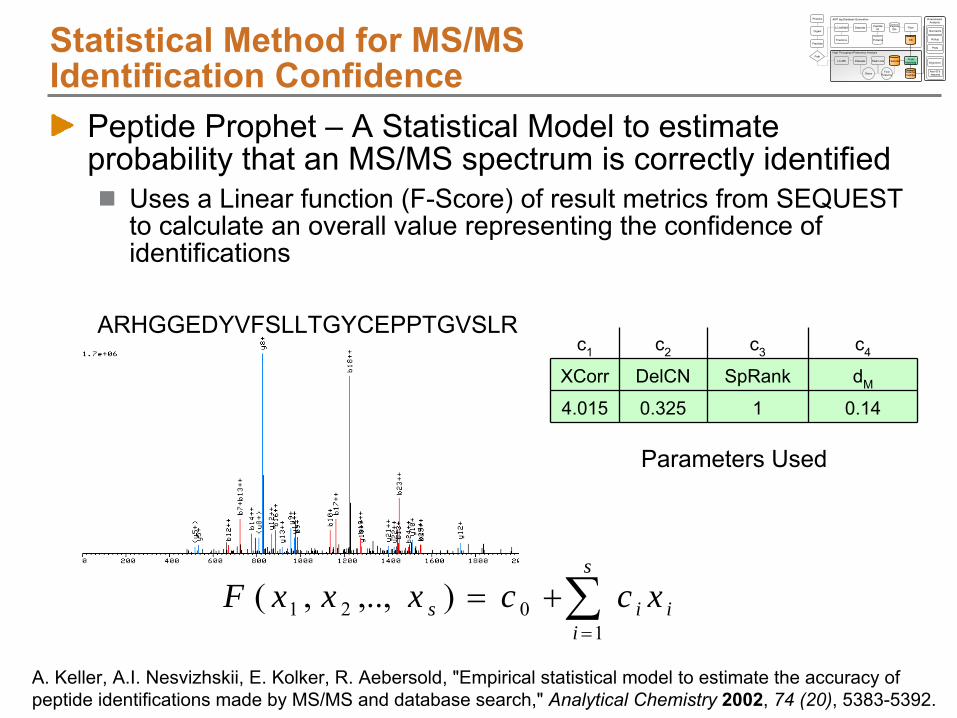
Statistical Method for MS/MS Identification
Confidence
Peptide Prophet –
A Statistical Model to estimate probability that an MS/MS spectrum is correctly identified
Uses a Linear function (F-Score) of result metrics from SEQUEST to calculate an overall value representing the confidence of identifications
A. Keller, A.I. Nesvizhskii, E. Kolker, R. Aebersold, "Empirical statistical model to estimate the accuracy of peptide identifications made by MS/MS and database search,"
Analytical Chemistry
2002, 74 (20), 5383-5392.
s
iiis xccxxxF
1021 ),..,,(
c1 c2 c3 c4
XCorr DelCN SpRank dM
4.015 0.325 1 0.14
ARHGGEDYVFSLLTGYCEPPTGVSLR
Parameters Used
Datasets Peptide
ID
Datasets PeakMatchingFeatures
Peptide
IDs
Deiso Find
Features
LC-MS/MS
Fractions
LC-MS Peak Lists
Proteins
Filter
DB
AMT tag Database Generation
High Throughput Proteomics Analysis
DetectedPeptides
Proteins
Digest
Peptides
Path
Normalize
Rollup
Plots
Alignment
Non-ID'd features
Downstream Analysis

Peptide Prophet F-Score DistributionsOverall F-Score distribution is bimodal, with distinct distributions for correct and incorrect matchesProbability that an identification is correct can be computed from relative probabilities of coming from correct or incorrect distribution
All HitsCorrect HitsIncorrect Hits
-2 0 2 4 6 8
0.0
0.1
0.2
0.3
F Score
rela
tive
frequ
ency
Correct Matches
Incorrect Matches
Datasets Peptide
ID
Datasets PeakMatchingFeatures
Peptide
IDs
Deiso Find
Features
LC-MS/MS
Fractions
LC-MS Peak Lists
Proteins
Filter
DB
AMT tag Database Generation
High Throughput Proteomics Analysis
DetectedPeptides
Proteins
Digest
Peptides
Path
Normalize
Rollup
Plots
Alignment
Non-ID'd features
Downstream Analysis
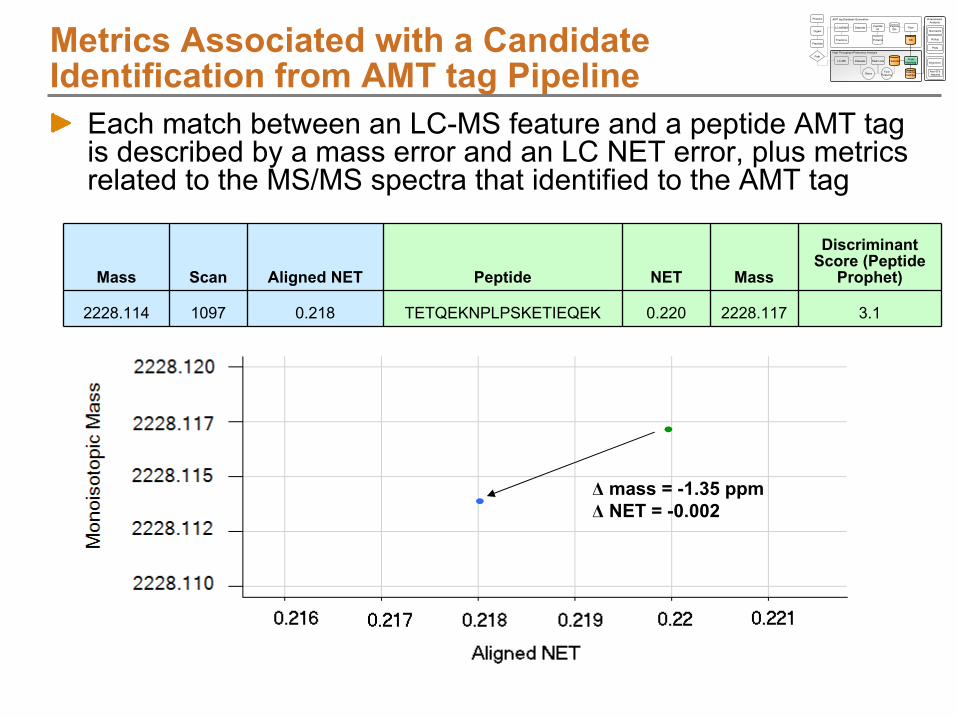
Metrics Associated with a Candidate Identification
from AMT tag Pipeline
Mass Scan Aligned NET Peptide NET Mass
Discriminant Score (Peptide
Prophet)
2228.114 1097 0.218 TETQEKNPLPSKETIEQEK 0.220 2228.117 3.1
Δ
mass = -1.35 ppm
Δ
NET = -0.002
Each match between an LC-MS feature and a peptide AMT tag is described by a mass error and an LC NET error, plus metrics related to the MS/MS spectra that identified to the AMT tag
Datasets Peptide
ID
Datasets PeakMatchingFeatures
Peptide
IDs
Deiso Find
Features
LC-MS/MS
Fractions
LC-MS Peak Lists
Proteins
Filter
DB
AMT tag Database Generation
High Throughput Proteomics Analysis
DetectedPeptides
Proteins
Digest
Peptides
Path
Normalize
Rollup
Plots
Alignment
Non-ID'd features
Downstream Analysis
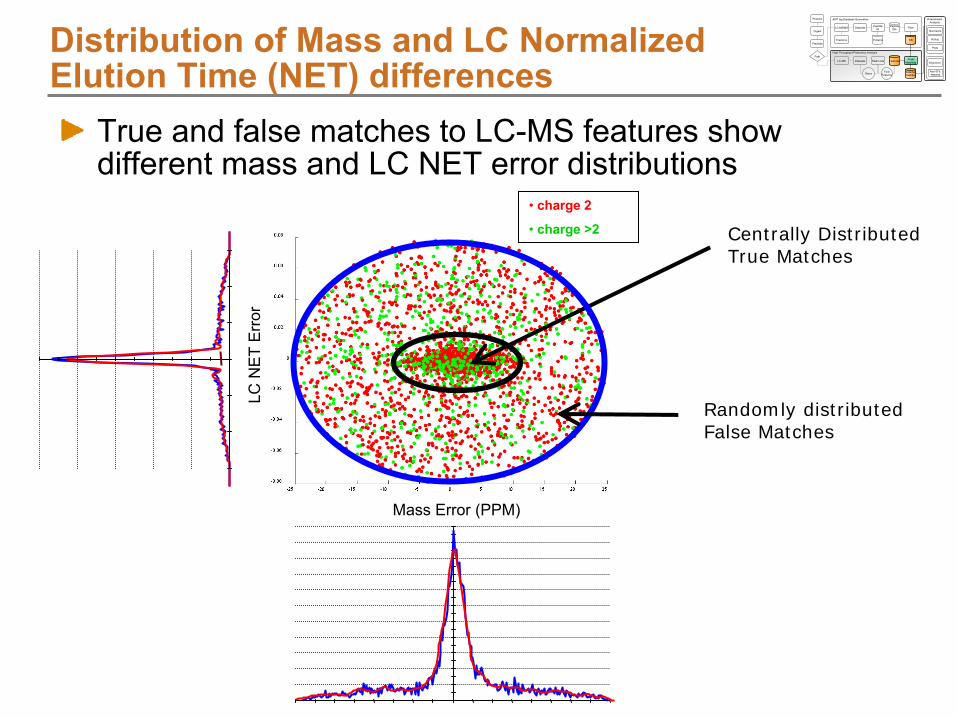
Distribution of Mass and
LC Normalized Elution Time (NET) differences
True and false matches to LC-MS features show different mass and LC NET error distributions
Mass Error (PPM)
LC N
ET
Err
orCentrally Distributed True Matches
Randomly distributed False Matches
• charge 2
• charge >2
Datasets Peptide
ID
Datasets PeakMatchingFeatures
Peptide
IDs
Deiso Find
Features
LC-MS/MS
Fractions
LC-MS Peak Lists
Proteins
Filter
DB
AMT tag Database Generation
High Throughput Proteomics Analysis
DetectedPeptides
Proteins
Digest
Peptides
Path
Normalize
Rollup
Plots
Alignment
Non-ID'd features
Downstream Analysis
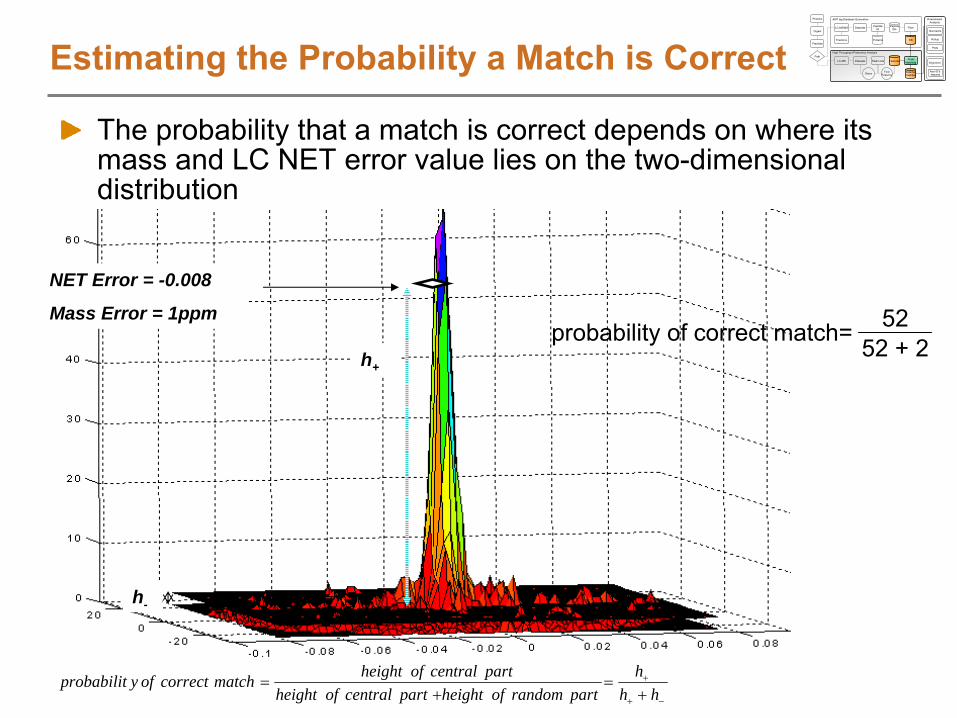
hhh
partrandomofheightpartcentralofheightpartcentralofheightmatchcorrectofyprobabilit
h+
NET Error = -0.008
Mass Error = 1ppmprobability of correct match= 52
52 + 2
The probability that a match is correct depends on where its mass and LC NET error value lies on the two-dimensional distribution
Estimating the Probability a Match
is Correct
h-
Datasets Peptide
ID
Datasets PeakMatchingFeatures
Peptide
IDs
Deiso Find
Features
LC-MS/MS
Fractions
LC-MS Peak Lists
Proteins
Filter
DB
AMT tag Database Generation
High Throughput Proteomics Analysis
DetectedPeptides
Proteins
Digest
Peptides
Path
Normalize
Rollup
Plots
Alignment
Non-ID'd features
Downstream Analysis
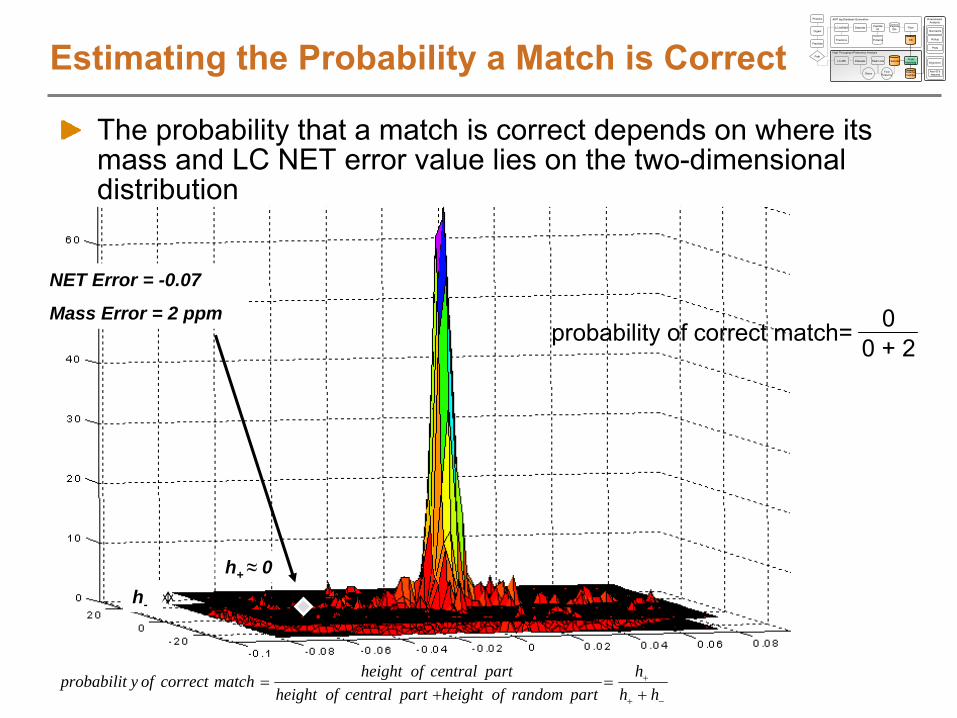
h-
hhh
partrandomofheightpartcentralofheightpartcentralofheightmatchcorrectofyprobabilit
NET Error = -0.07
Mass Error = 2 ppm
h+ ≈
0
probability of correct match= 00 + 2
The probability that a match is correct depends on where its mass and LC NET error value lies on the two-dimensional distribution
Estimating the Probability a Match
is CorrectDatasets Peptide
ID
Datasets PeakMatchingFeatures
Peptide
IDs
Deiso Find
Features
LC-MS/MS
Fractions
LC-MS Peak Lists
Proteins
Filter
DB
AMT tag Database Generation
High Throughput Proteomics Analysis
DetectedPeptides
Proteins
Digest
Peptides
Path
Normalize
Rollup
Plots
Alignment
Non-ID'd features
Downstream Analysis
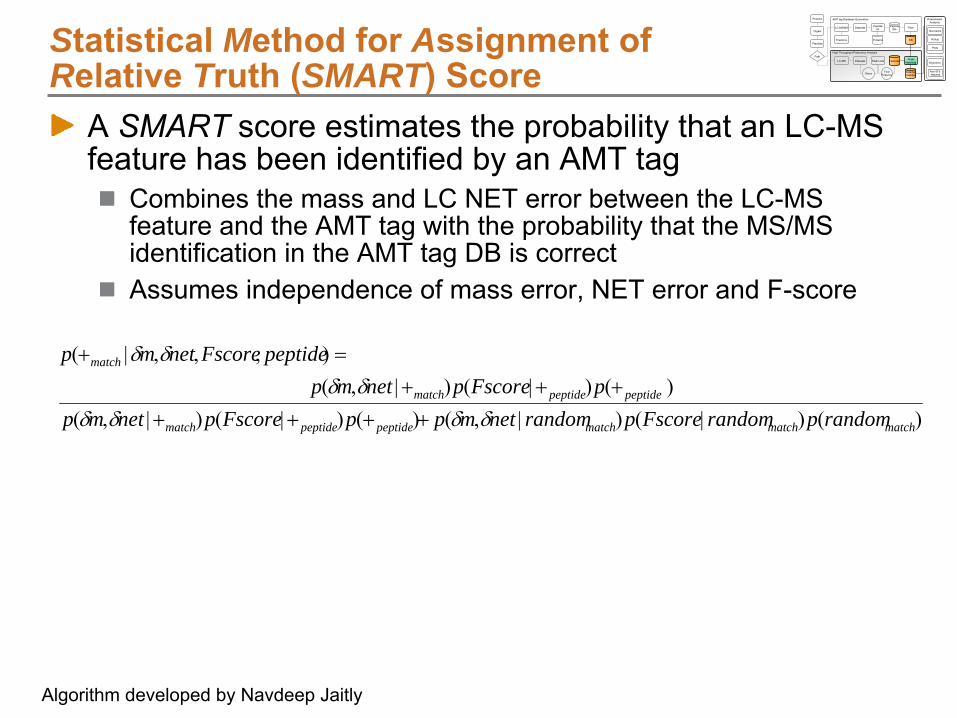
)()|()|,()()|()|,()()|()|,(
),,,|(
matchmatchmatchpeptidepeptidematch
peptidepeptidematch
match
randomprandomFscoreprandomnetmppFscorepnetmppFscorepnetmp
peptideFscorenetmp
Statistical Method for Assignment of Relative
Truth (SMART) Score
A SMART
score estimates the probability that an LC-MS feature has been identified by an AMT tag
Combines the mass and LC NET error between the LC-MS feature and the AMT tag with the probability that the MS/MS identification in the AMT tag DB is correctAssumes independence of mass error, NET error and F-score
Algorithm developed by Navdeep Jaitly
Datasets Peptide
ID
Datasets PeakMatchingFeatures
Peptide
IDs
Deiso Find
Features
LC-MS/MS
Fractions
LC-MS Peak Lists
Proteins
Filter
DB
AMT tag Database Generation
High Throughput Proteomics Analysis
DetectedPeptides
Proteins
Digest
Peptides
Path
Normalize
Rollup
Plots
Alignment
Non-ID'd features
Downstream Analysis
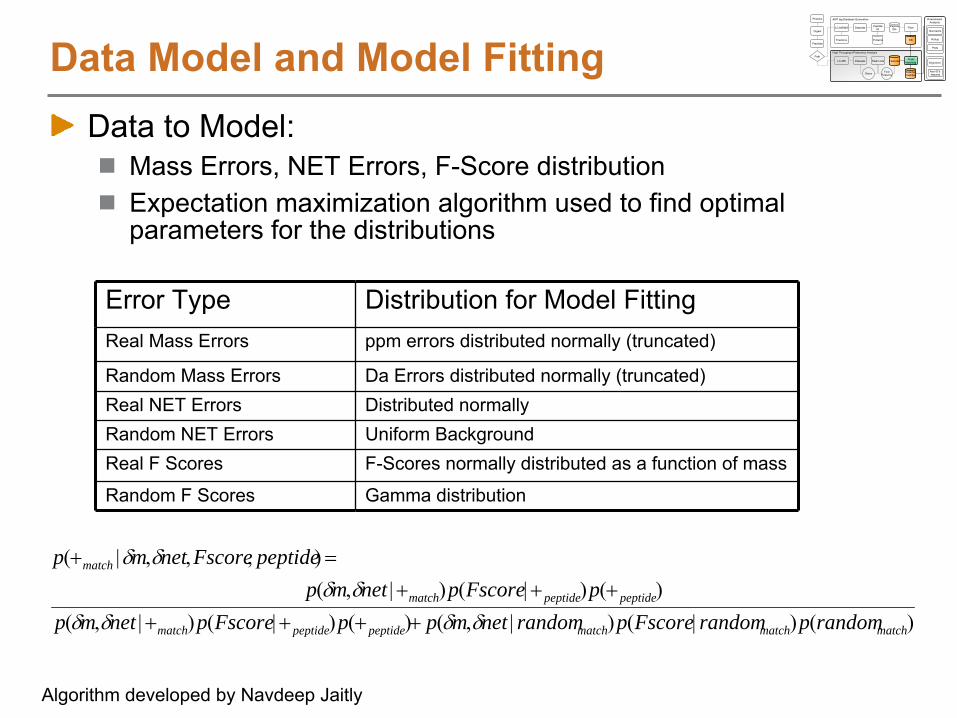
)()|()|,()()|()|,()()|()|,(
),,,|(
matchmatchmatchpeptidepeptidematch
peptidepeptidematch
match
randomprandomFscoreprandomnetmppFscorepnetmppFscorepnetmp
peptideFscorenetmp
Error Type Distribution for Model FittingReal Mass Errors ppm errors distributed normally (truncated)
Random Mass Errors Da Errors distributed normally (truncated)Real NET Errors Distributed normallyRandom NET Errors Uniform BackgroundReal F Scores F-Scores normally distributed as a function of mass
Random F Scores Gamma distribution
Data Model and Model FittingData to Model:
Mass Errors, NET Errors, F-Score distributionExpectation maximization algorithm used to find optimal parameters for the distributions
Algorithm developed by Navdeep Jaitly
Datasets Peptide
ID
Datasets PeakMatchingFeatures
Peptide
IDs
Deiso Find
Features
LC-MS/MS
Fractions
LC-MS Peak Lists
Proteins
Filter
DB
AMT tag Database Generation
High Throughput Proteomics Analysis
DetectedPeptides
Proteins
Digest
Peptides
Path
Normalize
Rollup
Plots
Alignment
Non-ID'd features
Downstream Analysis
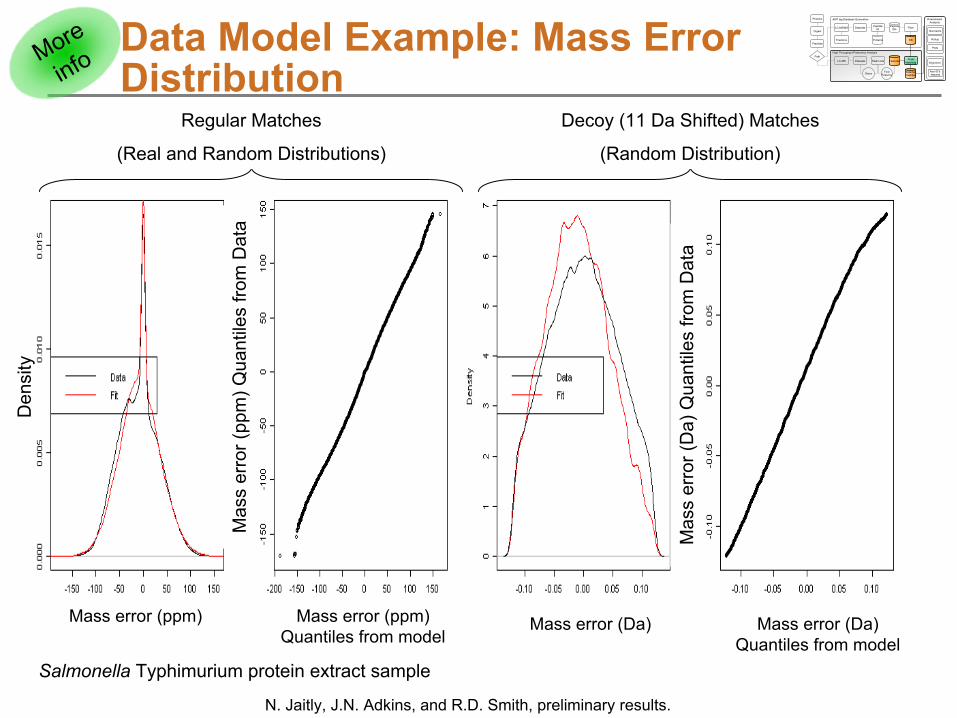
Mass error (ppm) Mass error (Da)Mass error (ppm) Quantiles from model
Mass error (Da) Quantiles from model
Mas
s er
ror (
ppm
) Qua
ntile
s fro
m D
ata
Mas
s er
ror (
Da)
Qua
ntile
s fro
m D
ata
Data Model Example: Mass Error Distribution
Den
sity
N. Jaitly, J.N. Adkins, and R.D. Smith, preliminary results.
Salmonella Typhimurium
protein extract sample
Regular Matches
(Real and Random Distributions)
Decoy (11 Da Shifted) Matches
(Random Distribution)
More
info
Datasets Peptide
ID
Datasets PeakMatchingFeatures
Peptide
IDs
Deiso Find
Features
LC-MS/MS
Fractions
LC-MS Peak Lists
Proteins
Filter
DB
AMT tag Database Generation
High Throughput Proteomics Analysis
DetectedPeptides
Proteins
Digest
Peptides
Path
Normalize
Rollup
Plots
Alignment
Non-ID'd features
Downstream Analysis

NET Error
Salmonella Typhimurium
protein extract sample
NET ErrorNET Error Quantiles from model
NET Error Quantiles from model
Regular Matches
(Real and Random Distributions)
Decoy (11 Da Shifted) Matches
(Random Distribution)
Den
sity
NET
Erro
r Qua
ntile
s fro
m D
ata
NET
Erro
r Qua
ntile
s fro
m D
ata
Data Model Example: NET Error Distribution
N. Jaitly, J.N. Adkins, and R.D. Smith, preliminary results.
More
info
Datasets Peptide
ID
Datasets PeakMatchingFeatures
Peptide
IDs
Deiso Find
Features
LC-MS/MS
Fractions
LC-MS Peak Lists
Proteins
Filter
DB
AMT tag Database Generation
High Throughput Proteomics Analysis
DetectedPeptides
Proteins
Digest
Peptides
Path
Normalize
Rollup
Plots
Alignment
Non-ID'd features
Downstream Analysis
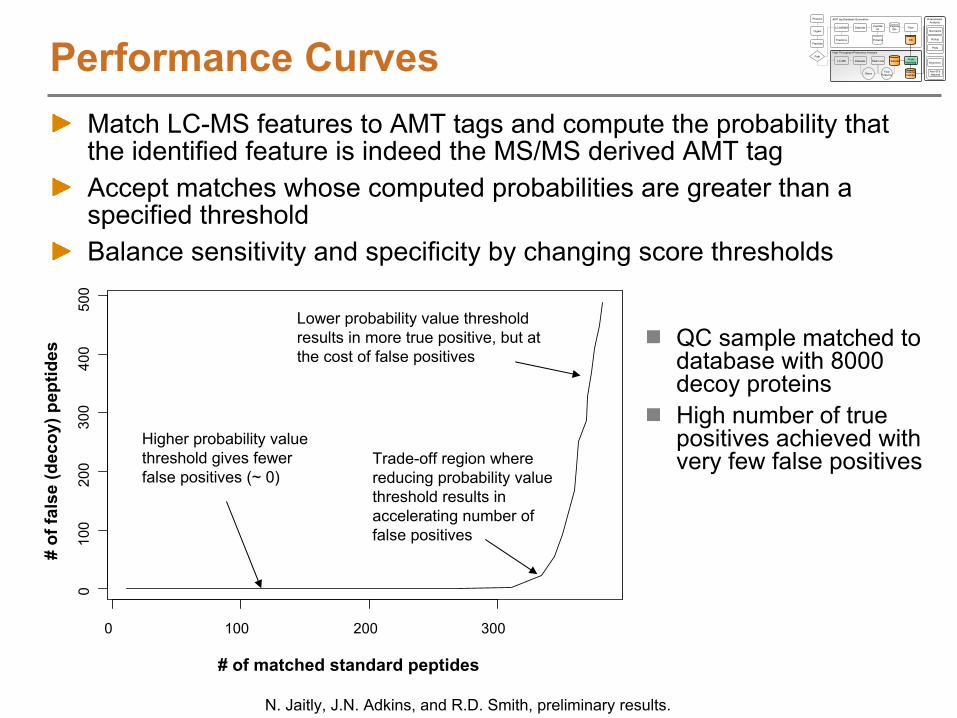
Performance Curves
Higher probability value threshold gives fewer false positives (~ 0)
Lower probability value threshold results in more true positive, but at the cost of false positives
Trade-off region where reducing probability value threshold results in accelerating number of false positives
0 100 200 300
010
020
030
040
050
0
# of matched standard peptides
# of
fals
e (d
ecoy
) pep
tides
QC sample matched to database with 8000 decoy proteinsHigh number of true positives achieved with very few false positives
Match LC-MS features to AMT tags and compute the probability that the identified feature is indeed the MS/MS derived AMT tagAccept matches whose computed probabilities are greater than a specified thresholdBalance sensitivity and specificity by changing score thresholds
N. Jaitly, J.N. Adkins, and R.D. Smith, preliminary results.
Datasets Peptide
ID
Datasets PeakMatchingFeatures
Peptide
IDs
Deiso Find
Features
LC-MS/MS
Fractions
LC-MS Peak Lists
Proteins
Filter
DB
AMT tag Database Generation
High Throughput Proteomics Analysis
DetectedPeptides
Proteins
Digest
Peptides
Path
Normalize
Rollup
Plots
Alignment
Non-ID'd features
Downstream Analysis

0 5000 10000 15000
0.00
0.05
0.10
0.15
0.20
0.25
0.30
0.35
# of Matches
Est
imat
ed F
DR
SMARTPep Prophet >.99, 4ppm, 0.05 NETPep Prophet >.99, 2ppm, 0.02 NETPep Prophet >.999, 1ppm, 0.01 NET
123
Performance CurvesSalmonella Typhimurium protein extract sample compared to typical criteria
N. Jaitly, J.N. Adkins, and R.D. Smith, preliminary results.
3
2
1
Datasets Peptide
ID
Datasets PeakMatchingFeatures
Peptide
IDs
Deiso Find
Features
LC-MS/MS
Fractions
LC-MS Peak Lists
Proteins
Filter
DB
AMT tag Database Generation
High Throughput Proteomics Analysis
DetectedPeptides
Proteins
Digest
Peptides
Path
Normalize
Rollup
Plots
Alignment
Non-ID'd features
Downstream Analysis

SummaryThe Statistical Method for Assignment of Relative Truth
(SMART) score is a model to estimate confidence of peak matching
SMART provides a measure to prioritize acceptable matches using one number, by defining a probability score combining disparate informationSMART allows calculation of FDR for identifications and estimates the tradeoff between false negatives and false positives
Evaluation shows good correlation with observed number of correct answers
Datasets Peptide
ID
Datasets PeakMatchingFeatures
Peptide
IDs
Deiso Find
Features
LC-MS/MS
Fractions
LC-MS Peak Lists
Proteins
Filter
DB
AMT tag Database Generation
High Throughput Proteomics Analysis
DetectedPeptides
Proteins
Digest
Peptides
Path
Normalize
Rollup
Plots
Alignment
Non-ID'd features
Downstream Analysis
0 5000 10000 15000
0.00
0.05
0.10
0.15
0.20
0.25
# of Matches
Est
imat
ed F
DR
0.30
0.35
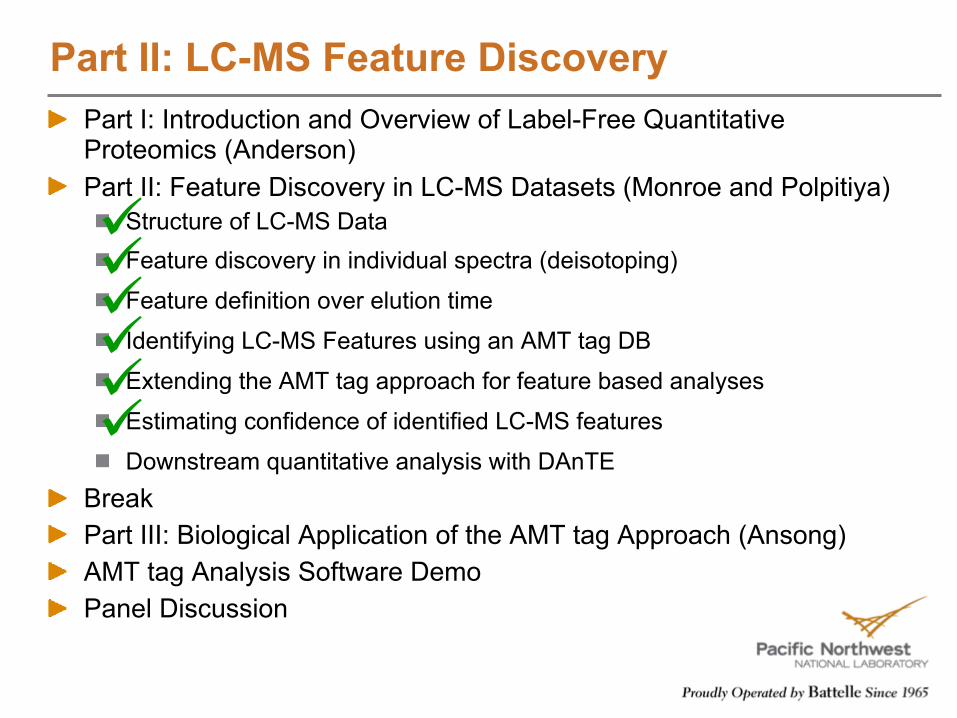
Part II: LC-MS Feature DiscoveryPart I: Introduction and Overview of Label-Free Quantitative Proteomics (Anderson)Part II: Feature Discovery in LC-MS Datasets (Monroe and Polpitiya)
Structure of LC-MS DataFeature discovery in individual spectra (deisotoping)
Feature definition over elution time
Identifying LC-MS Features using an AMT tag DB
Extending the AMT tag approach for feature based analyses
Estimating confidence of identified LC-MS features
Downstream quantitative analysis with DAnTEBreakPart III: Biological Application of the AMT tag Approach (Ansong)AMT tag Analysis Software DemoPanel Discussion

Downstream Data AnalysisQuantitative protein inference from peptide dataComplications
Multiple, possibly inconsistent peptide measurements for same protein Systematic abundance variation within and between conditions
How should we use information from blocking and randomization of experiments?
High rate of missingness in peptide measurementsNeed to combine off the shelf statistical methods and novel solutions
ClusteringANOVAPCA
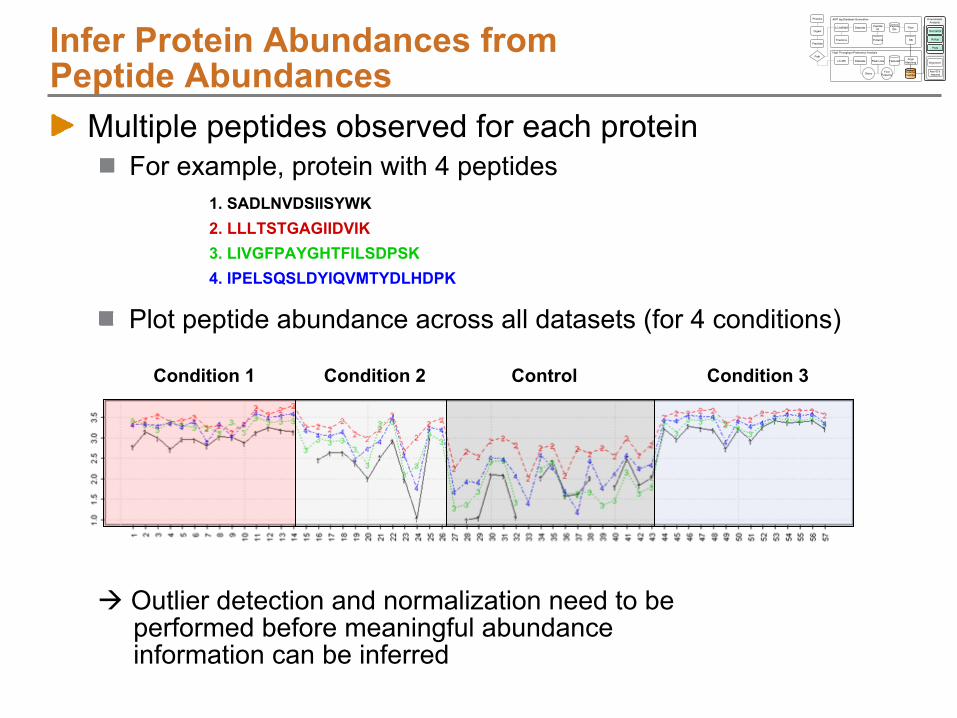
Condition 1 Condition 2 Control Condition 3
Multiple peptides observed for each proteinFor example, protein with 4 peptides
Outlier detection and normalization need to be performed before meaningful abundance information can be inferred
1. SADLNVDSIISYWK2. LLLTSTGAGIIDVIK3. LIVGFPAYGHTFILSDPSK4. IPELSQSLDYIQVMTYDLHDPK
Plot peptide abundance across all datasets (for 4 conditions)
Infer Protein Abundances from Peptide
Abundances
Datasets Peptide
ID
Datasets PeakMatchingFeatures
Peptide
IDs
Deiso Find
Features
LC-MS/MS
Fractions
LC-MS Peak Lists
Proteins
Filter
DB
AMT tag Database Generation
High Throughput Proteomics Analysis
DetectedPeptides
Proteins
Digest
Peptides
Path
Normalize
Rollup
Plots
Alignment
Non-ID'd features
Downstream Analysis

Dataset N
ames
Outlier dataset
Dataset Names
Color legend with overlaid histogram of correlation values
Outlier DetectionDatasets Peptide
ID
Datasets PeakMatchingFeatures
Peptide
IDs
Deiso Find
Features
LC-MS/MS
Fractions
LC-MS Peak Lists
Proteins
Filter
DB
AMT tag Database Generation
High Throughput Proteomics Analysis
DetectedPeptides
Proteins
Digest
Peptides
Path
Normalize
Rollup
Plots
Alignment
Non-ID'd features
Downstream Analysis
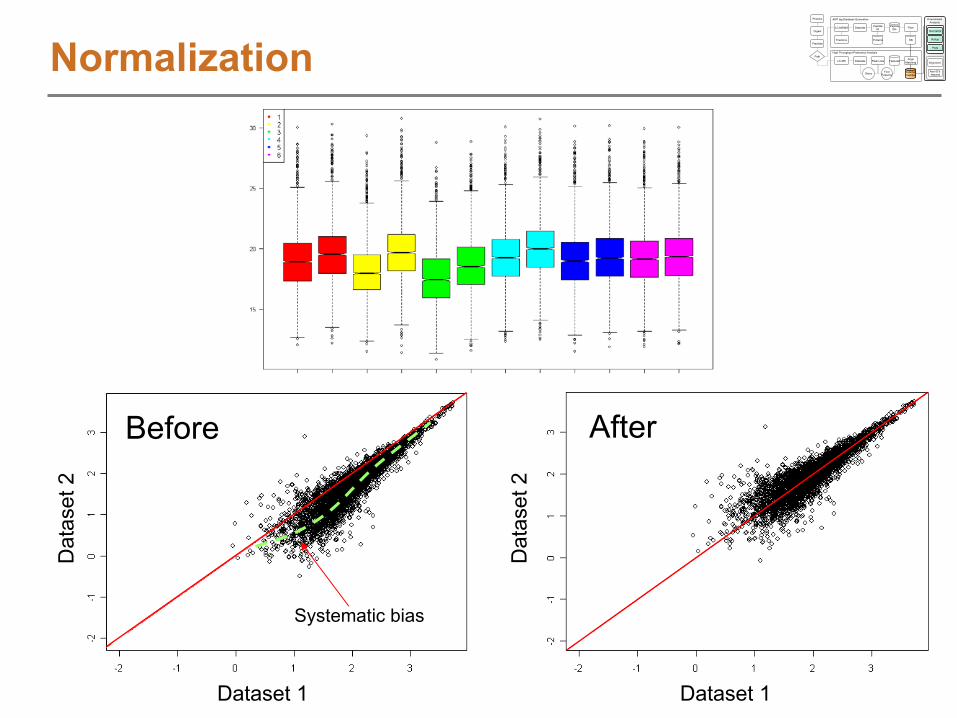
Normalization
Dataset 1
Dat
aset
2
Dat
aset
2
Dataset 1
Systematic bias
Before After
Datasets Peptide
ID
Datasets PeakMatchingFeatures
Peptide
IDs
Deiso Find
Features
LC-MS/MS
Fractions
LC-MS Peak Lists
Proteins
Filter
DB
AMT tag Database Generation
High Throughput Proteomics Analysis
DetectedPeptides
Proteins
Digest
Peptides
Path
Normalize
Rollup
Plots
Alignment
Non-ID'd features
Downstream Analysis
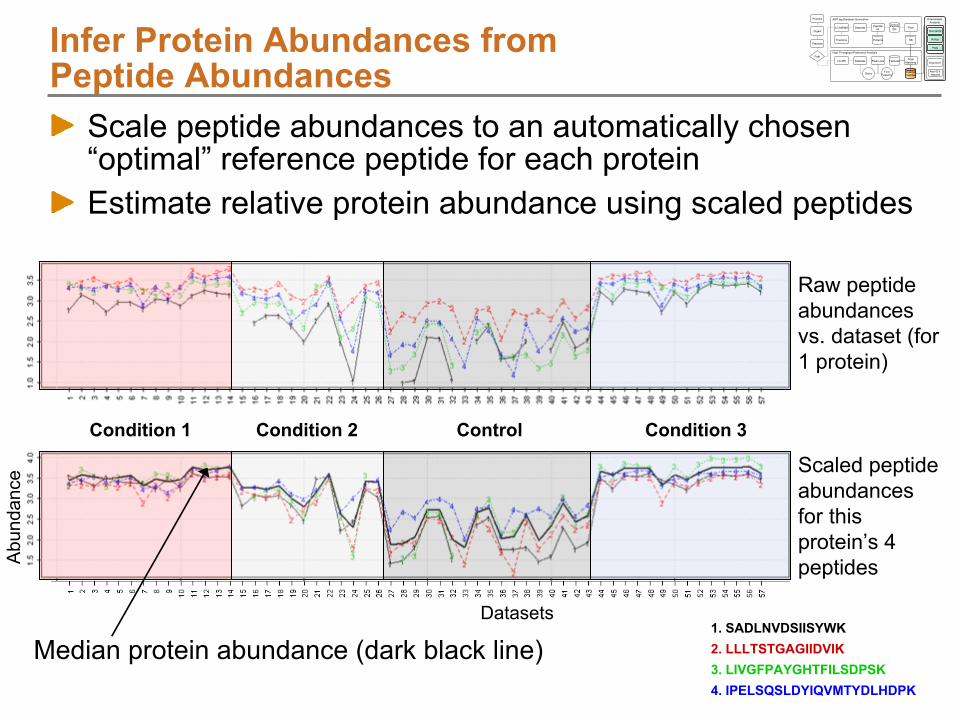
Raw peptide abundances vs. dataset (for 1 protein)
Scaled peptide abundances for this protein’s 4 peptides
Condition 1 Condition 2 Control Condition 3
Median protein abundance (dark black line)Datasets
Abu
ndan
ce
1. SADLNVDSIISYWK2. LLLTSTGAGIIDVIK3. LIVGFPAYGHTFILSDPSK4. IPELSQSLDYIQVMTYDLHDPK
Infer Protein Abundances from Peptide
Abundances
Datasets Peptide
ID
Datasets PeakMatchingFeatures
Peptide
IDs
Deiso Find
Features
LC-MS/MS
Fractions
LC-MS Peak Lists
Proteins
Filter
DB
AMT tag Database Generation
High Throughput Proteomics Analysis
DetectedPeptides
Proteins
Digest
Peptides
Path
Normalize
Rollup
Plots
Alignment
Non-ID'd features
Downstream Analysis
Scale peptide abundances to an automatically chosen “optimal”
reference peptide for each protein
Estimate relative protein abundance using scaled peptides

Capture experimental design through factors:• Biological conditions• Biological replicates• Technical replicates
DAnTE: Data Analysis Tool ExtensionDatasets Peptide
ID
Datasets PeakMatchingFeatures
Peptide
IDs
Deiso Find
Features
LC-MS/MS
Fractions
LC-MS Peak Lists
Proteins
Filter
DB
AMT tag Database Generation
High Throughput Proteomics Analysis
DetectedPeptides
Proteins
Digest
Peptides
Path
Normalize
Rollup
Plots
Alignment
Non-ID'd features
Downstream Analysis
Statistical tool designed to address
analysis needs associated with quantitative bottom-up, proteomics data.

Downstream Data AnalysisChallenge:
With thousands of peptides/proteins in hundreds of samples, how does one mine the data for significant
trends of interest?
General Analysis Steps in DAnTE:Outliers: identify bad datasetsNormalization: remove any systematic variations
due to instrument/sample processing etc.“Rollup”: infer protein abundances from peptide abundancesANOVA: look for statistically significant
featuresCluster: explore trends/patterns
Datasets Peptide
ID
Datasets PeakMatchingFeatures
Peptide
IDs
Deiso Find
Features
LC-MS/MS
Fractions
LC-MS Peak Lists
Proteins
Filter
DB
AMT tag Database Generation
High Throughput Proteomics Analysis
DetectedPeptides
Proteins
Digest
Peptides
Path
Normalize
Rollup
Plots
Alignment
Non-ID'd features
Downstream Analysis

DAnTE
Biological InterpretationsVIPER
Tabular Data(raw abundances, exp. ratio values, spectral counts)
Multialign
Proteins, peptides and peptide abundances
AMT tag pipeline
Where does DAnTE fit in?Datasets Peptide
ID
Datasets PeakMatchingFeatures
Peptide
IDs
Deiso Find
Features
LC-MS/MS
Fractions
LC-MS Peak Lists
Proteins
Filter
DB
AMT tag Database Generation
High Throughput Proteomics Analysis
DetectedPeptides
Proteins
Digest
Peptides
Path
Normalize
Rollup
Plots
Alignment
Non-ID'd features
Downstream Analysis

Data Loading
• Peptide abundance
• Peptide-Protein relations
• Factors
• Spectral counts
Variance Stabilization
• log2 or log10
• Bias (additive/multiplicative)
Normalization (within a factor)
• Linear Regression
• Local regression (LOESS)
• Quantile
Normalization (across factors)
• Central tendency
•
Median absolute Deviation (MAD)
Investigative Plots
• Histograms
• Boxplots
• Correlation diagrams
• MA Plots
Impute Missing Data
• KNNimpute
• SVDimpute
• Other
Infer Proteins from Peptides
• RRollup
• ZRollup
• QRollup
• Rollup Plots
Statistical Tests
• ANOVA/Non-parametric
• Mix Models
Visualization
• PCA / PLS
• Heatmaps (hierachical,
kmeans)
Other Features
• Filter ANOVA results
• Save session
Easily extendable to plugin more modules
Statistical Environment
DAnTE supports a wide array of interactive
analyses
Datasets Peptide
ID
Datasets PeakMatchingFeatures
Peptide
IDs
Deiso Find
Features
LC-MS/MS
Fractions
LC-MS Peak Lists
Proteins
Filter
DB
AMT tag Database Generation
High Throughput Proteomics Analysis
DetectedPeptides
Proteins
Digest
Peptides
Path
Normalize
Rollup
Plots
Alignment
Non-ID'd features
Downstream Analysis
Proteomics analysis of two Salmonella regulatory knock-out mutants, Hfq
and SmpB
Relevant factor is mutant typeWild type (WT)hfq knock-out mutantsmpB knock-out mutant
Three biological replicates for each mutant
Datasets Peptide
ID
Datasets PeakMatchingFeatures
Peptide
IDs
Deiso Find
Features
LC-MS/MS
Fractions
LC-MS Peak Lists
Proteins
Filter
DB
AMT tag Database Generation
High Throughput Proteomics Analysis
DetectedPeptides
Proteins
Digest
Peptides
Path
Normalize
Rollup
Plots
Alignment
Non-ID'd features
Downstream Analysis
Example Dataset
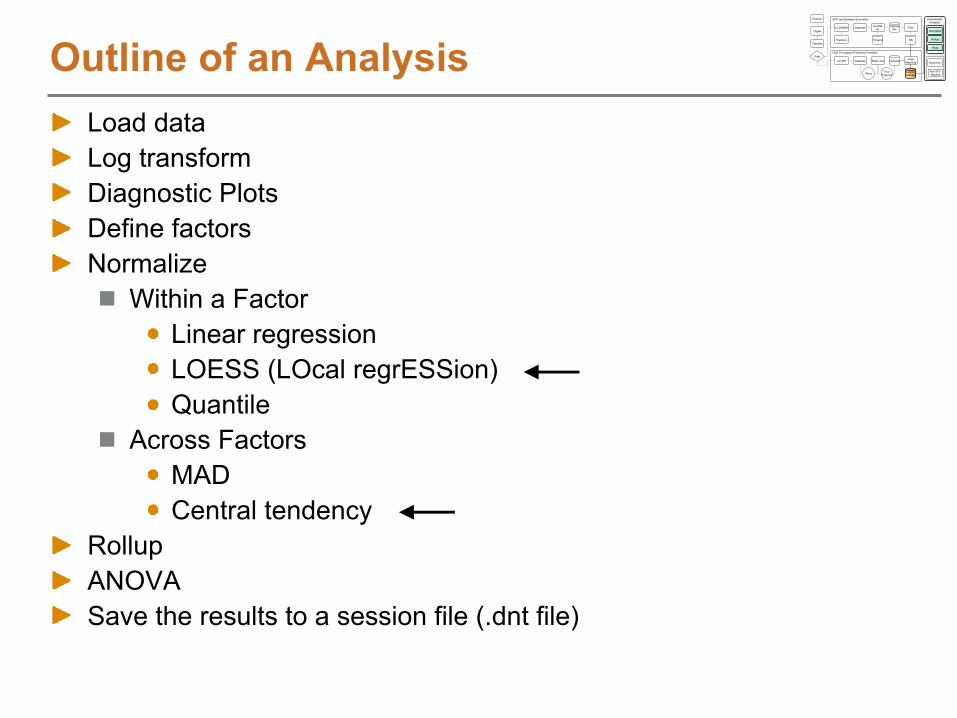
Outline of an AnalysisLoad dataLog transformDiagnostic PlotsDefine factorsNormalize
Within a FactorLinear regressionLOESS (LOcal regrESSion)Quantile
Across FactorsMADCentral tendency
RollupANOVASave the results to a session file (.dnt file)
Datasets Peptide
ID
Datasets PeakMatchingFeatures
Peptide
IDs
Deiso Find
Features
LC-MS/MS
Fractions
LC-MS Peak Lists
Proteins
Filter
DB
AMT tag Database Generation
High Throughput Proteomics Analysis
DetectedPeptides
Proteins
Digest
Peptides
Path
Normalize
Rollup
Plots
Alignment
Non-ID'd features
Downstream Analysis
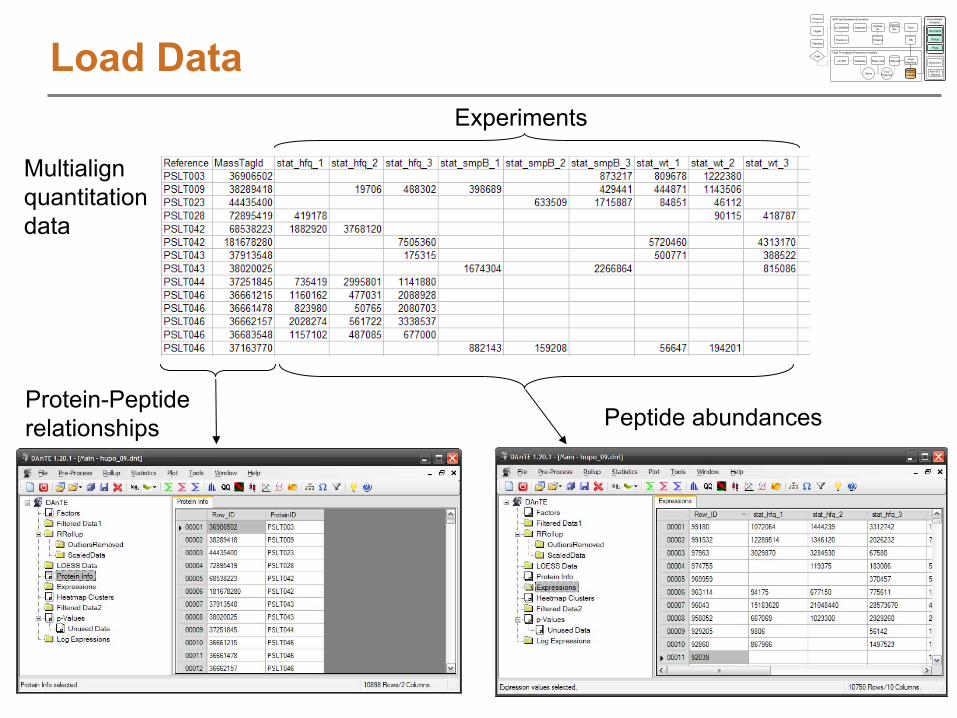
Experiments
Load Data
Multialign quantitation data
Peptide abundancesProtein-Peptide relationships
Datasets Peptide
ID
Datasets PeakMatchingFeatures
Peptide
IDs
Deiso Find
Features
LC-MS/MS
Fractions
LC-MS Peak Lists
Proteins
Filter
DB
AMT tag Database Generation
High Throughput Proteomics Analysis
DetectedPeptides
Proteins
Digest
Peptides
Path
Normalize
Rollup
Plots
Alignment
Non-ID'd features
Downstream Analysis

Sam
ple
Qua
ntile
s
Theoretical Quantiles (Normal)
Prob
abilit
y
Abundance
Diagnostic Plots: NormalityDistribution of abundance values in a single dataset
Should see Normal distribution
Datasets Peptide
ID
Datasets PeakMatchingFeatures
Peptide
IDs
Deiso Find
Features
LC-MS/MS
Fractions
LC-MS Peak Lists
Proteins
Filter
DB
AMT tag Database Generation
High Throughput Proteomics Analysis
DetectedPeptides
Proteins
Digest
Peptides
Path
Normalize
Rollup
Plots
Alignment
Non-ID'd features
Downstream Analysis
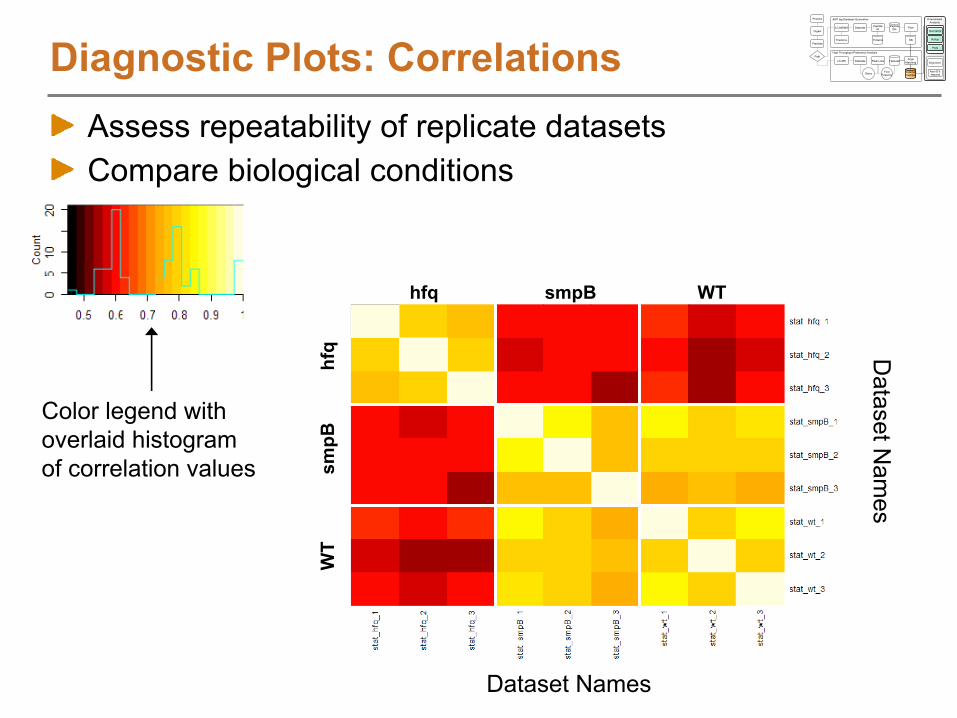
Color legend with overlaid histogram of correlation values
Dataset N
ames
Dataset Names
smpB WThfq
smpB
WT
hfq
Diagnostic Plots: CorrelationsAssess repeatability of replicate datasetsCompare biological conditions
Datasets Peptide
ID
Datasets PeakMatchingFeatures
Peptide
IDs
Deiso Find
Features
LC-MS/MS
Fractions
LC-MS Peak Lists
Proteins
Filter
DB
AMT tag Database Generation
High Throughput Proteomics Analysis
DetectedPeptides
Proteins
Digest
Peptides
Path
Normalize
Rollup
Plots
Alignment
Non-ID'd features
Downstream Analysis
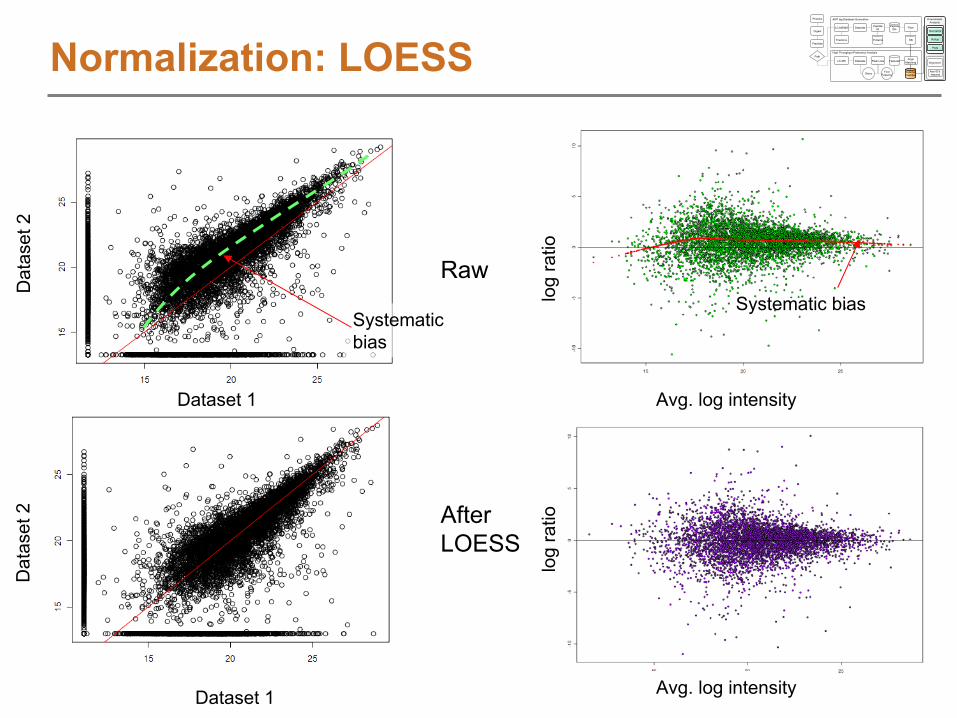
Raw
After LOESS
log
ratio
Avg. log intensity
Avg. log intensity
log
ratio
Systematic bias
Dat
aset
2
Dataset 1
Systematicbias
Dataset 1
Dat
aset
2
Normalization: LOESSDatasets Peptide
ID
Datasets PeakMatchingFeatures
Peptide
IDs
Deiso Find
Features
LC-MS/MS
Fractions
LC-MS Peak Lists
Proteins
Filter
DB
AMT tag Database Generation
High Throughput Proteomics Analysis
DetectedPeptides
Proteins
Digest
Peptides
Path
Normalize
Rollup
Plots
Alignment
Non-ID'd features
Downstream Analysis
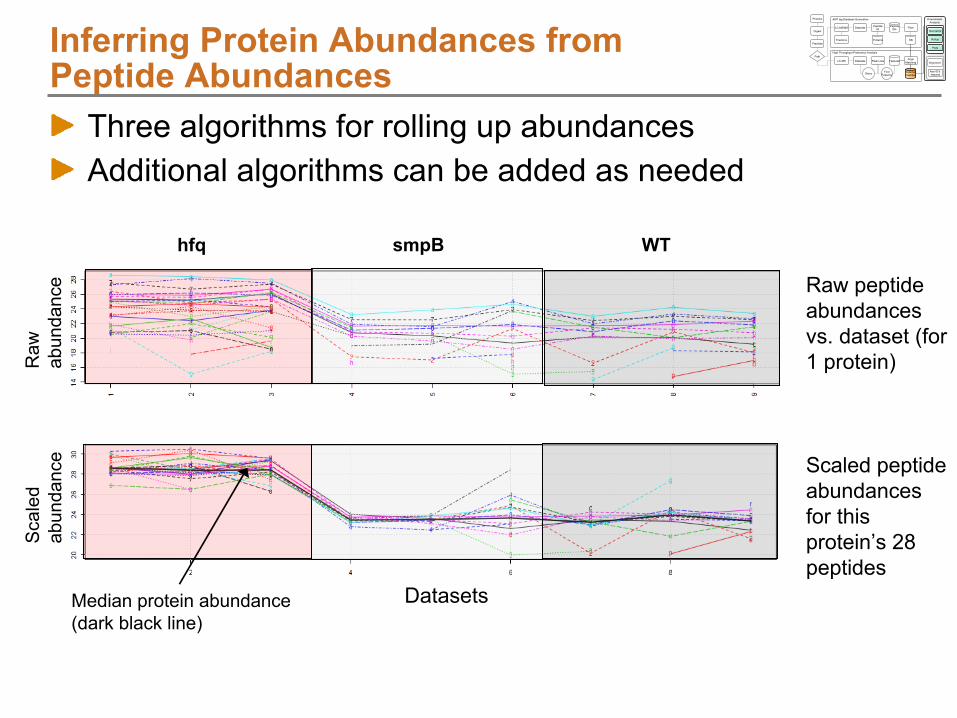
Three algorithms for rolling up abundancesAdditional algorithms can be added as needed
Median protein abundance (dark black line)
smpBhfq WT
Datasets
Raw
abun
danc
eS
cale
dab
unda
nce
Raw peptide abundances vs. dataset (for 1 protein)
Scaled peptide abundances for this protein’s 28 peptides
Inferring Protein Abundances from Peptide
Abundances
Datasets Peptide
ID
Datasets PeakMatchingFeatures
Peptide
IDs
Deiso Find
Features
LC-MS/MS
Fractions
LC-MS Peak Lists
Proteins
Filter
DB
AMT tag Database Generation
High Throughput Proteomics Analysis
DetectedPeptides
Proteins
Digest
Peptides
Path
Normalize
Rollup
Plots
Alignment
Non-ID'd features
Downstream Analysis

Proteins Showing Significant Changes
ANOVA identified 361
proteins with significant abundance changes between the mutants (with an FDR of 5%)Hierarchical clustering groups related proteins
Datasets
Proteins
smpB WThfq
Datasets Peptide
ID
Datasets PeakMatchingFeatures
Peptide
IDs
Deiso Find
Features
LC-MS/MS
Fractions
LC-MS Peak Lists
Proteins
Filter
DB
AMT tag Database Generation
High Throughput Proteomics Analysis
DetectedPeptides
Proteins
Digest
Peptides
Path
Normalize
Rollup
Plots
Alignment
Non-ID'd features
Downstream Analysis
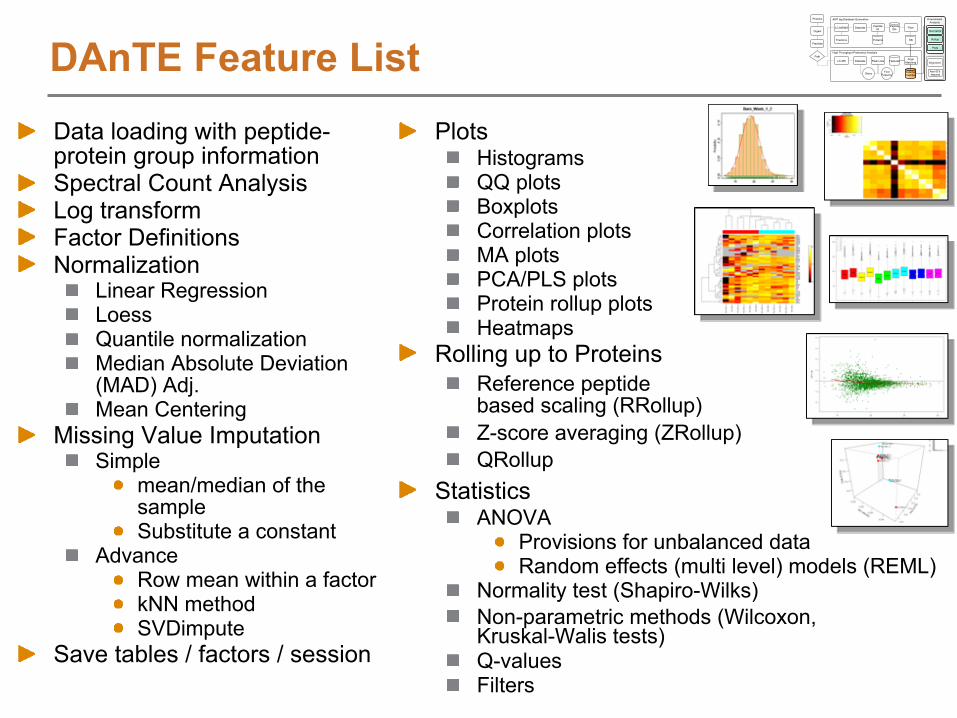
PlotsHistogramsQQ plotsBoxplotsCorrelation plotsMA plotsPCA/PLS plotsProtein rollup plotsHeatmaps
Rolling up to ProteinsReference peptide based scaling (RRollup)Z-score averaging (ZRollup)QRollup
StatisticsANOVA
Provisions for unbalanced dataRandom effects (multi level) models (REML)
Normality test (Shapiro-Wilks)Non-parametric methods (Wilcoxon, Kruskal-Walis tests)Q-valuesFilters
Data loading with peptide-
protein group informationSpectral Count AnalysisLog transform Factor DefinitionsNormalization
Linear RegressionLoessQuantile normalizationMedian Absolute Deviation (MAD) Adj.Mean Centering
Missing Value ImputationSimple
mean/median of the sampleSubstitute a constant
AdvanceRow mean within a factorkNN methodSVDimpute
Save tables / factors / session
DAnTE Feature ListDatasets Peptide
ID
Datasets PeakMatchingFeatures
Peptide
IDs
Deiso Find
Features
LC-MS/MS
Fractions
LC-MS Peak Lists
Proteins
Filter
DB
AMT tag Database Generation
High Throughput Proteomics Analysis
DetectedPeptides
Proteins
Digest
Peptides
Path
Normalize
Rollup
Plots
Alignment
Non-ID'd features
Downstream Analysis
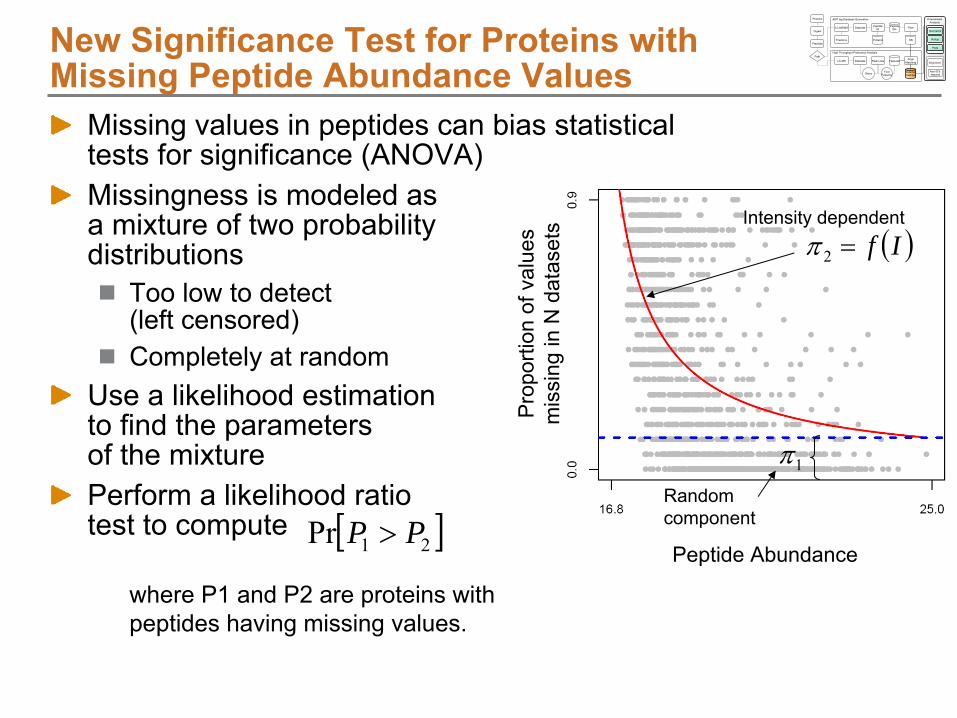
New Significance Test for Proteins with Missing
Peptide Abundance Values
If2Intensity dependent
1Random component
Missing values in peptides can bias statistical tests for significance (ANOVA)Missingness is modeled as a mixture of two probability distributions
Too low to detect (left censored)Completely at random
Use a likelihood estimation to find the parameters of the mixturePerform a likelihood ratio test to compute
where P1 and P2 are proteins with peptides having missing values.
21Pr PP Peptide Abundance
Pro
porti
on o
f val
ues
mis
sing
in N
dat
aset
s
Datasets Peptide
ID
Datasets PeakMatchingFeatures
Peptide
IDs
Deiso Find
Features
LC-MS/MS
Fractions
LC-MS Peak Lists
Proteins
Filter
DB
AMT tag Database Generation
High Throughput Proteomics Analysis
DetectedPeptides
Proteins
Digest
Peptides
Path
Normalize
Rollup
Plots
Alignment
Non-ID'd features
Downstream Analysis
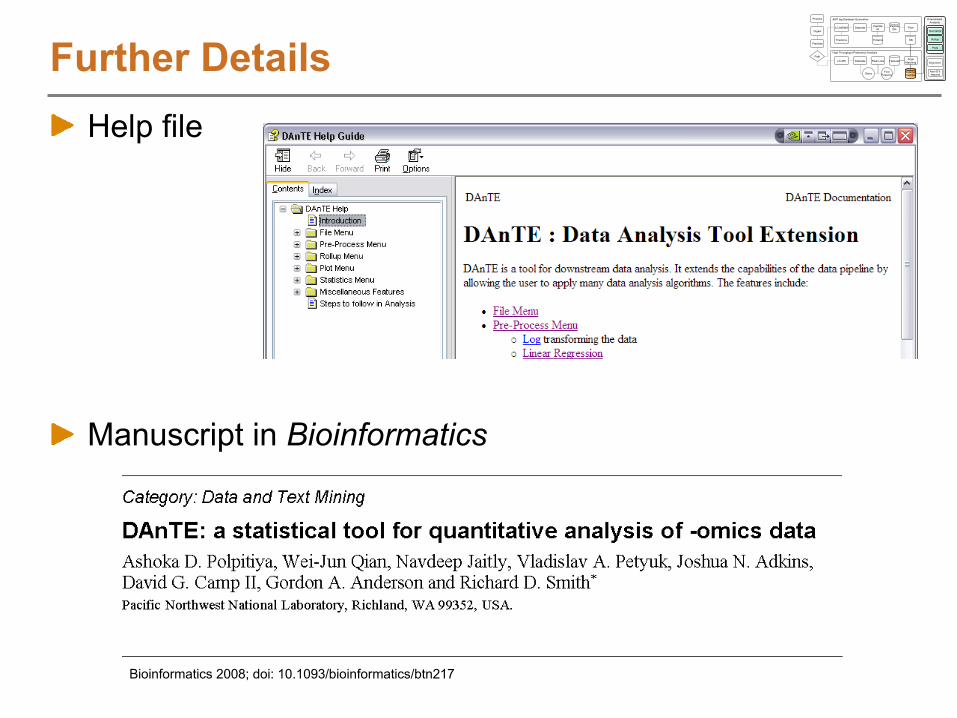
Further DetailsHelp file
Manuscript in Bioinformatics
Bioinformatics 2008; doi: 10.1093/bioinformatics/btn217
Datasets Peptide
ID
Datasets PeakMatchingFeatures
Peptide
IDs
Deiso Find
Features
LC-MS/MS
Fractions
LC-MS Peak Lists
Proteins
Filter
DB
AMT tag Database Generation
High Throughput Proteomics Analysis
DetectedPeptides
Proteins
Digest
Peptides
Path
Normalize
Rollup
Plots
Alignment
Non-ID'd features
Downstream Analysis

Part III: Biological ApplicationPart I: Introduction and Overview of Label-Free Quantitative Proteomics (Anderson)Part II: Feature Discovery in LC-MS Datasets (Monroe and Polpitiya)BreakPart III: Biological Application of the AMT tag Approach (Ansong)
Salmonella TyphimuriumAMT tag Analysis Software DemoPanel Discussion
Biological Application of the AMT tag Approach
Salmonella
Typhimurium projects to be discussed:
Global role of translational regulation in control of gene expression
Identification of targets for therapeutic intervention
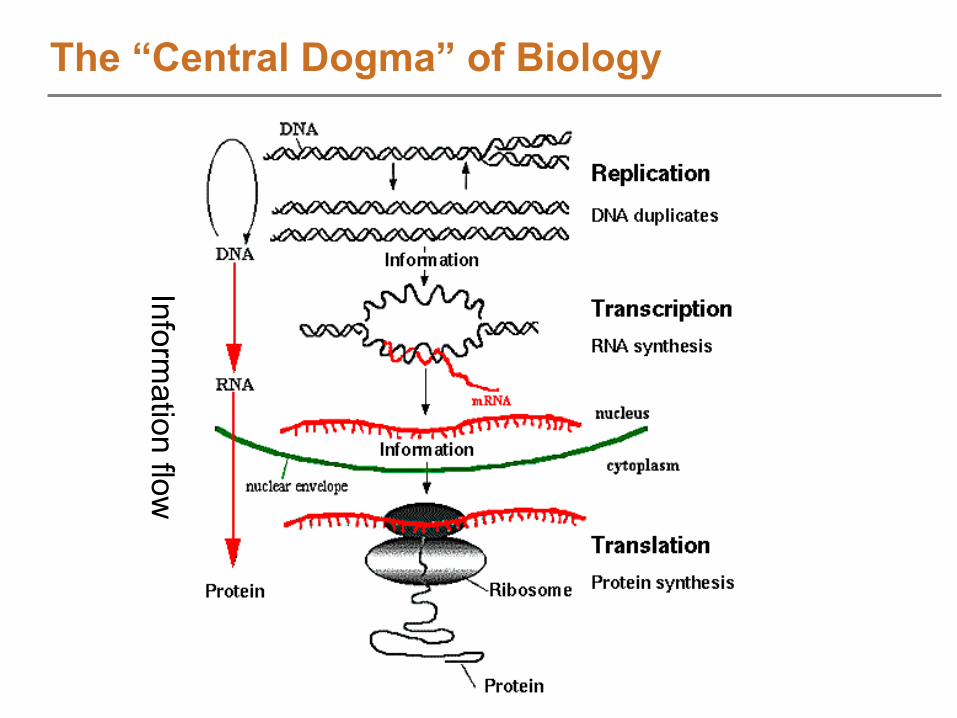
Information flow
The “Central Dogma”
of Biology
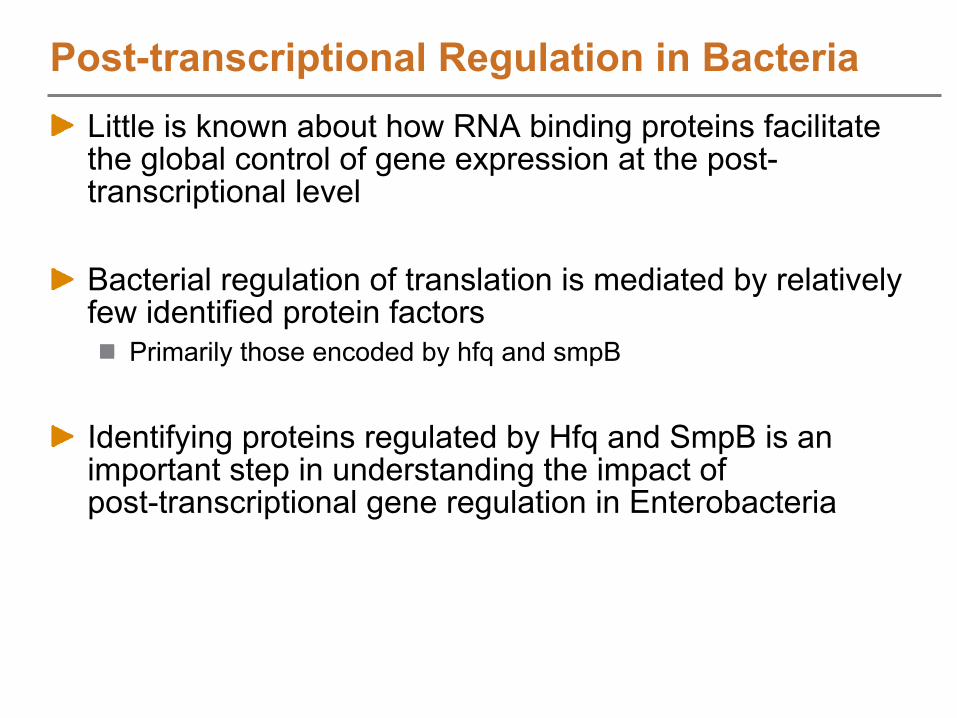
Post-transcriptional Regulation in BacteriaLittle is known about how RNA binding proteins facilitate the global control of gene expression at the post-
transcriptional level
Bacterial regulation of translation is mediated by relatively few identified protein factors
Primarily those encoded by hfq and smpB
Identifying proteins regulated by Hfq and SmpB is an important step in understanding the impact of post-transcriptional gene regulation in Enterobacteria

Post-transcriptional Regulation in Bacteria: Global identification of Hfq targets in Salmonella
Hfq strongly binds to RNA molecules
Binding is somewhat non-specific
Possibility of spurious results introduced by tagging and/or co-IP
Identify proteins translationally regulated
Pyrosequencing to detect Hfq-associated RNA
Determine transcript changes on DNA microarrays
Adapted from Sittka et al. PLoS Genetics
2008
Identify proteins translationally regulated
Determine protein changesby global proteomics
Determine transcript changes on DNA microarrays
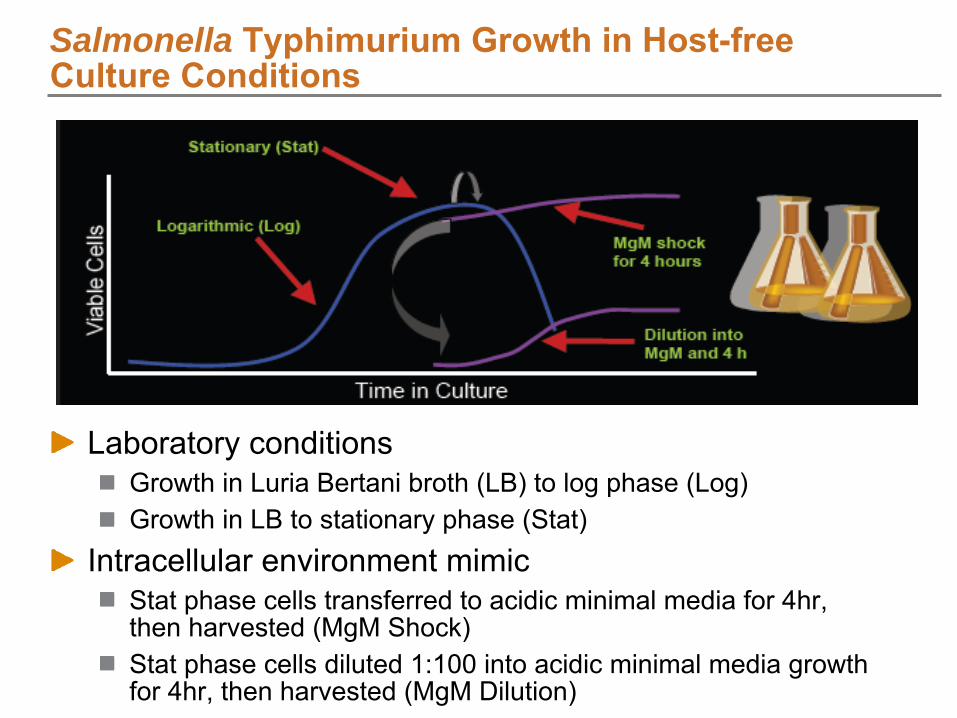
Salmonella Typhimurium Growth in Host-free Culture Conditions
Laboratory conditionsGrowth in Luria Bertani broth (LB) to log phase (Log)Growth in LB to stationary phase (Stat)
Intracellular environment mimicStat phase cells transferred to acidic minimal media for 4hr, then harvested (MgM Shock)Stat phase cells diluted 1:100 into acidic minimal media growth for 4hr, then harvested (MgM Dilution)

SmpBWild-type HfqMutant
Biological Rep.
Cell Fraction
Analytical Rep.
X4 Growth Conditions
216 global proteome analyses for 2 mutantsLC-MS analysis order blocked and randomized
Experimental Design: The Need/Use for Increased Throughput
Replicate analysis to account for natural biological and normal analytical variation
Ansong PLoS ONE 2009–
In press
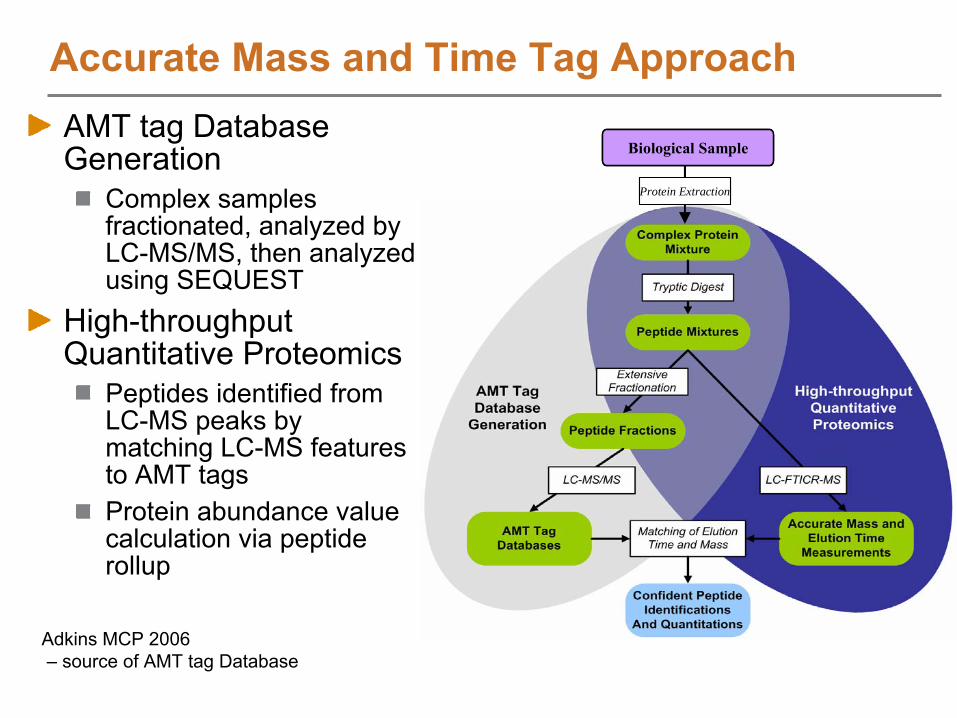
Protein Extraction
Biological Sample
Protein Extraction
Biological Sample
Accurate Mass and Time Tag ApproachAMT tag Database Generation
Complex samples fractionated, analyzed by LC-MS/MS, then analyzed using SEQUEST
High-throughput Quantitative Proteomics
Peptides identified from
LC-MS peaks by matching LC-MS features to AMT tagsProtein abundance value calculation via peptide rollup
Adkins MCP 2006–
source of AMT tag Database

AMT tag Database OverviewAMT tag database
3 Salmonella
Typhimurium growth conditionsAnalyzed both unfractionated and SCX fractionated samples for each condition932 LC-MS/MS analyses
Primarly used two Thermo LTQ mass spectrometers65 days of instrument acquisition time
Data processed with MASIC and SEQUEST74,000 AMT tags pass filters
LC-MS DataFour growth conditions for three mutants216 LC-MS analyses over 16 days of instrument time on a Thermo LTQ-orbitrap mass spectrometer
Note: equivalent LC-MS/MS analyses would require 300 daysData processed with Decon2LS and MultiAlignIdentified 27,753 AMT tags with ~1% FDR
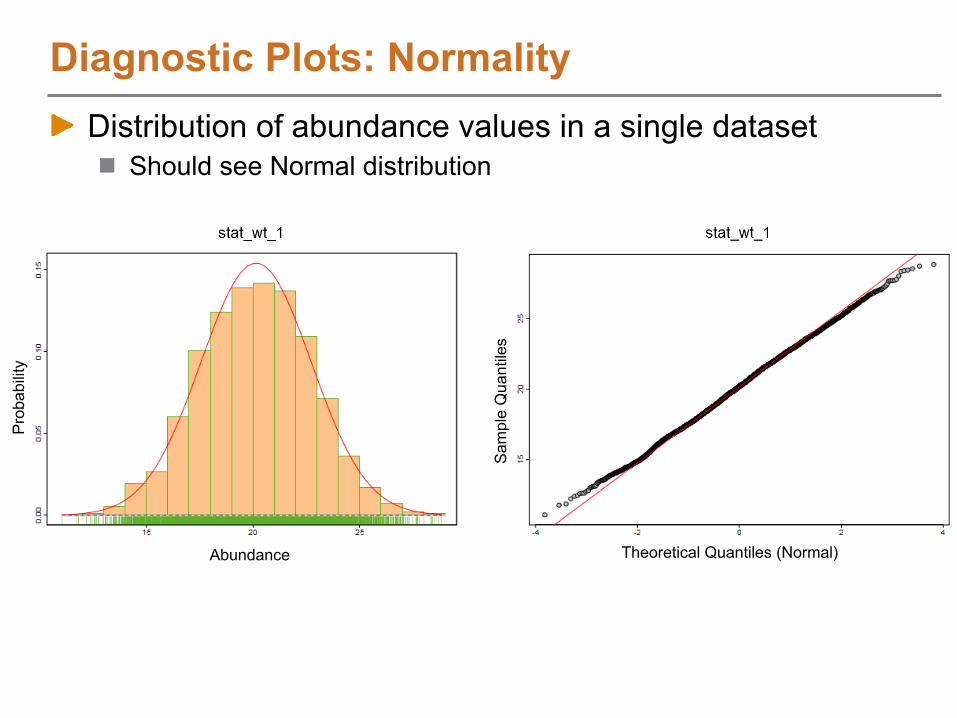
Sam
ple
Qua
ntile
s
Theoretical Quantiles (Normal)
Prob
abilit
y
Abundance
Diagnostic Plots: NormalityDistribution of abundance values in a single dataset
Should see Normal distribution
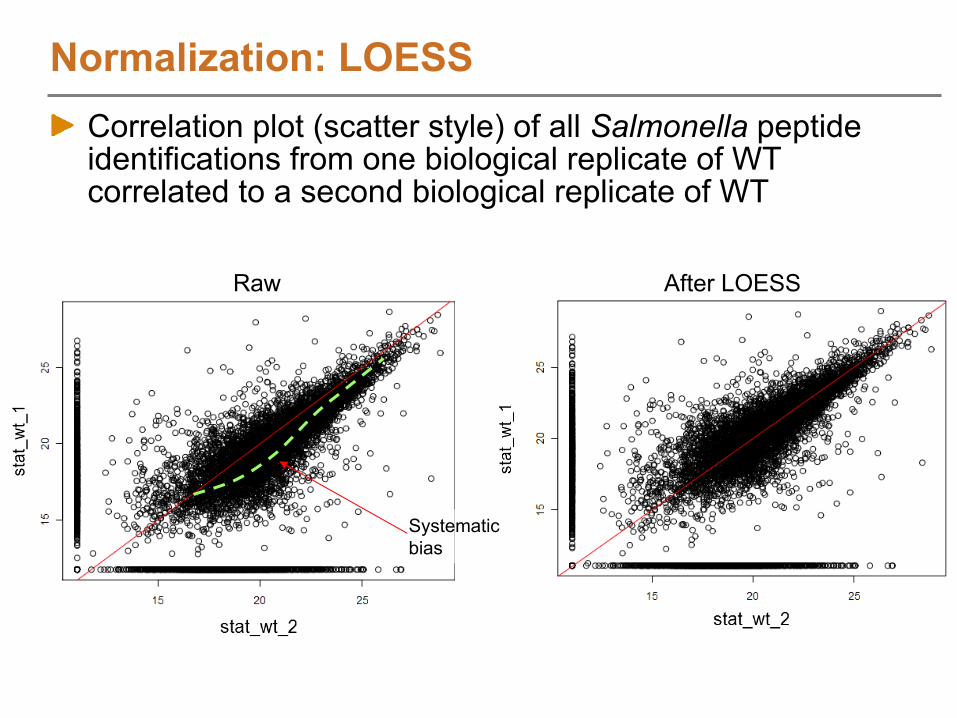
Normalization: LOESS
Raw
Systematicbias
After LOESS
Correlation plot (scatter style) of all Salmonella
peptide identifications from one biological replicate of WT correlated to a second biological replicate of WT
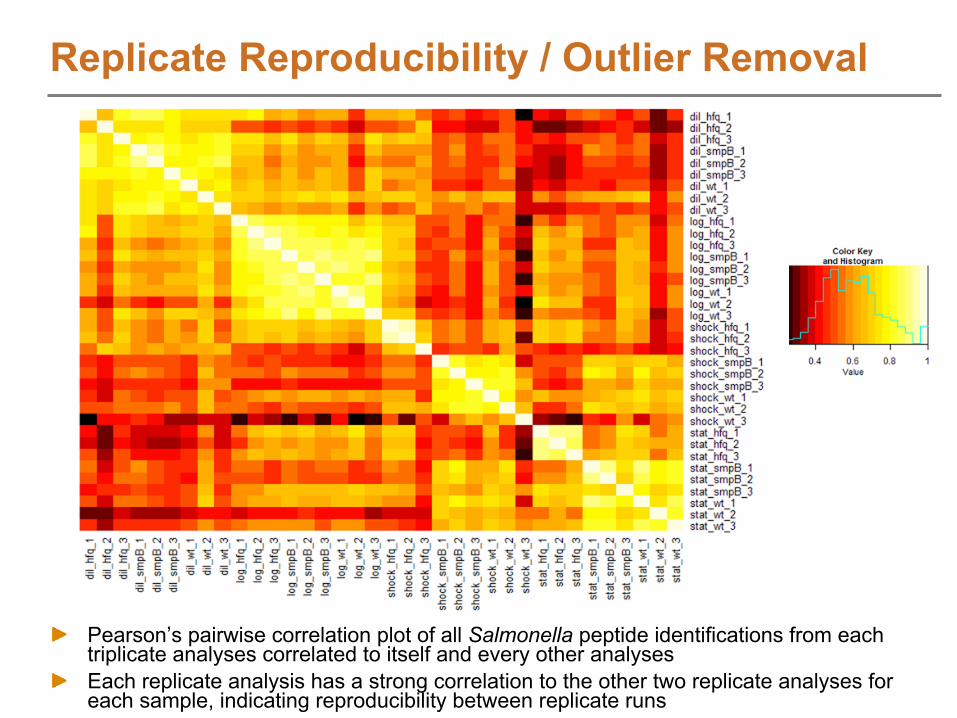
Replicate Reproducibility / Outlier Removal
Pearson’s pairwise correlation plot of all Salmonella
peptide identifications from each triplicate analyses correlated to itself and every other analysesEach replicate analysis has a strong correlation to the other two replicate analyses for each sample, indicating reproducibility between replicate runs

~20,000 Peptides Clustered
Represents~1600 Proteins
~36% coverage of Salmonella
proteome
Biological replicates
have good agreement
Peptide Abundance Overviewhf
q D
il
hfq
Shoc
k
hfq
Log
hfq
Stat
smpb
Dil
smpb
Sho
ck
smpb
Log
smpb
Sta
t
Wild
type
Dil
WT
Shoc
k
WT
Log
WT
Stat
Ansong PLoS ONE 2009–
In press

Subset of Proteins Showing Significant Changes
Salmonella
WT and hfq mutant grown in LB to Stat phaseANOVA between the two groups
270 proteins show significant changes for a false discovery rate of 5%
10 groups via K-means clustering
Proteins
Datasets
hfq WT
Ansong PLoS ONE 2009–
In press

SmpB-regulated proteins: 189
Hfq-regulated proteins: 781 113 SmpB-regulated
proteins: 189Hfq-regulated proteins: 781 113
Unknown funct ion
Unclassified
Trans port and binding proteins
Trans cript ion
Signal transduction
Regulatory func tions
Purines , py rim idines, nuc leosides, and nuc leotides
Prote in s ynthesis
Prote in fate
Mobile and extrachrom os om alelement funct ions
Hypothetica l prote ins
Fatty acid and phospholipidmetabolism
Energy m etabolism
DNA metabolism
Cent ral interm ediary metabolism
Cellu lar proc esses
Cell env elope
Bios ynthes is of cofactors , prosthet ic groups, and carriers
Am ino ac id biosy nthes is
Func tional Categories
13.3749.012799202
11.7053.19115094
13.2753.981561113
12.9041.9441331
0.0028.57027
6.1041.4653482
7.8151.5653364
10.2745.891567146
15.0548.39144593
35.2947.066817
3.7033.331927
2.7855.5612036
9.6059.6024149250
12.5048.2172756
19.7748.84174286
18.8063.252274117
7.6344.271058131
6.4536.5663493
17.8644.05153784
% SmpBregulated
% Hfqregulated
SmpBregulated
Hfqregulated
T ota l of observed proteome
Functional Analysis
Ansong PLoS ONE 2009–
In press
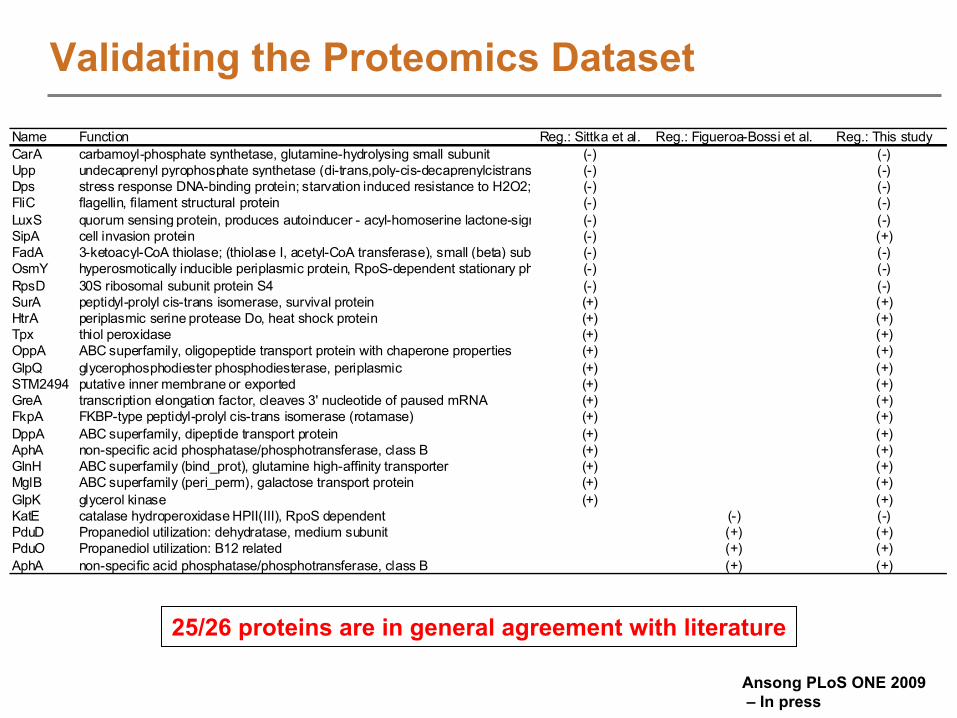
Name Function Reg.: Sittka et al. Reg.: Figueroa-Bossi et al. Reg.: This studyCarA carbamoyl-phosphate synthetase, glutamine-hydrolysing small subunit (-) (-)Upp undecaprenyl pyrophosphate synthetase (di-trans,poly-cis-decaprenylcistrans (-) (-)Dps stress response DNA-binding protein; starvation induced resistance to H2O2; (-) (-)FliC flagellin, filament structural protein (-) (-)LuxS quorum sensing protein, produces autoinducer - acyl-homoserine lactone-sign (-) (-)SipA cell invasion protein (-) (+)FadA 3-ketoacyl-CoA thiolase; (thiolase I, acetyl-CoA transferase), small (beta) sub (-) (-)OsmY hyperosmotically inducible periplasmic protein, RpoS-dependent stationary ph (-) (-)RpsD 30S ribosomal subunit protein S4 (-) (-)SurA peptidyl-prolyl cis-trans isomerase, survival protein (+) (+)HtrA periplasmic serine protease Do, heat shock protein (+) (+)Tpx thiol peroxidase (+) (+)OppA ABC superfamily, oligopeptide transport protein with chaperone properties (+) (+)GlpQ glycerophosphodiester phosphodiesterase, periplasmic (+) (+)STM2494 putative inner membrane or exported (+) (+)GreA transcription elongation factor, cleaves 3' nucleotide of paused mRNA (+) (+)FkpA FKBP-type peptidyl-prolyl cis-trans isomerase (rotamase) (+) (+)DppA ABC superfamily, dipeptide transport protein (+) (+)AphA non-specific acid phosphatase/phosphotransferase, class B (+) (+)GlnH ABC superfamily (bind_prot), glutamine high-affinity transporter (+) (+)MglB ABC superfamily (peri_perm), galactose transport protein (+) (+)GlpK glycerol kinase (+) (+)KatE catalase hydroperoxidase HPII(III), RpoS dependent (-) (-)PduD Propanediol utilization: dehydratase, medium subunit (+) (+)PduO Propanediol utilization: B12 related (+) (+)AphA non-specific acid phosphatase/phosphotransferase, class B (+) (+)
25/26 proteins are in general agreement with literature
Validating the Proteomics Dataset
Ansong PLoS ONE 2009–
In press
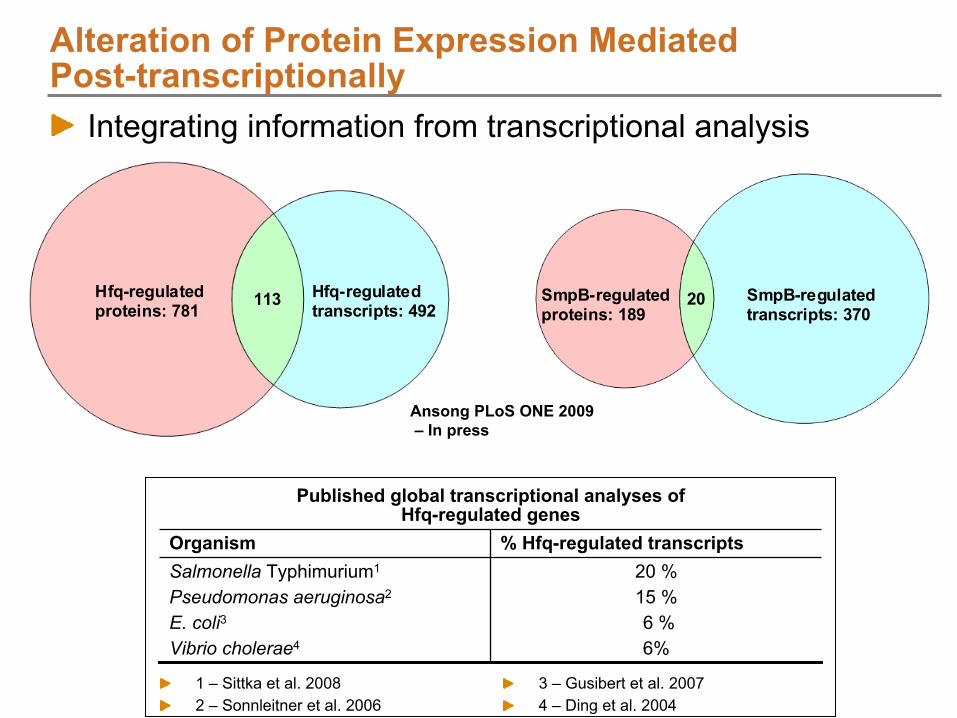
113Hfq-regulated proteins: 781
Hfq-regulated transcripts: 492113Hfq-regulated
proteins: 781Hfq-regulated transcripts: 492
20SmpB-regulated proteins: 189
SmpB-regulated transcripts: 370
20SmpB-regulated proteins: 189
SmpB-regulated transcripts: 370
Published global transcriptional analyses of Hfq-regulated genes
Organism % Hfq-regulated transcriptsSalmonella Typhimurium1
Pseudomonas aeruginosa2
E. coli3
Vibrio cholerae4
20 %15 %6 %6%
Alteration of Protein Expression Mediated Post-transcriptionally
Integrating information from transcriptional analysis
1 –
Sittka et al. 20082 –
Sonnleitner et al. 20063 –
Gusibert et al. 20074 –
Ding et al. 2004
Ansong PLoS ONE 2009–
In press

Validation of Translational Regulation in Salmonella: The propanediol utilization (pdu) operonLC-MS analysis of protein levels
pdu required for replication in macrophagesDeletion of hfq or smpB reduces expression of Pdu proteins levels, but mRNA levels show no changeSuggests role for translational regulation in Salmonella
pathogenesis
Confirmatory western blot analysis
qRT-PCR analysis of mRNA levels
Pdu
Peptides
Pdu
Peptides
stat
_hfq
stat
_sm
pB
stat
_WT
-2 20
Ansong PLoS ONE 2009–
In press
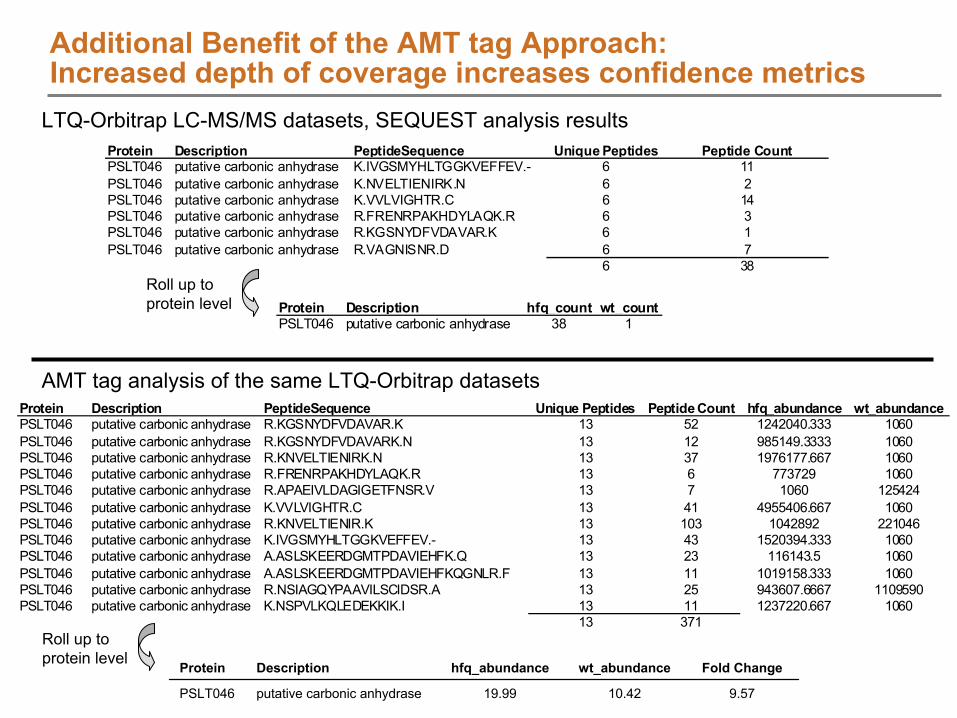
Protein Description PeptideSequence Unique Peptides Peptide CountPSLT046 putative carbonic anhydrase K.IVGSMYHLTGGKVEFFEV.- 6 11PSLT046 putative carbonic anhydrase K.NVELTIENIRK.N 6 2PSLT046 putative carbonic anhydrase K.VVLVIGHTR.C 6 14PSLT046 putative carbonic anhydrase R.FRENRPAKHDYLAQK.R 6 3PSLT046 putative carbonic anhydrase R.KGSNYDFVDAVAR.K 6 1PSLT046 putative carbonic anhydrase R.VAGNISNR.D 6 7
6 38
Protein Description hfq_count wt_countPSLT046 putative carbonic anhydrase 38 1
Protein Description PeptideSequence Unique Peptides Peptide Count hfq_abundance wt_abundancePSLT046 putative carbonic anhydrase R.KGSNYDFVDAVAR.K 13 52 1242040.333 1060PSLT046 putative carbonic anhydrase R.KGSNYDFVDAVARK.N 13 12 985149.3333 1060PSLT046 putative carbonic anhydrase R.KNVELTIENIRK.N 13 37 1976177.667 1060PSLT046 putative carbonic anhydrase R.FRENRPAKHDYLAQK.R 13 6 773729 1060PSLT046 putative carbonic anhydrase R.APAEIVLDAGIGETFNSR.V 13 7 1060 125424PSLT046 putative carbonic anhydrase K.VVLVIGHTR.C 13 41 4955406.667 1060PSLT046 putative carbonic anhydrase R.KNVELTIENIR.K 13 103 1042892 221046PSLT046 putative carbonic anhydrase K.IVGSMYHLTGGKVEFFEV.- 13 43 1520394.333 1060PSLT046 putative carbonic anhydrase A.ASLSKEERDGMTPDAVIEHFK.Q 13 23 116143.5 1060PSLT046 putative carbonic anhydrase A.ASLSKEERDGMTPDAVIEHFKQGNLR.F 13 11 1019158.333 1060PSLT046 putative carbonic anhydrase R.NSIAGQYPAAVILSCIDSR.A 13 25 943607.6667 1109590PSLT046 putative carbonic anhydrase K.NSPVLKQLEDEKKIK.I 13 11 1237220.667 1060
13 371
Protein Description hfq_abundance wt_abundance Fold Change
PSLT046 putative carbonic anhydrase 19.99 10.42 9.57
Roll up to protein level
LTQ-Orbitrap LC-MS/MS
datasets, SEQUEST analysis results
Additional Benefit of the AMT tag Approach: Increased depth of coverage increases confidence metrics
AMT tag analysis of the same LTQ-Orbitrap datasets
Roll up to protein level
S. Typhimurium: Public health burdenBacterial pathogen with a broad host rangeHumans: causes salmonellosis (severe form of food poisoning)
Potentially life threatening to infants, elderly, and immuno-
compromised40,000+ reported salmonellosis cases/year in the U.S. Financial cost ~ $3 billion/year
(Tauxe 1986, USDA 07/08)Isolates becoming resistant to frontline antibiotics (fluoroquinolone drugs, Lowry 2006)Imperative to identify new targets for therapeutic intervention
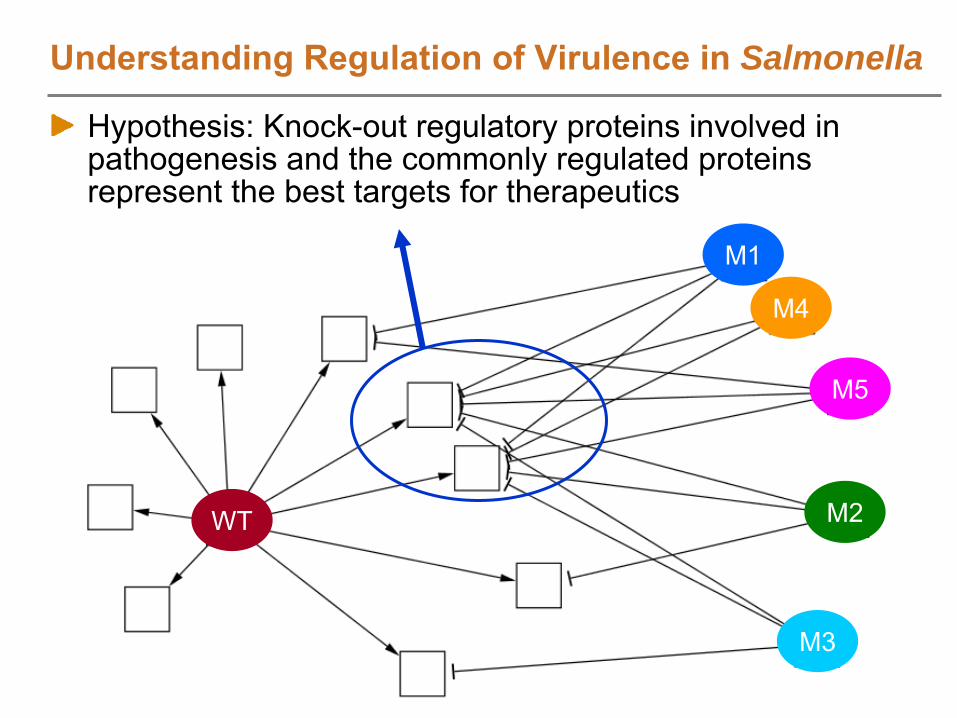
Understanding Regulation of Virulence in Salmonella
Hypothesis: Knock-out regulatory proteins involved in pathogenesis and the commonly regulated proteins represent the best targets for therapeutics
WT
M1
M2
M3
M4
M5
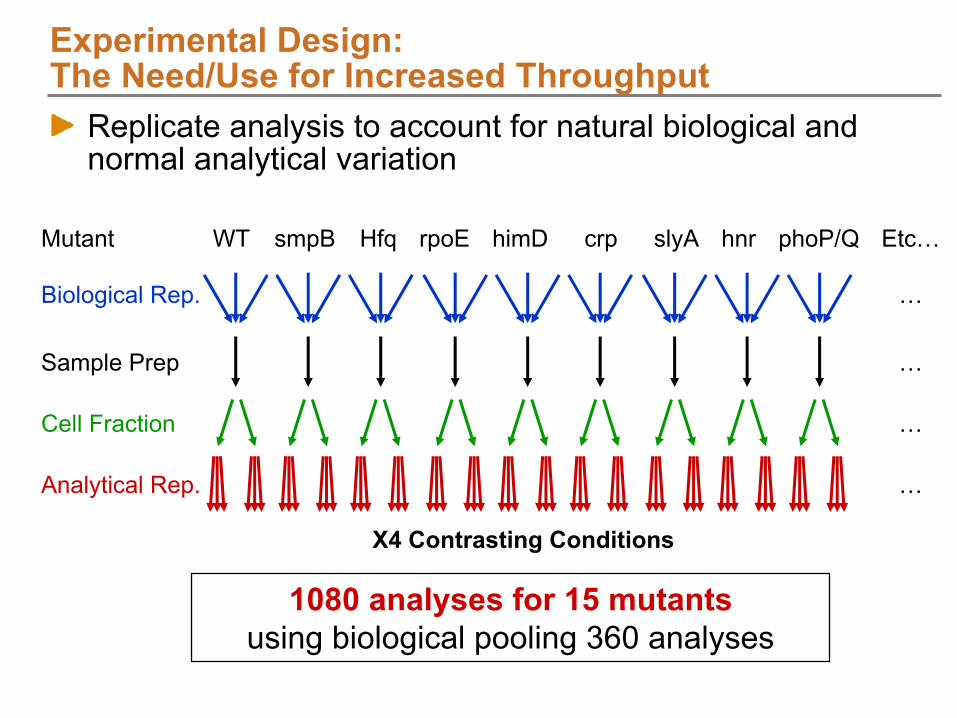
Experimental Design: The Need/Use for Increased Throughput
Replicate analysis to account for natural biological and normal analytical variation
X4 Contrasting Conditions
smpBWT HfqMutant
Biological Rep.
Cell Fraction
Analytical Rep.
Sample Prep
himD phoP/QslyA hnrrpoE crp Etc…
…
…
…
…
1080 analyses for 15 mutantsusing biological pooling 360 analyses

Protein Extraction
Biological Sample
Protein Extraction
Biological Sample
Accurate Mass and Time Tag ApproachAMT tag Database Generation
Complex samples fractionated, analyzed by LC-MS/MS, then analyzed using SEQUEST
High-throughput Quantitative Proteomics
Peptides identified from
LC-MS peaks by matching LC-MS features to AMT tagsProtein abundance value calculation

AMT tag Database OverviewAMT tag database
4 Salmonella
Typhimurium growth conditionsAnalyzed both unfractionated and SCX fractionated samples for each condition1349 LC-MS/MS analyses
Primarily used two Thermo LTQ's
and one LTQ-Orbitrap77 days of instrument time
Data processed with MASIC and SEQUEST70,000 AMT tags pass filters
LC-MS DataFour growth conditions for three mutants409 LC-MS analyses over 10 days of instrument time on a Thermo LTQ-orbitrap mass spectrometer (30 minute separations)
Note: equivalent LC-MS/MS analyses would require 450 daysData processed with Decon2LS and VIPERIdentified 16,367 AMT tags with ~1% FDR
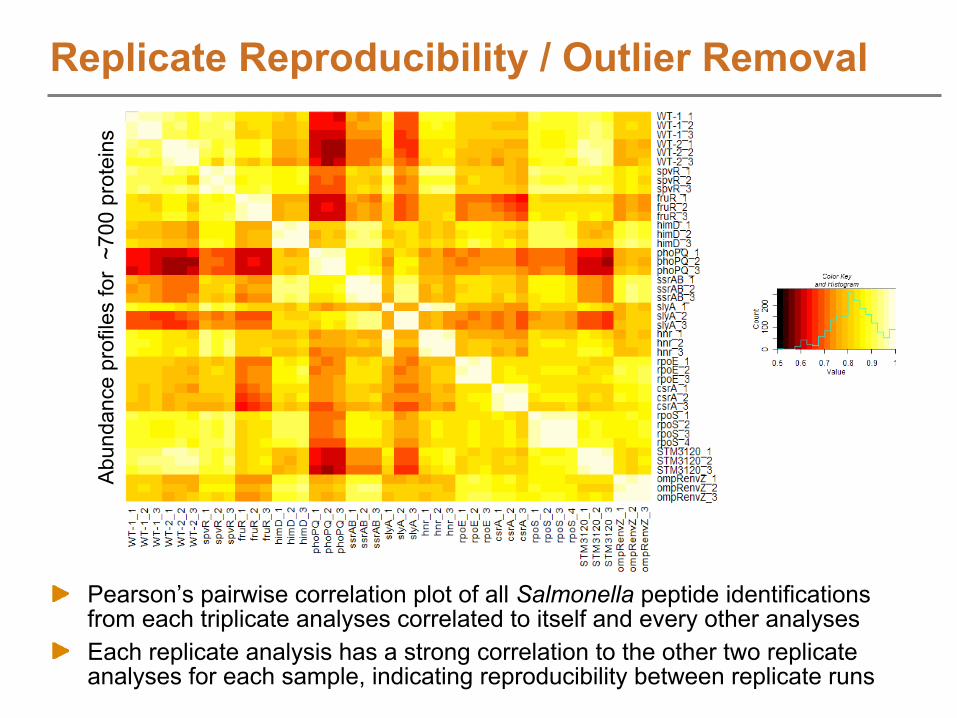
Replicate Reproducibility / Outlier Removal
Pearson’s pairwise correlation plot of all Salmonella
peptide identifications from each triplicate analyses correlated to itself and every other analysesEach replicate analysis has a strong correlation to the other two replicate analyses for each sample, indicating reproducibility between replicate runs
Abu
ndan
ce p
rofil
es fo
r ~7
00 p
rote
ins

ConclusionThe AMT tag approach and the associated informatics pipeline enables Systems Biology experiments that would be impractical using shotgun proteomics and/or chemical/labeling methods
Lipidomics
Metabolomics
Transcriptomics
Proteomics
Integrated with Computational Modeling
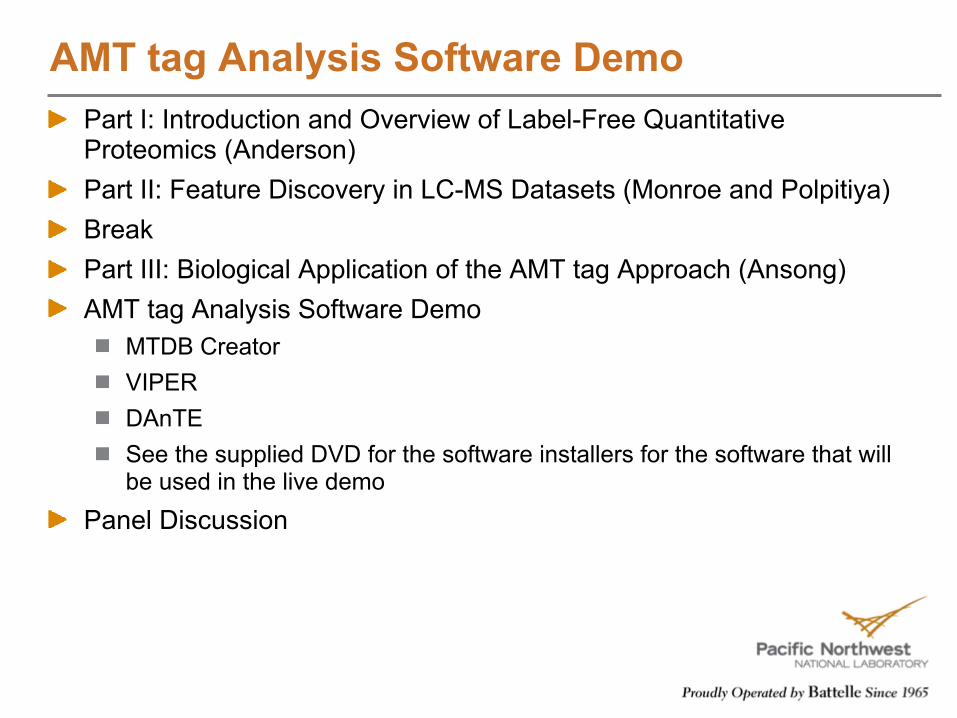
AMT tag Analysis Software DemoPart I: Introduction and Overview of Label-Free Quantitative Proteomics (Anderson)Part II: Feature Discovery in LC-MS Datasets (Monroe and Polpitiya)BreakPart III: Biological Application of the AMT tag Approach (Ansong)AMT tag Analysis Software Demo
MTDB CreatorVIPERDAnTESee the supplied DVD for the software installers for the software that will be used in the live demo
Panel Discussion

Salmonella Typhimurium, LC-MS/MSGrown in LB (Luria-Bertani) up to log phase“Mini AMT tag”
database, composed of 25 SCX fractions analyzed by LC-MS/MSMass and time tag database composed from searches using X!Tandem (Log E_Value ≤
-2)Linear alignment of datasets for AMT tag database
LC-FTICR-MS analysis (LTQ-Orbitrap)Knock-out mutant sample, grown and prepared in the same conditionsNon-linear alignment and peak matching to the database
Example Data for the AMT tag Software Demo
AMT tag Software DemoThanks to the many developers, beta testers, and users
Note: PNNL is always looking for good and knowledgeable informatics staff and post-docs. See
us afterward
for more information, or visit http://jobs.pnl.gov/
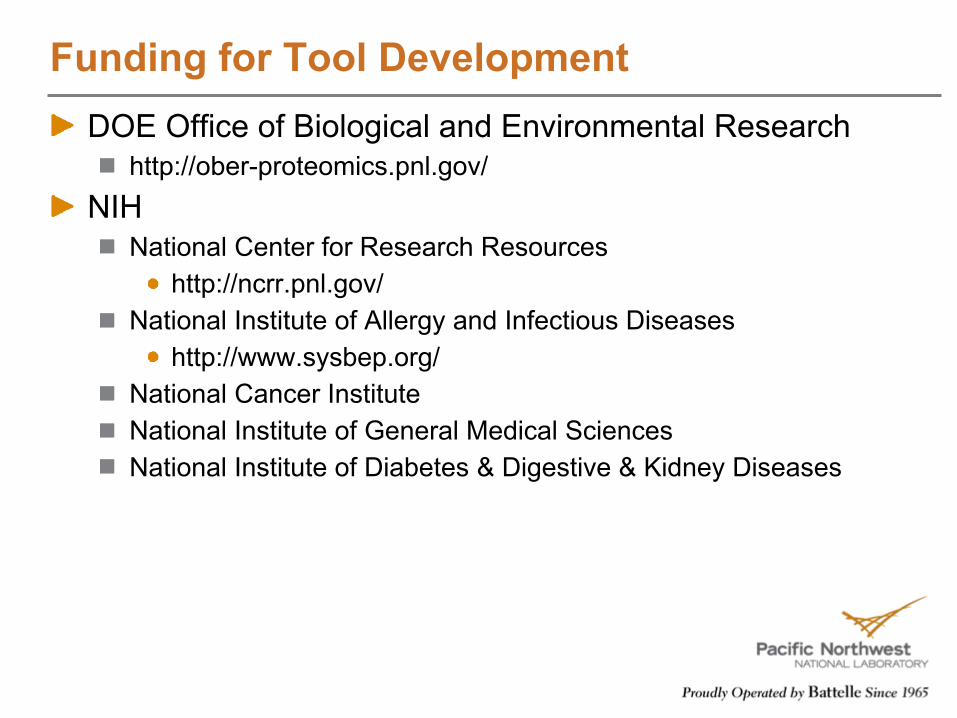
Funding for Tool DevelopmentDOE Office of Biological and Environmental Research
http://ober-proteomics.pnl.gov/NIH
National Center for Research Resourceshttp://ncrr.pnl.gov/
National Institute of Allergy and Infectious Diseaseshttp://www.sysbep.org/
National Cancer InstituteNational Institute of General Medical SciencesNational Institute of Diabetes & Digestive & Kidney Diseases

See the supplied DVD for the software installers for the software that will be used in the live demo
MTDB Creator\Software_Installers\MTDBCreator\MTDBCreatorInstall.msiData file: \Software_Installers\MTDBCreator\data\DatasetsDescription.txt
VIPER\Software_Installers\VIPER\VIPER_Installer.msi\Software_Installers\VIPER\LCMSFeatureFinder (Install this after installing Viper).msiData file: \VIPER_Data\MT_S_typhimurium_X347\Job219616_LTQ-Orbitrap\Job219616.gel
DAnTE\Software_Installers\DAnTE\R_Installers\R-2.7.2-win32.exe\Software_Installers\DAnTE\R_Installers\RSrv250_pl1.exe\Software_Installers\DAnTE\DAnTE_Standalone_Installer\DAnTESetup.exeData
file: \DAnTE_Data\USHUPO2009_DAnTE_data.dnt
Note: Live demo will not be until the end of the course