Data driven storytelling
22
Data Driven Storytelling “The universe is not made of atoms, it is made of stories.” Muriel Rukeyser
-
Upload
nathan-gasser -
Category
Government & Nonprofit
-
view
298 -
download
0
Transcript of Data driven storytelling

Data Driven Storytelling “The universe is not made of atoms, it is made of stories.” Muriel Rukeyser

Why Storytelling?

Humans are wired for storytelling Stories are how we imagine possibilities, encode our values, and teach lessons to the next generation. Stories impart facts, opinions, judgments, and emotions. Stories have a unique power to both inform and persuade.

Why Data?

We live in a results-driven world Nonprofits are expected to be “run like a business” Foundations make “investments”, not grants

Let me tell you a story…

Elements of a good story
Se#ng Where are we? Why are we here?
Characters Protagonists & Antagonists Conflict & Poten8al
Plot Beginning, Middle, End Backstory, Ac8on, Resolu8on
Detail Detail, not digression

Whose story is it? Do you want people to explore and come to their own conclusions? Or you have a message you want them to take away?

How about the data?
Tableau Public Best for: • Making & sharing a quick story • Data you don’t mind making public

#MakeoverMonday

Highcharts Best for: • Web developers who know JavaScript • Embedding in a website with dynamic data
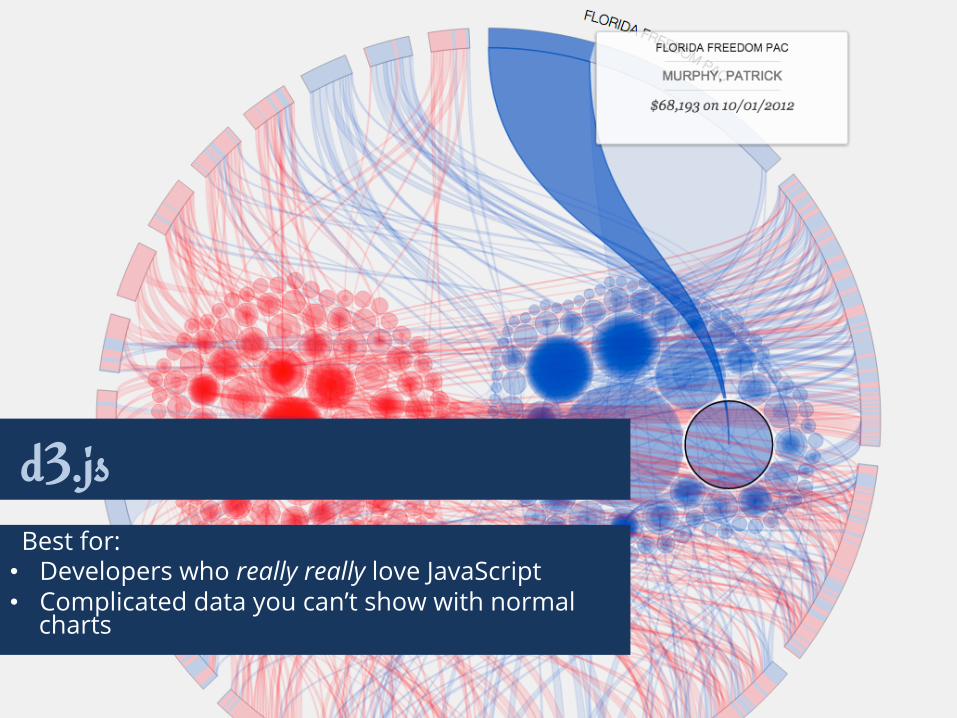
d3.js Best for: • Developers who really really love JavaScript • Complicated data you can’t show with normal
charts

More examples if we have time… • Charts
– http://viz.healthmetricsandevaluation.org/gbd-compare/
• Maps – http://pooreconomics.com/data/country/home
• Interactive – http://foods.bridgingthegapresearch.org
• Immersive Presentation – http://rwjf.org/maketobaccohistory

Data-Driven Storytelling In Ten Easy Steps! 1. Draft your story
2. Gather & process the data
3. Select a presentation style (Classic, funky, map, infographic; interactive vs static) and a tool (Off the shelf? Custom built?)
4. Load the data & create your visualization
5. Add your narrative
6. Make it beautiful
7. Test it and make it better
8. Release it & promote it
9. Keep the data updated (Daily? Yearly? Real-time?)
10. Impact the world

Workshop Time

Your Story • Who are your characters – your heroes
and villains? • Who’s your audience? Do they know
your characters?

Your Data • What data will you need to tell this
story? • Do you have it now, or can you easily
acquire it? • Will it need to be processed and
analyzed, or just presented?

Your Stage • How can you best reach your audience
with this story? – Your website? Social media? Email? Print?
• What do you want them to take away from your story, and what actions can they take?
• How will you measure the impact your story has?

Links n’ Stuff
http://bit.ly/216QxUn