Data-Collection Methods, Quality-Assurance Data, and Site
24
U.S. Department of the Interior U.S. Geological Survey Data-Collection Methods, Quality-Assurance Data, and Site Considerations for Total Dissolved Gas Monitoring, Lower Columbia River, Oregon and Washington, 2000 Water-Resources Investigations Report 01–4005 Prepared in cooperation with the U.S. ARMY CORPS OF ENGINEERS
Transcript of Data-Collection Methods, Quality-Assurance Data, and Site

U.S. Department of the InteriorU.S. Geological Survey
Data-Collection Methods, Quality-Assurance Data, andSite Considerations for Total Dissolved Gas Monitoring,Lower Columbia River, Oregon and Washington, 2000
Water-Resources Investigations Report 01–4005
Prepared in cooperation with theU.S. ARMY CORPS OF ENGINEERS

Cover Photograph. Columbia River at John Day Dam, April 2000. (Photograph by Amy Brooks, U.S. Geological Survey)
U.S. Department of the InteriorU.S. Geological Survey
Data-Collection Methods, Quality-Assurance Data, andSite Considerations for Total Dissolved Gas Monitoring,Lower Columbia River, Oregon and Washington, 2000
By DWIGHT Q. TANNER AND MATTHEW W. JOHNSTON
Water-Resources Investigations Report 01–4005
Prepared in cooperation with theU.S. ARMY CORPS OF ENGINEERS
Portland, Oregon: 2001
U.S. DEPARTMENT OF THE INTERIORBRUCE BABBITT, Secretary
U.S. GEOLOGICAL SURVEYCharles G. Groat, Director
The use of trade, product, or firm names in this publication is fordescriptive purposes only and does not imply endorsement by theU.S. Government.
For additional information contact: Copies of this report can bepurchased from:
District ChiefU.S. Geological Survey USGS Information Services10615 S.E. Cherry Blossom Drive Box 25286, Federal CenterPortland, OR 97216-3159 Denver, CO 80225-0046E-mail: [email protected] Telephone: 1-888-ASK-USGSInternet: http://oregon.usgs.gov
Suggested citation:
Tanner, D.Q., and Johnston, M.W., 2001, Data-collection methods, quality-assurance data, and siteconsiderations for total dissolved gas monitoring, lower Columbia River, Oregon and Washington, 2000:U.S. Geological Survey Water-Resources Investigations Report 01–4005, 19 p.
II

III
CONTENTS
Abstract.................................................................................................................................................................................. 1Introduction ........................................................................................................................................................................... 1
Background.................................................................................................................................................................. 1Purpose and Scope....................................................................................................................................................... 2Acknowledgments ....................................................................................................................................................... 2
Methods of Data Collection................................................................................................................................................... 2Instrumentation............................................................................................................................................................ 2Calibration of Instruments in the Laboratory .............................................................................................................. 4Calibration of Instruments in the Field........................................................................................................................ 6Daily Quality-Assurance Checks.................................................................................................................................12Data Workup and Archive ...........................................................................................................................................13
Summary of Data Completeness and Quality........................................................................................................................15Quality-Assurance Data.........................................................................................................................................................15Site-Specific Considerations..................................................................................................................................................16
Camas ..........................................................................................................................................................................17Skamania .....................................................................................................................................................................18Warrendale...................................................................................................................................................................18Bonneville....................................................................................................................................................................18The Dalles Tailwater....................................................................................................................................................18The Dalles Forebay......................................................................................................................................................19John Day Tailwater ......................................................................................................................................................19John Day Forebay........................................................................................................................................................19
References Cited....................................................................................................................................................................19
FIGURES
1. Total dissolved gas fixed stations, lower Columbia River, Oregon and Washington, water year 2000.......................... 22. Example of a laboratory calibration form ........................................................................................................................ 53. Graph showing the accuracy of total dissolved gas sensors when compared to a primary standard after
field deployment .............................................................................................................................................................. 74. Example of a field inspection/calibration sheet ............................................................................................................... 85. Graphs showing the difference between the secondary standard and the field barometers .............................................106. Graphs showing the difference between the secondary standard and the field thermometers .........................................117. Graphs showing the total dissolved gas difference between the field probe and lab probe initially................................118. Graphs showing the total dissolved gas difference between the field probe and lab probe at the end of
field calibrations ..............................................................................................................................................................129. Example of the checklist for total dissolved gas daily quality-assurance checks ............................................................13
10. Graph showing total dissolved pressure above and below John Day Dam .....................................................................1411. Example of a data table from U.S. Army Corps of Engineers Total Dissolved Gas Reports Web page.........................1412. Graph showing selected total dissolved gas data at the main and duplicate probes at John Day tailwater.....................1613. Graph showing all of the total dissolved gas data at the main and duplicate probes at John Day tailwater....................1614. Graph showing duplicate water temperature data at John Day forebay and water temperature data at
John Day tailwater...........................................................................................................................................................1715. Graph showing duplicate total dissolved gas data at John Day forebay..........................................................................1716. Graph showing compensation depth and actual probe depth at Warrendale ...................................................................19
TABLES
1. Total dissolved gas fixed stations, lower Columbia River, Oregon and Washington, water year 2000 ........................... 32. Total dissolved gas data completeness and quality, water year 2000 ................................................................................15
Data-Collection Methods, Quality-Assurance Data, andSite Considerations for Total Dissolved Gas Monitoring,Lower Columbia River, Oregon and Washington, 2000
By Dwight Q. Tanner and Matthew W. Johnston
ub-
-sl-fs
-ag-
r.
intaa-
er
d
rs
rent
ABSTRACT
Excessive total dissolved gas pressure cancause gas-bubble trauma in fish downstream fromdams on the Columbia River. In cooperation withthe U.S. Army Corps of Engineers, the U.S. Geo-logical Survey collected data on total dissolved gaspressure, barometric pressure, water temperature,and probe depth at eight stations on the lowerColumbia River from the John Day forebay (rivermile 215.6) to Camas (river mile 121.7) in wateryear 2000 (October 1, 1999, to September 30,2000). These data are in the databases of theU.S. Geological Survey and the U.S. Army Corpsof Engineers. Methods of data collection, review,and processing, and quality-assurance data arepresented in this report.
INTRODUCTION
The U.S. Army Corps of Engineers (USACE)operates several dams in the Columbia River Basin,which encompasses 259,000 square miles of the PacificNorthwest. These dams are multipurpose facilities thatfill regional needs for flood control, navigation, irriga-tion, recreation, hydropower production, fish and wild-life habitat, water-quality maintenance, and municipaland industrial water supply. When water is released overthe spillways of these dams, air is entrained in the water,sometimes increasing the concentration of total dis-solved gas (TDG) downstream from the spillways inexcess of the U.S. Environmental Protection Agency’swater-quality criterion of 110-percent saturation for the
protection of freshwater aquatic life. Concentrationsabove this criterion have been shown to cause gas-bble trauma in fish and adversely affect other aquaticorganisms (U.S. Environmental Protection Agency,1986). USACE minimizes spill and regulated streamflow in the region to minimize the production of excesTDG downstream from its dams. USACE collects reatime TDG data (data available within about 4 hours ocurrent time) upstream and downstream from the damin a network of fixed-station monitors.
Background
Real-time TDG data are vital to USACE for damoperation and for monitoring compliance with environmental regulations. The data are used by water maners to maintain water-quality conditions that facilitatefish passage and survival in the lower Columbia RiveThe U.S. Geological Survey (USGS), in cooperationwith the Portland District of USACE, has collectedTDG and related data in the lower Columbia Riverevery year beginning in 1996. A report was published1996 that contained a description of the methods of dacollection, the quality-assurance program, and summries of data (Tanner and others, 1996).
Data-collection methods and quality-assurancplans have changed significantly since 1996. In wateyear 2000, new TDG/temperature probes and newmethods of calibration in the laboratory and in the fielwere used.
To provide a suitable data set for water manageto model TDG in the lower Columbia River, the real-time hourly data for water year 2000 were corrected odeleted to reflect measurements made during instrum
1

p-ald
e
ofon
ebe of
calibration. The reviewed and corrected hourly data arestored in a USGS data base (Automated Data Process-ing System—ADAPS) and in a USACE data base athttp://www.nwd-wc.usace.army.mil/TMT/tdg_data.
Purpose and Scope
The purpose of TDG monitoring is to provideUSACE with (1) real-time data for managing stream-flows and TDG levels upstream and downstream fromits project dams in the lower Columbia River and (2)reviewed and corrected TDG data to evaluate conditionsin relation to water-quality criteria and to develop aTDG data base for modeling the effect of various man-agement scenarios of streamflow and spill on TDGlevels.
This report describes the data-collection tech-niques and quality-assurance data for the TDG monitor-ing program on the Columbia River from the forebay ofthe John Day dam (river mile [RM] 215.6) to Camas(RM 121.7). Data for water year 2000 included totaldissolved gas pressure, barometric pressure, and water-temperature at eight fixed stations on the lower Colum-bia River (fig. 1, table 1).
Acknowledgments
We wish to acknowledge the aid and funding suport of the U.S. Army Corps of Engineers. Our specithanks to James L. Britton (USACE) for technical anlogistical support of the project. The authors alsoacknowledge Amy Brooks and Tirian Mink (USGS)for assistance in data collection and for preparingsummaries of data. Howard E. Harrison, formerly of thUSGS, helped develop several of the data-collectionand quality-assurance protocols.
METHODS OF DATA COLLECTION
Instrumentation
Instrumentation at each fixed station consisteda TDG probe, an electronic barometer, a data-collectiplatform (DCP), and a power supply. The TDG probewas manufactured by Hydrolab Corporation. The probhad individual sensors for TDG, temperature, and prodepth (unvented sensor). The TDG sensor consisteda cylindrical framework wound with a length of Silastic
3
52 18
47
6
EXPLANATION
Monitoring site
8 Map reference number(seeTable1)
Des
chut
es
Will
amet
teRi
ver
River
River
River
Lewis
Cowli tz
Rive
r
John
DayPortland
123° 121°
45°
46°
John Day
Dam
The Dalles
DamBonneville
Dam
Studyarea
Washington
Oregon
PA
CI
FI
C
OC
EA
N
C O L U M B I A
R I V E R
Figure 1 . Total dissolved gas fixed stations, lower Columbia River, Oregon and Washington, water year 2000.
2

3
Table 1. Total dissolved gas fixed stations, lower Columbia River, Oregon and Washington, water year 2000[Map reference number refers to figure 1; USACE, U.S. Army Corps of Engineers; Columbia River mile locations were determined from U.S. Geological Survey (USGS) 7.5-minute topographic maps;stations are referenced by their abbreviated name in this report]
Mapreferencenumber
USACEsite
identifier
ColumbiaRiver mile
USGSstation number
USGS station name(abbreviated station name)
Latitude Longitude Period of record
1 JDA 215.6 454257120413000 Columbia River at John Day Dam forebay, Washington(John Day forebay)
45˚ 42’ 57” 120˚ 41’ 30” March 24 – September 19
2 JHAW 214.7 454249120423500 Columbia River, right bank, near Cliffs, Washington(John Day tailwater)
45˚ 42’ 49” 120˚ 42’ 35” March 23 – September 19
3 TDA 192.6 453712121071200 Columbia River at The Dalles Dam forebay, Washington(The Dalles forebay)
45˚ 37’ 12” 121˚ 07’ 12” March 24 – September 20
4 TDDO 188.9 14105700 Columbia River at The Dalles, Oregon(The Dalles downstream)
45˚ 36’ 27” 121˚ 10’ 20” March 23 – September 19
5 BON 146.1 453845121562000 Columbia River at Bonneville Dam forebay, Washington(Bonneville forebay)
45˚ 38’ 45” 121˚ 56’ 20” Year-round
6 SKAW 140.5 453651122022200 Columbia River, right bank, near Skamania, Washington(Skamania)
45˚ 36’ 51” 122˚ 02’ 22” February 23 – September 18
7 WRNO 140.4 453630122021400 Columbia River, left bank, near Dodson, Oregon(Warrendale)
45˚ 36’ 30” 122˚ 02’ 14” Year-round
8 CWMW 121.7 453439122223900 Columbia River, right bank, at Washougal, Washington(Camas)
45˚ 34’ 39” 122˚ 22’ 39” February 24 – September 18
al
ntty
y
lyck-t
ls
d
tond-
al
ent
hti-f
Gs-m
ed
ro-
reea-i-
(dimethyl silicon) tubing. The tubing was tied off at oneend and the other end was connected to a pressure trans-ducer. After the TDG pressure in the river equilibratedwith the gas pressure inside the tubing (about 15 to 20minutes), the pressure transducer produced a measureof the TDG pressure in the river. The water-temperaturesensor was a thermocouple. The barometer was con-tained in the display unit of the Model TBO-L, a totaldissolved gas meter manufactured by Common Sens-ing, Inc.
The TDG probe was connected by a heavy-duty,weatherproof cable to a Sutron Model 8200 DCP. TheDCP had three basic functions: sensor interfacing, datastorage, and data transmission to the GeostationaryOperational Environmental Satellite (GOES) system(Jones and others, 1991). A crossed Yagi antenna wasconnected to the DCP using a coaxial cable. Theantenna was mounted on a mast to provide transmissionto the GOES system.
The barometer, TDG probe, and the DCP werepowered by a 12-volt gelled-electrolyte battery. Thebattery was charged by a regulated-voltage circuit froma solar panel and/or a 120-volt alternating-current line.
The DCP was programmed to record and transmitfive parameters: barometric pressure (in millimeters ofmercury), TDG pressure (in millimeters of mercury),probe depth (in feet), water temperature (in degreesCelsius), and battery voltage (in volts). Battery-voltagedata were monitored to determine whether the instru-mentation was receiving adequate power. The data foreach parameter were logged electronically every hour,on the hour, and stored in the DCP memory. Every 4hours, the DCP transmitted the most recent 12 hours oflogged data to the GOES satellite. Consequently, eachpiece of data was transmitted three times to protectagainst data loss. The GOES satellite retransmitted thedata to a direct readout ground station, where the datawere automatically decoded and transferred to theUSACE data base (Columbia River OperationHydromet Management System—CHROMS), and tothe USGS ADAPS data base. During the fixed-stationcalibration visits, the DCP-stored data were down-loaded to a palmtop computer. When it was necessary tofill in any real-time data lost during satellite transmis-sion, these data were supplied to USACE and alsoloaded into the database at the USGS office in Portland,Oregon.
At one site, John Day tailwater, two TDG probeswere installed inside the same probe housing, whichwas perforated at the end and extended into the flow of
the Columbia River. The primary probe was at the distend of the plastic pipe and the secondary probe waslocated about 1 foot (measured vertically) above thefirst. This was done for the following reasons: (1) toensure that data were reliably collected at this importasite and (2) to provide an assessment of the variabiliof the TDG measurement.
Calibration of Instruments in the Laboratory
The fixed station monitors were calibrated ever2 weeks from March 10 to September 15, 2000, andevery 3 weeks for the remainder of the year, at whichtime Warrendale and Bonneville forebay were the onsites in operation. The general procedure was to chethe operation of the TDG probe in the field without disturbing it, replace the field probe with one that had jusbeen calibrated in the laboratory, and then check theoperation of the newly deployed field probe. The detaiof the laboratory calibration procedure follow.
Each time a TDG probe was removed from its2- or 3-week deployment in the river, it was calibratein the Oregon District laboratory before being rede-ployed. First, the TDG value in millimeters of mercurywas measured in ambient conditions with the TDGmembrane still attached to the sensor and comparedthe ambient barometric pressure as measured by a haheld aneroid barometer (fig. 2, item 1). (The aneroidbarometer was calibrated every 2 weeks at the NationWeather Service facility in Portland, Oregon.) If themeasurement by the TDG probe and the measuremby the aneroid barometer were approximately equal,this check was considered acceptable.
Pressure calibrations were done using a NetecDigiMano 2000 digital pressure gage, which was cerfied according to standards of the National Institute oStandards and Technology (NIST). The end of the TDprobe containing the sensors was put in a plastic presure chamber and the pressure was increased 200 mHg (millimeters of mercury) above the ambient baro-metric pressure (fig. 2, item 2). The pressure measurby the TDG sensor should increase gradually, until itreaches a level approximately 200 mm Hg above bametric pressure, within about 10 minutes. This wouldindicate that the pressurized air was penetrating themembrane at a gradual rate. On occasions when thewas an opening torn in the membrane, the pressure msured by the TDG sensor would increase rapidly, indcating that the membrane should be replaced.
4
Figure 2. Laboratory calibration form.
HYDROLAB LABORATORY PROCEDURESTo be done when a H ydrolab is brought in from a 2 or 3-week deployment.
Hyrolab #______________ Lab barometer I D ___________TDG sensor #___________ Date baro last calib. ___________Site H yd. was deployed _______ Today ' s date ___________Date removed _________ Checked by ___________
1. TEST LO W CAL I BRATI ON WI TH MEMBRANE ATTACHED.
Lab BP _________ mm Hydrolab P t ________ mm T ime _______
2. TEST HYDROLAB WI TH DI GI TAL PRESSURE GAGE A ND PRESSURE CHAMBER.Lab BP + 200mm = ______ mm
Before applying 200 mm pressure Hydrolab P t ________ mm Time _______After applying pressure H ydrolab P t ________ mm Time _______
3. TEST HYDROLAB WI TH CLUB SODA.
Before soda test Hydrolab P t ________ mm Time _______High pressure , soda test Hydrolab P t ________ mm Time _______Low pressure , after soda test Hydrolab P t ________ mm Time _______
( I f the H yd. does not perform well on #1 - #3 abo ve, re-e valuate the correspondingsite re cord. )
Remove TD G membrane, c lean the membrane, air dry , store in dessi cator.Allow TD G sensor to air dry for at least 24 hours.Then test H ydrolab before redeployment , below.__________________________________________________________________________________________
1. CAL I BRATE TDG WI TH DI GI TAL PRESSURE GAGUE.Date __________ Lab BP ________ mmTime __________ Hydrolab P t ________ mm
________ ________Baro +100mm expec ted / meas.
________ ________Baro +200mm expec ted / meas.
________ ________Baro +300mm expec ted / meas.
I f any readings are >2 mm off , do a 2-point calibration at barometri c pressureand barometri c pressure + 200 mm and note below.
2. I NSTALL DRY MEMBRANE A ND I NSTALL THE SE NSOR GUARD.
3. TEST HYDROLAB WI TH CLUB SODA.
Before soda test Hydrolab P t ________ mm T ime _______High pressure , soda test Hydrolab P t ________ mm T ime _______Low pressure , after soda test Hydrolab P t ________ mm T ime _______
4. CLEA N A ND DRY THE HYDROLAB.
5. CHEC K MEMBRANE FOR I NTERNAL MOI STURE AFTER THE OUTSI DE OF THE MEMB. HAS HAD T I ME TO DRY
Label as ready for field deployment , with date. C ompleted D ate ________ T ime ________
3760363369
SKAW6/5/00
5/18/006/13/00
dqt
TM
765 762
965
1403
762
762
862 860
962 961
1062
771 09071002 0908746 0909
1061
760
1403
760 15191011 1520728 1522
964 1412
14156/14/00
6/15/00 baro=767
6/16/00 1400
5

-,
orso
al.
s
al-2rd.
e
thereeius
e
e
y
lyck
d
er
-he
atld
,d
Subsequently, the TDG membrane / TDG sensorunits were tested for responsiveness to supersaturationby inserting the probe into a container filled with super-saturated carbonated water (club soda). If the mem-brane/sensor was operating correctly, the measuredTDG rose to at least 1,000 mm Hg in 2 to 3 minutes(fig. 2, item 3). If the response was not this large, themembrane was replaced.
Next, the TDG membrane was cleaned with asquirt bottle of tap water, then removed from the sensor.The TDG membrane was dried in a desiccator for atleast 24 hours, and, at the same time, the TDG sensorwas air dried at room temperature. This step was impor-tant because water sometimes collected inside the tubu-lar membrane due to condensation. If the condensationis not removed, it can slow the equilibration of air pres-sure between the outside of the membrane and the TDGsensor.
After the TDG membrane and sensor had beendried, the TDG sensor, with the membrane still unat-tached, was tested at ambient pressure conditions (i.e.barometric pressure, as measured by the aneroid barom-eter) and at added pressures of 100 mm Hg, 200 mm Hg,and 300 mm Hg measured by the pressure gage, whichwas the primary standard (lower half of fig. 2, item 1).For example, using the barometric pressure of 760 mmHg, the added pressures of 0, 100, 200, and 300 mm Hgcorrespond to TDG percent saturations of 100%,113.2%, 126.3%, and 139.5%, respectively. The resultsof these calibrations for water year 2000 are shown infigure 3. Almost all of the calibrations were within1-percent saturation of total dissolved gas. One outlier,for 0 mm Hg added pressure at Skamania, was 5.3 per-cent larger than expected. This result indicated that thesensor was defective, and it was replaced.
If any of the measurements differed more than3 mm Hg from the primary standard, the sensor was cal-ibrated at two points, barometric pressure and baromet-ric pressure plus 200 mm Hg. Then the calibration of theTDG sensor was checked a second time accordingto the procedure above to be sure that it was correctlycalibrated at the various pressures.
After the pressure check and calibration (ifneeded) of the TDG sensor, the dried membrane wasreattached to the sensor, and the sensor guard wasscrewed back on the probe. Then another test was donefor responsiveness to supersaturation with “club soda”(carbonated water) (lower half of fig. 2, item 3). Again,if the membrane/sensor was operating correctly, themeasured TDG rose to at least 1,000 mm Hg in 2 or 3
minutes. If the response was not this large, the membrane was replaced. This second test, with club sodawas done because the process of installing the sensguard had been found to abrade the TDG membrane,the test ensured that the membrane was still function
The final step was to inspect the inside of themembrane for moisture (lower half of fig. 2, item 5.) Ifno moisture was visible, the TDG probe was labelled aready for field deployment.
In addition to the TDG probes that were cali-brated for replacement in the field each 2 to 3 week cibration interval, one TDG probe was calibrated everyto 3 weeks for use in the field as a secondary standaThis was the probe designated “Lab” on figure 3. ThTDG sensor was calibrated in the manner describedabove, and, additionally, the temperature calibrationwas checked in a water bath at a temperature near toambient river temperature at the time. The temperatudisplayed for the probe thermistor was compared to thtemperature as read to the nearest 0.1 degrees Celswith a NIST-traceable mercury thermometer. The TDGtemperature probe for the “Lab” Hydrolab could not badjusted to display the correct temperature, so theneeded adjustment (if any) was recorded for later usduring the field calibrations.
Calibration of Instruments in the Field
The fixed station monitors were calibrated ever2 weeks from March 10 to September 15, 2000, andevery 3 weeks for the remainder of the year, at whichtime Warrendale and Bonneville forebay were the onsites in operation. The general procedure was to chethe operation of the field probe without disturbing it,then replace the field probe with one that had beenrecently calibrated in the laboratory (as describedabove) and check the operation of the newly deployefield probe. The details of the field procedure follow.
The first step was to fill out the heading of thefield sheet (fig. 4) indicating site, date and time, weathconditions, and identification of the equipment at thesite. Then the “LAB” TDG probe (the secondary standard) was placed in the river at a location adjacent to tfield probe (fig. 4, item 1). The instrument shelter (awaterproof metal enclosure) was checked to ensure ththe vent was unobstructed so that the barometer coueffectively measure the ambient barometric pressure(fig. 4, item 2).
A palmtop computer was connected to the DCPallowing for data retrieval and program adjustment an
6

-2
2
-2
-1
0
1
-2
2
-2
-1
0
1
-2
2
-2
-1
0
1
-2
2
-2
-1
0
1
TO
TA
L D
ISS
OLV
ED
GA
S, I
N P
ER
CE
NT
SA
TU
RA
TIO
N
0 100 200 300-2
2
-2
-1
0
1
THE DALLES TAILWATERN=13
THE DALLES FOREBAYN=14
JOHN DAY FOREBAYN=14
JOHN DAY TAILWATER PRIMARY PROBE; N=14
JOHN DAY TAILWATER SECONDARY PROBE; N=13
-2
2
-2
-1
0
1
-2
2
-2
-1
0
1
-2
2
-2
-1
0
1EXPLANATION
10th percentile
25th percentile
Median
75th percentile
90th percentile
Data values outside the 10th and 90th percentiles
-2
2
-2
-1
0
1
0 100 200 300
APPLIED PRESSURE, IN MILLIMETERS OF MERCURY OVER BAROMETRIC PRESSURE
-2
2
-2
-1
0
1
LABN=16
CAMASN=16
BONNEVILLE FOREBAY N=18
SKAMANIAN=13
WARRENDALEN=22
5.3
Figure 3 . Accuracy of total dissolved gas sensors when compared to a primary standard after field deployment.(Total dissolved gas value from primary standard minus value from field total dissolved gas probe.)
7
Page 1
------------------------------------------------------------------HYDROLAB TDG FIELD INSPECTION/CALIBRATION SHEET (1/00 version)----- USGS Por tla nd, Ore gon ( 503) 251- 3200 ----------------------Site ID: ___________ Date: ___________ Arrive time:__________Per sonn el : _____________________ Pur pos e: ______________________Weat her: ______________________________ Air tem perat ure: ______ CObserve d sp i ll conditi ons : ______________________________________DCP#____________ TBO#_____Lab Hydr ol ab #_______________________ Date l as t cal . _____________Lab Bar ometer ID _______________________ Date l as t cal . __________
1. WITHOUT MOVING THE OLD FIELD HYDROLAB , PLACE LAB HYDROLAB IN RI VER AT DEPTH OF OLD FIELD HYDROLAB Time: ________
2. IS S HELTER VENT OBSTRUCTED (Y/N) : ____
3. CONNECT COMPUTER AND CHECK DCPDump l ogged data t o f i l e: ________________ .L OG ( _____ kb)
Mos t re cent lo gged data: time_____ bar o_____ tem p____ dept h____ Pt_____ D CP c lo ck time: ______________ GMT time ( wat ch) : _____________ Reset c lo ck (Y/N) : ____ Recor di ng s tat us ( check one) : ___ ON&TX, ___ ON&FT, ___ ON, ___ OFF A nte nna a ngl e a ppr ox . 35-40 degree s t o hori zon (Y/N) : _____ A nte nna dire c ti on a ppr ox . 180 degree s - sou t h (Y/N) : _____ Batter y mi nim um: _______ VDC Batter y ma x im um: _______ VDC Nex t tra ns mi ss i on : ______ GMT Err or me ss ages (Y/N) : ___ ( lo g i n no te s) Cl ear s tat us (Y/N) : ____
4. CHECK POWER AND CHARGING SYSTEM WITH MULTI - METER A C ( at ou t l et ) : ______ VAC
DISCONNECT batt er y IF ne x t t r ans mission NOT i mminen t BATTERY ( at pol es ) : ______ VDC REGULATOR ( at l eads t o batter y f r om DCP = 13. 8VDC/ . 75A) : ______ VDC
RECONNECT batt er y , t hen dis conne c t ri ght si de DCP bus bar S OLAR PANEL OR A C/ DC CONVERTOR ( at PWR I N sc re ws ) : ______ VDC
RECONNECT bus bar
5. BAROMETRI C PRESSURE
_____________ mm - ___________ mm = __________ mm I F |* 5*| > 10mm, re pl ace TBO Lab BP TBO BP * 5*
_____________ mm - ___________ mm = __________ mm Lab BP D CP BP Back S hi f t
Reset D CP Ol d off set ______ New off set _______ Time: ________
6. TEMPERATURE Uncorre c te d Lab WT = __________ C
________________ C - ____________ C = _____________ C Time: ________ Corre c te d Lab WT Ol d Fie l d Hyd WT Back S hi f t
NOTES: _____________________________________________________________________________________________________________________________________________________________________________________________________________________________________________________________________________________________________________________________________________________________________________________________________________________________________________________________________________________________________________________________________________________________________________________________________________________________________________________________________________________________________________________
5-24-00 1020
1025
170017:33:30
18:11:10
17:33:29763
763 760
764763
83614.64 17.46
BONBrooks
sunny
3740933674
DQT5-18-00
5-18-00
19All gates
20.8calibration
N
N
NX
Y
Y
120.013.3313.2913.76
Y
5/12/2000
13.26 13.34
3
3
0.001
-1
0 1037
103814.61
14.71 14.67 +.04
Figure 4 . Field inspection/calibration sheet.
8
Page 2
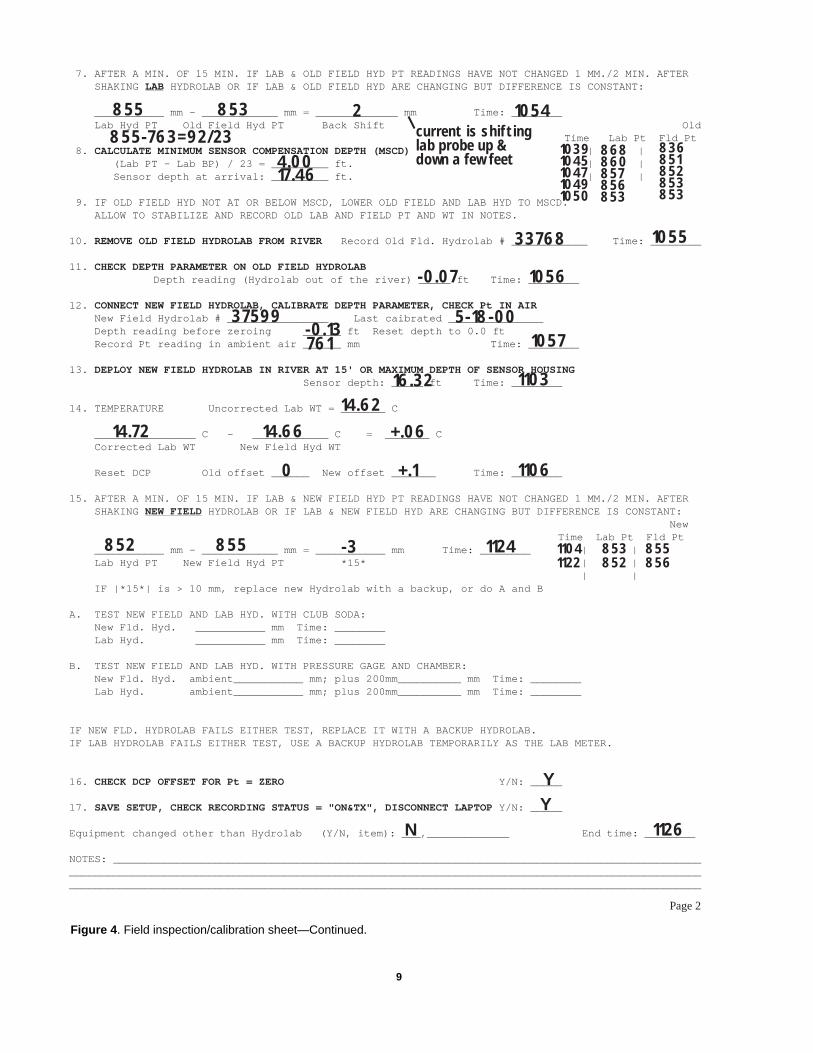
7. AFTER A MIN. OF 15 MIN. IF LAB & OLD FIELD HYD PT READINGS HAVE NOT CHANGED 1 MM./2 MIN. AFTER SHA KING LAB HYDROLAB OR IF LAB & OLD FIELD HYD ARE CHANGING B UT DIFFERENCE IS CONSTANT :
___________ mm - ____________ mm = _____________ mm T ime : ________ L ab H yd PT O ld F ie ld H yd PT B ack S hi ft O ld
T ime L ab P t F ld P t 8. CALCULATE MINIMUM SENSOR COMPENSATION DEPTH (MSCD) | | ( Lab PT - L ab BP ) / 2 3 = _________ ft . | | S ensor depth at arr i val : _________ ft . | |
9. IF OLD FIELD HYD NOT AT OR BELO W MSCD, LO WER OLD FIELD AND LAB HYD TO MSCD. ALLO W TO STABILI ZE AND RECORD OLD LAB AND FIELD PT AND WT IN NOTES.
10. REMOVE OLD FIE LD HYDROLAB FROM RIVER R ecor d O ld F ld . H yd ro lab # ____________ T ime : ________
11. CHECK DEPTH P ARAMETER ON OLD FIE LD HYDROLABDepth r ead i ng ( Hyd ro lab out of th e r i ver ) _____ ft Time : ________
12. CONNECT NEW FIE LD HYDROLAB, C ALI BRATE DEPTH PARAMETER, CHECK P t IN AIR N ew F ie ld H yd ro lab # ________________ L as t ca i br at ed _______________ D epth r ead i ng bef or e zero i ng ______ ft R eset depth t o 0. 0 ft R ecor d P t r ead i ng i n ambie nt ai r ______ mm Time : ________
13. DEPLOY NE W FIE LD HYDROLAB IN RI VER AT 15' OR MAXIMUM DEPTH OF SENSOR HOUSING S ensor depth : _____ ft T ime : ________
14. TEMPERATURE Uncorr ect ed L ab WT = _______ C
________________ C - ____________ C = _______ C C orr ect ed L ab WT N ew F ie ld H yd WT
R eset DCP O ld off set ______ N ew off set _______ T ime : ________
15. AFTER A MIN. OF 15 MIN. IF LAB & NE W FIELD HYD PT READINGS HAVE NOT CHANGED 1 MM./2 MIN. AFTER SHA KING NEW FIE LD HYDROLAB OR IF LAB & NE W FIELD HYD ARE CHANGING B UT DIFFERENCE IS CONSTANT : N ew
T ime L ab P t F ld P t ___________ mm - ____________ mm = ___________ mm T ime : ________ | | L ab H yd PT N ew F ie ld H yd PT * 15* | |
| | IF | * 15* | i s > 1 0 mm, r eplac e new H yd ro lab wi th a back up, or do A and B
A. TEST NE W FIELD AND LAB HYD. WITH CL UB SODA: N ew F ld . H yd . ___________ mm T ime : ________ L ab H yd . ___________ mm T ime : ________
B. TEST NE W FIELD AND LAB HYD. WITH PRESSURE GAGE AND CHAMBER: N ew F ld . H yd . ambie nt ___________ mm; pl us 2 00mm__________ mm T ime : ________ L ab H yd . ambie nt ___________ mm; pl us 2 00mm__________ mm T ime : ________
IF NE W FLD. HYDROLAB FAILS EITHER TEST , REPLACE IT WITH A BAC KUP HYDROLAB.IF LAB HYDROLAB FAILS EITHER TEST , USE A BAC KUP HYDROLAB TEMPORARILY AS THE LAB METER.
16. CHECK DCP O FFSET FOR Pt = ZERO Y/N : _____
17. SAVE SETUP, CHECK RECORDING ST ATUS = " ON&TX" , DISCONNECT LAPTOP Y/N : _____
Equi pment cha nged oth er tha n Hyd ro lab ( Y/N , i t em) : ___ , _____________ End t ime : ________
NOTES: _____________________________________________________________________________________________________________________________________________________________________________________________________________________________________________________________________________________________________
855
868860857856853
836851852853853
855-763=92/23853
33768
37599-0.13
1055
1056
1057
1103
11041122
853852
855856
1106
1124
1126
761
16.3214.62
14.72 14.66
-0.07
2 1054
10391045104710491050
4.0017.46
current is shiftinglab probe up &down a few feet
5-18-00
+.06
+.10
852 855 -3
Y
NY
Figure 4 . Field inspection/calibration sheet—Continued.
9

rys
h
1-
thesm
en
checking (fig. 4, item 3). The data that were logged bythe DCP since the last visit were downloaded to thepalmtop computer so they could be available inthe event that any data were not transmitted by the sat-ellite system. The clock in the DCP was checked andadjusted, if necessary. Antenna alignment and recordedbattery voltages were checked and recorded.
The power and charging systems were checkedusing a digital multimeter (fig. 4, item 4). Some of thesites had 120-volt alternating-current (AC) power ser-vice; the voltage of those supplies was checked. Withthe battery disconnected, its voltage was measured, andthe circuit that charges the battery (the regulator) waschecked. Finally, the battery was reconnected, and thevoltage output of the solar panel or AC/DC converterwas checked before its input to the voltage regulator.
The field-deployed electronic barometer waschecked and adjusted, if necessary (fig. 4, item 5). Themeasurement from the secondary standard aneroidbarometer (“Lab BP” on figure 4) was compared to themeasurement made by the field electronic barometerand displayed by the DCP (“DCP BP” on fig. 4). If therewas a difference, the back shift was applied to changethe offset value in the DCP program. After this step, theDCP would display the same barometric pressure (tothe nearest millimeter of mercury) as the secondarystandard, the aneroid barometer. The results of the fieldcalibrations of the electronic barometers at the fixed sta-tions are shown in figure 5. Most of the time, the fieldbarometer was within 1 mm Hg of the secondary stan-dard. At The Dalles forebay site, the spread of data waswidest—between plus and minus 2 mm Hg. This prob-ably was the result of a variable signal from the elec-tronic barometer, which resulted in the offset beingadjusted one way on one calibration visit and the otherway on the next calibration visit.
The performance of the field temperature sensorwas documented (fig. 4, item 6). The water temperaturemeasurement made by the secondary standard TDGprobe (“Corrected Lab WT”) was compared to the mea-surement made by the nearby field-deployed TDGprobe (“Old Field Hyd WT”). The differences were usu-ally less than 0.1ºC (degrees Celsius), indicating theaccuracy when compared to the secondary standard (fig.6).
Performance of the fixed-station TDG sensor wasdocumented (fig. 4, item 7). Values of TDG obtained bythe secondary standard TDG sensor (“Lab Hyd PT”)were compared to the values obtained by the fixed-station TDG sensor (“Old Field Hyd PT”). For this
comparison, it was necessary to wait until the secondastandard reached equilibrium in the river. Usually thiequilibration process took about 30 minutes and wasconsidered to be complete when the reading for eacprobe did not change even 1 mm Hg for a period of 2minutes. At most sites, there was usually less than apercent TDG difference between the secondary standard and the fixed-station monitor (fig. 7.) At TheDalles site once, and at the Camas site three times, TDG measurement from the fixed-station monitor wamore than 10 percent larger than the measurement frothe secondary standard (fig. 7). These were times wh
DIF
FE
RE
NC
E B
ET
WE
EN
SE
CO
ND
AR
Y S
TA
ND
AR
D A
ND
FIE
LD B
AR
OM
ET
ER
, IN
MIL
LIM
ET
ER
S O
F M
ER
CU
RY
EXPLANATION
10th percentile
25th percentile
Median
75th percentile
90th percentile10th and 90th percentilesData values outside the
JOHN DAY FOREBAY
N=13
-4
4
-2
0
2
BONNEVILLE FOREBAY
N=23
SKAMANIA
N=14
JOHN DAY TAILWATER
PRIMARY PROBE; N=14
-4
4
-2
0
2
THE DALLES FOREBAY
N=14
WARRENDALE
N=23
-4
4
-2
0
2
CAMAS
N=15
THE DALLES TAILWATER
N=13
-4
4
-2
0
2
5
-6
Figure 5. Difference between the secondary standardand the field barometers.
10

nd
hetinthe
d
the TDG membrane had been broken, resulting in incor-rect TDG measurements.
The minimum compensation depth was calcu-lated and recorded (fig. 4, item 8). This depth, calcu-lated according to a formula derived from Colt (1984,page 104), is the depth above which degassing willoccur, due to the decreased hydrostatic pressure. Inorder to measure TDG accurately, the probe must bedeeper than the calculated compensation depth. If theprobe was not below minimum compensation depth andit was physically possible to have it that deep, the TDGwas measured at the larger depth (fig. 4, item 9).
The probe from the fixed station was removedfrom the river and the depth parameter was checkedwhen it was above the water surface (fig. 4, items 10 a11). The depth reading usually differed from zero byabout 0.1 or 0.2 feet. These differences were due to tfact that the depth sensor on the TDG probe was novented to the outside atmosphere, so that changes barometric pressure affected the measured depth ofTDG probe.
The newly calibrated TDG probe was connecteto the fixed-station equipment, the functions of depthand TDG measurement were checked, and the zero
DIF
FE
RE
NC
E B
ET
WE
EN
SE
CO
ND
AR
Y S
TA
ND
AR
D A
ND
FIE
LD T
HE
RM
OM
ET
ER
, IN
DE
GR
EE
S C
ELS
IUS 0.2
0.1
0
-0.1
-0.2
0.2
0.1
0
-0.1
-0.2
0.2
0.1
0
-0.1
-0.2
0.2
0.1
0
-0.1
-0.2
0.5
2.1
JOHN DAY FOREBAY
N=13
BONNEVILLE FOREBAY
N=23
SKAMANIA
N=14
JOHN DAY TAILWATER
PRIMARY PROBE; N=14
THE DALLES FOREBAY
N=14
WARRENDALE
N=23
CAMAS
N=15
THE DALLES TAILWATER
N=13
EXPLANATION
10th percentile
25th percentile
Median
75th percentile
90th percentile10th and 90th percentilesData values outside the
Figure 6 . Difference between the secondary standard andthe field thermometers.
-6
6
-4
-2
0
2
4
-6
6
-4
-2
0
2
4
-6
6
-4
-2
0
2
4
TO
TA
L D
ISS
OLV
ED
GA
S, I
N P
ER
CE
NT
SA
TU
RA
TIO
N
-6
6
-4
-2
0
2
4
JOHN DAY FOREBAY
N=13
BONNEVILLE FOREBAY
N=23
SKAMANIA
N=14
JOHN DAY TAILWATER
THE DALLES FOREBAY
N=14
WARRENDALE
N=23
CAMAS
N=15
THE DALLES TAILWATER
N=13
EXPLANATION
10th percentile
25th percentile
Median
75th percentile
90th percentile10th and 90th percentilesData values outside the
-39.7
-14.5 -16.0 -17.5
Figure 7 . Total dissolved gas difference between thefield probe and lab probe initially.
11
ely
reason,r-
point for depth measurement was calibrated (fig. 4, item12).
The TDG probe was allowed 5 to 10 minutes toequilibrate in the river then the temperature measure-ment function was checked and calibrated (fig. 4, item14). Using the electronic offsets in the DCP, the mea-surement made by the newly calibrated TDG probe wasmade to read the same temperature as measured by thesecondary standard for temperature (the laboratory-calibrated TDG probe).
The final field calibration step (fig. 4, item 15)was to check the TDG measurement in the river madeby the newly calibrated fixed-station probe againstthat made by the secondary standard (the laboratory-calibrated TDG probe). These two values usually werewithin 2 percent TDG of each other (fig. 8).
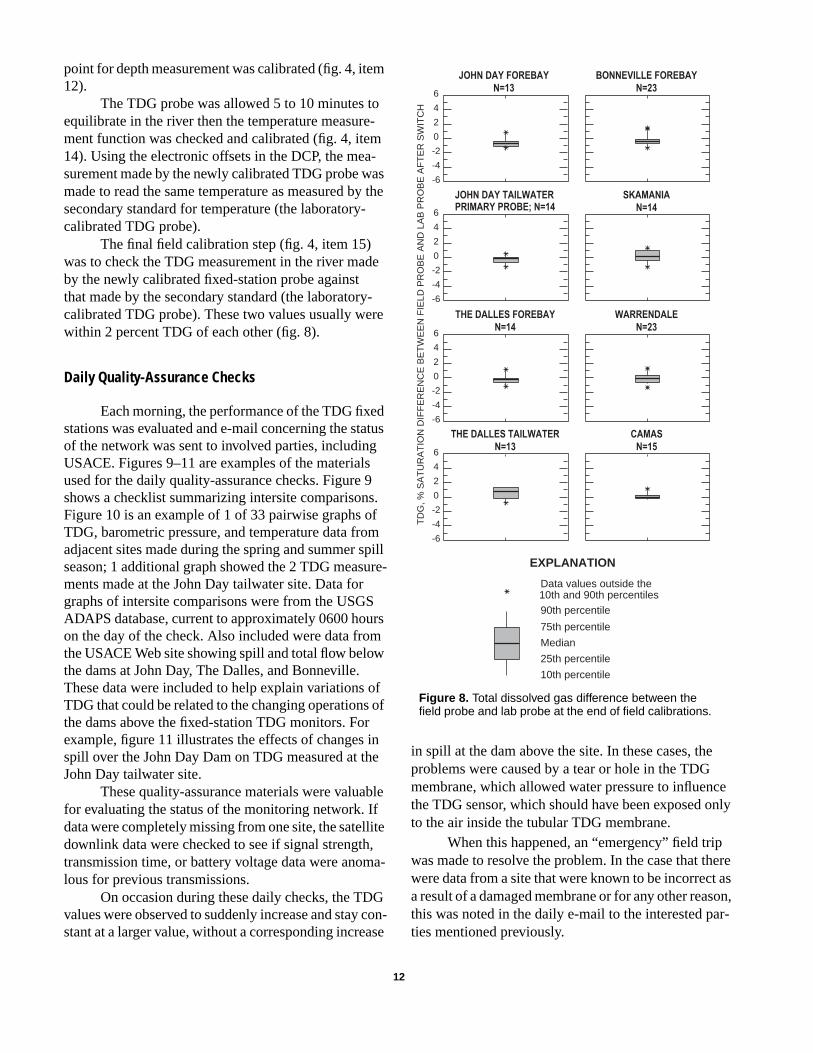
Daily Quality-Assurance Checks
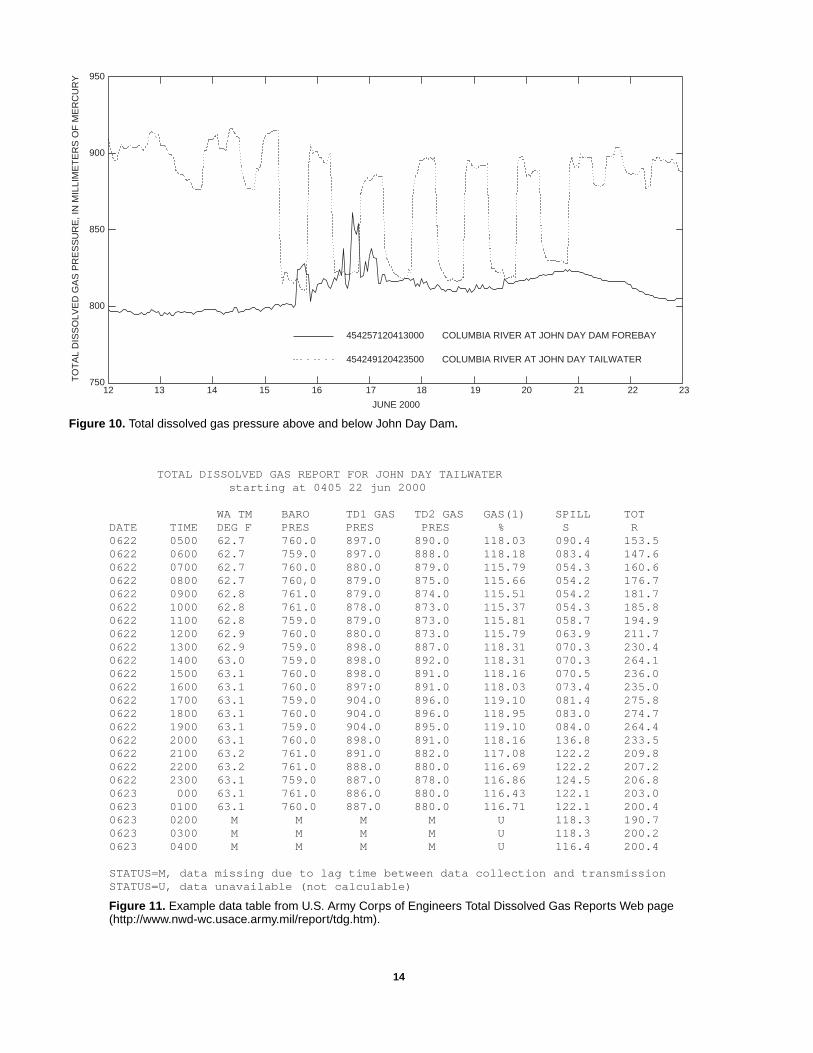
Each morning, the performance of the TDG fixedstations was evaluated and e-mail concerning the statusof the network was sent to involved parties, includingUSACE. Figures 9–11 are examples of the materialsused for the daily quality-assurance checks. Figure 9shows a checklist summarizing intersite comparisons.Figure 10 is an example of 1 of 33 pairwise graphs ofTDG, barometric pressure, and temperature data fromadjacent sites made during the spring and summer spillseason; 1 additional graph showed the 2 TDG measure-ments made at the John Day tailwater site. Data forgraphs of intersite comparisons were from the USGSADAPS database, current to approximately 0600 hourson the day of the check. Also included were data fromthe USACE Web site showing spill and total flow belowthe dams at John Day, The Dalles, and Bonneville.These data were included to help explain variations ofTDG that could be related to the changing operations ofthe dams above the fixed-station TDG monitors. Forexample, figure 11 illustrates the effects of changes inspill over the John Day Dam on TDG measured at theJohn Day tailwater site.
These quality-assurance materials were valuablefor evaluating the status of the monitoring network. Ifdata were completely missing from one site, the satellitedownlink data were checked to see if signal strength,transmission time, or battery voltage data were anoma-lous for previous transmissions.
On occasion during these daily checks, the TDGvalues were observed to suddenly increase and stay con-stant at a larger value, without a corresponding increase
in spill at the dam above the site. In these cases, theproblems were caused by a tear or hole in the TDGmembrane, which allowed water pressure to influencthe TDG sensor, which should have been exposed onto the air inside the tubular TDG membrane.
When this happened, an “emergency” field tripwas made to resolve the problem. In the case that thewere data from a site that were known to be incorrecta result of a damaged membrane or for any other reasthis was noted in the daily e-mail to the interested paties mentioned previously.
-6
6
-4
-2
0
2
4
-6
6
-4
-2
0
2
4
-6
6
-4
-2
0
2
4
TD
G, %
SA
TU
RA
TIO
N D
IFF
ER
EN
CE
BE
TW
EE
N F
IELD
PR
OB
E A
ND
LA
B P
RO
BE
AF
TE
R S
WIT
CH
-6
6
-4
-2
0
2
4
JOHN DAY FOREBAY
N=13
BONNEVILLE FOREBAY
N=23
SKAMANIA
N=14
JOHN DAY TAILWATER
PRIMARY PROBE; N=14
THE DALLES FOREBAY
N=14
WARRENDALE
N=23
CAMAS
N=15
THE DALLES TAILWATER
N=13
EXPLANATION
10th percentile
25th percentile
Median
75th percentile
90th percentile10th and 90th percentilesData values outside the
Figure 8. Total dissolved gas difference between thefield probe and lab probe at the end of field calibrations.
12
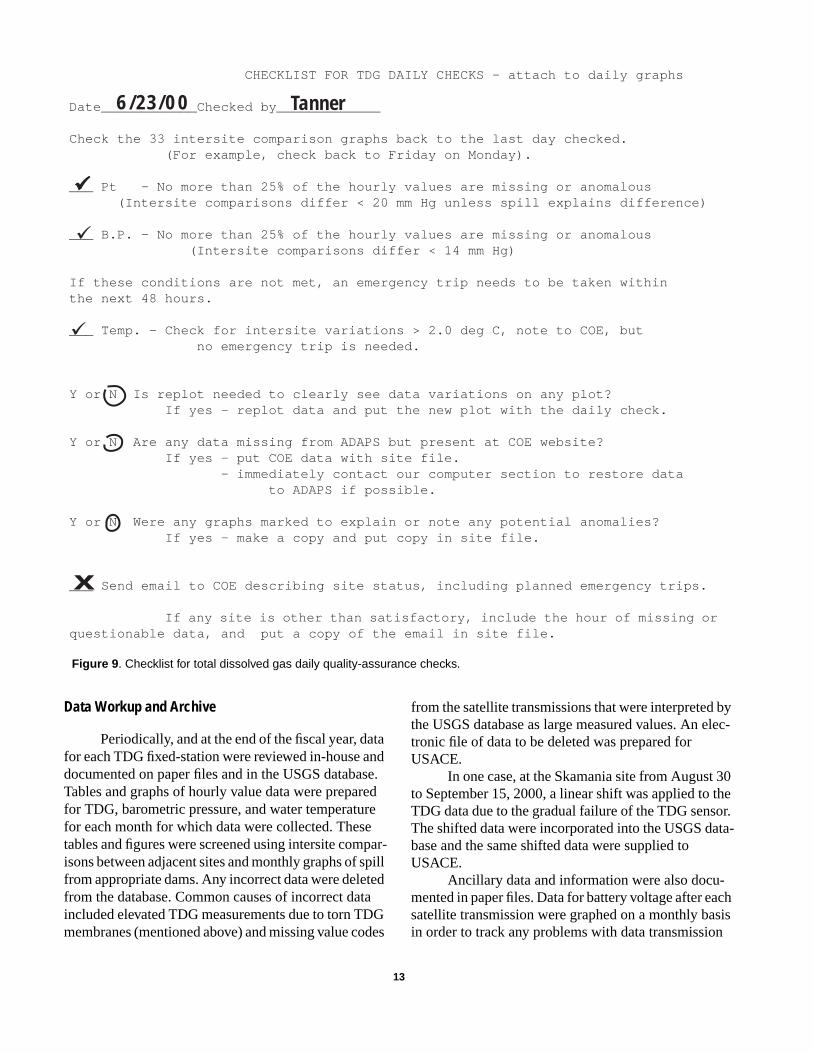
CHECKLIST FOR TDG DAILY CHECKS - attach to daily graphs
Dat e____________ Checke d by_____________
Check th e 33 i nt ersit e co mpariso n graphs bac k to th e last day ch ecke d.( For exampl e, ch eck bac k to Friday o n Monday ) .
___ Pt - No mor e tha n 25% o f th e ho urly val ues ar e missi ng or a nomalo us ( I nt ersit e co mpariso ns di ff er < 20 mm Hg unl ess spill explai ns di ff er ence)
___ B. P. - No mor e tha n 25% o f th e ho urly val ues ar e missi ng or a nomalo us ( I nt ersit e co mpariso ns di ff er < 14 mm Hg )
I f th ese co nditio ns ar e not met , a n emerg ency trip needs to be ta ke n withi nth e nex t 48 ho urs .
___ T emp. - Ch eck f or i nt ersit e variatio ns > 2. 0 d eg C , not e to COE , but no emerg ency trip is needed.
Y or N Is r eplot needed to cl early s ee data variatio ns o n a ny plot ?I f y es - r eplot data a nd p ut th e new plot with th e daily ch eck .
Y or N Ar e a ny data missi ng f ro m ADAPS but pr esent at COE websit e?I f y es - p ut COE data with sit e f il e. - i mmediat ely co ntact o ur co mput er s ectio n to r estor e data
to ADA PS i f possi bl e.
Y or N Wer e a ny graphs mar ke d to explai n or not e a ny pot ential a nomali es?I f y es - make a copy a nd p ut copy i n sit e f il e.
___ S end email to COE d escri bi ng sit e stat us , i ncl udi ng pla nned emerg ency trips .
I f any sit e is oth er tha n satis f actory , i ncl ude th e hour o f missi ng orquestio nabl e data , a nd p ut a copy o f th e email i n sit e f il e.
üü
ü
ü
6/23/00 Tanner
X
Figure 9 . Checklist for total dissolved gas daily quality-assurance checks.
ylec-
0er.ta-
chis
Data Workup and Archive
Periodically, and at the end of the fiscal year, datafor each TDG fixed-station were reviewed in-house anddocumented on paper files and in the USGS database.Tables and graphs of hourly value data were preparedfor TDG, barometric pressure, and water temperaturefor each month for which data were collected. Thesetables and figures were screened using intersite compar-isons between adjacent sites and monthly graphs of spillfrom appropriate dams. Any incorrect data were deletedfrom the database. Common causes of incorrect dataincluded elevated TDG measurements due to torn TDGmembranes (mentioned above) and missing value codes
from the satellite transmissions that were interpreted bthe USGS database as large measured values. An etronic file of data to be deleted was prepared forUSACE.
In one case, at the Skamania site from August 3to September 15, 2000, a linear shift was applied to thTDG data due to the gradual failure of the TDG sensoThe shifted data were incorporated into the USGS dabase and the same shifted data were supplied toUSACE.
Ancillary data and information were also docu-mented in paper files. Data for battery voltage after easatellite transmission were graphed on a monthly basin order to track any problems with data transmission
13
950
900
850
800
75012 13 14 15 16 17 18 19 20 21 22 23
JUNE 2000
TO
TA
L D
ISS
OLV
ED
GA
S P
RE
SS
UR
E, I
N M
ILLI
ME
TE
RS
OF
ME
RC
UR
Y
454257120413000 COLUMBIA RIVER AT JOHN DAY DAM FOREBAY
454249120423500 COLUMBIA RIVER AT JOHN DAY TAILWATER
Figure 10. Total dissolved gas pressure above and below John Day Dam.
Figure 11. Example data table from U.S. Army Corps of Engineers Total Dissolved Gas Reports Web page(http://www.nwd-wc.usace.army.mil/report/tdg.htm).
TOTAL DISSOLVED GAS REPORT FOR JOHN DAY TAILWATER starting at 0405 22 jun 2000
WA TM BARO TD1 GAS TD2 GAS GAS(1) SPILL TOTDATE TIME DEG F PRES PRES PRES % S R0622 0500 62.7 760.0 897.0 890.0 118.03 090.4 153.50622 0600 62.7 759.0 897.0 888.0 118.18 083.4 147.60622 0700 62.7 760.0 880.0 879.0 115.79 054.3 160.60622 0800 62.7 760,0 879.0 875.0 115.66 054.2 176.70622 0900 62.8 761.0 879.0 874.0 115.5l 054.2 181.70622 1000 62.8 761.0 878.0 873.0 115.37 054.3 185.80622 1100 62.8 759.0 879.0 873.0 115.81 058.7 194.90622 1200 62.9 760.0 880.0 873.0 115.79 063.9 211.70622 1300 62.9 759.0 898.0 887.0 118.31 070.3 230.40622 1400 63.0 759.0 898.0 892.0 118.31 070.3 264.10622 1500 63.1 760.0 898.0 891.0 118.16 070.5 236.00622 1600 63.1 760.0 897:0 891.0 118.03 073.4 235.00622 1700 63.1 759.0 904.0 896.0 119.10 081.4 275.80622 1800 63.1 760.0 904.0 896.0 118.95 083.0 274.70622 1900 63.1 759.0 904.0 895.0 119.10 084.0 264.40622 2000 63.1 760.0 898.0 891.0 118.16 136.8 233.50622 2100 63.2 761.0 891.0 882.0 117.08 122.2 209.80622 2200 63.2 761.0 888.0 880.0 116.69 122.2 207.20622 2300 63.1 759.0 887.0 878.0 116.86 124.5 206.80623 000 63.1 761.0 886.0 880.0 116.43 122.1 203.00623 0100 63.1 760.0 887.0 880.0 116.71 122.1 200.40623 0200 M M M M U 118.3 190.70623 0300 M M M M U 118.3 200.20623 0400 M M M M U 116.4 200.4
STATUS=M, data missing due to lag time between data collection and transmissionSTATUS=U, data unavailable (not calculable)
14

drs
to
r-ent
n.3
gesy-
hesss a
due to low battery voltage. The recorded probe depthwas also graphed. E-mail correspondence referring toeach site was also archived in the corresponding sitefolder.
SUMMARY OF DATA COMPLETENESSAND QUALITY
Year-end summaries of water year 2000 TDGdata completeness and quality are shown in table 2.Data in this table were based on the amount of hourlyTDG data and barometric pressure data that could havebeen collected during the scheduled monitoring season.At all stations, more data were collected than wasscheduled because the monitors were set up early toensure correct operation. Because TDG in percent satu-ration is calculated as total dissolved gas pressure, inmillimeters of mercury, divided by the barometric pres-sure, in millimeters of mercury, multiplied by 100 per-cent, any hour with missing TDG pressure data ormissing barometric pressure data was counted as anhour of missing data for TDG in percent saturation.The percentage of real-time data received shown intable 2 represents the data that were received via satel-lite telemetry at the USGS downlink. The USACEdownlink operated independently, but the amount andquality of the data were very similar. At each station, 98percent or more of the data were received real-time bythe USGS downlink, with an overall average of 99.6percent. Problems with the amount of real-time data
received were usually due to malfunction or mispro-gramming of the data-collection platform.
The collection of water temperature data hadfewer complications than did the collection of TDG anbarometric pressure data. There were only a few houof missing or incorrect temperature data, except forinstances where all data parameters were missing dueproblems with the DCP.
TDG data were considered to meet quality-assuance standards if they were within 1 percent TDG of thexpected value, based on calibration data and ambieriver conditions at adjacent sites. The percentage ofreal-time TDG data passing quality assurance is showin table 2. The lowest percentage for a station was 95percent at Skamania, but all of the missing data waseventually restored to the database. The overall averaof real-time data passing quality-assurance standardwas 98.5 percent. Most problems with meeting qualitassurance standards were due to membrane fail-ure—leaking or tearing of the TDG membrane.
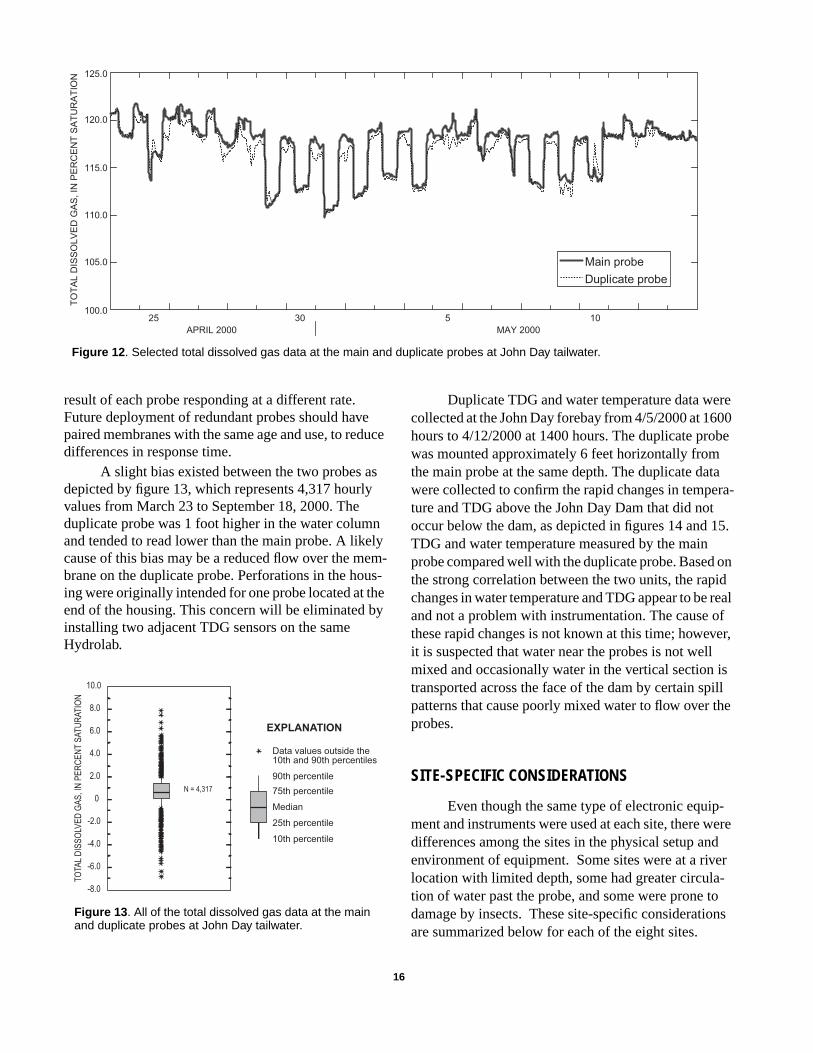
QUALITY-ASSURANCE DATA
Duplicate data for John Day tailwater werecollected for TDG only. Data between the two instru-ments compared well, as depicted on figure 12, whicshows how the two probes responded to daily changin spill at the John Day Dam. The greatest differenceoccurred at times when gas levels changed rapidly, a
Table 2 . Total dissolved gas data completeness and quality, water year 2000[TDG, total dissolved gas]
Abbreviated station namePlanned
monitoring,in hours
Percentage of real-timeTDG data received
Percentage of real-timeTDG data passingquality assurance
John Day forebay 4,032 99.4 99.4
John Day tailwater Main probe Duplicate probe
4,0324,032
99.999.9
99.998.7
The Dalles forebay 4,032 99.5 97.7
The Dalles tailwater 4,032 100.0 100.0
Bonneville forebay 8,784 98.3 98.2
Skamania 4,560 100.0 95.3
Warrendale 8,784 99.9 99.3
Camas 4,560 99.8 98.0
Average 99.6 98.5
15
100.0
105.0
110.0
115.0
120.0
125.0T
OT
AL
DIS
SO
LV
ED
GA
S, IN
PE
RC
EN
T S
AT
UR
AT
ION
Main probe
Duplicate probe
25 30 5 10
APRIL 2000 MAY 2000
Figure 12 . Selected total dissolved gas data at the main and duplicate probes at John Day tailwater.
e0
be
ara-
5.
onidealfr,
isille
-ereder-
ns
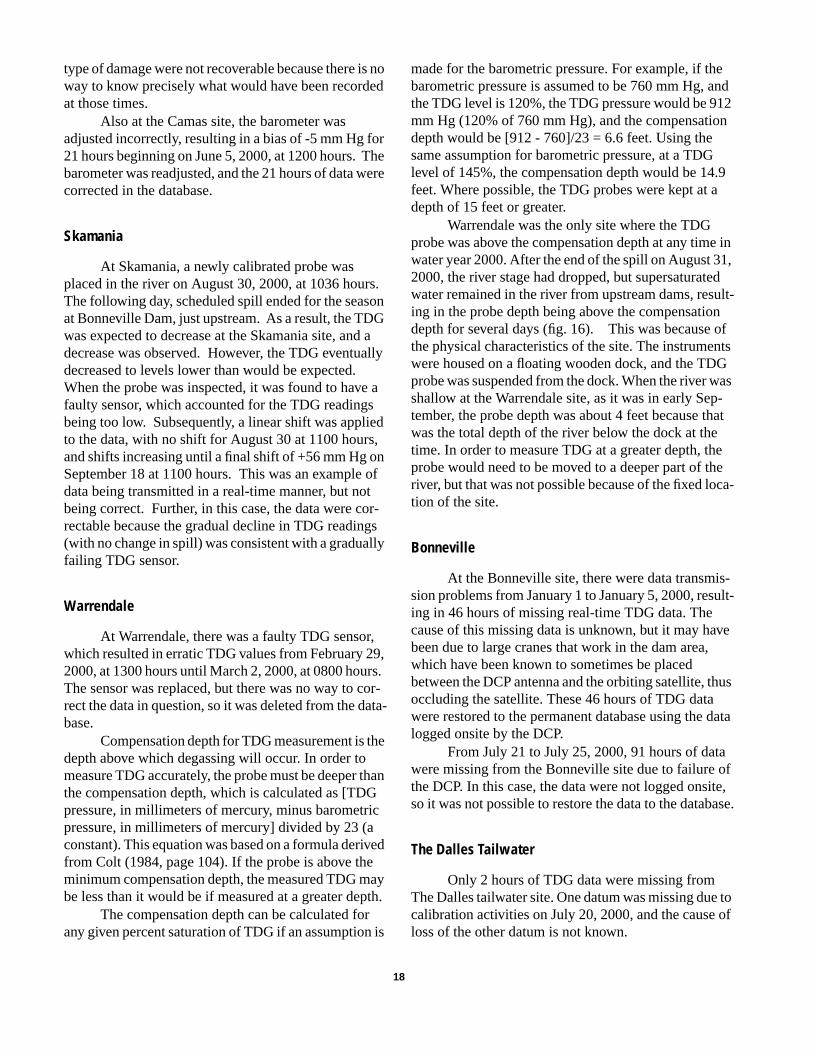
result of each probe responding at a different rate.Future deployment of redundant probes should havepaired membranes with the same age and use, to reducedifferences in response time.
A slight bias existed between the two probes asdepicted by figure 13, which represents 4,317 hourlyvalues from March 23 to September 18, 2000. Theduplicate probe was 1 foot higher in the water columnand tended to read lower than the main probe. A likelycause of this bias may be a reduced flow over the mem-brane on the duplicate probe. Perforations in the hous-ing were originally intended for one probe located at theend of the housing. This concern will be eliminated byinstalling two adjacent TDG sensors on the sameHydrolab.
Duplicate TDG and water temperature data wercollected at the John Day forebay from 4/5/2000 at 160hours to 4/12/2000 at 1400 hours. The duplicate prowas mounted approximately 6 feet horizontally fromthe main probe at the same depth. The duplicate datwere collected to confirm the rapid changes in tempeture and TDG above the John Day Dam that did notoccur below the dam, as depicted in figures 14 and 1TDG and water temperature measured by the mainprobe compared well with the duplicate probe. Basedthe strong correlation between the two units, the rapchanges in water temperature and TDG appear to be rand not a problem with instrumentation. The cause othese rapid changes is not known at this time; howeveit is suspected that water near the probes is not wellmixed and occasionally water in the vertical section transported across the face of the dam by certain sppatterns that cause poorly mixed water to flow over thprobes.
SITE-SPECIFIC CONSIDERATIONS
Even though the same type of electronic equipment and instruments were used at each site, there wdifferences among the sites in the physical setup anenvironment of equipment. Some sites were at a rivlocation with limited depth, some had greater circulation of water past the probe, and some were prone todamage by insects. These site-specific consideratioare summarized below for each of the eight sites.
N = 4,317
-8.0
10.0
-6.0
-4.0
-2.0
0
2.0
4.0
6.0
8.0
TO
TAL
DIS
SO
LVE
D G
AS
, IN
PE
RC
EN
T S
AT
UR
AT
ION
EXPLANATION
10th percentile
25th percentile
Median
75th percentile
90th percentile
10th and 90th percentilesData values outside the
Figure 13 . All of the total dissolved gas data at the mainand duplicate probes at John Day tailwater.
16

8.0
8.5
9.0
9.5
10.0
10.5
11.0
11.5
5 6 7 8 9 10 11 12
APRIL 2000
WA
TE
R T
EM
PE
RA
TU
RE
, IN
DE
GR
EE
S C
ELS
IUS
John Day forebay
John Day tailwater
John Day forebay duplicate
Figure 14. Duplicate water temperature data at John Day forebay and water temperature data at John Day tailwater.
760
770
780
790
800
810
820
5 6 7 8 9 10 11 12
APRIL 2000
TOT
AL D
ISSO
LVED
GAS, IN
MIL
LIMETE
RS
OF
ME
RCU
RY
Main probe
Duplicate probe
Figure 15 . Duplicate total dissolved gas data at John Day forebay.
hv-
ggob-is
Camas
At the Camas site, there were three separate occa-sions (June 29, July 23, and July 31, 2000) when theTDG membrane was pierced by aquatic insects, whichwere observed inside the probe housing. When this hap-pened, the hole in the membrane allowed water pressureinstead of dissolved gas pressure to act on the TDGpressure sensor. As a result, the measured values for
TDG rose suddenly to about 1,000 mm Hg, even thougthere was not an unusual amount of spill from Bonneille Dam, which is upstream of the Camas site. Thiscondition was diagnostic of a broken membrane, andaccordingly, an emergency field trip was made toreplace the probe with a newly calibrated probe. Durinthe third trip due to a damaged membrane, screeninwas added to the probe to exclude insects, and the prlem did not reoccur. TDG data that were lost due to th
17
end2n
9
in,dlt-
noftsGas-at
eea-
-lt-
ve
us
ata
fte,se.
toof
type of damage were not recoverable because there is noway to know precisely what would have been recordedat those times.
Also at the Camas site, the barometer wasadjusted incorrectly, resulting in a bias of -5 mm Hg for21 hours beginning on June 5, 2000, at 1200 hours. Thebarometer was readjusted, and the 21 hours of data werecorrected in the database.
Skamania
At Skamania, a newly calibrated probe wasplaced in the river on August 30, 2000, at 1036 hours.The following day, scheduled spill ended for the seasonat Bonneville Dam, just upstream. As a result, the TDGwas expected to decrease at the Skamania site, and adecrease was observed. However, the TDG eventuallydecreased to levels lower than would be expected.When the probe was inspected, it was found to have afaulty sensor, which accounted for the TDG readingsbeing too low. Subsequently, a linear shift was appliedto the data, with no shift for August 30 at 1100 hours,and shifts increasing until a final shift of +56 mm Hg onSeptember 18 at 1100 hours. This was an example ofdata being transmitted in a real-time manner, but notbeing correct. Further, in this case, the data were cor-rectable because the gradual decline in TDG readings(with no change in spill) was consistent with a graduallyfailing TDG sensor.
Warrendale
At Warrendale, there was a faulty TDG sensor,which resulted in erratic TDG values from February 29,2000, at 1300 hours until March 2, 2000, at 0800 hours.The sensor was replaced, but there was no way to cor-rect the data in question, so it was deleted from the data-base.
Compensation depth for TDG measurement is thedepth above which degassing will occur. In order tomeasure TDG accurately, the probe must be deeper thanthe compensation depth, which is calculated as [TDGpressure, in millimeters of mercury, minus barometricpressure, in millimeters of mercury] divided by 23 (aconstant). This equation was based on a formula derivedfrom Colt (1984, page 104). If the probe is above theminimum compensation depth, the measured TDG maybe less than it would be if measured at a greater depth.
The compensation depth can be calculated forany given percent saturation of TDG if an assumption is
made for the barometric pressure. For example, if thbarometric pressure is assumed to be 760 mm Hg, athe TDG level is 120%, the TDG pressure would be 91mm Hg (120% of 760 mm Hg), and the compensatiodepth would be [912 - 760]/23 = 6.6 feet. Using thesame assumption for barometric pressure, at a TDGlevel of 145%, the compensation depth would be 14.feet. Where possible, the TDG probes were kept at adepth of 15 feet or greater.
Warrendale was the only site where the TDGprobe was above the compensation depth at any timewater year 2000. After the end of the spill on August 312000, the river stage had dropped, but supersaturatewater remained in the river from upstream dams, resuing in the probe depth being above the compensatiodepth for several days (fig. 16). This was because the physical characteristics of the site. The instrumenwere housed on a floating wooden dock, and the TDprobe was suspended from the dock. When the river wshallow at the Warrendale site, as it was in early September, the probe depth was about 4 feet because thwas the total depth of the river below the dock at thetime. In order to measure TDG at a greater depth, thprobe would need to be moved to a deeper part of thriver, but that was not possible because of the fixed loction of the site.
Bonneville
At the Bonneville site, there were data transmission problems from January 1 to January 5, 2000, resuing in 46 hours of missing real-time TDG data. Thecause of this missing data is unknown, but it may habeen due to large cranes that work in the dam area,which have been known to sometimes be placedbetween the DCP antenna and the orbiting satellite, thoccluding the satellite. These 46 hours of TDG datawere restored to the permanent database using the dlogged onsite by the DCP.
From July 21 to July 25, 2000, 91 hours of datawere missing from the Bonneville site due to failure othe DCP. In this case, the data were not logged onsiso it was not possible to restore the data to the databa
The Dalles Tailwater
Only 2 hours of TDG data were missing fromThe Dalles tailwater site. One datum was missing duecalibration activities on July 20, 2000, and the causeloss of the other datum is not known.
18

-2
0
2
4
6
8
10
12
14
10/1 11/20 1/9 2/28 4/18 6/7 7/27 9/15WATER YEAR 2000
Actual probe depth
Compensation depth
DE
PT
H B
ELO
W A
TE
R S
UR
FAC
E, I
N F
EE
T
Figure 16 . Compensation depth and actual probe depth at Warrendale.
he
egat
eseedtedgGse,s itill
in:p.
per-c-
e
alure6:.
r
The probe housing at The Dalles tailwater site isstrapped to anchors along a slope of rock rip-rap. Onseveral occasions during the monitoring season, the probehousing was raised or lowered according to the river stage.In this manner, it was possible to maintain the probe depthbelow the minimum compensation depth.
The Dalles Forebay
TDG data were missing from The Dalles forebay sitefor a 72-hour period from April 15 to April 18, 2000, dueto a ruptured TDG membrane. It was not possible torestore these data to the database.
DCP problems from August 29 to September 5,2000, were the cause of 19 hours of data that were missingin real-time. These data were later restored to the databasefrom the data logged onsite by the DCP.
John Day Tailwater
For the duplicate unit at the John Day tailwater site,45 hours of TDG data were missing from September 4 toSeptember 6, 2000, due to a rupture or tear in the TDGmembrane. These data could not be restored. There wereonly 3 hours of missing TDG data for the main unit at JohnDay tailwater.
John Day Forebay
Beginning on August 3, 2000, 23 hours of TDG datawere missing from the John Day forebay site due to anerror in reconnecting the electronic barometer during a
routine calibration. These data could not be restored to tdatabase.
On several occasions at the John Day forebay, thTDG value was observed to suddenly rise 10 or 20 mm Hfor several hours for no apparent reason. It was noted ththe water temperature also rose during these times. Thexcursions of TDG and water temperature were observon hot, sunny days, and it is believed that a parcel of heawater was drawn past the submerged TDG probe durinspill, causing the increase in water temperature. The TDmeasured at the probe would be expected to also increabecause when a gas is heated and the volume is fixed (ais inside the TDG membrane), the pressure of the gas wincrease.
REFERENCES CITED
Colt, J. 1984. Computation of dissolved gas concentrations water as functions of temperature, salinity, and pressureAmerican Fisheries Society Special Publication 14, 154
Jones, J.C., Tracey, D.C., and Sorensen, F.W., eds., 1991, Oating manual for the U.S. Geological Survey’s data-colletion system with the Geostationary OperationalEnvironmental Satellite: U.S. Geological Survey Open-FilReport 91–99, 237 p.
Tanner, D.Q., Harrison, H.E., and McKenzie, S.W., 1996, Totdissolved gas, barometric pressure, and water temperatdata, lower Columbia River, Oregon and Washington, 199U.S. Geological Survey Open-File Report 96–662A, 85 p
U.S. Environmental Protection Agency, 1986, Quality criteria fowater: Washington, D.C., EPA–440–5–86–001.
19