
Data Centers 2015 - Welcome | Burke & Quick...
18
Trading (800) 833-9291 / www.bqpartners.com Member FINRA/SIPC Equity Research Data Centers December 19, 2014 Data Centers 2015 Reliable Leasing Demand to Drive Occupancy, Cash Flow, Margins and Dividends in 2015 The Internet while widely adopted still remains an evolving, growing sector that is gaining market share. Over 40% of the world’s population has access to the Internet. It has surpassed 3 billion users. 1.1 billion websites exist today, up 68% year over year. Harnessing the power and reach of the Internet has become a competitive necessity for companies around the globe. Internet growth powers forward at a double-digit rate. Global digital advertising spending in 2014 could reach $138 billion, up 15%, representing 25% of total advertising spending according to eMarketer. Worldwide ecommerce spending could increase 20% this year to $1.5 trillion. More access to content via higher speeds is fueling Internet demand. Internet company growth rates, international exposure, profit creation and valuations vary widely. Many of the largest, most visible leading Internet stocks have moderating growth rates, heavy non-US revenue, marginal profit and/or high valuations. Stocks like Amazon (AMZN), Alibaba (BABA), Facebook (FB), Google (GOOG), Netflix (NFLX), Priceline (PCLN) and Twitter (TWTR) may have high economic sensitivity, volatility and risk. Given that the Internet sector has become more established and we may be in the late stages of the stock market recovery, we believe investors may find appealing less risky, reasonably valued, but still solidly growing Internet related stocks, like data centers. Data center stocks provide exposure to demand generated by Internet growth trends with less volatility and risk. Outsourcing and leasing demand has accelerated, pricing looks stable and facilities investments are scalable allowing margin expansion as existing customers demand more storage space. The global data center market defined as colocation, hosting and cloud could total approximately $58 billion dollars in 2014 and is forecasted to increase at a double-digit annual growth rate. The Data Center stocks trade at 14x 2015E AFFO and 13x 2015E EBITDA. We believe that the valuation multiple can go higher as the data center sector delivers increasingly reliable growth and margin expansion in 2015 which fosters returning cash to shareholders. The Burke & Quick Partners data center stocks includes CyrusOne (CONE- Outperform), CoreSite Realty (COR-Outperform), DuPont Fabros Technology (DFT-Outperform), Digital Realty Trust (DLR-Market Perform), Equinix (EQIX-Outperform) and Internap (INAP-Outperform). Outperform Data Centers Trading Data (EQIX): Last Price (12/18/2014) $228.20 52–Week High (12/11/2014) $233.82 52–Week Low (12/17/2013) $167.44 Market Cap. $12.97(B) Shares Out. 57,750(M) 3 Month Avg. Daily Vol. 651,650 AFFO Estimates (EQIX): (Dec) Q1 Q2 Q3 Q4 FY FY-16E 4.00 4.10 4.20 4.20 16.50 FY-15E 3.48 3.73 3.84 3.96 15.00 FY-14E 3.03A 3.27A 3.58A 3.62 13.50 FY-13A 2.91 2.87 2.89 3.10 11.77 Valuation (Data Center Sector): Multiple Curr. FY Next FY Next FY @ PT P/AFFO 16.6 15.0 17.0 EV/EBITDA 15.2 13.7 15.0 PEG 1.4 1.3 1.4 Source: Burke & Quick Partners LLC estimates Frederick W. Moran SVP/Senior Analyst (561) 370-7345 [email protected] See required disclosures at the end of report.
Transcript of Data Centers 2015 - Welcome | Burke & Quick...
Trading (800) 833-9291 / www.bqpartners.com
Member FINRA/SIPC
Equity Research
Data Centers
December 19, 2014
Data Centers 2015 Reliable Leasing Demand to Drive Occupancy, Cash Flow, Margins and Dividends in 2015
The Internet while widely adopted still remains an evolving, growing sector
that is gaining market share. Over 40% of the world’s population has access
to the Internet. It has surpassed 3 billion users. 1.1 billion websites exist
today, up 68% year over year. Harnessing the power and reach of the
Internet has become a competitive necessity for companies around the
globe.
Internet growth powers forward at a double-digit rate. Global digital
advertising spending in 2014 could reach $138 billion, up 15%,
representing 25% of total advertising spending according to eMarketer.
Worldwide ecommerce spending could increase 20% this year to $1.5
trillion. More access to content via higher speeds is fueling Internet
demand.
Internet company growth rates, international exposure, profit creation and
valuations vary widely. Many of the largest, most visible leading Internet
stocks have moderating growth rates, heavy non-US revenue, marginal
profit and/or high valuations. Stocks like Amazon (AMZN), Alibaba
(BABA), Facebook (FB), Google (GOOG), Netflix (NFLX), Priceline
(PCLN) and Twitter (TWTR) may have high economic sensitivity,
volatility and risk.
Given that the Internet sector has become more established and we may be
in the late stages of the stock market recovery, we believe investors may
find appealing less risky, reasonably valued, but still solidly growing
Internet related stocks, like data centers. Data center stocks provide
exposure to demand generated by Internet growth trends with less volatility
and risk. Outsourcing and leasing demand has accelerated, pricing looks
stable and facilities investments are scalable allowing margin expansion as
existing customers demand more storage space. The global data center
market defined as colocation, hosting and cloud could total approximately
$58 billion dollars in 2014 and is forecasted to increase at a double-digit
annual growth rate.
The Data Center stocks trade at 14x 2015E AFFO and 13x 2015E EBITDA.
We believe that the valuation multiple can go higher as the data center
sector delivers increasingly reliable growth and margin expansion in 2015
which fosters returning cash to shareholders.
The Burke & Quick Partners data center stocks includes CyrusOne (CONE-
Outperform), CoreSite Realty (COR-Outperform), DuPont Fabros
Technology (DFT-Outperform), Digital Realty Trust (DLR-Market
Perform), Equinix (EQIX-Outperform) and Internap (INAP-Outperform).
Outperform
Data Centers
Trading Data (EQIX): Last Price (12/18/2014) $228.20 52–Week High (12/11/2014) $233.82 52–Week Low (12/17/2013) $167.44 Market Cap. $12.97(B) Shares Out. 57,750(M) 3 Month Avg. Daily Vol. 651,650
AFFO Estimates (EQIX):
(Dec) Q1 Q2 Q3 Q4 FY
FY-16E 4.00 4.10 4.20 4.20 16.50 FY-15E 3.48 3.73 3.84 3.96 15.00 FY-14E 3.03A 3.27A 3.58A 3.62 13.50 FY-13A 2.91 2.87 2.89 3.10 11.77
Valuation (Data Center Sector):
Multiple Curr. FY Next FY Next FY @ PT
P/AFFO 16.6 15.0 17.0 EV/EBITDA 15.2 13.7 15.0 PEG 1.4 1.3 1.4 Source: Burke & Quick Partners LLC estimates
Frederick W. Moran SVP/Senior Analyst
(561) 370-7345
See required disclosures at the end of report.

December 19, 2014
Burke & Quick Partners, LLC.
Equinix, Inc. Page 2 of 18 Frederick W. Moran
Investment Thesis
The Burke & Quick Partners research universe of data center stocks includes
CyrusOne (CONE-Outperform), CoreSite Realty (COR-Outperform), DuPont
Fabros Technology (DFT-Outperform), Digital Realty Trust (DLR-Market
Perform), Equinix (EQIX-Outperform) and Internap (INAP-Outperform). We
believe that the sector of data centers stocks will outperform for the following
reasons:
1) Internet growth powers forward at a double-digit rate. Global digital
advertising spending in 2014 could reach $138 billion, up 15%. Worldwide
ecommerce spending could increase 20% this year to $1.5 trillion.
2) More content at faster speed is fueling Internet demand. Internet traffic and
data storage demand has blossomed over the last few years and could
sustain strong growth for many more years.
3) Today, data centers capture less than 20% of all data storage. As companies
experience the superior reliability, speed and pricing of outsourced
offerings demand should blossom allowing market share gains.
4) Outsourcing and leasing demand has accelerated, pricing looks stable and
facilities investments are scalable allowing margin expansion as existing
customers demand more storage space.
5) The global data center market defined as colocation, hosting and cloud
could total approximately $58 billion dollars in 2014 and is forecasted to
increase at a double-digit annual growth rate.
6) REIT structures shields from most corporate income tax. Dividends are
yielding between 3% and 5% annually and will likely grow with free cash
generation.
7) Given that the Internet sector is more established and we may be in the late
stages of the stock market recovery, we believe investors may look to less
risky, reasonably valued, but still solidly growing Internet related stocks.
8) The Data Center stocks trade at 14x 2015E AFFO and 13x 2015E EBITDA.
9) We believe that the valuation multiple of data centers can go higher as the
sector proves increasingly reliable growth and margins expand which
fosters returning cash to shareholders. The stocks could prove rewarding
and outperform.
Internet growth powers
forward at a double-digit
rate
More content at faster
speed is fueling demand
Data Centers capture less
than 20% of all data
storage
REIT structures shields
from most corporate
income tax
Investors may look to less
risky Internet related stocks
Increasingly reliable growth
and margin expansion
Leasing demand has
accelerated
$58 billion dollars in 2014
Data centers stocks could
outperform

December 19, 2014
Burke & Quick Partners, LLC.
Equinix, Inc. Page 3 of 18 Frederick W. Moran
The Data Center Industry
Data centers are buildings that house servers and related hardware. Data centers
require four things: power, space, bandwidth (fiber) and cooling. They are
typically located in large metropolitan markets where these resources are readily
available. The major US data center markets are Silicon Valley, New York,
Northern Virginia, Dallas, Miami, Chicago and Los Angeles. The primary
European markets are London, Frankfurt, Amsterdam and Paris. The top locations
in Asia are Hong Kong, Tokyo, Singapore and Sydney.
Different markets are driven by different customers, and the differences are
predictable. Silicon Valley has many Internet content and software-as-a-service
companies. New York has a sizable financial contingent complementing
generally smaller Internet companies and European telecommunications
companies. Northern Virginia is primarily telecoms, Internet companies and
government. Miami hosts many Latin American companies.
The global data center demand is growing annually at a double-digit pace while
supply rises mid-single digits. Data center construction typically takes about one
year. Over the past year demand have accelerated. Pricing has held steady. Pricing
typically starts to move up once 70% of capacity is reached in any one center. At
70%, space is still available but not easily accessible for expansion by an existing
customer.
Businesses across Internet commerce, advertising and content, data center
demand remain robust with sustained revenue growth. Internet traffic should
growth over 20% per year through 2018 according to Cisco.
The biggest concerns of data center customers are capacity, connectivity, power
and uptime. Other concerns include cooling, computing power, tech support,
security and speed of expansion, which are equally important but somewhat easier
to duplicate. Customers are typically charged rental space, power utilization fees
and service costs.
The main reasons for purchasing new servers are normal demand driven needs
for increases in capacity, upgrades to old servers and new server purchases for
new applications. All three of these drivers should increase demand for either data
center capacity and/or power utilization.
Addressable Market
Worldwide IT spending is on pace to total $3.8 trillion in 2014, a 3.2% increase
from 2013 spending, according to the latest forecast by Gartner, Inc. International
Data Corporation (IDC) Worldwide Black Book projects worldwide IT spending
will increase by 4.1% in constant currency this year down from last year’s growth
of 4.5%. Forrester estimates Global Tech Purchases will rise 3.3% in 2014.
IT will not be outsourced completely. However, a significant amount of IT
infrastructure could be outsourced to data center providers over time. Another
indicator of the addressable market for IT infrastructure is total IT hardware
expenditures. IT infrastructure providers replace internal data centers, which
represent a significant portion of IT hardware costs. IT infrastructure is becoming
an increasingly larger portion of hardware costs as applications are delivered over
networks instead of individual desktops. IDC says the top priority of Chief
Data Center demand is
growing annually at a mid-
teens pace
Capacity, connectivity,
power and uptime
Data centers are buildings
that house servers and
related hardware
Worldwide IT spending is
on pace to total $3.8 trillion
in 2014, a 3.2% increase

December 19, 2014
Burke & Quick Partners, LLC.
Equinix, Inc. Page 4 of 18 Frederick W. Moran
Information Officers is reducing costs. Sharing infrastructure via outsourcing is
the most compelling way to reduce this capital and operating expense.
Growth Drivers
Data Center revenue growth has been about 15% annually. Growth is maintained
as companies recognize the efficiency inherent in sharing infrastructure. Cost
savings of as much as 50%, coupled with more flexibility, drive corporations to
outsource. Faster broadband speeds and improving technology also contribute to
IT outsourcing growth. Roughly 85% of servers are on the premises of the
company utilizing them.
Blossoming Internet communications is a primary contributor to data center
growth. The evolution of Internet communications as the primary means of
communication for both companies and individuals is a core driver of IP and data
center growth. This is evident in the consumption of Internet media, content and
information, represented by Google, Facebook, Netflix and YouTube.
Ecommerce is another contributor, best exemplified by the market share gains of
online commerce companies like Amazon. Ecommerce spending sustains 20%
growth while retail grows at a mid-single digits pace.
Consumer Internet consumption continues to increase rapidly. According to
eMarketer, 75% of online users watch digital videos. However, Nielsen believes
the average online user watches less than four hours of online video per month.
We believe as broadband speed increases, the consumption of online video will
grow rapidly. The list goes on – gaming, peer-2-peer, rich media advertising – all
should contribute to an explosion in usage that requires greater server capacity
and drives data center demand and revenue.
Beyond consumer-driven IP growth, corporations are relying increasingly on IP
for communicating. Email, instant messaging, and voice are currently delivered
via the Internet. In addition, software and applications such as customer
relationship management are utilized via the Internet and housed remotely at data
centers. Increasing real-time business requirements and storage needs add to
demand. Electronic trading is also growing rapidly and adding to network and
server demands.
Internet data traffic has increased more than fivefold over the last 5 years and
could increase threefold over the next 5 years according to Cicso Systems. Cisco
Systems, which is the largest manufacturer of IP equipment, believes IP traffic
will grow at a compound annual growth rate of over 20% through 2018.
While IP traffic is growing rapidly, IT continues to be complex and ever-
changing. Coupling this with recent technology improvements such as
virtualization and faster broadband speed creates an attractive environment for
outsourcing IT to data centers. Given as much as 80%–90% of computing
capacity on dedicated servers goes unused at any given time, virtualization
enables unused capacity to be utilized.
Data Center revenue
growth has been about
15% per year
Internet consumption
continues to increase
rapidly
Internet data traffic grew
increased more than
fivefold over the last 5
years

December 19, 2014
Burke & Quick Partners, LLC.
Equinix, Inc. Page 5 of 18 Frederick W. Moran
REITS
REITS are Real Estate Investment Trusts. Companies with this tax structure can
be of higher relative value than non-REIT companies because profits are largely
shielded from corporate income tax. That savings can be passed along to the
shareholders in the form of dividend. Often REITs have fairly high dividend. The
publicly traded data center REITs have dividends ranging from 3% to 5%
annually.
To qualify as a REIT a company must have at least 75% of its assets in real estate,
75% of income must come from real estate, 90% of pre-tax income must be
distributed to shareholders, no more than 50% of the stock can be owned by five
or fewer individuals, and the company cannot own more than 10% of a tenant.
Today, most of the publicly traded Data Centers have a REIT structure. All would
likely qualify because data centers are physical buildings that rent space to clients
housing servers to store and transmit data.
Risks
Macro-Economic and Interest Rates
Data center demand can fluctuate depending on economic conditions. Rising
interest rates can hurt data center stocks in a number of different ways. First, rising
interest rates make the dividend yield of REITs less attractive because alternatives
including risk free treasuries become a more viable alternative. Second, the cost
of borrowings of both existing variable loans and future loans can impair bottom-
line profits including AFFO. Third, rising interest rates lessen the present value
of future cash flow.
Competition and Pricing
Communications real-estate and hosting services are highly fragmented and
competitive sectors.
Pricing may be pressured over time as data centers compete with large companies
that have greater resources, such as Microsoft, IBM, EDS, AT&T and Amazon.
These companies have the ability to invest materially more capital in their
businesses. They also could lower pricing given they have greater scale.
Historically data center industry colocations contracts have averaged 2-3 years,
but more recently contracts have spanned 3-7 years. While pricing pressure and
potential margin erosion is a threat to the business opportunity, the outstripping
of demand versus supply has allowed stable pricing in 2014.
Virtualization and Potential Pricing Power Deterioration
Virtualization is a broad IT term referring to the abstraction of computing
resources to perform multiple tasks. As much as 80%–90% of computing capacity
on dedicated servers goes unused at any given time. Cloud computing is a hot
REITS are Real Estate
Investment Trusts
Pricing may be pressured
Rising interest rates can
hurt data centers
Recently contracts have
spanned 3-7 years
Most of the publicly traded
Data Centers are REITs
December 19, 2014
Burke & Quick Partners, LLC.
Equinix, Inc. Page 6 of 18 Frederick W. Moran
area within virtualization. Cloud computing refers to computing resources made
accessible as scalable, on-demand services over a network. Cloud computing
combines virtualization, service-orientation, elasticity, multi-tenancy and pay-as-
you-go billing. Adopters of cloud computing seek to capture improved cost
efficiencies, accelerated innovation cycles, faster time-to-market deployment,
and scalability on-demand.
Virtualization enables colocation clients to occupy less space because server
efficiency improves. Customers can now run multiple applications or projects on
a single or group of shared servers, as opposed to dedicating individual servers
for each project or task. This can result in lower colocation revenue per customer
for the group but might aid cloud revenue.
Virtualization is an example of how technological advancement might impact the
colocation business negatively. In general, as server hardware advances, the
amount of physical space required to power the same computing capacity could
lessen. If technological advancements overwhelm the trend of growing IP traffic,
then colocation demand and pricing could decline.
Availability of and Access to Credit
Data Center development requires meaningful, substantial upfront spending to
construct and build facilities. Availability of capital is critical to future growth.
Should lending markets tighten, facility development could suffer.
Dependence on a Limited Number of Large Enterprise Clients
Liquidity crises and customer bankruptcies add to churn. Recent signs point to
steady improvement in the economy, the consumer, credit and the economy, but
demand can be sensitive to any change in these variables.
Publicly Traded Data Center Operators
CyrusOne Inc.
CyrusOne (CONE) operates 25 Data Centers. It serves 656 customers including
141 of the Fortune 1000. CyrusOne seeks to serve as the preferred global data
center provider to the global Fortune 1000. Its 25 facilities comprise 1.2 million
colocation square feet. While its customer base is fairly diversified, two of
CyrusOne’s largest sectors are Energy and IT, each representing roughly 30% of
revenue. The company headquarters is located just north of Dallas, Texas at 1649
West Frankford Road, Carrollton, Texas 75007.
CyrusOne should sustain strong business momentum in 2015 as it has already
constructed enough data center building shell to allow for nearly a doubling of
total company capacity, its latest facility in Phoenix was built in an industry
record 107 days, year to date new lease signings are at record levels and
management led by CEO Gary Wojtaszek appears focused on both operational
and stock performance.
Virtualization enables
colocation clients to occupy
less space
CyrusOne operates 25
Data Centers comprising
1.2 million square feet
serving 656 customers
Availability of capital is
critical
Churn
Has enough data center
building shell to allow for
nearly a doubling of total
company capacity
December 19, 2014
Burke & Quick Partners, LLC.
Equinix, Inc. Page 7 of 18 Frederick W. Moran
CyrusOne has had a record rate of lease signings in 2014. Almost 200,000
colocation square feet representing an estimated $70 million of incremental
revenue of new leases have been signed thus far this year.
CyrusOne is attracting customers who are signing larger deals for more space
with longer-term contracts and metered power. The average lease term for leases
signed in 2014 was 6 ½ years versus roughly a 3 year average lease life remaining
across its top 20 clients. This demonstrates demand momentum and sustainability.
Existing data center customers drive the majority of new demand with a “tail” of
growing capacity requirements. On average, 40% of the present value of from a
customer is not realized in the initial lease signing. The explosion of data and
increased comfort of outsourcing has fostered customers to steadily increase their
capacity needs.
CyrusOne has added $350 million of new facilities in the last two years. Total
investment in real estate is roughly $1.2 billion. It now has 1.2 million colocation
square feet of data center space developed across 25 facilities. 44 new customers
of which 12 are Fortune 1000 have been added so far this year driven via internal
sales in the first half and thanks to help from indirect sales in the third quarter
from 120 sales partners. Improved brand recognition has also contributed to new
account wins. Utilization is 88%.
Expansion construction on new facilities continues in Houston, San Antonio and
Northern Virginia which by early 2015 could add 580,000 net rentable square feet
including 90,000 colocation square feet. The initial phase of Phoenix 2 which
included the shell and 30,000 pre-leased colocation square feet was completed in
October 2014 in a record 107 days. The Phoenix 2 shell has room to double total
colocation square feet. Total company square feet available for lease at early 2015
should reach 1.3 million.
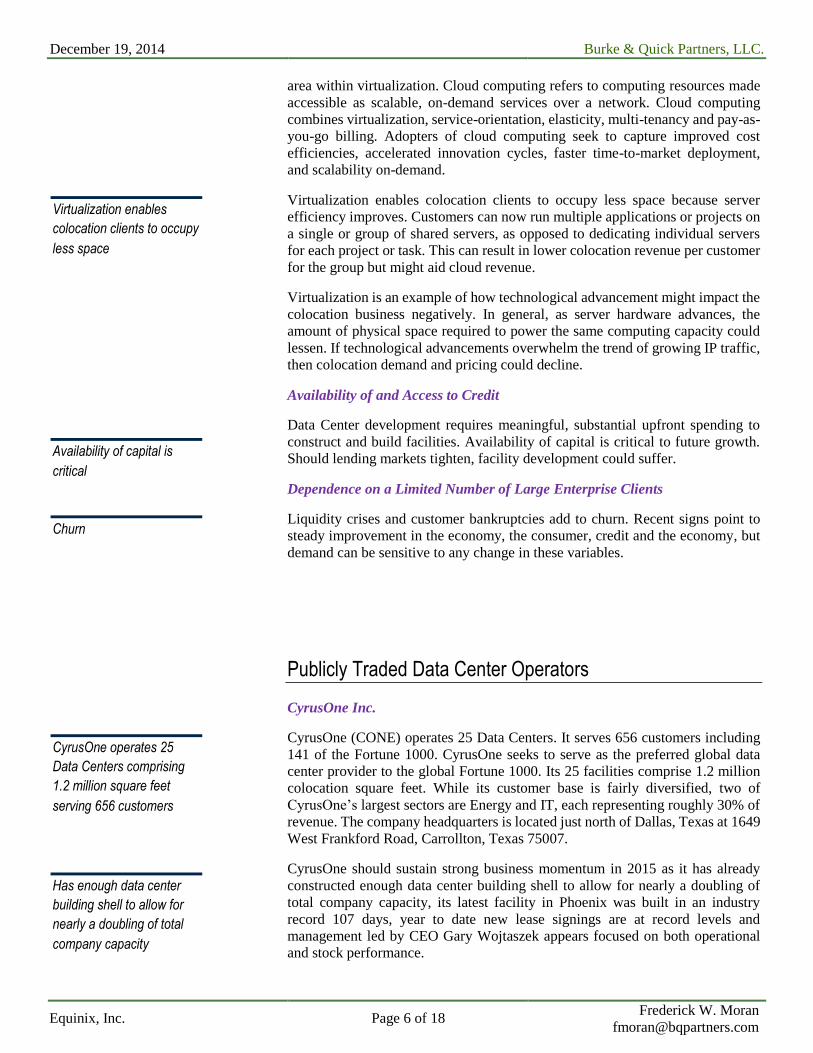
For the full year 2014, we estimate revenue will grow 25% to $330 million
yielding EBITDA of $168 million, up 21%. AFFO could reach $1.70 per share.
Our 2015 estimates call for 15% revenue growth to $380 million leading to 18%
EBITDA growth to $198 million and AFFO of $2.10 per share. Management
plans to re-allocate capital into existing markets rather than start new markets.
CyrusOne - Consensus Estimates
($ in thousands, except per share data)
Burke & Quick 4Q14E Company Guidance 4Q14E Street Consensus
Revenue $86,000 $85,727
EBITDA $43,300 $42,485
AFFO $0.45 $0.42
2014E 2014E
Revenue $330,000 $327,500 $329,777
EBITDA $168,000 $167,500 $166,539
AFFO $1.70 $1.66
2015E 2015E
Revenue $380,000 $381,701
EBITDA $198,000 $194,193
AFFO $2.10 $1.97
Source: Factset and Burke & Quick Partners Estimates.
AFFO could reach $1.70
per share in 2014
Added $350 million of new
facilities
Record rate of lease
signings at $70mm 2014
Average lease term for
leases signed in 2014 was
6 ½ years
18% EBITDA growth to
$198 million and AFFO of
$2.10 per share in 2015
December 19, 2014
Burke & Quick Partners, LLC.
Equinix, Inc. Page 8 of 18 Frederick W. Moran
We speculate another roughly 200,000 csf could be added in 2015. The plan is to
spend less capital in 2015 with a higher return.
CyrusOne has long-term debt of $555 million plus $14 million of capital lease
obligations and cash of $30 million. Net debt to annualized EBITDA stands at 3x.
CyrusOne pays a $0.21 per share quarterly dividend.
CyrusOne trades below peers despite superior market positioning and growth
potential. Using 17x 2015E AFFO and 15x EBITDA, we maintain our per share
price target for CyrusOne of $36.
CoreSite Realty Corporation
CoreSite Realty Corporation controls a property portfolio which includes 16 data
centers with 1.3 million of colocation raised square feet (86% utilized) and real
estate totaling 2.7 million square feet in eight major communications markets
across the United States serving more than 800 customers.
While CoreSite is one of the smallest data center REITs, its facilities are
strategically located in some of the largest and fastest growing data center markets
in the United States, including Los Angeles, the San Francisco Bay and Northern
Virginia areas, Chicago, Denver, Miami, New York City and its new campus in
Secaucus, New Jersey. CoreSite is one of the fastest organically growing
publicly-traded Data Center REITS with potential to sustain leading growth for
years to come. CoreSite Realty Corporation is headquartered at 1001 17th Street,
Suite 500, Denver, CO 80202.
The Carlyle Group is CoreSite’s largest shareholder owning 55% of the company.
Carlyle is one of the largest and most prestigious private equity firms with more
than $203 billion in assets under management. Typically private equity firms
invest for a number of years and then look to execute a liquidation event.
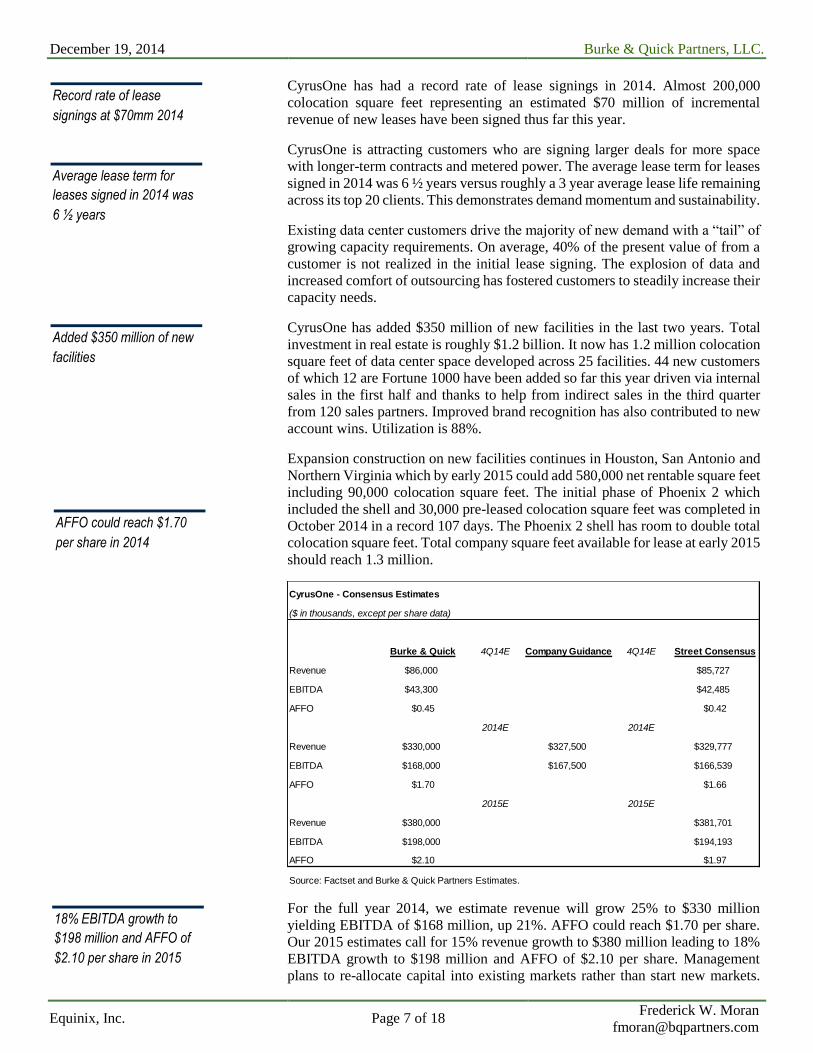
For the full year 2014, we estimate revenue will grow 15% to $270 million ($268
million prior estimate) yielding EBITDA of $132 million, up 23%. We estimate
2014 FFO could reach $2.15 per share. CoreSite management’s guidance of FFO
CoreSite Realty - Consensus Estimates
($ in thousands, except per share data)
Burke & Quick 4Q14E Guidance 4Q14E Consensus
Revenue $70,072 $71,110
EBITDA $34,977 $33,782
FFO $0.58 $0.56
AFFO $0.47 $0.47
2014E 2014E
Revenue $270,000 $270,000 $271,026
EBITDA $132,000 $131,000 $128,860
FFO $2.15 $2.14 $2.16
AFFO $1.75 $1.73
2015E 2015E
Revenue $302,000 $304,417
EBITDA $150,000 $144,014
FFO $2.45 $2.43
AFFO $2.10 $2.12
Source: Factset and Burke & Quick Partners Estimates.
CoreSite Realty is
headquartered in Denver
16 data centers with 1.3
million of CRSF square feet
Net debt to annualized
EBITDA stands at 3x
Carlyle Group is CoreSite’s
largest shareholder owning
55% of the company

December 19, 2014
Burke & Quick Partners, LLC.
Equinix, Inc. Page 9 of 18 Frederick W. Moran
calls for a range of $2.12 to $2.16. Our AFFO estimate which deducts recurring
capital spending is $1.70 per share.
Our 2015 financial projections call for 12% revenue growth to $302 million
leading to 14% EBITDA growth to $150 million. 2015 FFO could reach $2.46
per share and AFFO $2.10 per share.
For CoreSite Realty, debt to EBITDA stands at roughly 2x. Including preferred
obligations of $115 million the ratio jumps to 3x. CoreSite Realty offers shielded
free cash generation thanks to its favorable REIT tax status. A $0.42 quarterly
dividend currently yields over 4% annually. Using 20x 2015E AFFO and 15x
EBITDA, our price target for CoreSite is $41.
DuPont Fabros Technology, Inc.
DuPont Fabros Technology, Inc. owns, develops, operates and manages data
centers. It leases access on a triple-net wholesale basis. Its portfolio includes 11
facilities in 4 major markets totaling 2.8 gross square feet and 1.4 million
wholesale computer room square feet (CRSF) offering 240 megawatts of critical
load. It has heavy exposure to Northern Virginia via a 6 facility campus in
Ashburn, a facility in Reston and one in Bristow; all in an area that is one of the
two most fiber dense areas in the U.S. We believe DuPont Fabros is the largest
Data Center provider in Northern Virginia. The portfolio was 97% leased (93%
if you include “not stabilized” properties.
DuPont Fabros serves Internet industry leaders, including Microsoft, Facebook,
Yahoo! and Rackspace. In total, DuPont Fabros serves 34 customers with 100
different lease expirations and an average remaining lease term of 6.1 years. The
top 4 clients represent 61% of annual base rent. Investment grade or equivalent
large enterprises represent 77% of revenue. The company is structured as a Real
Estate Investment Trust (REIT). DuPont Fabros is headquartered in our Nation’s
capital just four blocks from the White House at 1212 New York Avenue, NW,
Suite 900, Washington, D.C 20005.
Yahoo! has begun a multi-year shift of its servers away from DuPont to its
company-owned Buffalo, NY based facility which offers it company specific tax
advantages. Yahoo! entered into a tri-party sublease agreement with one of
DuPont Fabros’ existing large customers for 13.65 MW expiring in 4.55 MW
tranches in 2017-2019 in its ACC$ data center. Yahoo! will pay through the
remainder of its lease. Then the sublease customer has contracted to continue at
lower current market pricing levels, so that the entire lease now terminates in
2019.
Management has extended its CEO succession plan in an effort to hasten a near-
term resolution. The company plans to hire a candidate to immediately assume
the role of CEO and President. Current CEO Fateh will support the successor and
remain on the Board.
Given DuPont’s facilities are almost at full capacity, 97% leased, and
management has taken a methodical approach to new facility development,
growth may be somewhat hindered as pricing typically does not outpace inflation.
For the full year 2014, we estimate revenue will grow 11% to $417 million
yielding EBITDA of $268 million, up 10%. AFFO could reach $2.50 per share.
Dividend yields over 4%
AFFO could reach $2.50
per share in 2014 and
$2.70 in 2015
11 facilities in 4 major
markets with heavy
exposure to Northern VA
2015 AFFO $2.10
Average remaining lease
term of 6.3 years
Yahoo! entered into a tri-
party sublease agreement
97% leased

December 19, 2014
Burke & Quick Partners, LLC.
Equinix, Inc. Page 10 of 18 Frederick W. Moran
Our 2015 estimates call for 7% revenue growth to $447 million leading to
EBITDA of $290 million, up 8%, and AFFO of $2.70 per share, up 8%
Performance might be boosted by two projects currently under development
including Santa Clara SCA Phase 11B offering 9.1 megawatts which is currently
50% pre-leased and expected to deliver in early 2Q15 and Chicago CH2 Phase 1
offering 7.1 megawatts expected 3Q15.
DuPont Fabros has long-term debt of $965 million. Debt maturities begin in 2018,
2019 and balloon with $600 million due in 2021. Net debt to annualized EBITDA
stands at 3.5x. Cash flow coverage of interest is almost 6x. Preferred stock adds
$351 million to liabilities.
DuPont Fabros offers shielded free cash generation thanks to its favorable REIT
tax status. It pays a $0.42 quarterly dividend yielding 5% annually. The dividend
was increased 5 times over the last 11 quarters. The payout ratio is less than 65%
of AFFO.
Digital Realty Trust
Digital Realty Trust, Inc. is one of the 20 largest publicly-traded U.S. real estate
investment trusts (REIT) and the biggest that specifically focuses on
infrastructure for the digital economy. Digital Realty offers data center solutions
by building and leasing facilities throughout the world via 130 properties. Its
portfolio is located in 30 markets throughout North America, Europe, Asia and
Australia. The properties aggregate 24.5 million square feet including
approximately 1.3 million square feet of space under active development and 1.4
million square feet of space held for future development.
Digital Realty offers data center and colocation service to over 600 clients via
over 2,000 leases. Its clients include domestic and international companies across
multiple industry verticals, of all sizes, ranging from financial services, cloud and
information technology services, to manufacturing, energy, gaming, life sciences,
DuPont Fabros - Consensus Estimates
($ in thousands, except per share data)
Burke & Quick 4Q14E Guidance 4Q14E Consensus
Revenue $107,385 $106,249
EBITDA $68,388 $71,056
FFO $0.62 $0.62 $0.62
AFFO $0.62 $0.66
2014E 2014E
Revenue $417,000 $415,000 $415,003
EBITDA $268,000 $271,498
FFO $2.42 $2.40 $2.41
AFFO $2.50 $2.51
2015E 2015E
Revenue $447,000 $443,758
EBITDA $290,000 $290,336
FFO $2.60 $2.56
AFFO $2.70 $2.66
Source: Factset and Burke & Quick Partners Estimates.
Net debt to annualized
EBITDA stands at 3.5x
DLR is one of 20 largest
publicly-traded U.S. REITs
24.5 million square feet
DFT’s dividend yields 5%.
It was increased 5 times
over the last 11 quarters

December 19, 2014
Burke & Quick Partners, LLC.
Equinix, Inc. Page 11 of 18 Frederick W. Moran
health care, and consumer products. Digital Realty Trust has been a publicly
traded stock for ten years generating positive year over year growth in both
dividends and FFO per share every one of those years. It is headquartered at Four
Embarcadero Center, Suite 3200, San Francisco, CA 94111.
Digital Realty’s management mentioned its plans for potential assets sales over
the next few quarters. It could strengthen the balance sheet ensuring the
company’s investment grade debt rating while supporting the dividend and
possibly sparking an extra one-time dividend.
Digital Realty’s pricing disciple combined with increased rent per square foot
should allow mid-single digit revenue and EBITDA growth. For the full year
2014, we estimate that revenue could reach $1.62 billion, up 9%. EBITDA could
hit $935 million, up 6%. Core funds from operations (CFFO) could reach $4.90
per share in 2014 and adjusted funds from operations (AFFO) could be $3.75. In
2015, we estimate CFFO of $5.00 and AFFO of $4.00.
Digital Realty offers shielded free cash generation thanks to its favorable REIT
tax status. It has provided 10 consecutive years of dividend increases. The last
authorized quarterly cash dividend of $0.83 per share to common stockholders
was paid on September 30, 2014. A $0.83 quarterly dividend currently yields 5%
annually.
Digital Realty Trust trades above the data center group despite slower growth
likely due to its size and high dividend yield. Using 18x AFFO and 15x EBITDA,
we maintain a price target of $70 for Digital Realty Trust.
Equinix
Equinix Inc. builds and operates data center facilities across the United States,
Europe and Asia. It operates 101 data centers in 32 markets across 15 countries
in the Americas, EMEA, and Asia-Pacific on five continents. In total it controls
Digital Realty - Consensus Estimates
($ in millions, except per share data)
Burke & Quick 4Q14E Guidance 4Q14E Consensus
Revenue $415,778 $413,448
EBITDA $232,359 $233,650
CFFO $1.19 $1.23
AFFO $0.89 $0.95
2014E 2014E
Revenue $1,620,000 $1,619,342
EBITDA $935,000 $927,993
CFFO $4.90 $4.93 $4.91
AFFO $3.75 $3.74
2015E 2015E
Revenue $1,720,000 $1,703,372
EBITDA $980,000 $977,564
CFFO $5.00 $5.09
AFFO $4.00 $3.99
Source: Factset and Burke & Quick Partners Estimates.
100 data centers in 32
markets across 15
countries
Potential assets sales over
the next few quarters
Pricing disciple
10 consecutive years of
dividend increases
December 19, 2014
Burke & Quick Partners, LLC.
Equinix, Inc. Page 12 of 18 Frederick W. Moran
3.8 million square feet of colocation space. The company headquarters is located
at One Lagoon Drive, 4th Floor, Redwood City, CA 94065.
Equinix has filed for REIT tax status. It is scheduled to convert into a REIT at the
start of 2015. Employing a REIT structure will shield it from most corporate
income tax. The introduction of a regular dividend will be required in order to
comply with being a REIT.
The conversion to a REIT could boost valuation as shielding future corporate
income taxation results in incremental shareholder value creation in the form of
dividends.
Inclusion in REIT indexes could broaden Equinix’s shareholder base and further
enhance valuation. After Equinix converts to a REIT on 1/1/2015. In our opinion,
it will likely get reviewed and included into the two leading REIT indices RMZ
and FTSE/NAREIT. We expect this to occur mid to late in the first quarter of
2015.
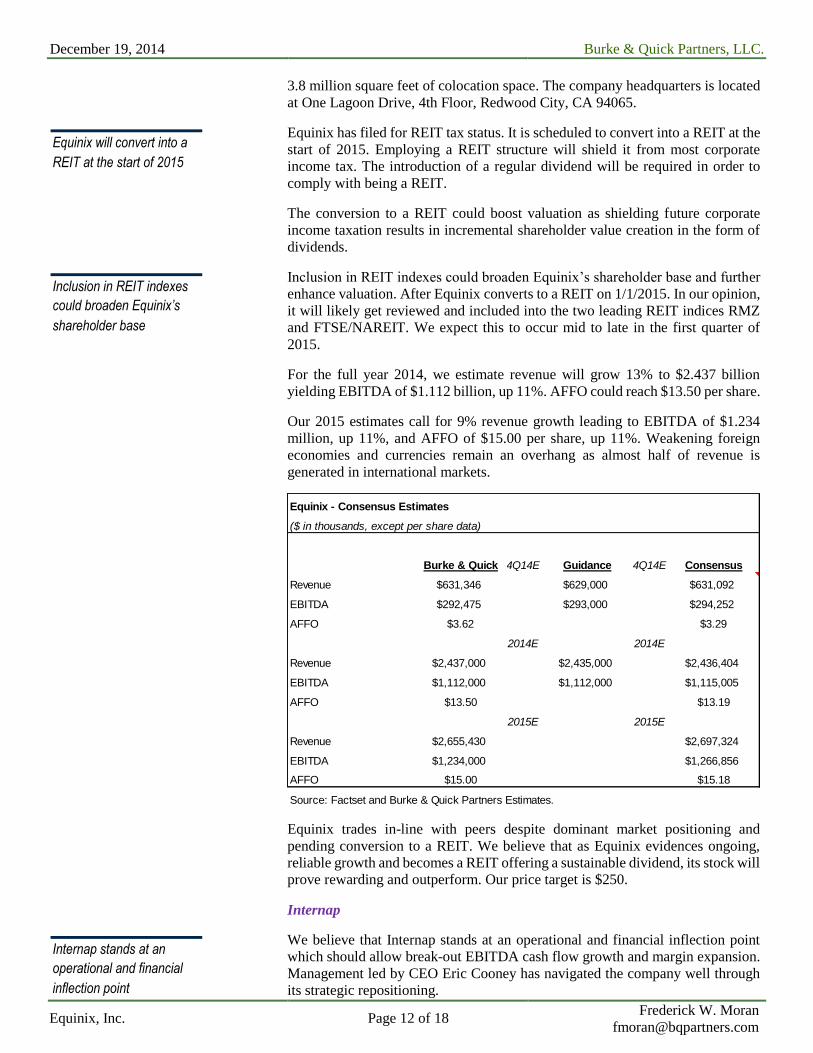
For the full year 2014, we estimate revenue will grow 13% to $2.437 billion
yielding EBITDA of $1.112 billion, up 11%. AFFO could reach $13.50 per share.
Our 2015 estimates call for 9% revenue growth leading to EBITDA of $1.234
million, up 11%, and AFFO of $15.00 per share, up 11%. Weakening foreign
economies and currencies remain an overhang as almost half of revenue is
generated in international markets.
Equinix trades in-line with peers despite dominant market positioning and
pending conversion to a REIT. We believe that as Equinix evidences ongoing,
reliable growth and becomes a REIT offering a sustainable dividend, its stock will
prove rewarding and outperform. Our price target is $250.
Internap
We believe that Internap stands at an operational and financial inflection point
which should allow break-out EBITDA cash flow growth and margin expansion.
Management led by CEO Eric Cooney has navigated the company well through
its strategic repositioning.
Equinix - Consensus Estimates
($ in thousands, except per share data)
Burke & Quick 4Q14E Guidance 4Q14E Consensus
Revenue $631,346 $629,000 $631,092
EBITDA $292,475 $293,000 $294,252
AFFO $3.62 $3.29
2014E 2014E
Revenue $2,437,000 $2,435,000 $2,436,404
EBITDA $1,112,000 $1,112,000 $1,115,005
AFFO $13.50 $13.19
2015E 2015E
Revenue $2,655,430 $2,697,324
EBITDA $1,234,000 $1,266,856
AFFO $15.00 $15.18
Source: Factset and Burke & Quick Partners Estimates.
Equinix will convert into a
REIT at the start of 2015
Inclusion in REIT indexes
could broaden Equinix’s
shareholder base
Internap stands at an
operational and financial
inflection point

December 19, 2014
Burke & Quick Partners, LLC.
Equinix, Inc. Page 13 of 18 Frederick W. Moran
Growth has accelerated thanks to new data center launches and the acquisition of
iWeb. Having spent roughly $300 million over the last few years building out 16
company owned data centers which are at only a 60% data center capacity
utilization rate, Internap has room to meaningfully add customers without
spending heavily on facilities expansion.
Data center service now represents 73% of total company revenue, up from 60%
only two years ago. The core owned data centers alone represent 59% of revenue
versus 42% two years ago. Core owned data center revenues grew 16% on an
organic basis in 3Q14.
Mario Gabelli’s GAMCO, Gabelli Funds and associated entities stand as
Internap’s largest shareholder owning roughly 10.1 million shares (down from a
peak of 10.5 million) or 18.6% (prior 19.3%) of the company. According to a
Form 13-D filed with the SEC on November 18, 2014,
http://ir.internap.com/sec.cfm, Gabelli sold a net of roughly 400,000 shares of
Internap between 9/19/14 and 11/18/14 at prices ranging from $6.55 per share to
$8.17 per share.
We speculate that Gabelli has traded around his core position in Internap likely
for tax planning and/or short-term trading reasons. Gabelli’s investment style
often uncovers unrecognized value through investing in companies that sell below
private market value while waiting patiently to see the value get recognized. We
believe Gabelli remains positioned for the long-term especially given the recent
impressive operating results and potential for break-out margin improvement
ahead Internap reported accelerating growth and expanding margins in its 3Q14
financial results and guided to higher than expected 4Q14 EBITDA.
Internap - Consensus Estimates
($ in thousands, except per share data)
Burke & Quick 4Q 2014 Consensus
Revenue $85,000 $84,518
EBITDA $21,984 $21,768
AFFO $0.21
2014
Revenue $335,696 $335,372
EBITDA $78,000 $77,176
AFFO $0.66
2015
Revenue $355,000 $350,967
EBITDA $90,000 $88,931
AFFO $0.90
Source: Factset and Burke & Quick Partners Estimates.
Gabelli sold a net of
roughly 400,000 shares
Gabelli remains positioned
for the long-term
Data center service now
represents 73% of total
company revenue
Invested $300mm
launching new data centers

December 19, 2014
Burke & Quick Partners, LLC.
Equinix, Inc. Page 14 of 18 Frederick W. Moran
We estimate Internap will produce $336 million of revenue, $78 million
EBITDA, $36 million of recurring free cash flow and $0.66 per share of AFFO
in 2014. After all capital requirements Internap may “burn” roughly $24 million
in cash in 2014.
On a recent investor conference call management confirmed they believe that the
new margin levels can be sustained and extended further. We suspect that as
EBITDA margins rise thanks to an increasing percentage of growth coming from
the core owned data centers, Internap’s valuation gap relative to its peers could
improve.
In 2015, EBITDA could grow 15% to $90 million producing $0.90 per share in
AFFO and/or recurring free cash flow per share.
Internap has long-term debt of $293 million, $54 million in capital lease
obligations and working capital of negative $4 million. Net debt to EBITDA
stands above 4x. The company’s goal is to reduce leverage ½ a turn every year
until it hits 3x.
Internap trades at only 8x 2015E AFFO and EBITDA, a substantial discount to
the group. Using 11x 2015E AFFO of $0.90 and 10x EBITDA of $90 million, our
price target is $10. Our rating on Internap is Outperform.
Valuation
The Data Center sector trades at 14x 2015E AFFO and 13x 2015E EBITDA with
a double-digit rate of annual growth. With a recurring business model and
infrastructure that has strategic value, we believe the multiple can go higher.
Internap trades at only 8x
EBITDA could grow 15% to
$90 million in 2015
$78 million EBITDA 2014
Margins can be sustained
and extended further
December 19, 2014
Burke & Quick Partners, LLC.
Equinix, Inc. Page 15 of 18 Frederick W. Moran
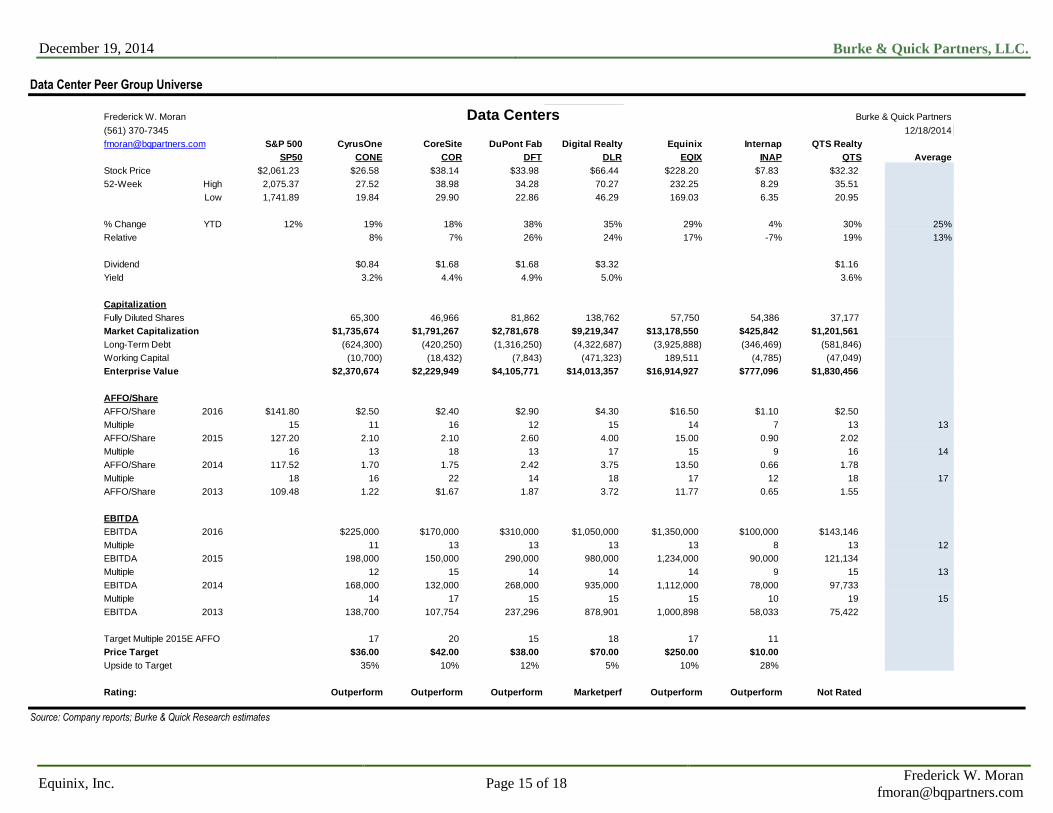
Data Center Peer Group Universe
Source: Company reports; Burke & Quick Research estimates
Frederick W. Moran Data Centers Burke & Quick Partners
(561) 370-7345 12/18/2014
[email protected] S&P 500 CyrusOne CoreSite DuPont Fab Digital Realty Equinix Internap QTS Realty
SP50 CONE COR DFT DLR EQIX INAP QTS Average
Stock Price $2,061.23 $26.58 $38.14 $33.98 $66.44 $228.20 $7.83 $32.32
52-Week High 2,075.37 27.52 38.98 34.28 70.27 232.25 8.29 35.51
Low 1,741.89 19.84 29.90 22.86 46.29 169.03 6.35 20.95
% Change YTD 12% 19% 18% 38% 35% 29% 4% 30% 25%
Relative 8% 7% 26% 24% 17% -7% 19% 13%
Dividend $0.84 $1.68 $1.68 $3.32 $1.16
Yield 3.2% 4.4% 4.9% 5.0% 3.6%
Capitalization
Fully Diluted Shares 65,300 46,966 81,862 138,762 57,750 54,386 37,177
Market Capitalization $1,735,674 $1,791,267 $2,781,678 $9,219,347 $13,178,550 $425,842 $1,201,561
Long-Term Debt (624,300) (420,250) (1,316,250) (4,322,687) (3,925,888) (346,469) (581,846)
Working Capital (10,700) (18,432) (7,843) (471,323) 189,511 (4,785) (47,049)
Enterprise Value $2,370,674 $2,229,949 $4,105,771 $14,013,357 $16,914,927 $777,096 $1,830,456
AFFO/Share
AFFO/Share 2016 $141.80 $2.50 $2.40 $2.90 $4.30 $16.50 $1.10 $2.50
Multiple 15 11 16 12 15 14 7 13 13
AFFO/Share 2015 127.20 2.10 2.10 2.60 4.00 15.00 0.90 2.02
Multiple 16 13 18 13 17 15 9 16 14
AFFO/Share 2014 117.52 1.70 1.75 2.42 3.75 13.50 0.66 1.78
Multiple 18 16 22 14 18 17 12 18 17
AFFO/Share 2013 109.48 1.22 $1.67 1.87 3.72 11.77 0.65 1.55
EBITDA
EBITDA 2016 $225,000 $170,000 $310,000 $1,050,000 $1,350,000 $100,000 $143,146
Multiple 11 13 13 13 13 8 13 12
EBITDA 2015 198,000 150,000 290,000 980,000 1,234,000 90,000 121,134
Multiple 12 15 14 14 14 9 15 13
EBITDA 2014 168,000 132,000 268,000 935,000 1,112,000 78,000 97,733
Multiple 14 17 15 15 15 10 19 15
EBITDA 2013 138,700 107,754 237,296 878,901 1,000,898 58,033 75,422
Target Multiple 2015E AFFO 17 20 15 18 17 11
Price Target $36.00 $42.00 $38.00 $70.00 $250.00 $10.00
Upside to Target 35% 10% 12% 5% 10% 28%
Rating: Outperform Outperform Outperform Marketperf Outperform Outperform Not Rated
December 19, 2014
Burke & Quick Partners, LLC.
Equinix, Inc. Page 16 of 18 Frederick W. Moran
DISCLOSURES: ANALYST CERTIFICATION I, Frederick W. Moran, hereby certify that the views expressed in this research report accurately reflect my personal views about the subject securities and issuers. I also certify that no part of my compensation was, is, or will be, directly or indirectly, related to the specific recommendations or views expressed in this research report.
DISCLOSURES Additional information available upon request.
“This report was prepared by Burke & Quick Partners, LLC. (BQP)”
BQP is a Member of FINRA and SIPC.
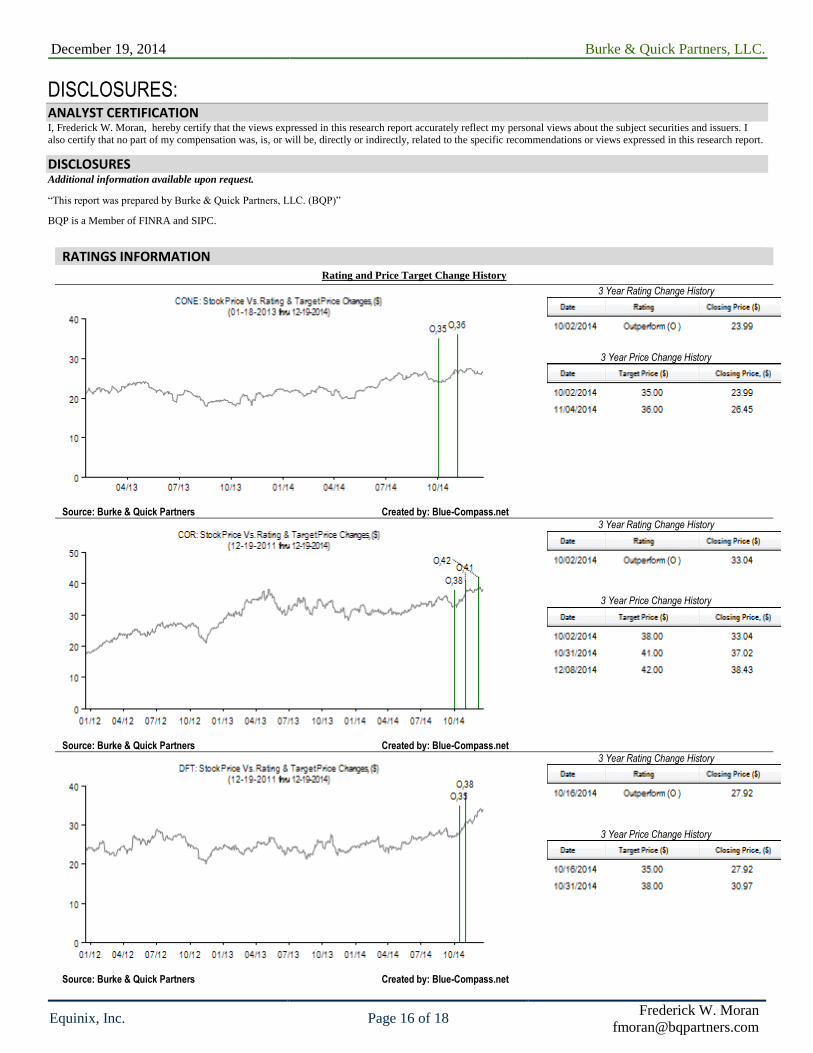
RATINGS INFORMATION Rating and Price Target Change History
Source: Burke & Quick Partners Created by: Blue-Compass.net
3 Year Rating Change History
3 Year Price Change History
Source: Burke & Quick Partners Created by: Blue-Compass.net
3 Year Rating Change History
3 Year Price Change History
Source: Burke & Quick Partners Created by: Blue-Compass.net
3 Year Rating Change History
3 Year Price Change History
December 19, 2014
Burke & Quick Partners, LLC.
Equinix, Inc. Page 17 of 18 Frederick W. Moran
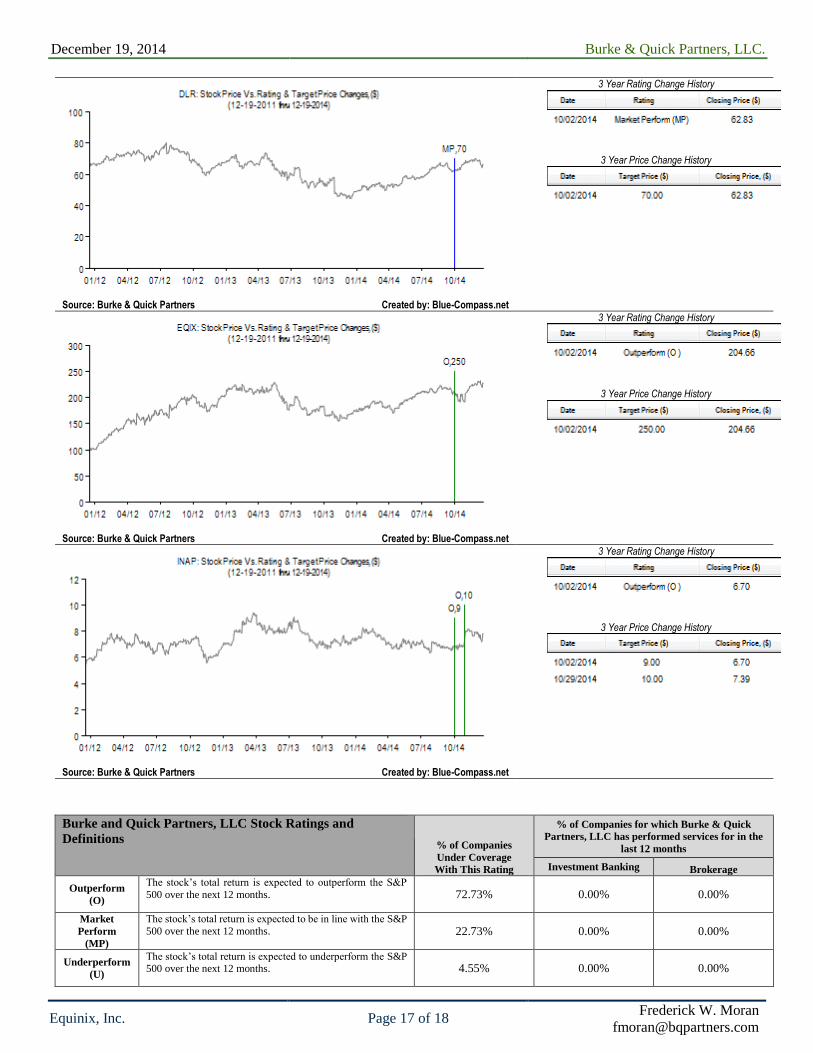
Source: Burke & Quick Partners Created by: Blue-Compass.net
3 Year Rating Change History
3 Year Price Change History
Source: Burke & Quick Partners Created by: Blue-Compass.net
3 Year Rating Change History
3 Year Price Change History
Source: Burke & Quick Partners Created by: Blue-Compass.net
3 Year Rating Change History
3 Year Price Change History
Burke and Quick Partners, LLC Stock Ratings and
Definitions % of Companies
Under Coverage
With This Rating
% of Companies for which Burke & Quick
Partners, LLC has performed services for in the
last 12 months
Investment Banking Brokerage
Outperform
(O)
The stock’s total return is expected to outperform the S&P
500 over the next 12 months. 72.73% 0.00% 0.00%
Market
Perform
(MP)
The stock’s total return is expected to be in line with the S&P
500 over the next 12 months. 22.73% 0.00% 0.00%
Underperform
(U)
The stock’s total return is expected to underperform the S&P 500 over the next 12 months. 4.55% 0.00% 0.00%

December 19, 2014
Burke & Quick Partners, LLC.
Equinix, Inc. Page 18 of 18 Frederick W. Moran
Covered Not
Rated
(CNR)
The stock is covered by the firm but ratings and estimates are
not issued.


![Untitled-1 [myibd.investors.com]INVESTOR'S BUSINESS DAILY How To Find & Own America' Greatest Opportunities s Priceline.com (PCLN) Weekly Chart Sell when goes through channel line](https://static.fdocuments.net/doc/165x107/5e645e76bfa20601136faa71/untitled-1-myibd-investors-business-daily-how-to-find-own-america-greatest.jpg)

![paos.colorado.eduwhan/ATOC5051/Class... · o7Y hbZ3l_¦ WzhioMoO ]Tl W#lnZ3yQ pCln[)Z ^OZ3g ldaic_]wh abkRlnZJr>gn]wldaioOkmo> ^OoOg#lnabcJabl }ZJ Ke$]wldaioOk o7^OZJgzln[Z\Z3kKldaig](https://static.fdocuments.net/doc/165x107/5ec4175830439636b965a184/paos-whanatoc5051class-o7y-hbz3l-wzhiomoo-tl-wlnz3yq-pclnz-oz3g.jpg)


