Data Assimilation
26
Data Assimilation
-
Upload
blossom-price -
Category
Documents
-
view
61 -
download
3
description
Data Assimilation. Data assimilation in different tongues. “Data assimilation” - GFD “State estimation” - nonlinear dynamics “Inverse modeling” - geophysics et al. “Signal processing” – engineering “Chaos synchronization” – physics. At root, it is blending/combining multiple sources - PowerPoint PPT Presentation
Transcript of Data Assimilation

Data Assimilation

Data assimilation in different tongues
• “Data assimilation” - GFD• “State estimation” - nonlinear dynamics• “Inverse modeling” - geophysics et al.• “Signal processing” – engineering• “Chaos synchronization” – physics
At root, it is blending/combining multiple sourcesof information to get a “best estimate.”

Goals of data assimilation
• Keep a numerical model “close” to a set of observations over time
• Provide appropriate initial conditions for a forecast
• Provide an estimate of analysis errors• Propagate information from observations
to unobserved locations• Tell us something about how the model
behaves


oy

o fy x−

2
2 2( )f o f
f o
y xσ
σ σ−
+

Review: main components
• Relating a gridded model state to observations
• Introducing them over some number of times (could be as few as one)
• (Initialization step)

Single-observation examples
• Single-time updates:– Cressman– Statistical
• Weather is 4D– Sequential– Continuous

First steps: Cressman
Weighted-average of nearby observations based on the distance
squared

Why not Cressman?
• If we have a preliminary estimate of the analysis with a good quality, we do not want to replace it by values provided from poor quality observations.
• When going away from an observation, it is not clear how to relax the analysis toward the arbitrary state, i.e. how to decide on the shape of the function.
• An analysis should respect some basic known properties of the true system, like smoothness of the fields, or relationship between the variables (e.g. hydrostatic balance). This is not guaranteed by the Cressman method: random observation errors could generate unphysical features in the analysis.
No background field!

A practical route to data assimilation…statistics
What temperature is it here?
1x 2x

Form a linear combination of estimates
( )1 21ax x xα α= + −
or
( )2 1 2ax x x xα= + −
ax = ?

Include the background as one “obs”
• Generalize to many observations, including the background (first guess)
2x fx
1xoy

Statistical assimilation
• Observations have errors• The forecast has errors
o t o
f t f
y x
x x
εε
= −
= +
The truth xt is unknown

Statistical assimilation
• Best linear estimate: combination between the background xf at observation locations and the observations yo themselves
• Think in terms of averages
• We do not know the truth, so we look for the maximum likelihood estimate, or the minimum-variance estimate

Statistical assimilation
• We don’t know truth, so we can’t know the errors.
• We have at least a chance of estimating the error variances
• Making these estimates is the heart of statistical data assimilation
2 2,o fσ σ
Statistical assimilation
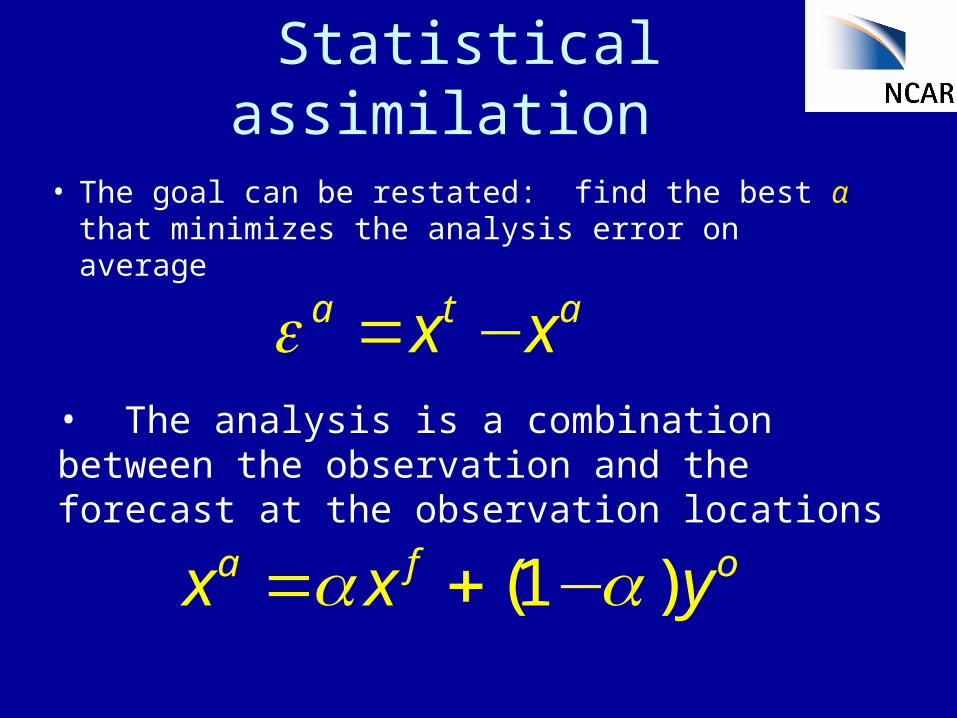
• The goal can be restated: find the best α that minimizes the analysis error on average
a t ax xε = −• The analysis is a combination between the observation and the forecast at the observation locations
(1 )a f ox x yα α= + −
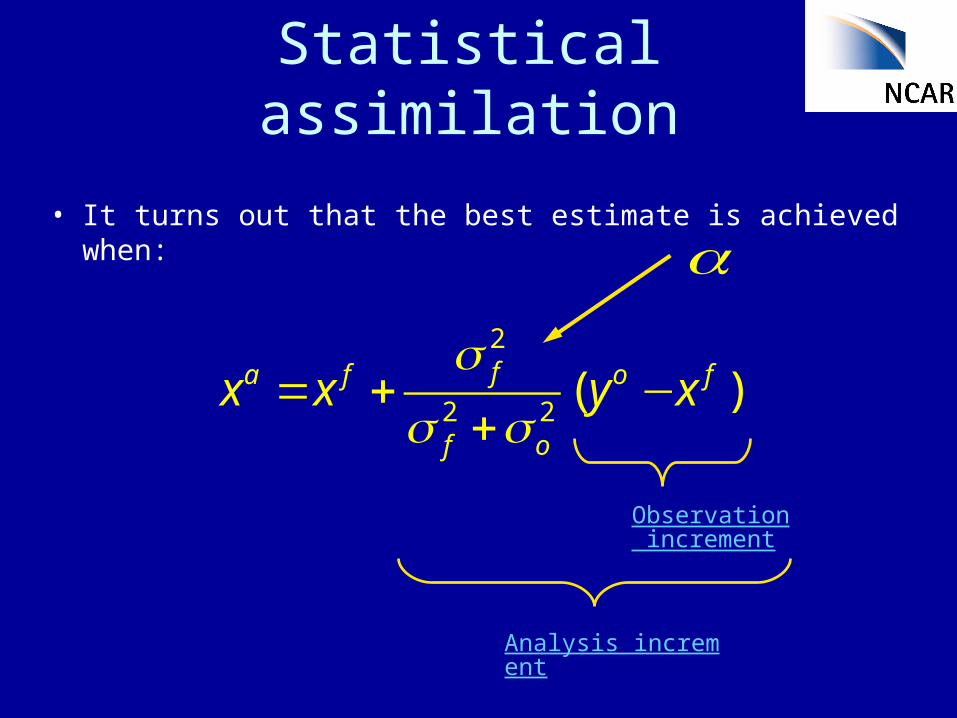
Statistical assimilation
• It turns out that the best estimate is achieved when:
2
2 2( )fa f o f
f o
x x y xσ
σ σ= + −
+
Observation increment
Analysis increment
α

RTFDDA
• How does it relate to statistical assimilation?
( )a f o fx x G y x= + −
2
2 2( )fa f o f
f o
x x y xσ
σ σ= + −
+

G includes it all
• Distance to the obs
• Time from the obs
• Expected obs error
• Quality control

Obs-nudging: Weighting Functions
G = Wqf Whorizontal Wvertical Wtime

The fourth dimension: time
• Sequential assimilation
• Continuous assimilation
• Putting it all together
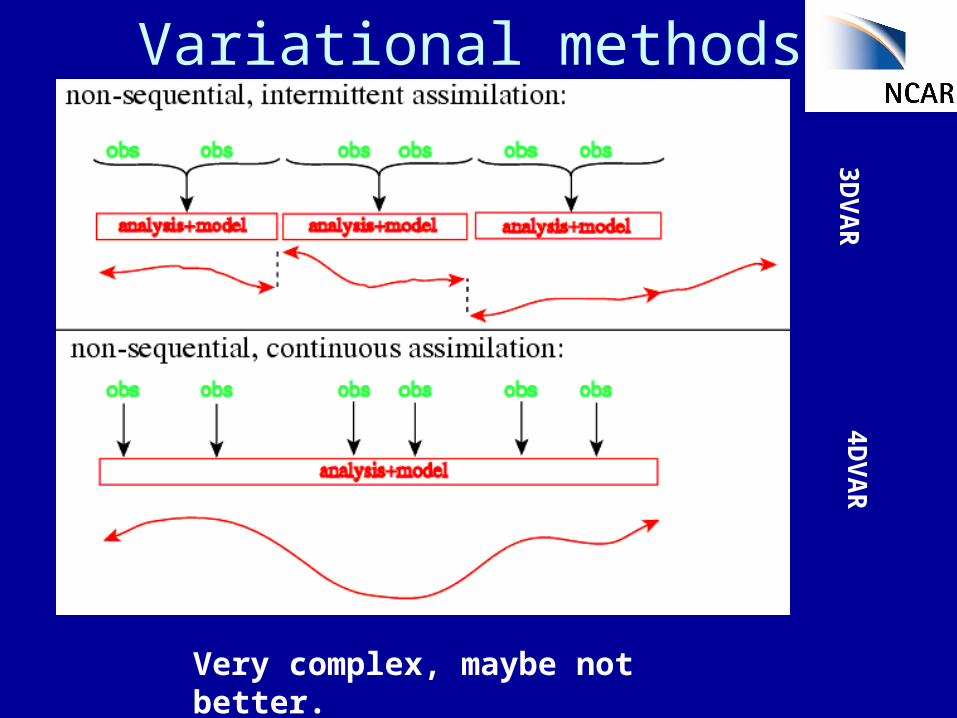
Variational methods3
DV
AR
4D
VA
R
Very complex, maybe not better.
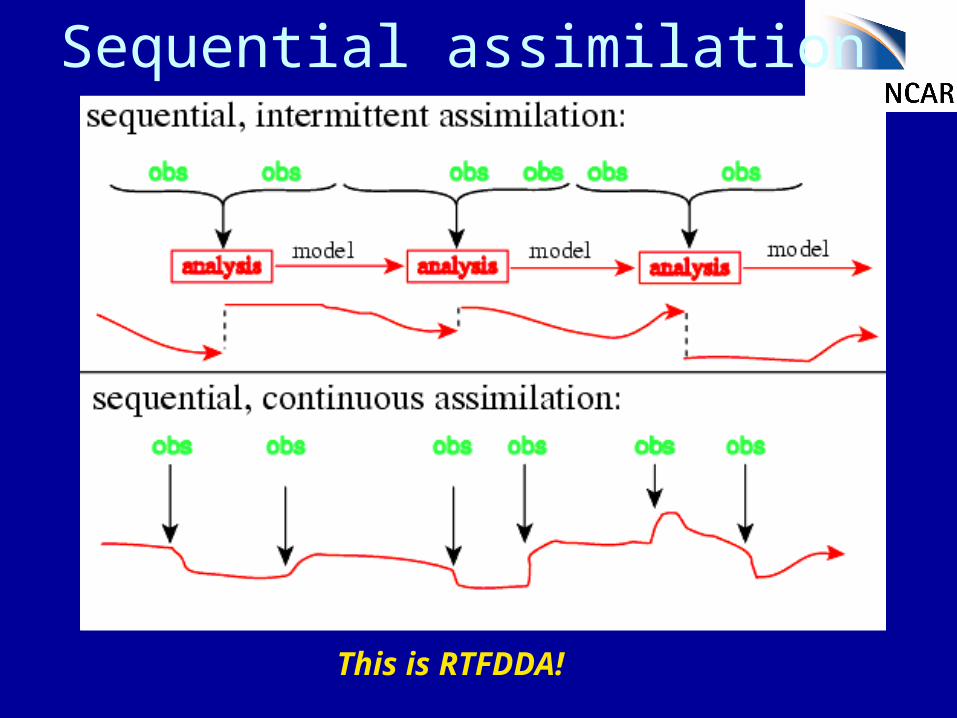
Sequential assimilation
This is RTFDDA!

Complexity