Data Assimilation of Cloud-Affected Radiances · 1/6/2010 · Milija Zupanski (CIRA), Dusanka...
35
Data Assimilation of Cloud-Affected Radiances Tomislava Vukicevic Hurricane Research Division NOAA AOML 1
Transcript of Data Assimilation of Cloud-Affected Radiances · 1/6/2010 · Milija Zupanski (CIRA), Dusanka...

Data Assimilation of Cloud-Affected Radiances
Tomislava Vukicevic
Hurricane Research Division NOAA AOML
1
Outline• Motivation
• Methodology
• Results– Observation operators
– Assimilation and verification
• Summary and conclusions2
Motivation4D atmospheric data analysis
with clouds
– Initialization of atmospheric state with clouds in NWP
– Validation and advanced development of cloud microphysical parameterizations
– Dynamically consistent cloud and state climatology
3
Research approach: Evaluate feasibility under
best scenario
• Use observations with highest expected information content with respect to clouds, including spatial and temporal variability
• Use cloud resolving model
• Use data assimilation method which allows 4D dynamically consistent analysis
4

OBSERVATIONSGOES imager
and ARM
MODELCRM with bulk explicit cloud microphysics
METHOD4DVAR data assimilation
Collaborators : Tom Greenwald (CIMMS, formerly CIRA), Milija Zupanski (CIRA), Dusanka Zupanski (CIRA), Manajit Sengupta (formerly CIRA), Frank Evans (ATOC/CU) and Rosanne Polkinhorne (ATOC/CU)
5
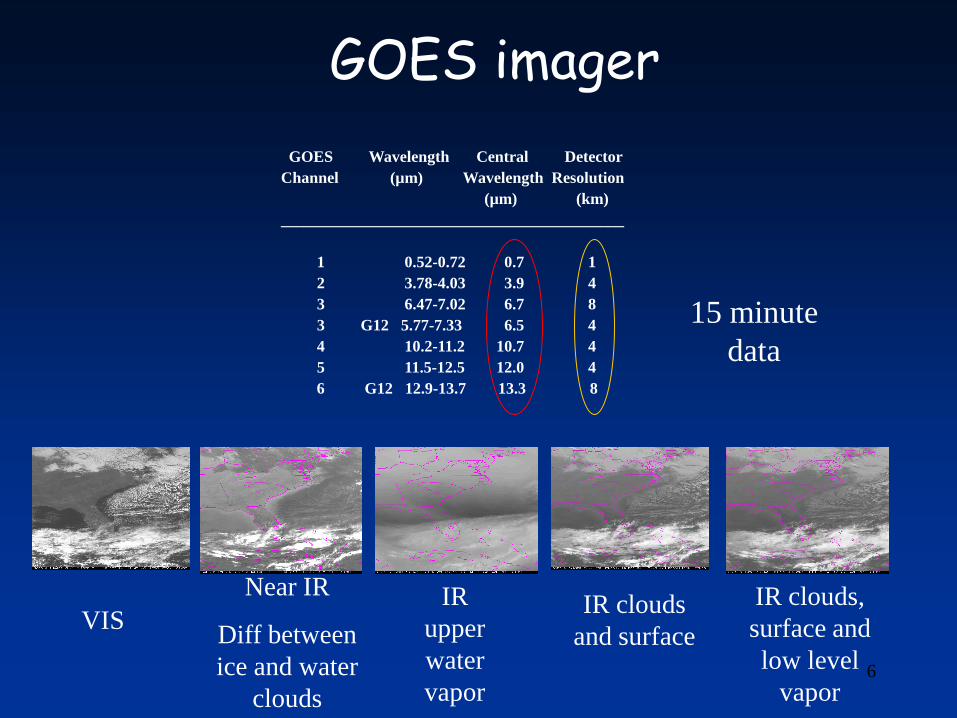
GOES Wavelength Central Detector
Channel (µm) Wavelength Resolution
(µm) (km)
___________________________________________
1 0.52-0.72 0.7 1
2 3.78-4.03 3.9 4
3 6.47-7.02 6.7 8
3 G12 5.77-7.33 6.5 4
4 10.2-11.2 10.7 4
5 11.5-12.5 12.0 4
6 G12 12.9-13.7 13.3 8
GOES imager
15 minute
data
VIS
Near IR
Diff between
ice and water
clouds
IR
upper
water
vapor
IR clouds
and surface
IR clouds,
surface and
low level
vapor6
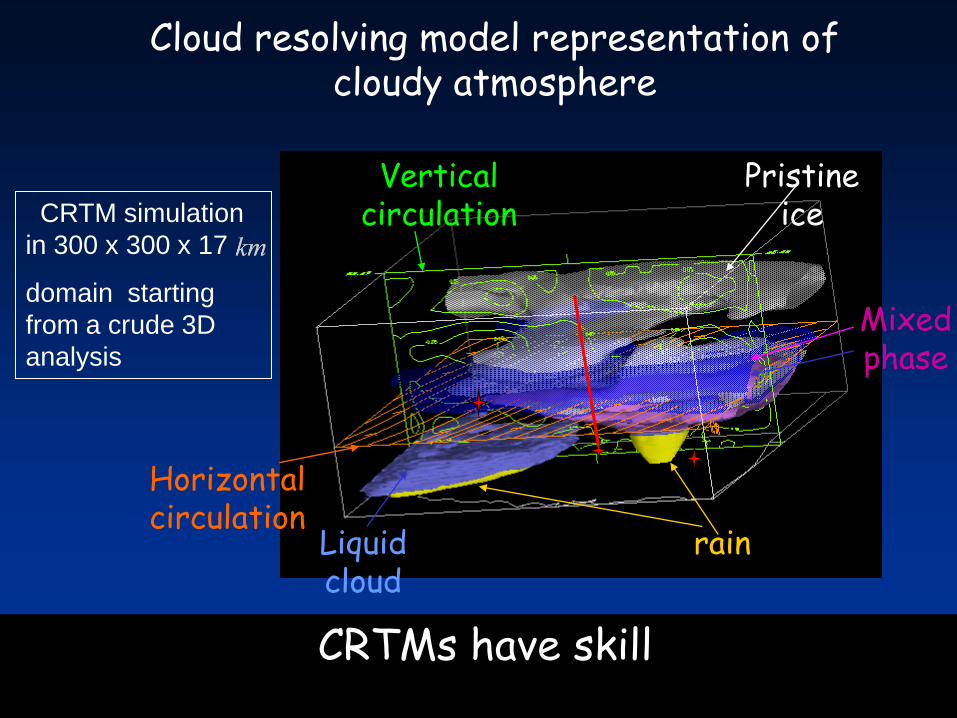
Cloud resolving model representation of cloudy atmosphere
CRTMs have skill
CRTM simulation
in 300 x 300 x 17
domain starting
from a crude 3D
analysis
Mixed phase
Pristine ice
Liquid cloud
rain
Horizontal circulation
Vertical circulation
7

CRTM in this study RAMS
• Bulk, 2 moment cloud microphysics for ice: pristine ice, aggregates, snow, graupel and hail
• 1 moment for liquid: cloud droplets and and rain
• Prognostic mixing ratio and number concentration for ice
• Assumed Gamma distribution with prescribed width
• Nonhydrostatic dynamics • High resolution regional simulations
8

Regional Atmospheric Modeling and Data Assimilation System
(RAMDAS)
Mesoscale atmospheric forecast model
with explicit cloud microphysics
RAMS
Land model coupled to RAMS
LEAF2
Satellite observational operator:
Cloud property, gas extinction
and radiative transfer models
ObservationsSatellite visible, IR and microwave radiance
Station surface and upper air
Precipitation
Station standard and precipitation
observational operators
(WRF 3DVAR interface)
4DVAR data assimilation algorithmMain features:
Full physics nonlinear and adjoint models
Model error (Eta 4dvar)
Preconditioning (Eta 4dvar)
Background error
( compactly supported, space limited correlations)
Adjoint of RAMS
Adjoint of LEAF2
Adjoint of satellite observational operator
Station standard and precipitation
observational operators
(WRF 3DVAR interface)
NWP models Observational Operators
NWP model adjoints Observational Operator adjoints
Control states
Wind
Temperature
Pressure
Cloud ice mixing ratios
(pristine and agregates)
Cloud liquid mixing ratio
Vapor mixing ratio
Soil temperature
Soil moisture
Adjoints of control states
Wind
Temperature
Pressure
Cloud ice mixing ratios
(pristine and agregates)
Cloud liquid mixing ratio
Vapor mixing ratio
Soil temperature
Soil moisture
Arrows show direction of data flow
gradient
state
Adjoint of cloud microphysics and radiative transfer
Controls include cloud and dynamical variables
Vukicevic et al, 2004,2005
Zupanski et al 2005
4DVAR algorithm
9

Observation operator
VIS and IR radiative transfer
y
tXHy )(Version 1
Greenwald et al. 2003
Gas absorption: OPTRAN (McMillin et al., 1995)
Cloud properties:Anomalous Diffraction
Solar: SHDOM (Evans, 1998)
IR: Eddington two-stream (Deeter and Evans 1998)
Version 2SHDOMPPDA (Evans, 2007)
10

SHDOMPPDA operatorEvans (2007, JAS)
• Development was supported by JCSDA and NSF-ATM
• Unpolarized, plane parallel RT model with adjoint and tangent linear models
• Hydrometeor optical properties are determined from lookup tables as function of mass mean radius
• Scattering by look-up tables – Mie theory for spherical particles with Gamma
or Lognormal size distributions– Gamma size distribution of mixture of 6 ice
crystal shapes (Yang et al., 2005) 11
Information content of GOES imager observations
12
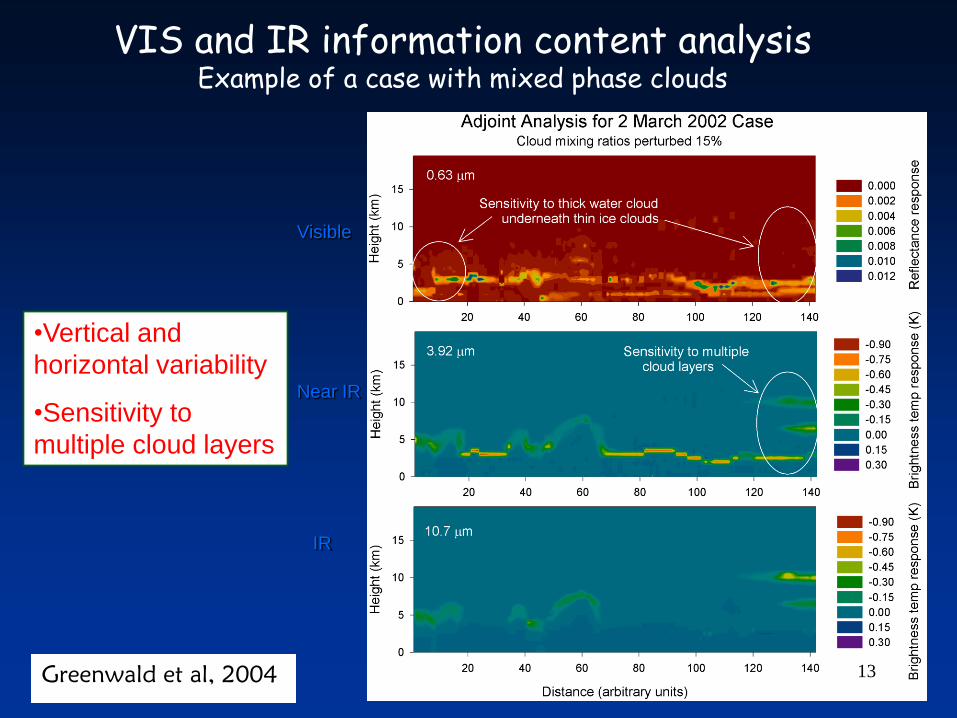
VIS and IR information content analysisExample of a case with mixed phase clouds
Visible
Near IR
IR
•Vertical and
horizontal variability
•Sensitivity to
multiple cloud layers
Greenwald et al, 2004 13
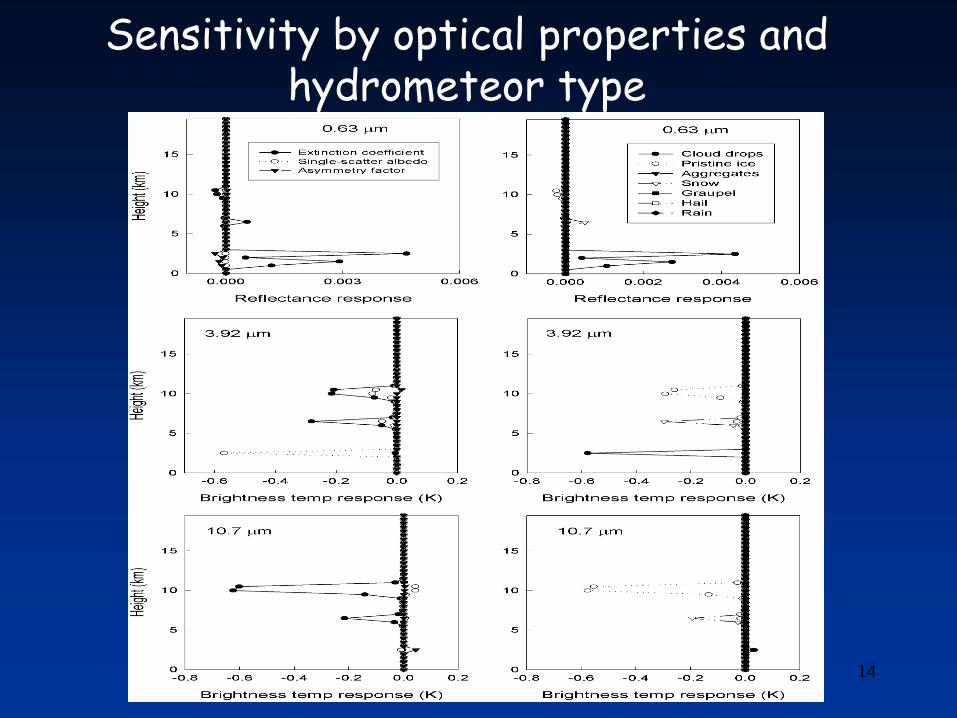
Sensitivity by optical properties and hydrometeor type
14

Assimilation experiments
15
•Set 1 (Version 1 observation operator)
• Case with 100% cloud cover in the model domain• Crude estimates of data assimilation parameters• GOES IR only • Sensitivity to observations
•Set 2 (SHDOMPPDA operator)
• Estimates of background biases and error correlation length from model validation with observations• Use of cloud mask in quality control• Cases with mixed clear and cloudy scenes •Sensitivity to data assimilation parameters
MODEL CLOUD IMAGES
3D ICE CLOUD MIXING RATIO ISOSURFACES
VIEW FROM SOUTHERN BOUNDARYVIEW FROM WESTERN BOUNDARY
BEFORE ASSIMILATION AFTER ASSIMILATION BEFORE ASSIMILATION AFTER ASSIMILATION
BEFORE ASSIMILATION AFTER ASSIMILATION
*
ARM central site
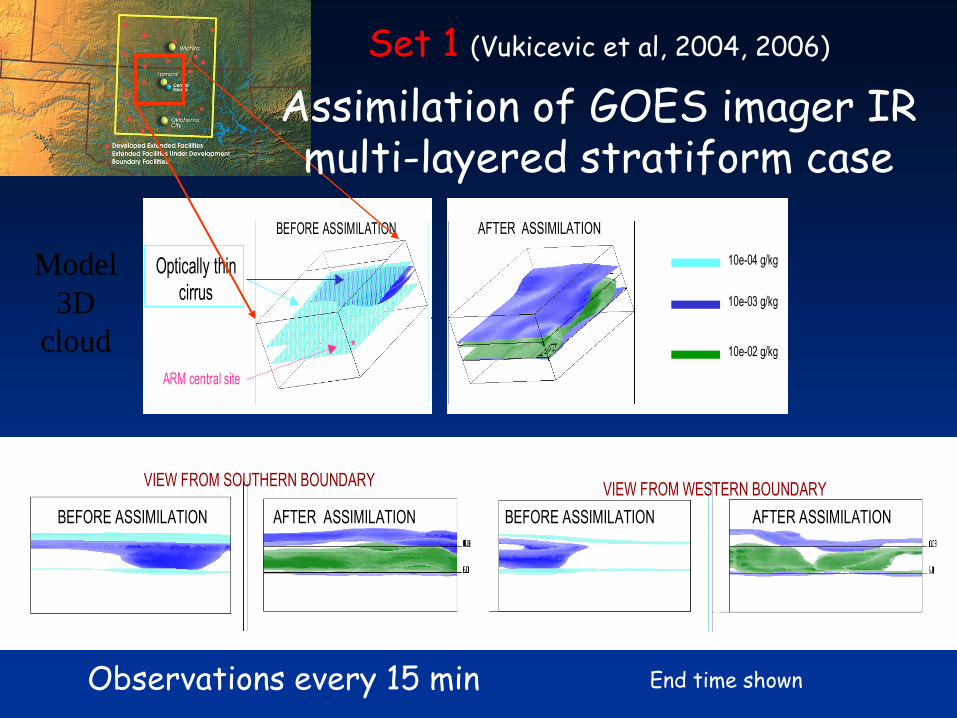
10e-04 g/kg
10e-03 g/kg
10e-02 g/kg
Optically thin
cirrus
Observations every 15 min
MODEL CLOUD IMAGES
3D ICE CLOUD MIXING RATIO ISOSURFACES
VIEW FROM SOUTHERN BOUNDARYVIEW FROM WESTERN BOUNDARY
BEFORE ASSIMILATION AFTER ASSIMILATION BEFORE ASSIMILATION AFTER ASSIMILATION
BEFORE ASSIMILATION AFTER ASSIMILATION
*
ARM central site
10e-04 g/kg
10e-03 g/kg
10e-02 g/kg
Optically thin
cirrusModel
3D
cloud
2D
Tb
End time shown
Assimilation of GOES imager IRmulti-layered stratiform caseMODEL CLOUD IMAGES
3D ICE CLOUD MIXING RATIO ISOSURFACES
VIEW FROM SOUTHERN BOUNDARYVIEW FROM WESTERN BOUNDARY
BEFORE ASSIMILATION AFTER ASSIMILATION BEFORE ASSIMILATION AFTER ASSIMILATION
BEFORE ASSIMILATION AFTER ASSIMILATION
*
ARM central site
10e-04 g/kg
10e-03 g/kg
10e-02 g/kg
Optically thin
cirrus
Set 1 (Vukicevic et al, 2004, 2006)
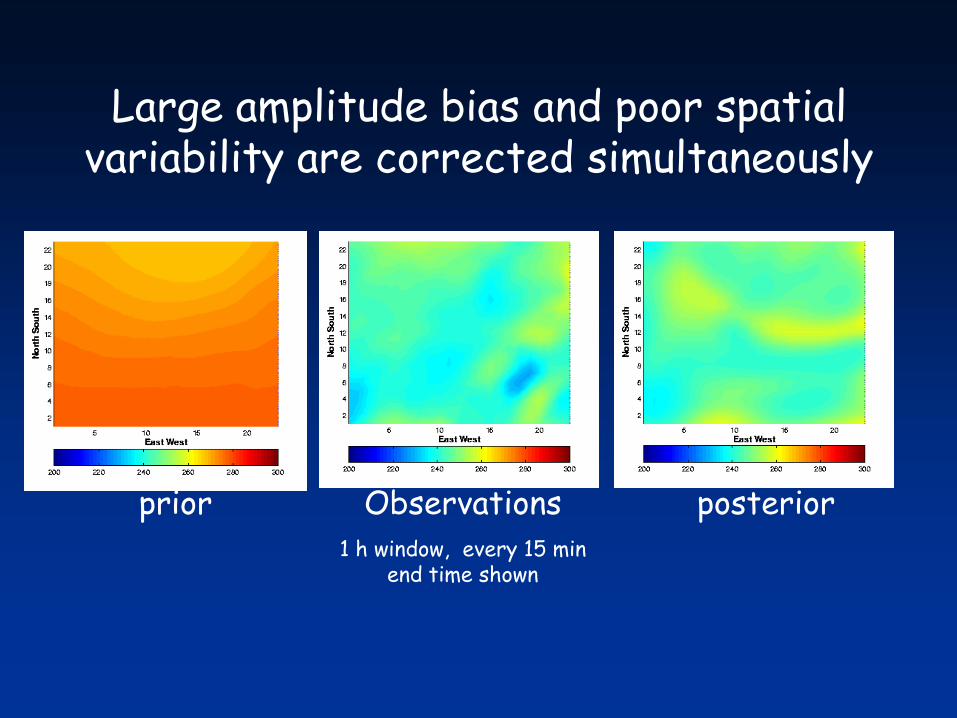
Large amplitude bias and poor spatial variability are corrected simultaneously
prior Observations posterior1 h window, every 15 min
end time shown
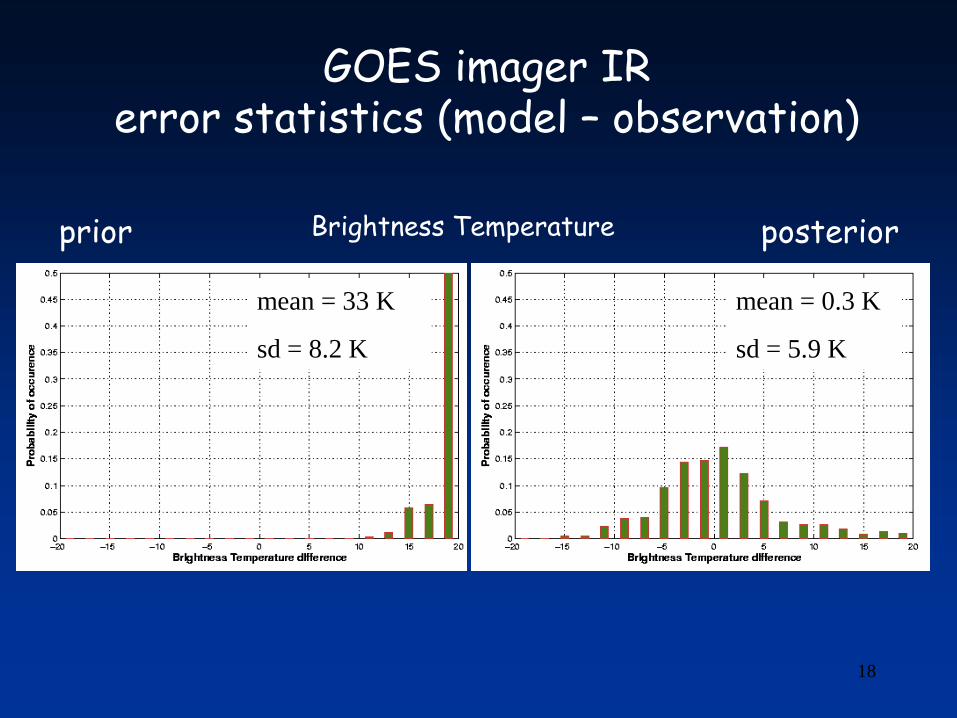
GOES imager IRerror statistics (model – observation)
mean = 0.3 K
sd = 5.9 K
mean = 33 K
sd = 8.2 K
prior posteriorBrightness Temperature
18
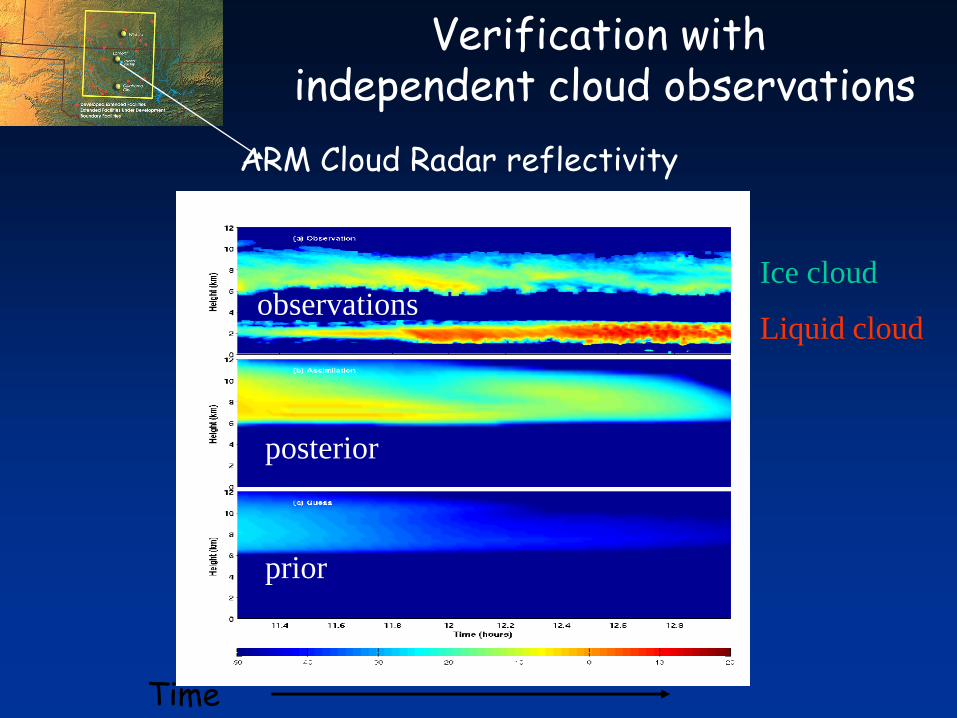
Verification with independent cloud observations
ARM Cloud Radar reflectivity
prior
posterior
observations
Time
Ice cloud
Liquid cloud

Complementary information from IR channels
Sensitivity of Tb in 10.7nm and 12.0 nm to clouds is very similar.
Ch 4
alone
Ch 5
alone
4 and 5
together
4 and 5
together
Ch 4
priorCh 5
prior
Model – Observations brightness temperature
20
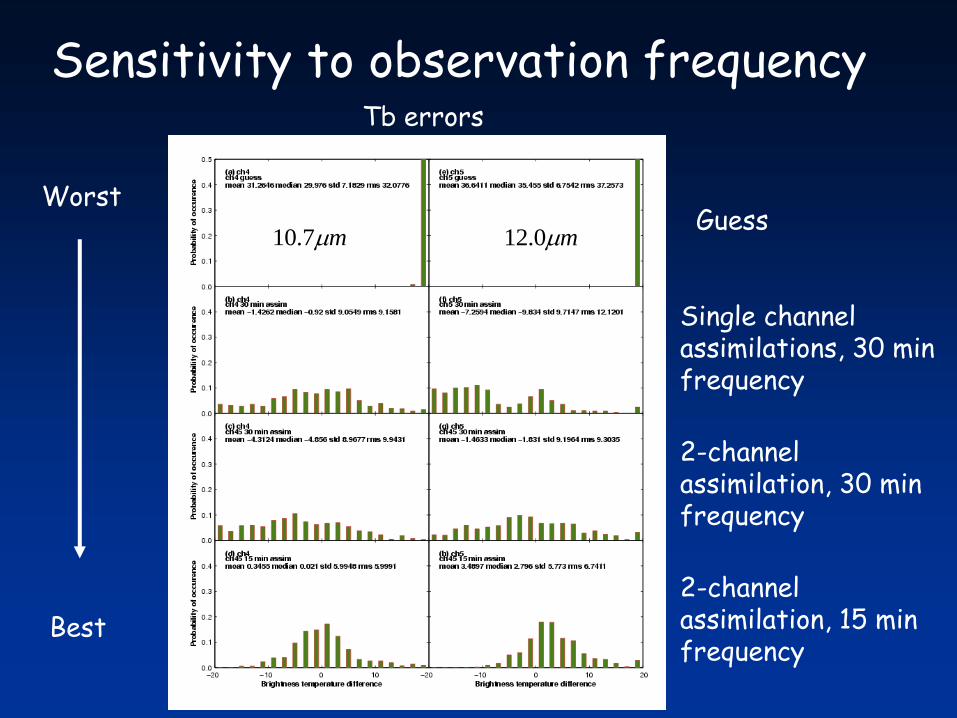
Sensitivity to observation frequency
Single channel assimilations, 30 min frequency
2-channel assimilation, 30 min frequency
2-channel assimilation, 15 min frequency
GuessWorst
Best
m7.10 m0.12
Tb errors

22
Set 2• Estimate of background biases and error correlation length from model validation with observations•Use of cloud mask in quality control• Cases with mixed clear and cloudy scenes •Assimilation of visible and ground-based ARM observations•Sensitivity to data assimilation parameters
• QC• Background error decorrelation length• Spatial smoothing in RAMS adjoint• Length of assimilation window
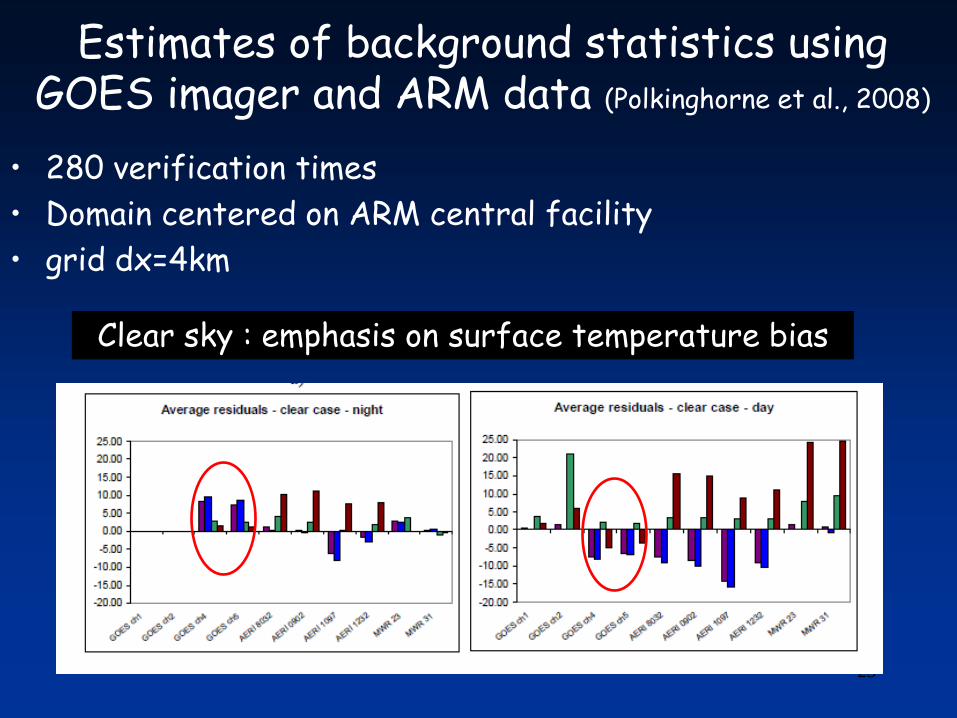
Estimates of background statistics using GOES imager and ARM data (Polkinghorne et al., 2008)
• 280 verification times
• Domain centered on ARM central facility
• grid dx=4km
23
Clear sky : emphasis on surface temperature bias

Biases in cloudy conditions
24
Low clouds
High clouds
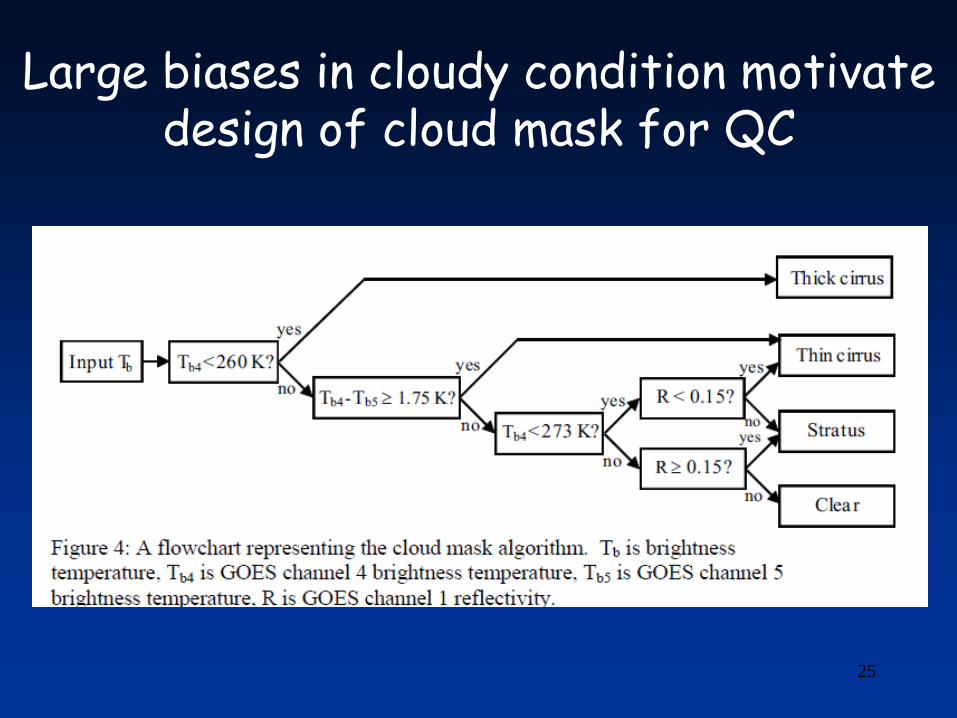
Large biases in cloudy condition motivate design of cloud mask for QC
25
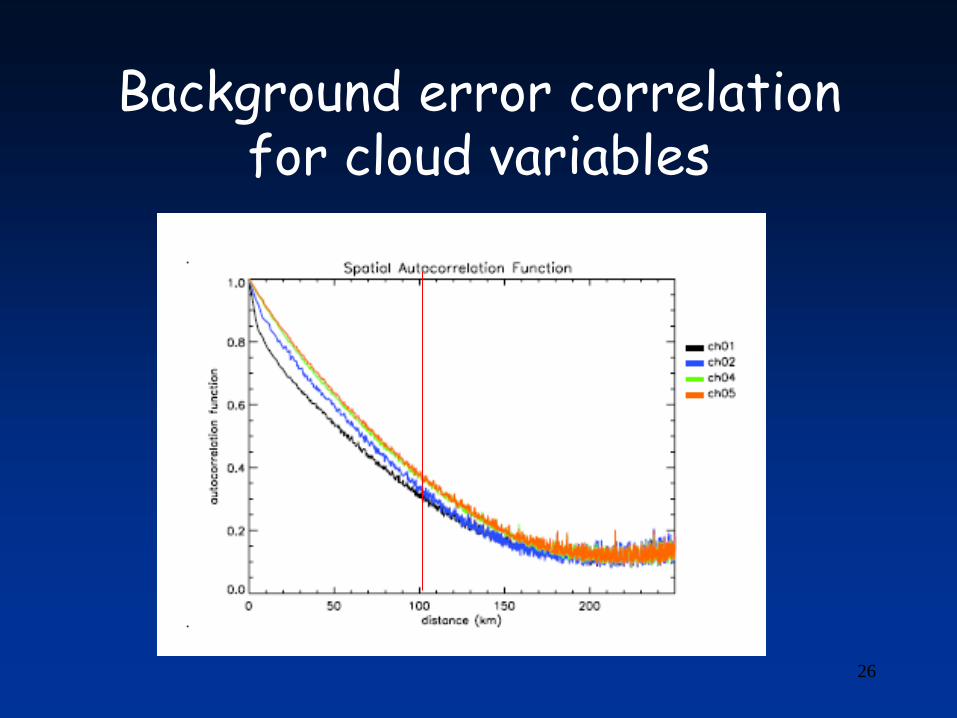
Background error correlation for cloud variables
26
27
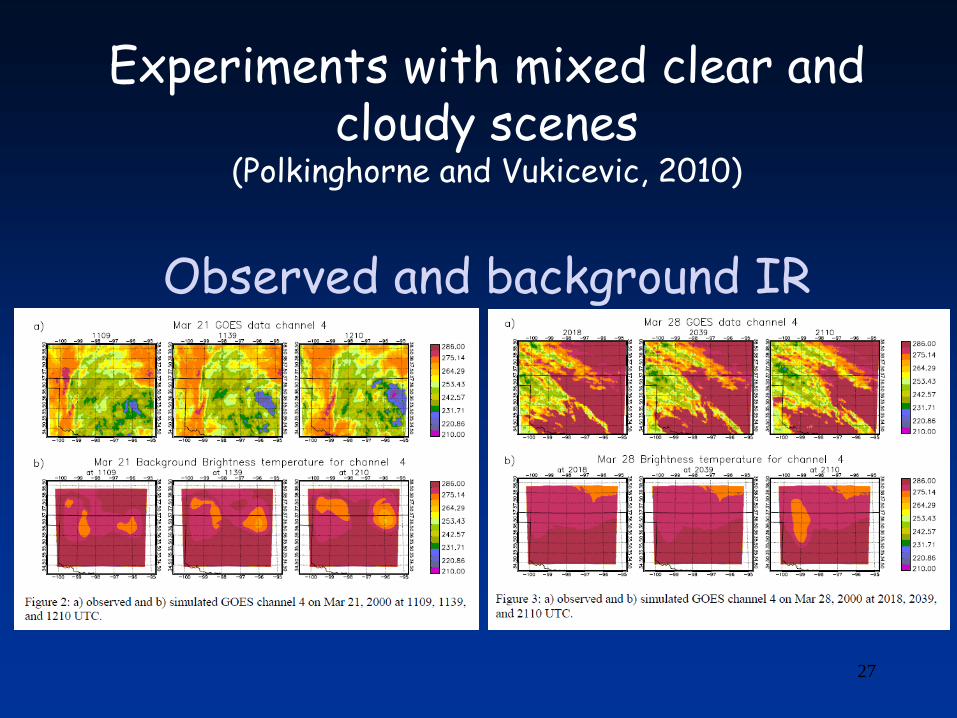
Experiments with mixed clear and cloudy scenes
(Polkinghorne and Vukicevic, 2010)
Observed and background IR

28
Sensitivity experiments to data assimilation parameters )
QC based only on maximum residual
; simple estimate of decorrelation
length; IR channels ; 1 h window
1 -QC based on cloud mask ; simple
estimate of decorrelation length; IR
channels ; 1 h window ; variable max
residual
2 - As 1d with spatial smoothing of
RAMS adjoint solution
3 – As 1d with observation-based
decorrelation length
4 – As 1d with 2 h window
5 – As 1d with ARM observations
6 – As 1d with ARM observations

Application of cloud mask in QC
29
•Black contours mark boundary of regions within which the observations are used in assimilation
•Color shows impact of observations in the experiment with 2 h assimilation window

Bulk results : convergence and global fit to observations
30
See additional slides for description of experiments
0.000.200.400.600.801.00
Change in fit to independent obs
•Different convergence rate
•Similar final global fit to observations

Quality of analysis
• Despite small differences in the global fit to observations there are significant differences in quality of analysis between different experiments
• Best analysis is produced in the experiments that include the cloud mask in QC together with large allowed maximum residual, observation based decorrelation length and longer assimilation window
• Small but positive impact of VIS and ground-based remote sensing observations 31
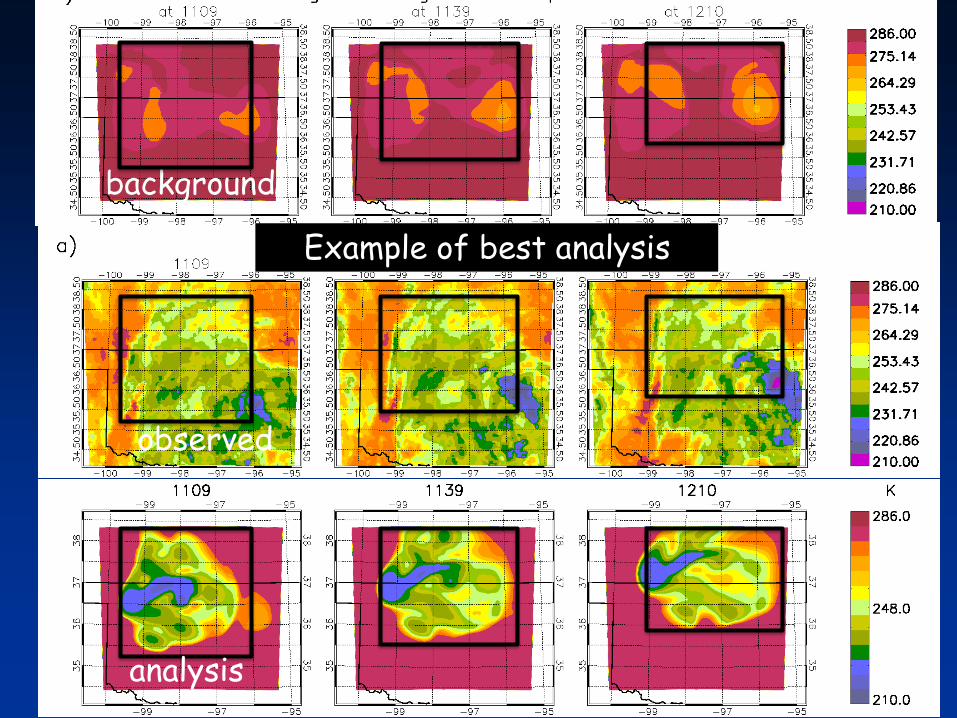
Example of best analysis
observed
analysis
background

Resulting 4D cloud analysis
33
Example vertical cross-section
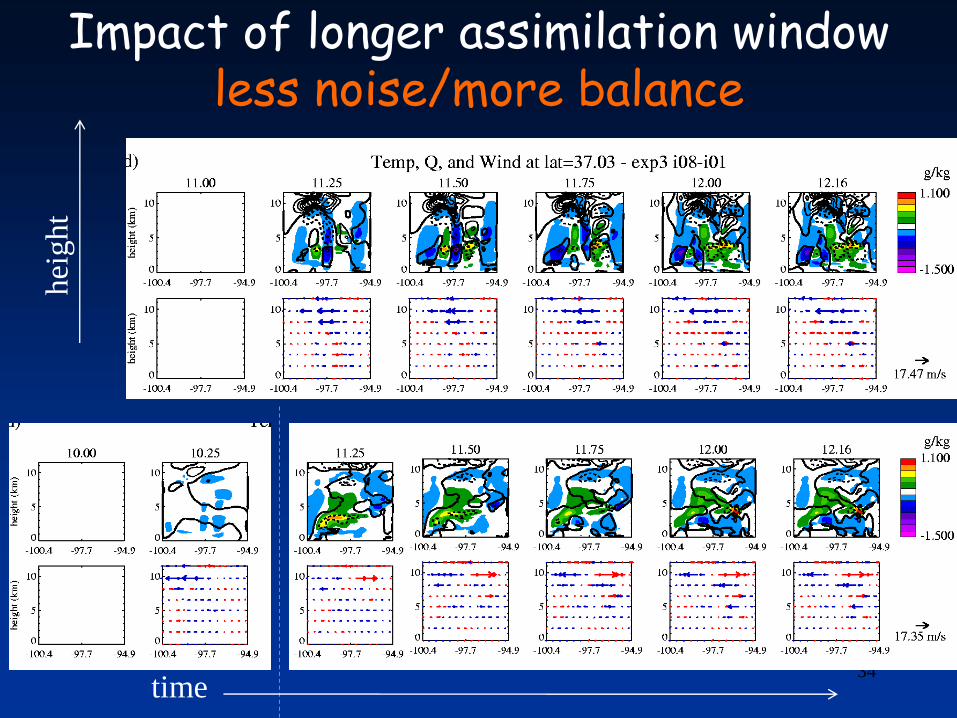
Impact of longer assimilation windowless noise/more balance
34
hei
ght
time
Summary
• 4D, dynamically consistent analysis of cloudy atmosphere by assimilation of GOES imager observations is feasible
• The assimilation benefits from the use of cloud-mask based QC with large maximum residuals
• Balanced analysis requires sufficiently long assimilation window
• More frequent observations improve the analysis
• Window IR channels have complementary information
• Assimilation of visible observations has small impact in the studied cases that are dominated by ice clouds
• Assimilation of ground based remote sensing has small but positive local impact
35