Data and Image Models · 3 Data models vs.Conceptual models Data models are formal descriptions...
31
1 Data and Image Models Maneesh Agrawala CS 448B: Visualization Winter 2020 The big picture task questions, goals, assumptions data physical type int, float, etc. abstract type nominal, ordinal, etc. domain metadata semantics conceptual model conventions processing algorithms mapping visual encoding image graphical marks visual channel
Transcript of Data and Image Models · 3 Data models vs.Conceptual models Data models are formal descriptions...

1
Data and Image ModelsManeesh Agrawala
CS 448B: VisualizationWinter 2020
The big picture
taskquestions, goals,assumptions
dataphysical type
int, float, etc.abstract type
nominal, ordinal, etc.
domainmetadatasemantics conceptual modelconventions
processingalgorithms
mappingvisual encoding
imagegraphical marksvisual channel

2
TopicsProperties of dataProperties of the imageMapping data to images
Data
3
Data models vs. Conceptual modelsData models are formal descriptions
■ Math: Sets with operations on them■ Example: integers with + and × operators
Conceptual models are mental constructions■ Include semantics and support reasoning
Examples (data vs. conceptual)■ 1D floats vs. temperature■ 3D vector of floats vs. spatial location
Taxonomy of Data Types■ 1D (sets and sequences)■ Temporal■ 2D (maps)■ 3D (shapes)■ nD (relational)■ Trees (hierarchies)■ Networks (graphs)
Are there others?The eyes have it: A task by data type taxonomy for information
visualization [Schneiderman 96]

4
Types of variablesPhysical types
■ Characterized by storage format■ Characterized by machine operationsExample:
bool, short, int32, float, double, string, …
Abstract types■ Provide descriptions of the data■ May be characterized by methods/attributes■ May be organized into a hierarchy
Example: plants, animals, metazoans, …
N - Nominal (labels)Fruits: Apples, oranges, …Operations: =, ≠
O - OrderedQuality of meat: Grade A, AA, AAAOperations: =, ≠, <, >
Q - Interval (location of zero arbitrary)Dates: Jan, 19, 2016; Loc.: (LAT 33.98, LON -118.45)Like a geometric point. Cannot compare directlyOnly differences (i.e. intervals) may be comparedOperations: =, ≠, <, >, -
Q - Ratio (location of zero fixed)Physical measurement: Length, Mass, Temp, …Counts and amountsLike a geometric vector, origin is meaningfulOperations: =, ≠, <, >, -, ÷
On the theory of scales of measurementsS. S. Stevens, 1946
Nominal, ordinal and quantitative

5
From data model to N,O,Q data type
Data model■ 32.5, 54.0, -17.3, …■ floats
Conceptual model■ Temperature (°C)
Data type■ Burned vs. Not burned (N)■ Hot, warm, cold (O)■ Continuous range of values (Q)
Dimensions and measuresDimensions: (~ independent variables)
Often discrete variables describing data (N, O)Categories, dates, binned values
Measures: (~ dependent variables)Data values that can be aggregated (Q)Numbers to be analyzed Aggregate as sum, count, average, std. deviation
Distinction is not strict. The same variable may be treated either way depending on the task.
6
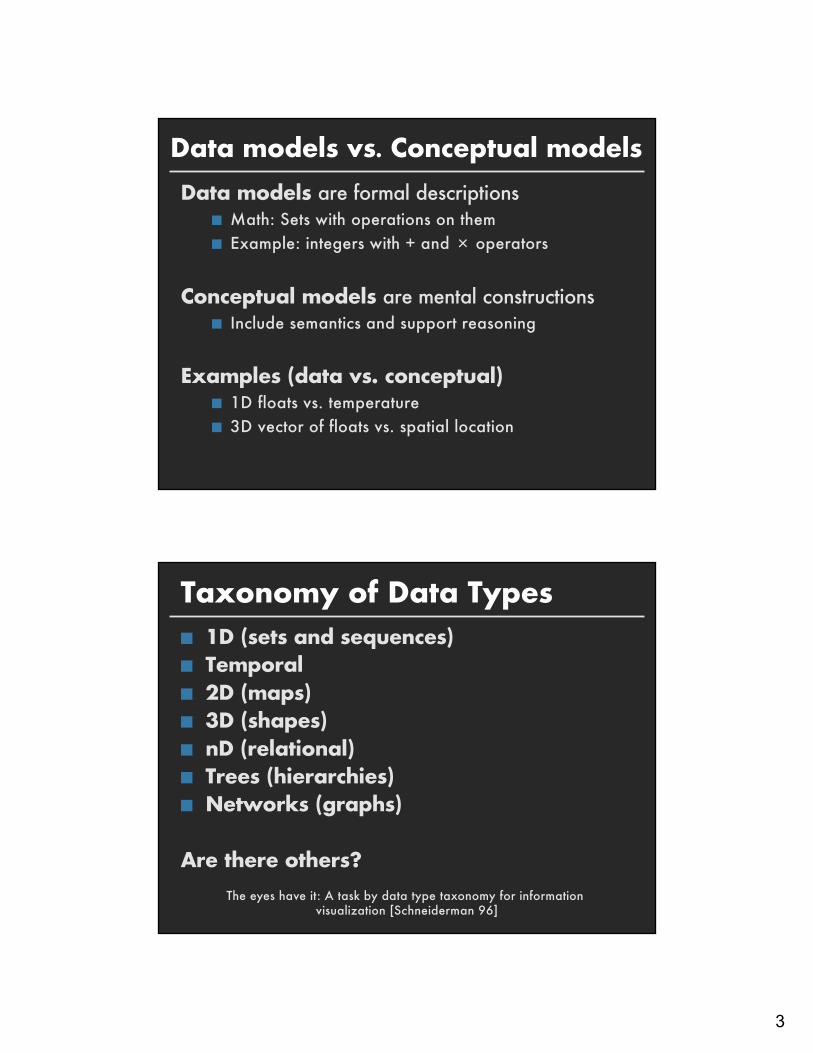
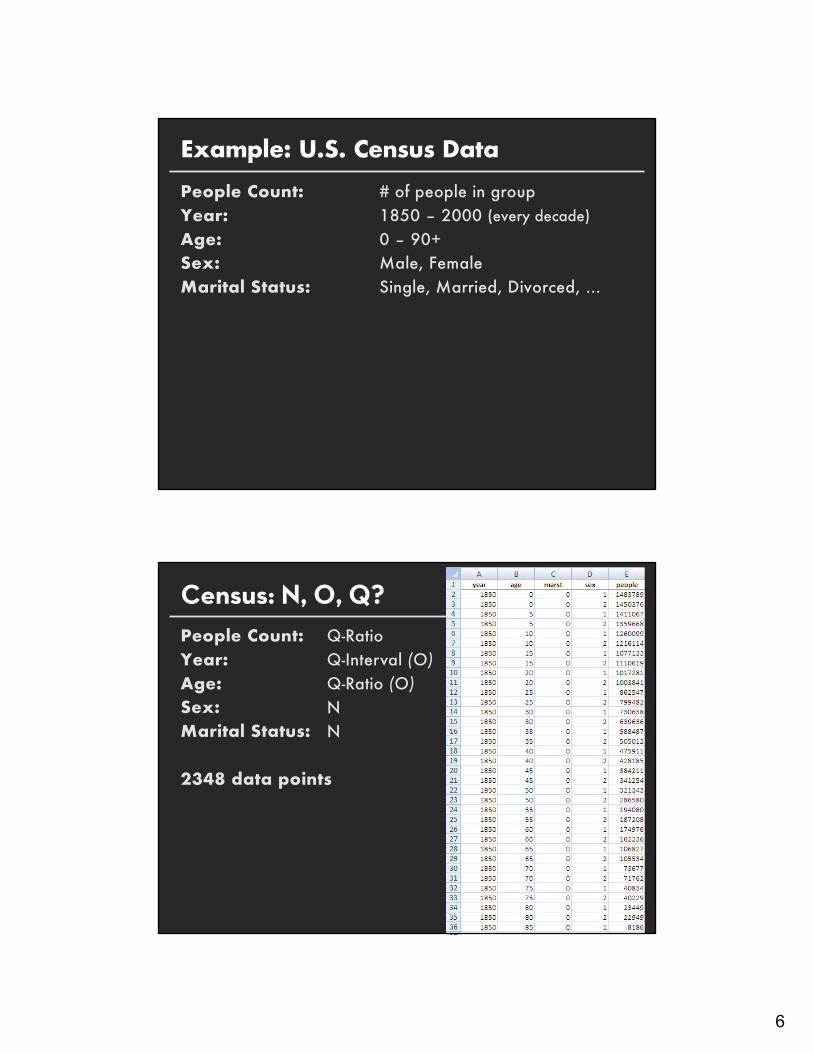
Example: U.S. Census DataPeople Count: # of people in groupYear: 1850 – 2000 (every decade)Age: 0 – 90+Sex: Male, FemaleMarital Status: Single, Married, Divorced, …
People Count:Year:Age:Sex:Marital Status:
2348 data points
Census: N, O, Q?Q-RatioQ-Interval (O)Q-Ratio (O)NN

7
People Count:Year:Age:Sex:Marital Status:
2348 data points
Census: N, O, Q?MeasureDimensionDepends!DimensionDimension
Relational data modelRepresent data as a table (relation)Each row (tuple) represents a single record
Each record is a fixed-length tupleEach column (attribute) represents a single variable
Each attribute has a name and a data typeA table’s schema is the set of names and data types
A database is a collection of tables (relations)
8
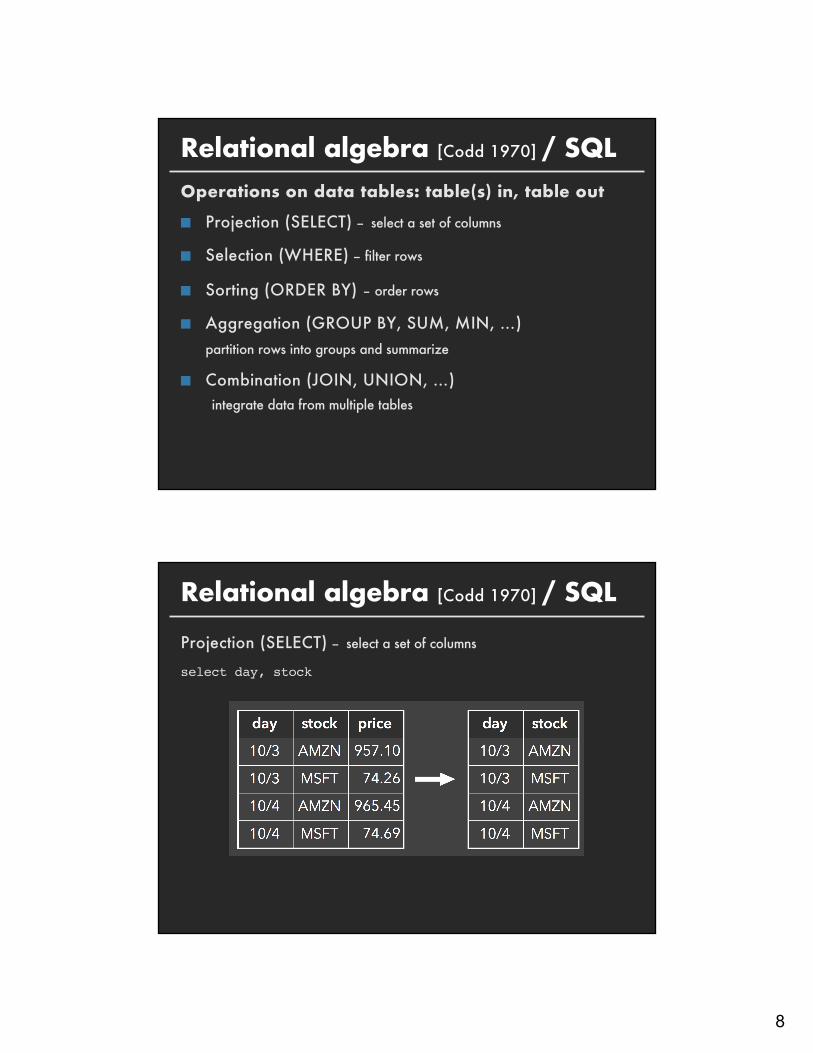
Relational algebra [Codd 1970] / SQLOperations on data tables: table(s) in, table out
■ Projection (SELECT) -- select a set of columns
■ Selection (WHERE) -- filter rows
■ Sorting (ORDER BY) – order rows
■ Aggregation (GROUP BY, SUM, MIN, …)partition rows into groups and summarize
■ Combination (JOIN, UNION, …)integrate data from multiple tables
Relational algebra [Codd 1970] / SQL
Projection (SELECT) -- select a set of columns
select day, stock
9
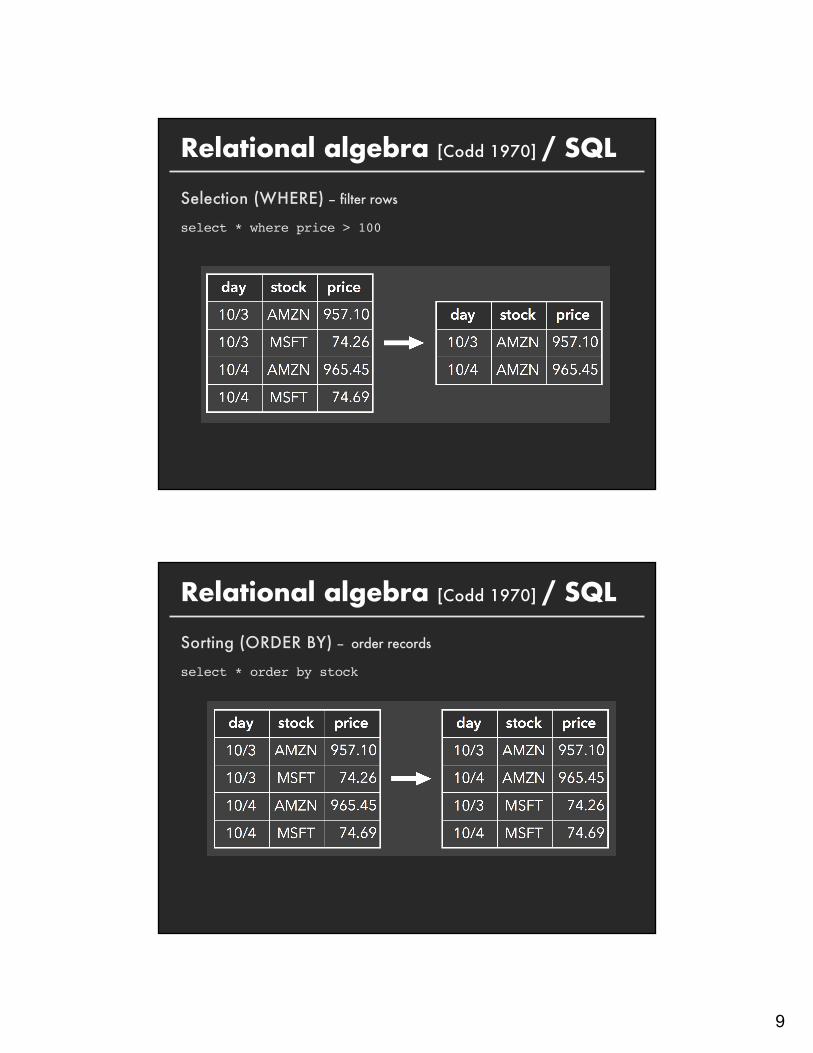
Relational algebra [Codd 1970] / SQL
Selection (WHERE) -- filter rows
select * where price > 100
Relational algebra [Codd 1970] / SQL
Sorting (ORDER BY) -- order records
select * order by stock
10
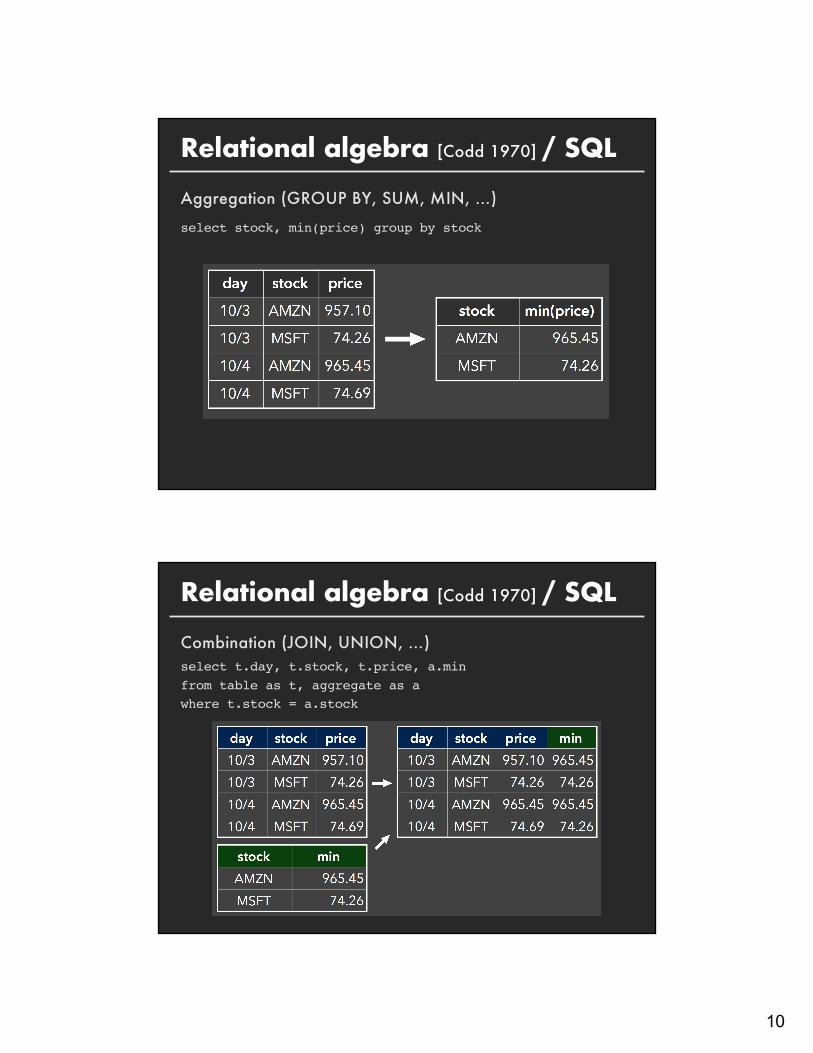
Relational algebra [Codd 1970] / SQL
Aggregation (GROUP BY, SUM, MIN, …)
select stock, min(price) group by stock
Relational algebra [Codd 1970] / SQL
Combination (JOIN, UNION, …)select t.day, t.stock, t.price, a.minfrom table as t, aggregate as awhere t.stock = a.stock

11
Roll-Up and Drill-DownWant to examine population by year and age?Roll-up the data along the desired dimensions
SELECT year, age, sum(people)FROM censusGROUP BY year, age
Dimensions Measure
Dimensions
Roll-Up and Drill-DownWant to breakdown by marital status?Drill-down into additional dimensions
SELECT year, age, marst sum(people)FROM censusGROUP BY year, age, marst

12
Age
Marital Status
Sing
le
Mar
ried
Div
orce
d
Wid
owed
19701980
19902000
Year
0-19
20-39
40-59
60+
All Marital Status
All Ages
All Years
Sum along Marital Status
Sum along Age
Sum along Year
Age
Marital Status
Sing
le
Mar
ried
Div
orce
d
Wid
owed
19701980
19902000
Year
0-19
20-39
40-59
60+
All Marital Status
All Ages
All Years
Sum along Marital Status
Sum along Age
Sum along Year
Roll-Up
Drill-Down

13
Common Data FormatsCSV: Comma-Separated Values
year,age,marst,sex,people1850,0,0,1,1483789 1850,5,0,1,1411067 ...
Common Data FormatsCSV: Comma-Separated Values
year,age,marst,sex,people1850,0,0,1,1483789 1850,5,0,1,1411067 ...
JSON: JavaScript Object Notation [{"year":1850,"age":0,"marst":0,"sex":1,"people":1483789},{"year":1850,"age":5,"marst":0,"sex":1,"people":1411067},...
]

14
AnnouncementsClass participation requirements
■ Complete readings and notebooks before class■ In-class discussion■ Post at least 1 discussion substantive comment/question per week.
1 pass for the quarter
Class websitehttps://magrawala.github.io/cs448b-wi20
Lecture/Reading ResponsesGood responses typically exhibit one or more
■ Critiques of arguments made in the papers/lectures■ Analysis of implications or future directions for ideas in readings/lectures■ Insightful questions about the readings/lectures
Responses should not be summaries

15
Discussion Discussion is essential for effective design,
evaluation and critique of visualizations
■Attendance for non-SCPD students is mandatory (you have 2 passes before it will affect your grade)
■ Laptops not allowed (unless we specifically ask for them)
Assignment 1: Visualization Design
Due by noon on Mon Jan 13
Design a static visualization for a data set.
You must choose the message you want to convey. What question(s) do you want to answer? What insight do you want to communicate?

16
Assignment 1: Visualization Design
Due by noon on Mon Jan 13
Pick a guiding question, use it to title your visualization
Design a static visualization for that question
You are free to use any tools (including pen & paper)
Deliverables (upload via Canvas; see A1 page)
PDF of your visualization with a short description including design rationale (≤ 4 paragraphs)
Next Monday: Design ExerciseWill review A1submissionsSo make sure you get them in on time! (noon Mon)
Will then do a redesign exerciseMake sure to bring paper, pens, etc. for sketching!

17
Image
Marks: geometric primitivespoints lines areas
Visual Variables: control mark appearancePosition (2x)
Size
Value
Texture
Color
Orientation
Shape
Semiology of GraphicsJ. Bertin, 1967
Marks and Visual Variables
18
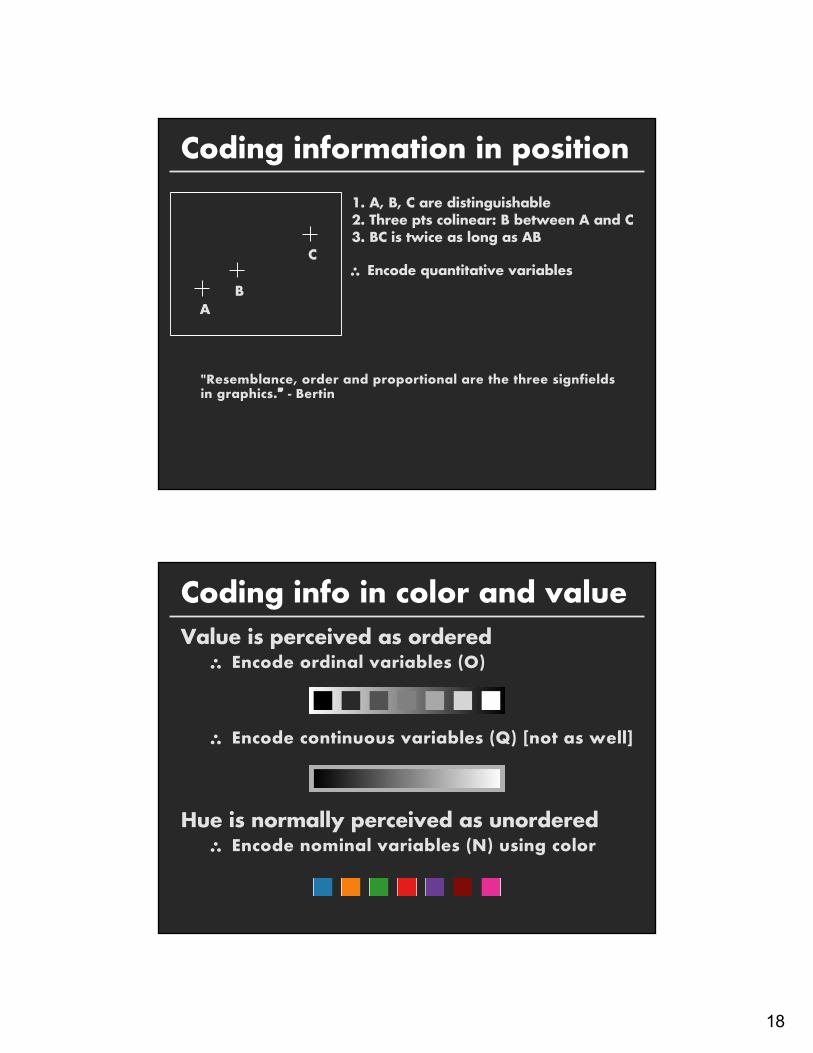
Coding information in position1. A, B, C are distinguishable 2. Three pts colinear: B between A and C 3. BC is twice as long as AB
\ Encode quantitative variables
AB
C
"Resemblance, order and proportional are the three signfields in graphics.” - Bertin
Coding info in color and valueValue is perceived as ordered
\ Encode ordinal variables (O)
\ Encode continuous variables (Q) [not as well]
Hue is normally perceived as unordered\ Encode nominal variables (N) using color

19
Bertins’ “Levels of Organization”
N Nominal O OrderedQ Quantitative
N O Q
N O Q
N O Q
N O
N
N
N
Position
Size
Value
Texture
Color
Orientation
Shape
Note: Bertin actually breaks visual variables down into differentiating (≠) and associating (º)
Note: Q < O < N
Visual Encoding

20
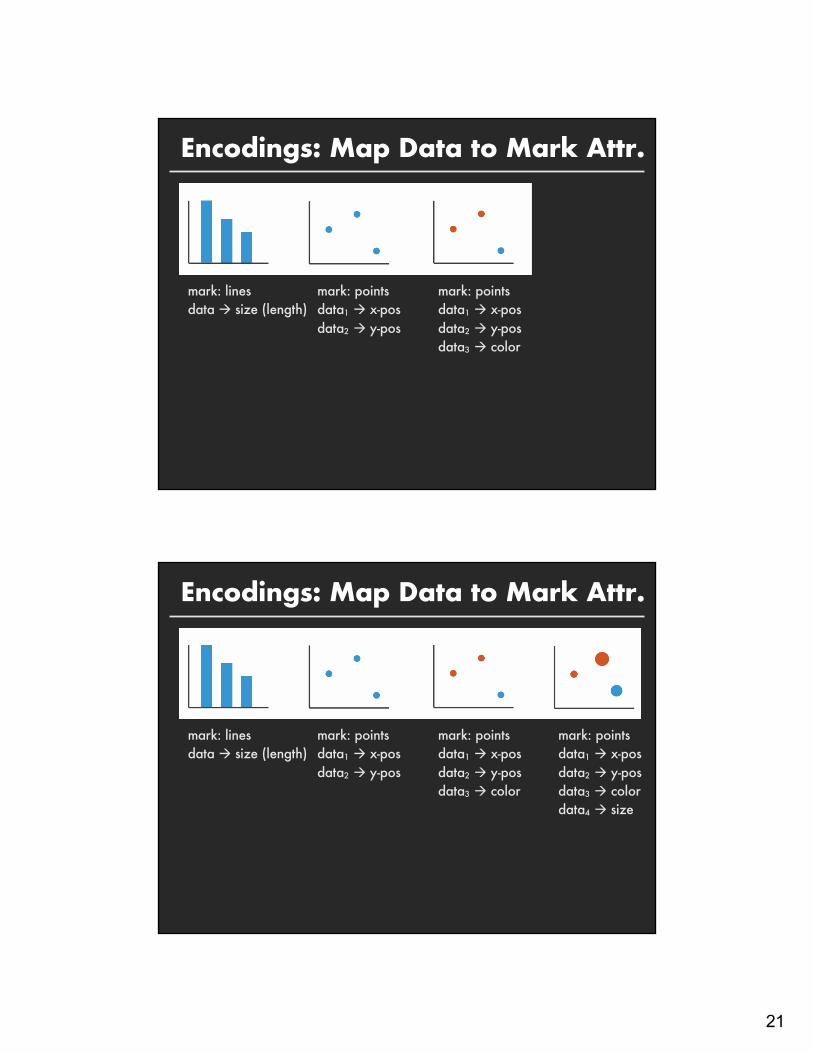
Encodings: Map Data to Mark Attr.
mark: linesdata à size (length)
mark: pointsdata1 à x-posdata2 à y-pos
mark: pointsdata1 à x-posdata2 à y-posdata3 à color
mark: pointsdata1 à x-posdata2 à y-posdata3 à colordata4 à size
Encodings: Map Data to Mark Attr.
mark: linesdata à size (length)
mark: pointsdata1 à x-posdata2 à y-pos
mark: pointsdata1 à x-posdata2 à y-posdata3 à color
mark: pointsdata1 à x-posdata2 à y-posdata3 à colordata4 à size
21
Encodings: Map Data to Mark Attr.
mark: linesdata à size (length)
mark: pointsdata1 à x-posdata2 à y-pos
mark: pointsdata1 à x-posdata2 à y-posdata3 à color
mark: pointsdata1 à x-posdata2 à y-posdata3 à colordata4 à size
Encodings: Map Data to Mark Attr.
mark: linesdata à size (length)
mark: pointsdata1 à x-posdata2 à y-pos
mark: pointsdata1 à x-posdata2 à y-posdata3 à color
mark: pointsdata1 à x-posdata2 à y-posdata3 à colordata4 à size
22
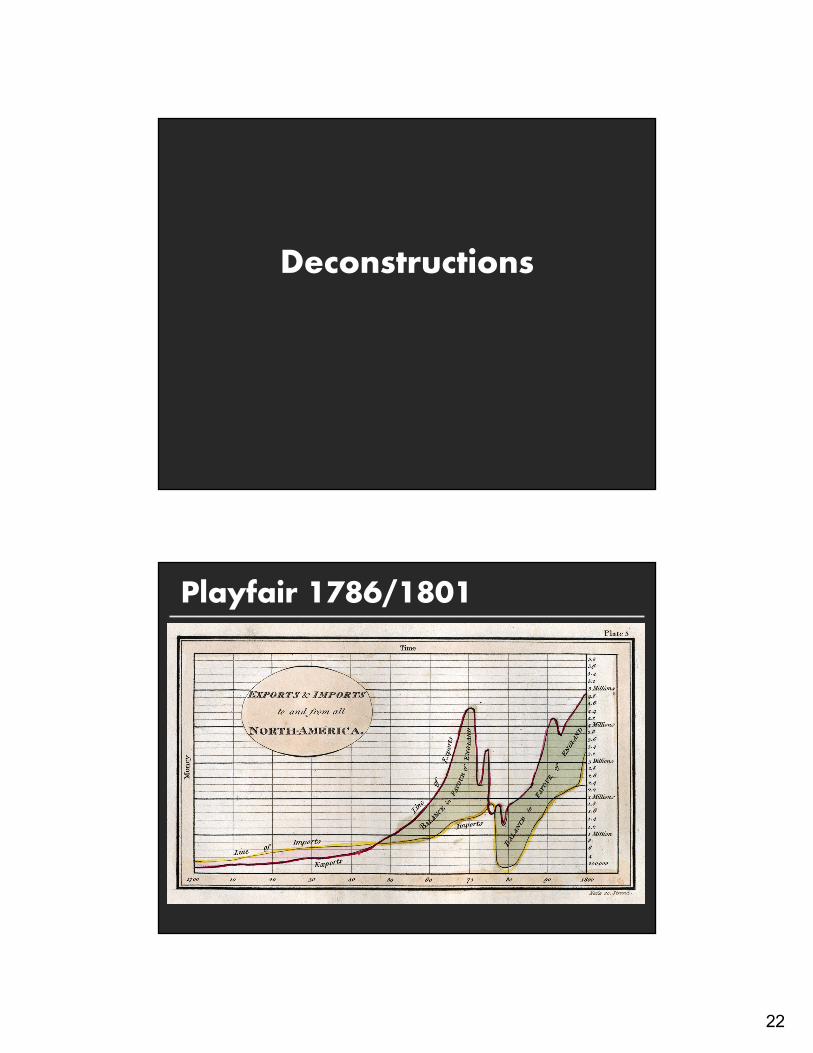
Deconstructions
Playfair 1786/1801

23
Playfair 1786/1801
■ Time à x-position (Q, linear)■ Exports/Imports Values à y-position (Q, linear)■ Exports/Imports à color (N, O)■ Balance for/against à area (maybe length??) (Q, linear)■ Balance for/against à color (N, O)
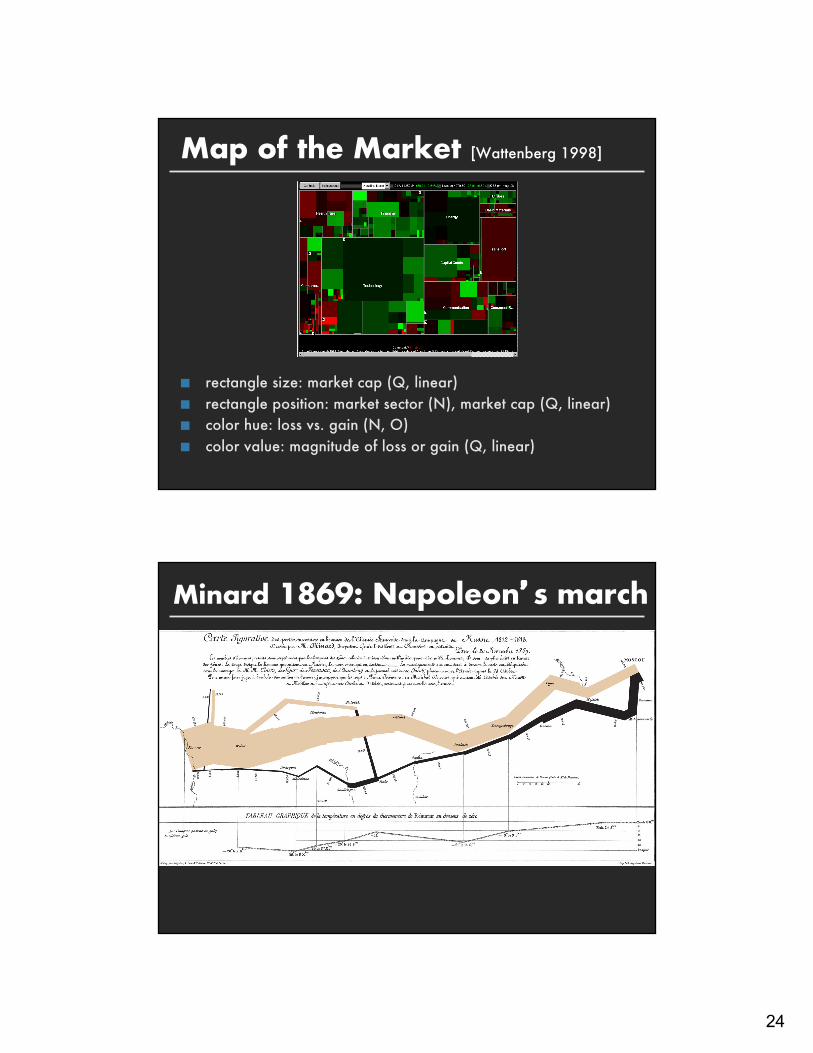
Map of the Market [Wattenberg 1998]
http://www.smartmoney.com/marketmap/
24
Map of the Market [Wattenberg 1998]
■ rectangle size: market cap (Q, linear)■ rectangle position: market sector (N), market cap (Q, linear)■ color hue: loss vs. gain (N, O)■ color value: magnitude of loss or gain (Q, linear)
Minard 1869: Napoleon’s march

25
+
Single axis composition
=[based on slide from Mackinlay]
temperature à y-position (Q, linear)
longitude à x-position (Q, linear)
Mark composition
+
=
[based on slide from Mackinlay]
temp over longitude (Q x Q)

26
latitude à y-position (Q, linear)
longitude à x-position (Q, linear)
army size à width (Q, linear)
+
Mark composition
+=
[based on slide from Mackinlay]
army position (Q x Q) and army size (Q)
latitude (Q, lin)
longitude (Q, lin)
army size (Q, lin)
temperature (Q, lin)
longitude (Q, lin)
[based on slide from Mackinlay]

27
Minard 1869: Napoleon’s march
Depicts at least 4 quantitative variablesAny others?
Automated designJock Mackinlay’s APT 86

28
Combinatorics of encodingsChallenge:
Assume 8 visual encodings and n data fieldsPick the best encoding from the exponential number of possibilities (n+1)8
PrinciplesChallenge:
Assume 8 visual encodings and n data fieldsPick the best encoding from the exponential number of possibilities (n+1)8
Principle of Consistency:The properties of the image (visual variables) should match the properties of the data
Principle of Importance Ordering:Encode the most important information in the most effective way

29
Mackinlay’s expressiveness criteriaExpressiveness
A set of facts is expressible in a visual language if the sentences (i.e. the visualizations) in the language express all the facts in the set of data, and only the facts in the data.
Cannot express the factsA one-to-many (1 ® N) relation cannot be
expressed in a single horizontal dot plot because multiple tuples are mapped to the same position
30
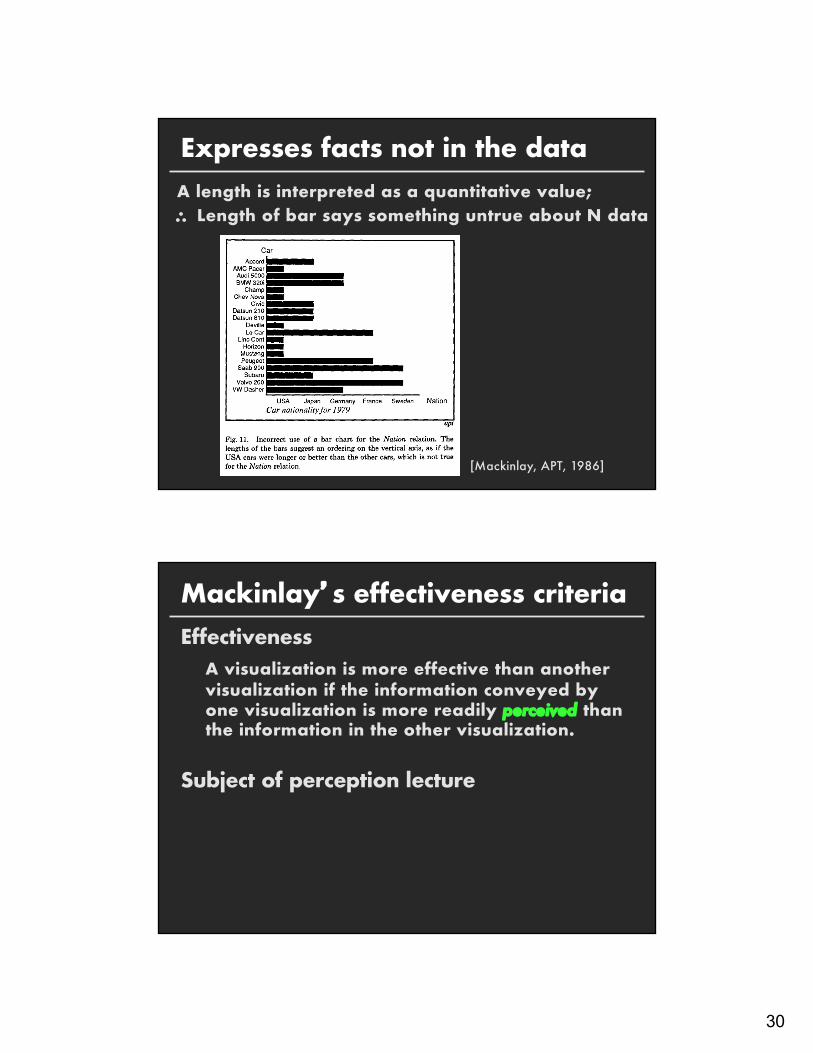
Expresses facts not in the dataA length is interpreted as a quantitative value;\ Length of bar says something untrue about N data
[Mackinlay, APT, 1986]
Mackinlay’s effectiveness criteriaEffectiveness
A visualization is more effective than another visualization if the information conveyed by one visualization is more readily perceived than the information in the other visualization.
Subject of perception lecture
31
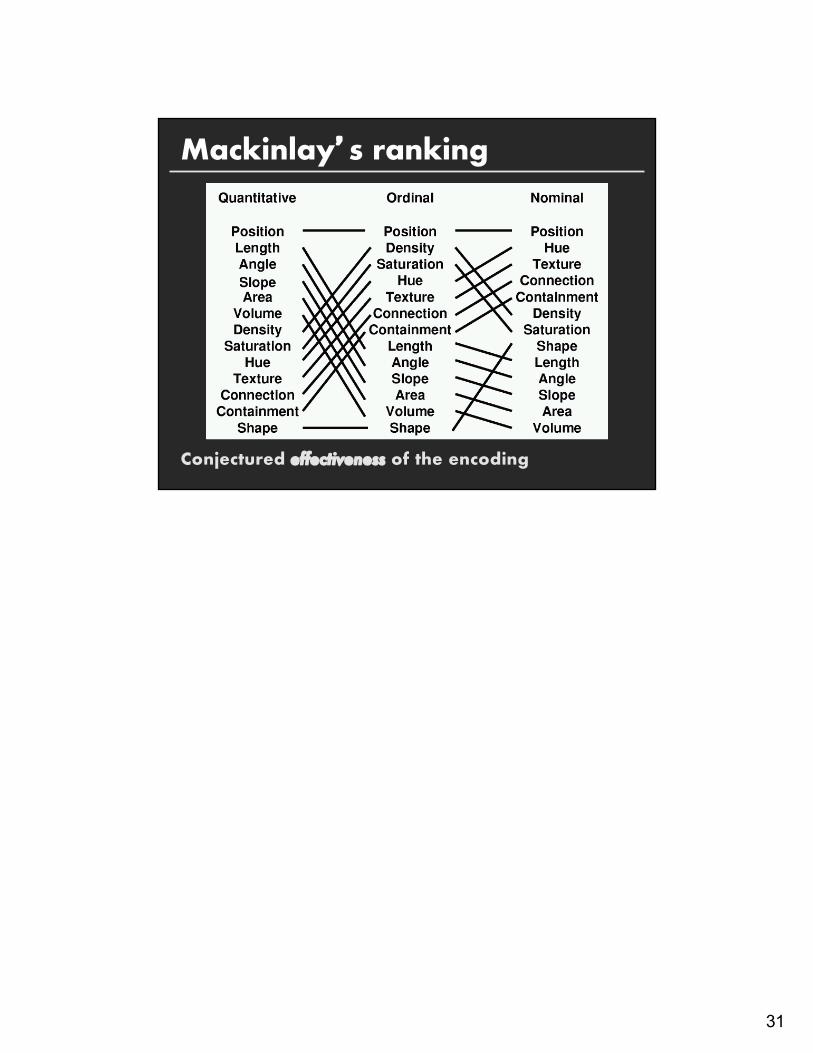
Mackinlay’s ranking
Conjectured effectiveness of the encoding