Data analytics and visualization
48
1 Presented by: Daniel & Vini
-
Upload
vini-vasundharan -
Category
Data & Analytics
-
view
74 -
download
5
Transcript of Data analytics and visualization

1
Presented by:Daniel & Vini
2
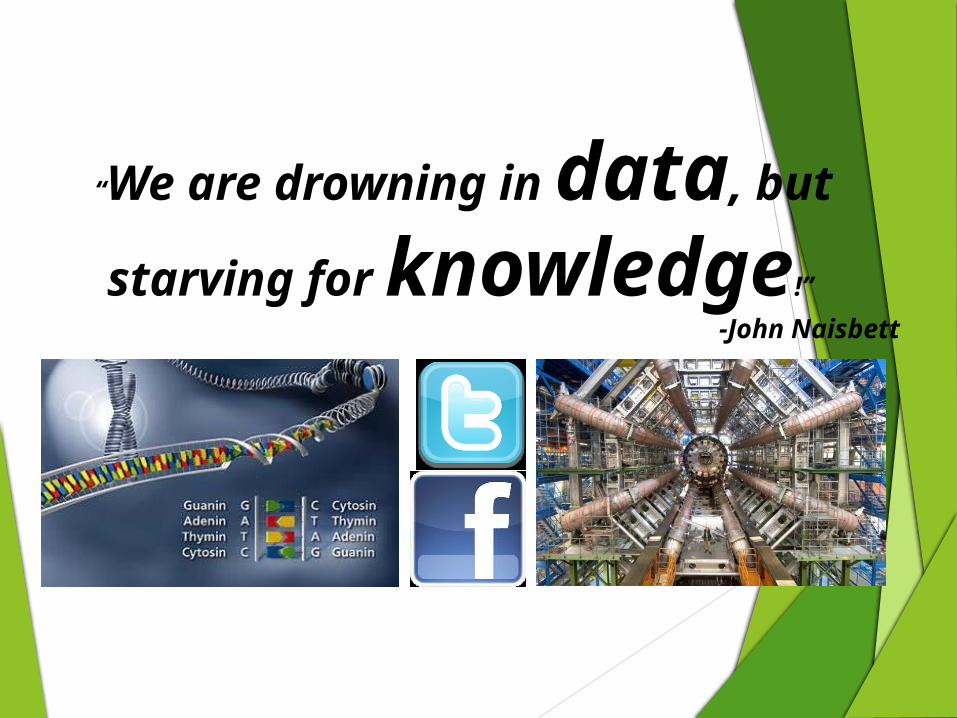
“We are drowning in data, but
starving for knowledge!” -John Naisbett
3
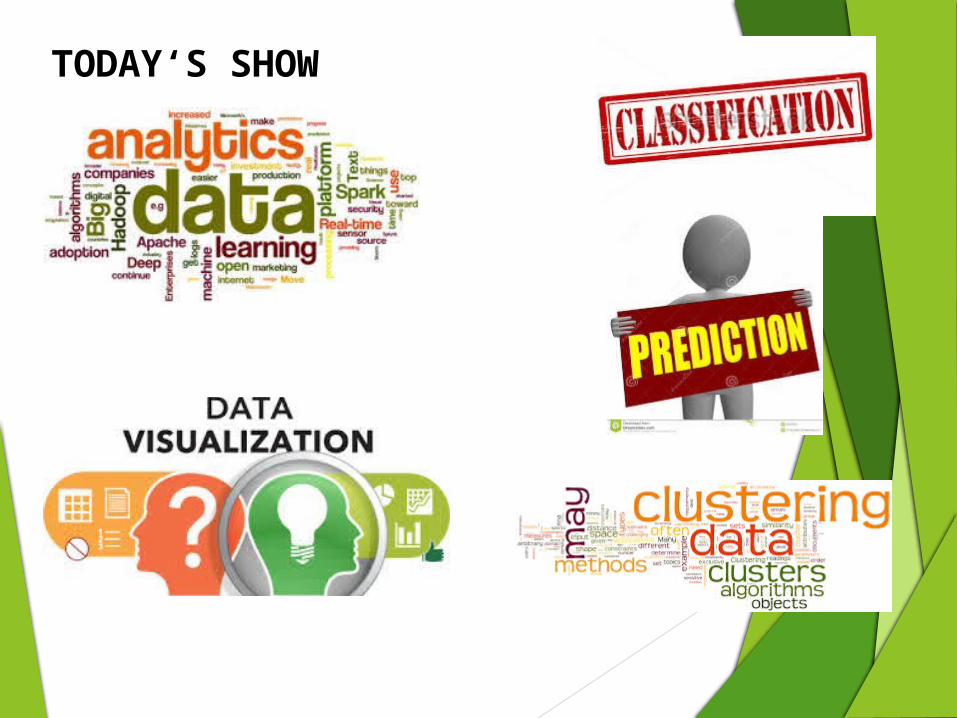
TODAY‘S SHOW
4
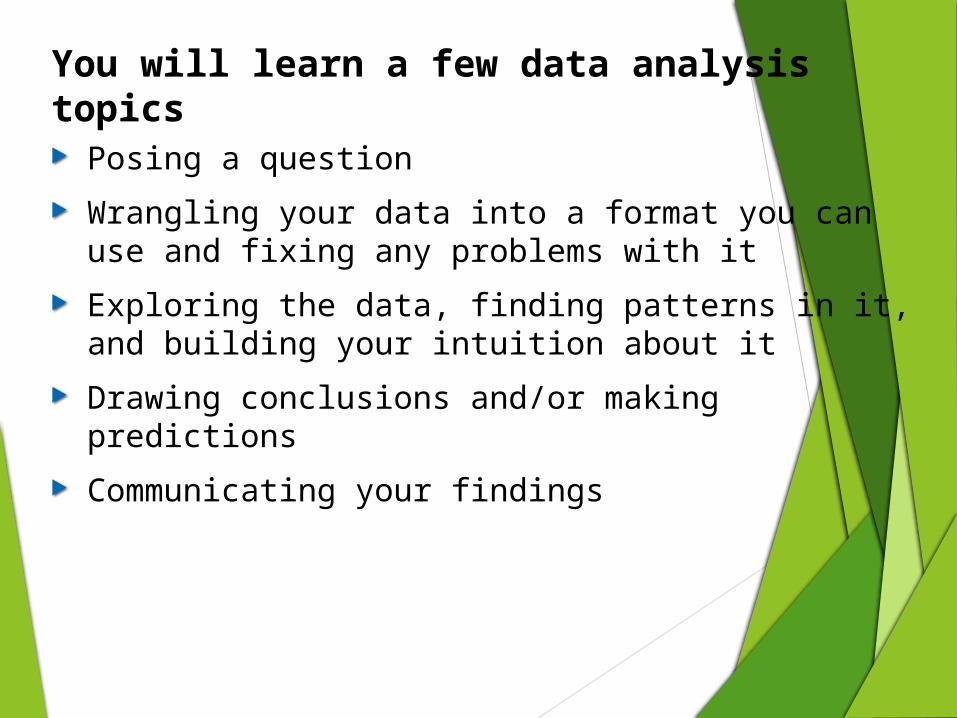
You will learn a few data analysis topics
Posing a questionWrangling your data into a format you can use and fixing any problems with itExploring the data, finding patterns in it, and building your intuition about itDrawing conclusions and/or making predictionsCommunicating your findings
5
What is Big Data Analytics?
Data analytics is an emerging technique that dives into a data set without prior set of hypothesesAccumulation of raw data captured from various sources (i.e. discussion boards, emails, exam logs, chat logs in e-learning systems) can be used to identify fruitful patterns and relationshipsExamining large amount of data
6
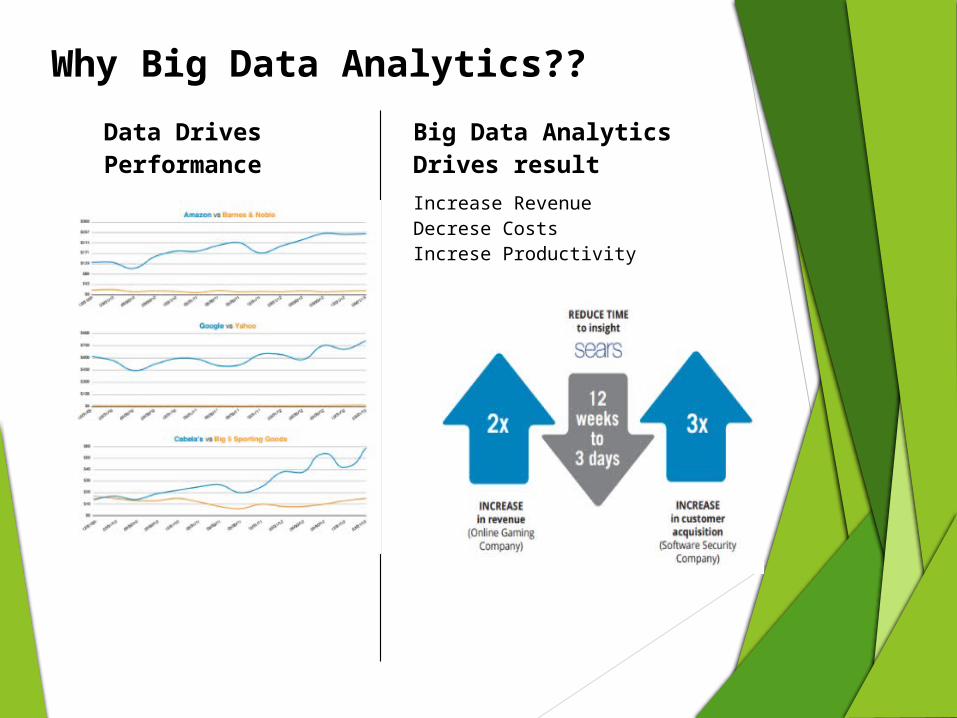
Data Drives Performance
Big Data Analytics Drives resultIncrease RevenueDecrese CostsIncrese Productivity
Why Big Data Analytics??
7
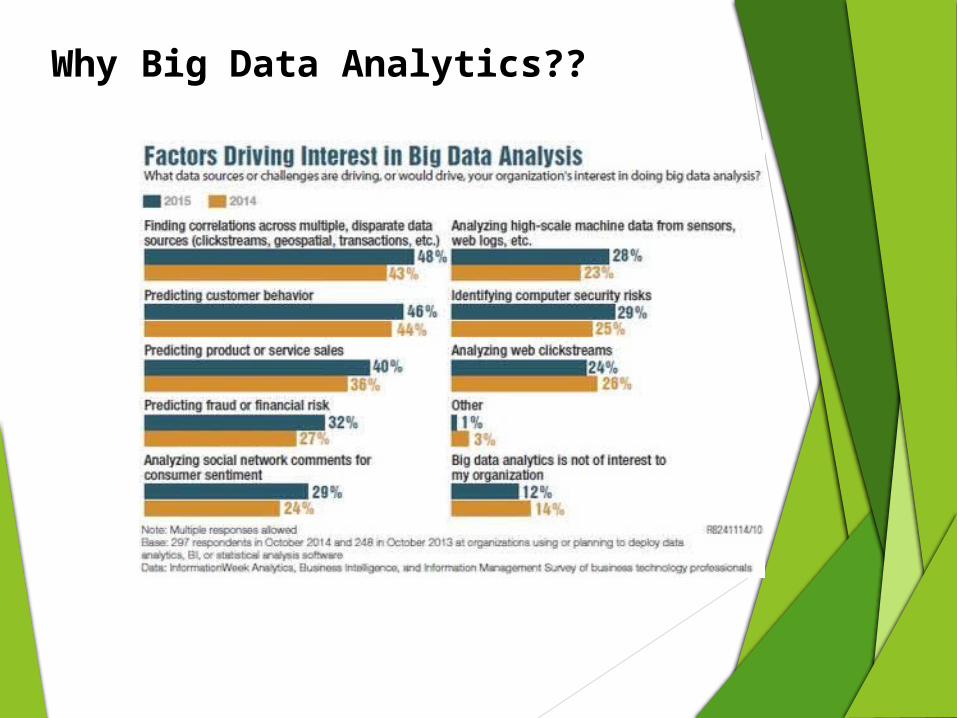
Why Big Data Analytics??
8
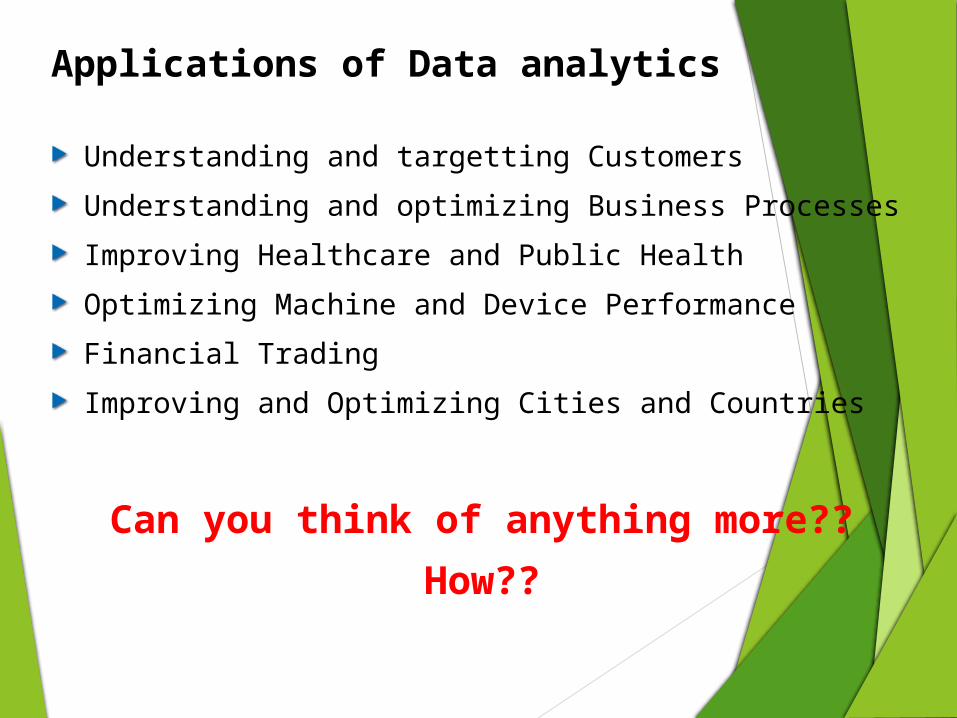
Applications of Data analytics
Understanding and targetting CustomersUnderstanding and optimizing Business ProcessesImproving Healthcare and Public HealthOptimizing Machine and Device PerformanceFinancial TradingImproving and Optimizing Cities and Countries
Can you think of anything more??How??
9
Reference Models
CRISP-DMAgile methodology: ASD-DM
10
11
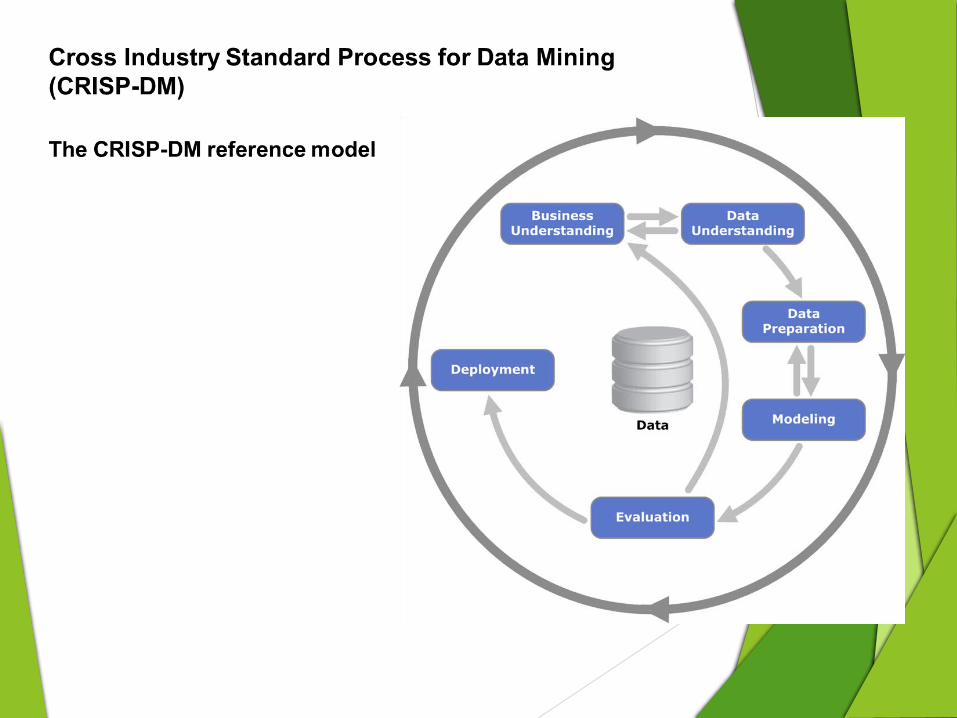
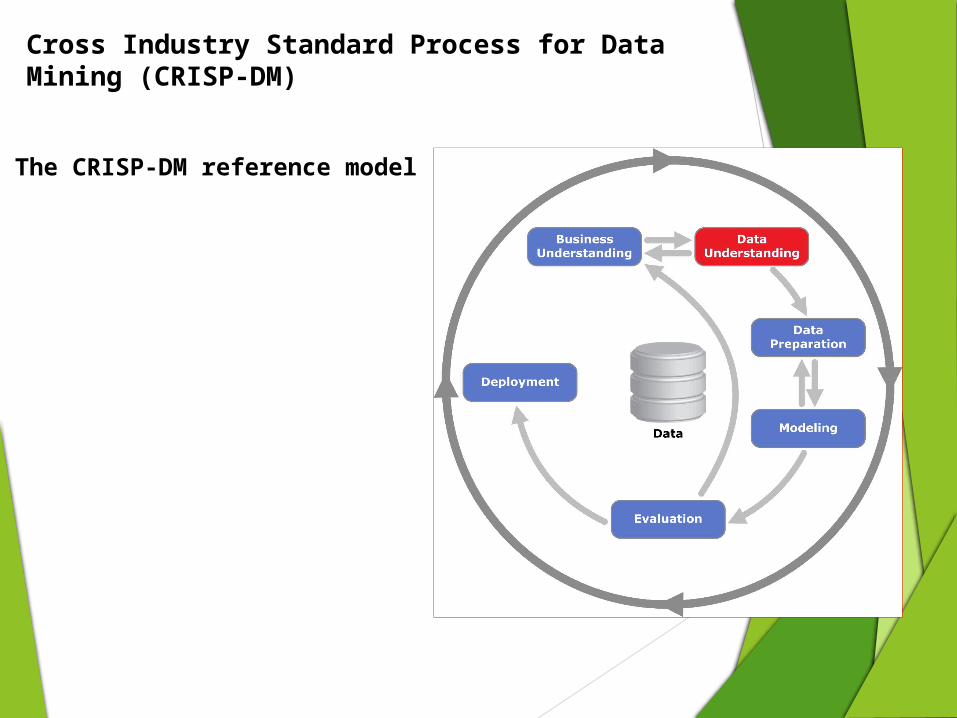
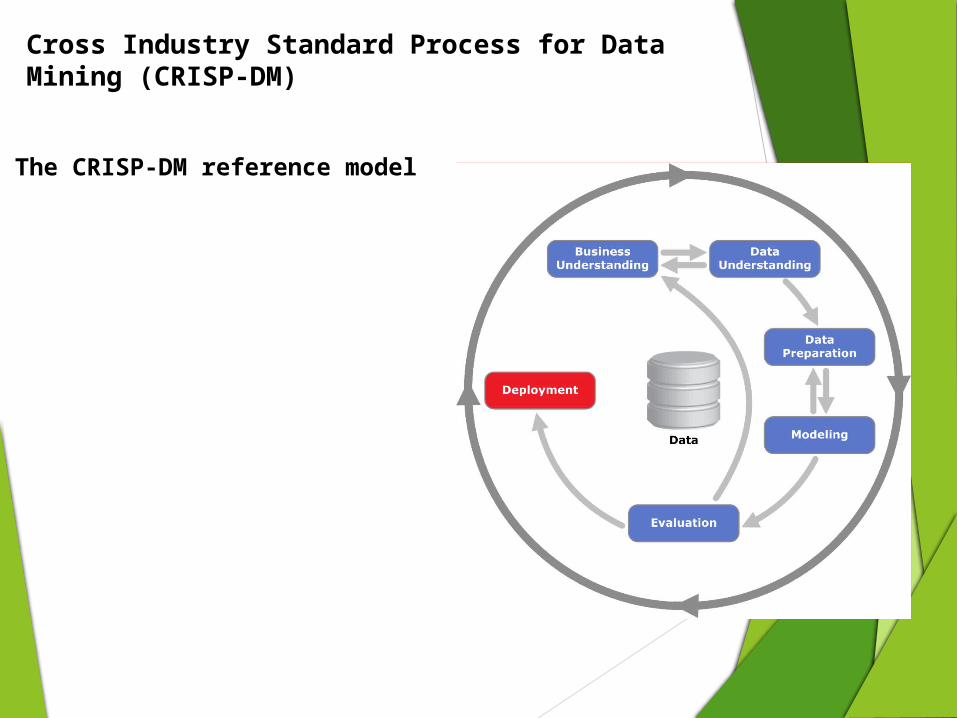
Cross Industry Standard Process for Data Mining (CRISP-DM)
The CRISP-DM reference model
12
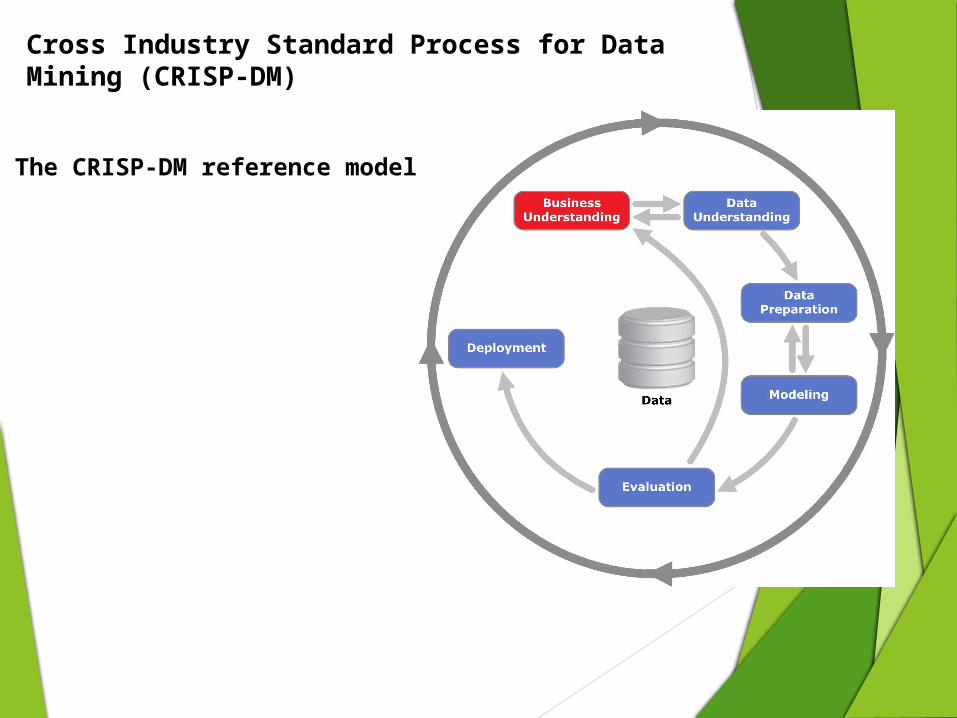
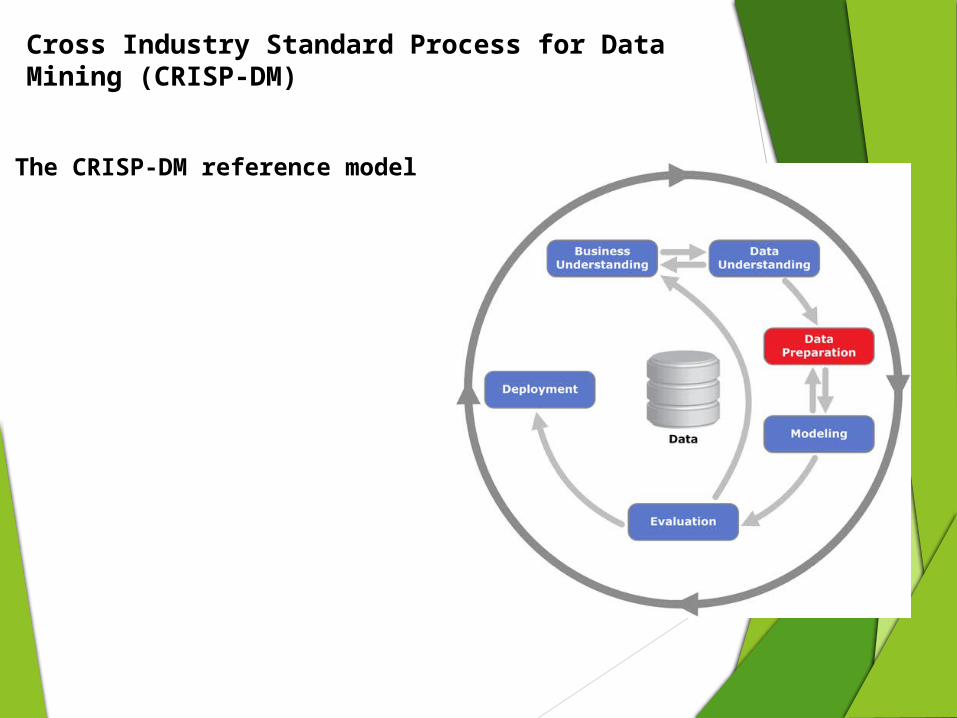
Cross Industry Standard Process for Data Mining (CRISP-DM)
The CRISP-DM reference model
13
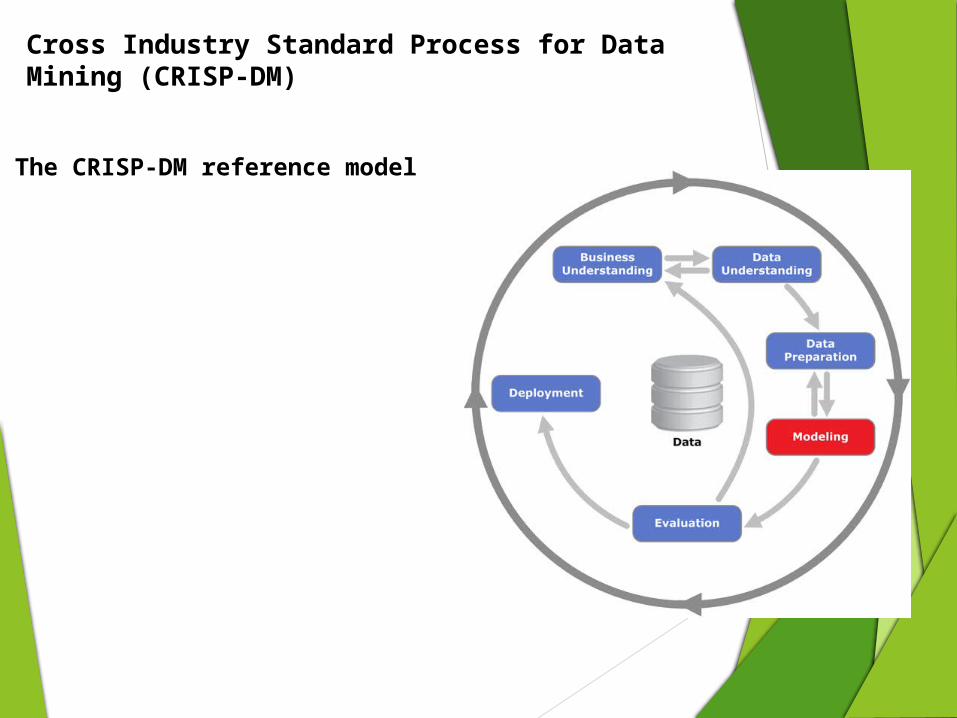
Cross Industry Standard Process for Data Mining (CRISP-DM)
The CRISP-DM reference model
14
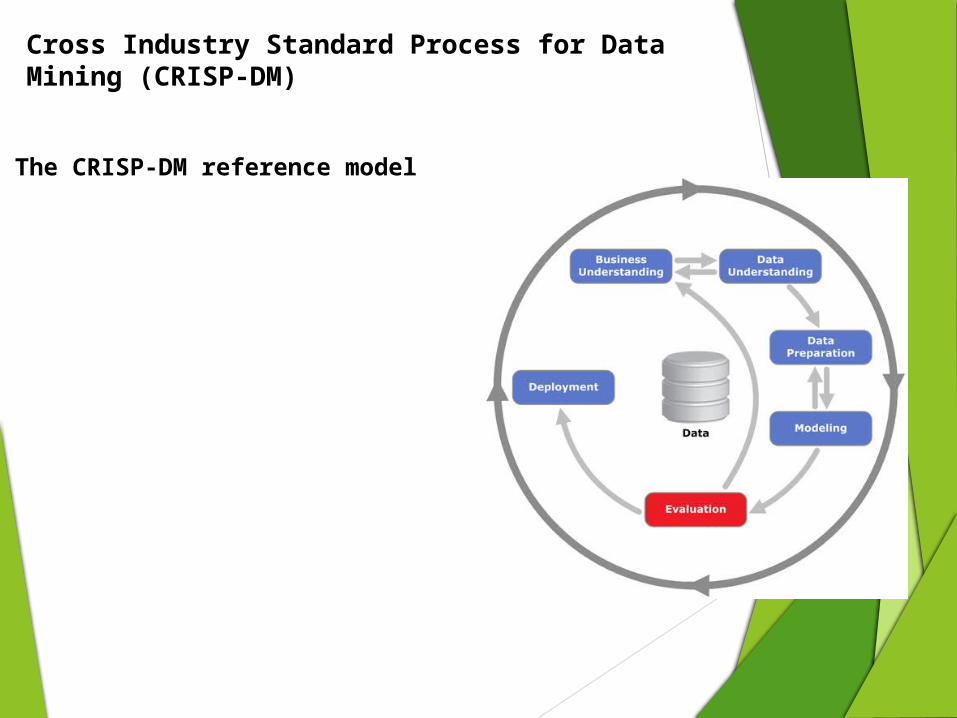
Cross Industry Standard Process for Data Mining (CRISP-DM)
The CRISP-DM reference model
15
Cross Industry Standard Process for Data Mining (CRISP-DM)
The CRISP-DM reference model
16
Cross Industry Standard Process for Data Mining (CRISP-DM)
The CRISP-DM reference model
17
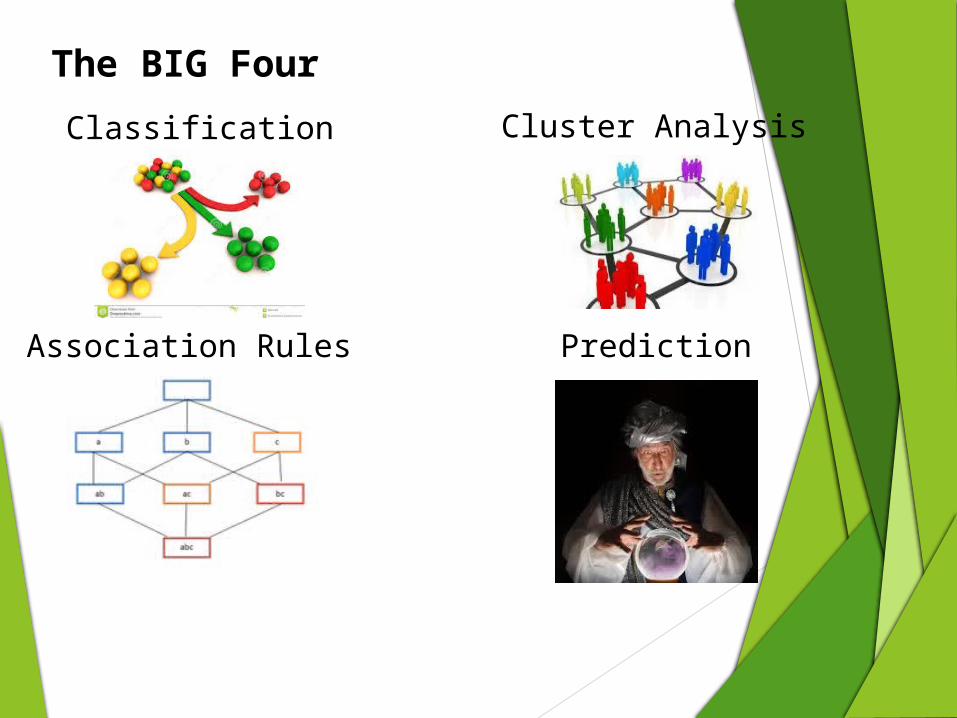
The BIG FourClassification Cluster Analysis
Association Rules Prediction
18
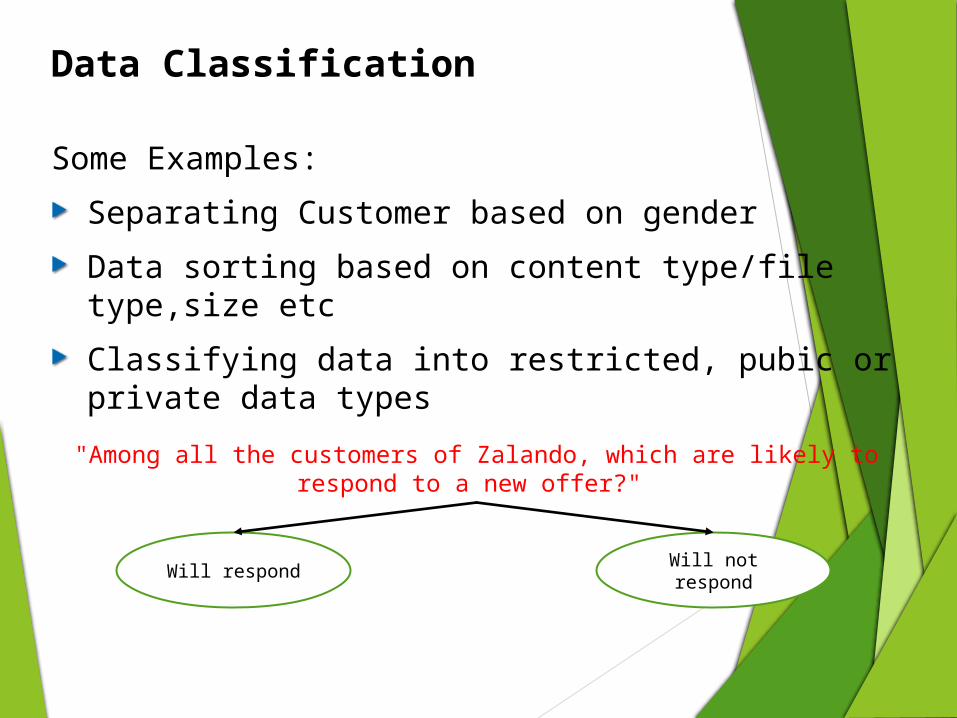
Data Classification
Some Examples:Separating Customer based on genderData sorting based on content type/file type,size etcClassifying data into restricted, pubic or private data types"Among all the customers of Zalando, which are likely to respond to a new
offer?"
Will respond Will not respond
19
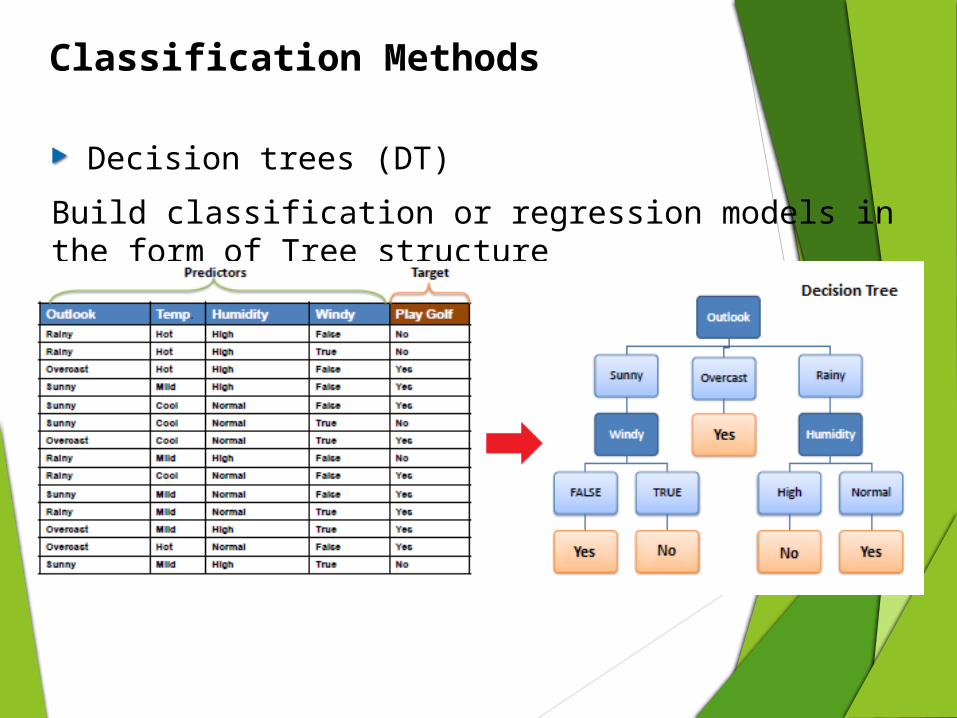
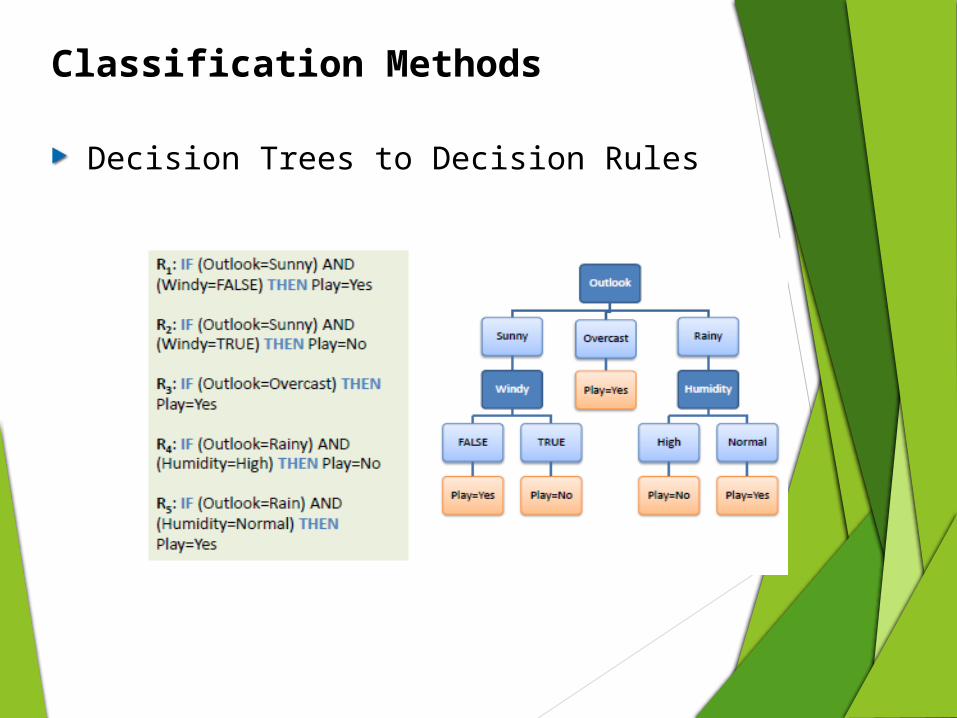
Decision trees (DT)Build classification or regression models in the form of Tree structure
Classification Methods
20
Classification Methods
Decision Trees to Decision Rules
21
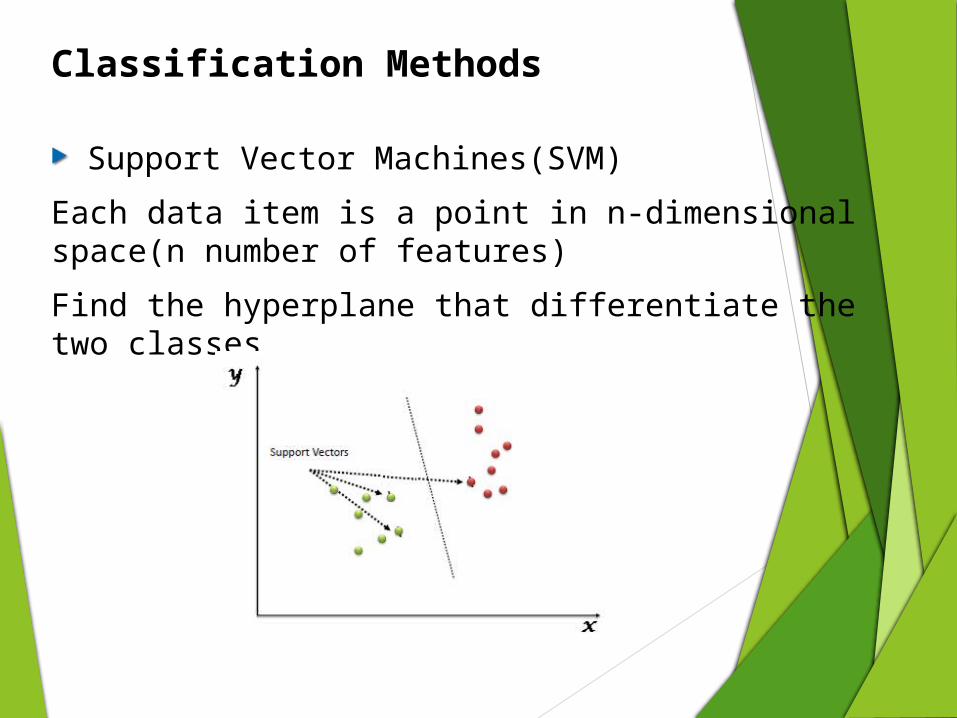
Classification Methods
Support Vector Machines(SVM)Each data item is a point in n-dimensional space(n number of features)Find the hyperplane that differentiate the two classes
22
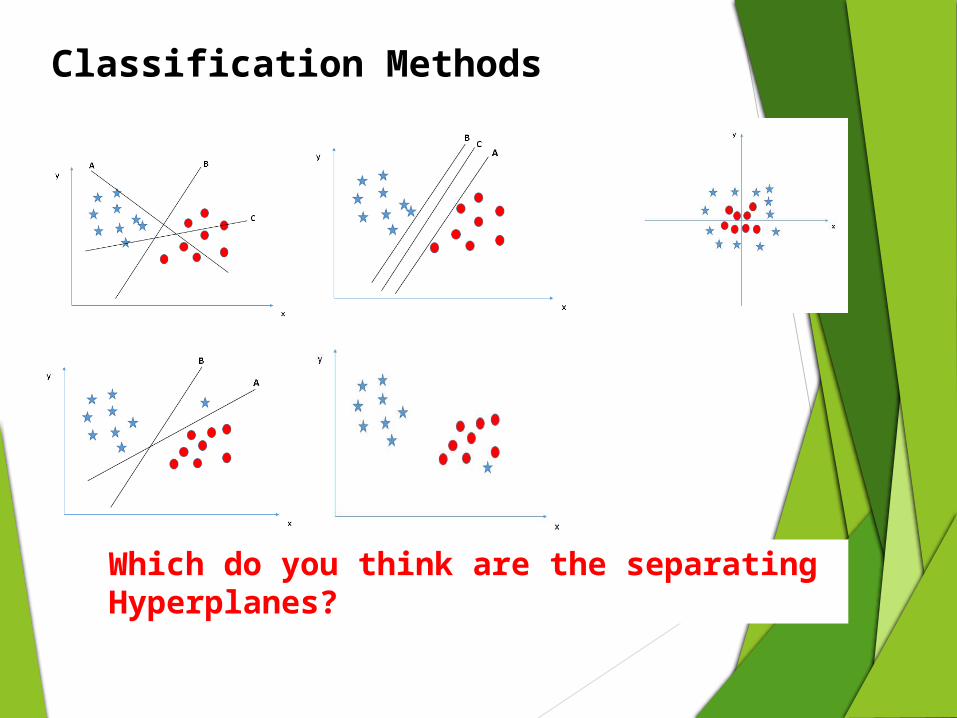
Classification Methods
Which do you think are the separating Hyperplanes?
23
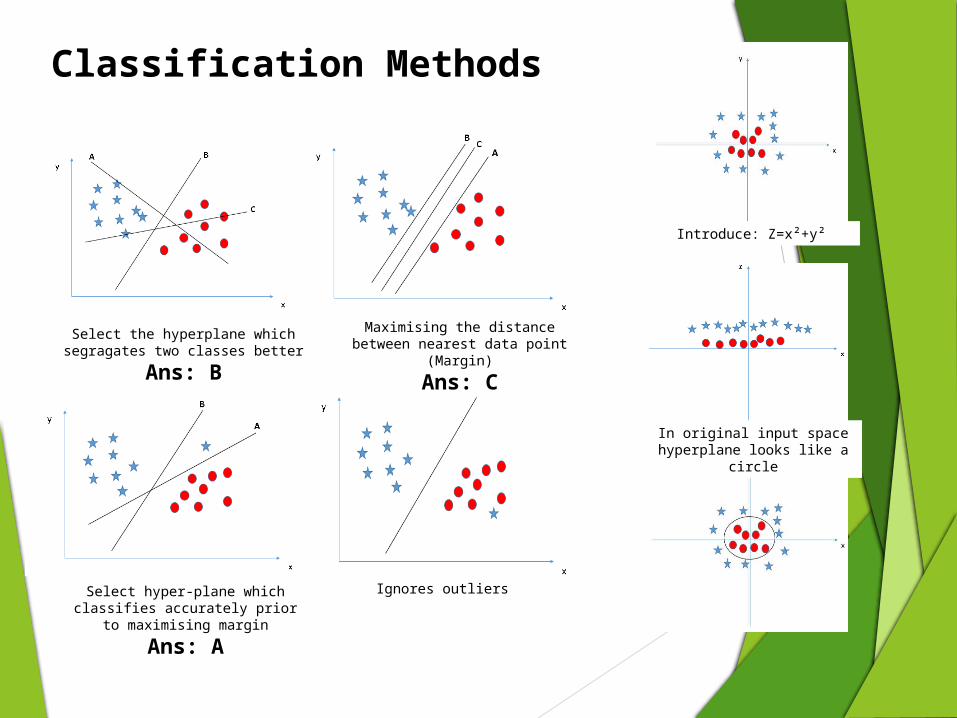
Classification Methods
Select the hyperplane which segragates two classes better
Ans: B
Maximising the distance between nearest data point (Margin)
Ans: C
Select hyper-plane which classifies accurately prior to maximising
marginAns: A
Ignores outliers
Introduce: Z=x²+y²
In original input space hyperplane looks like a circle
24
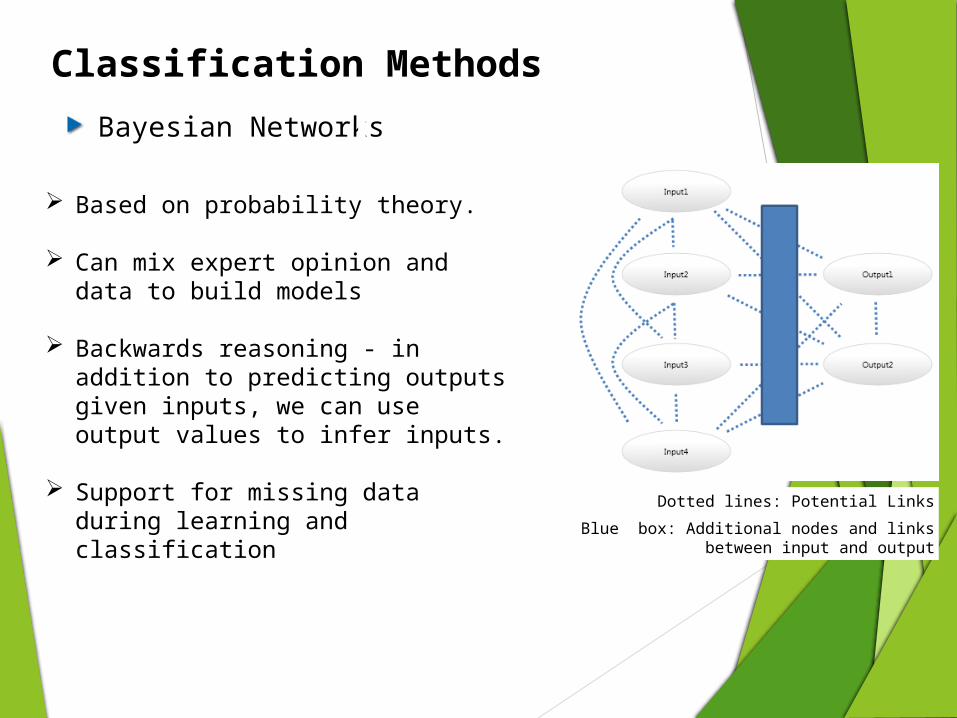
Classification MethodsBayesian Networks
Dotted lines: Potential LinksBlue box: Additional nodes and links between
input and output
Based on probability theory.
Can mix expert opinion and data to build models
Backwards reasoning - in addition to predicting outputs given inputs, we can use output values to infer inputs.
Support for missing data during learning and classification
25
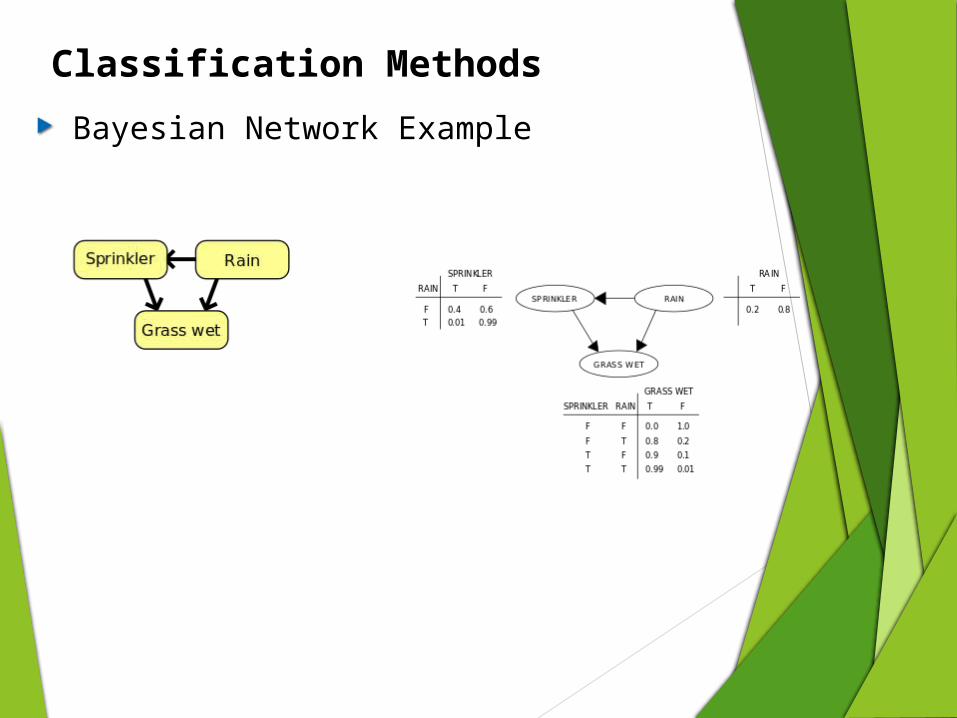
Classification MethodsBayesian Network Example
26
Association Rules
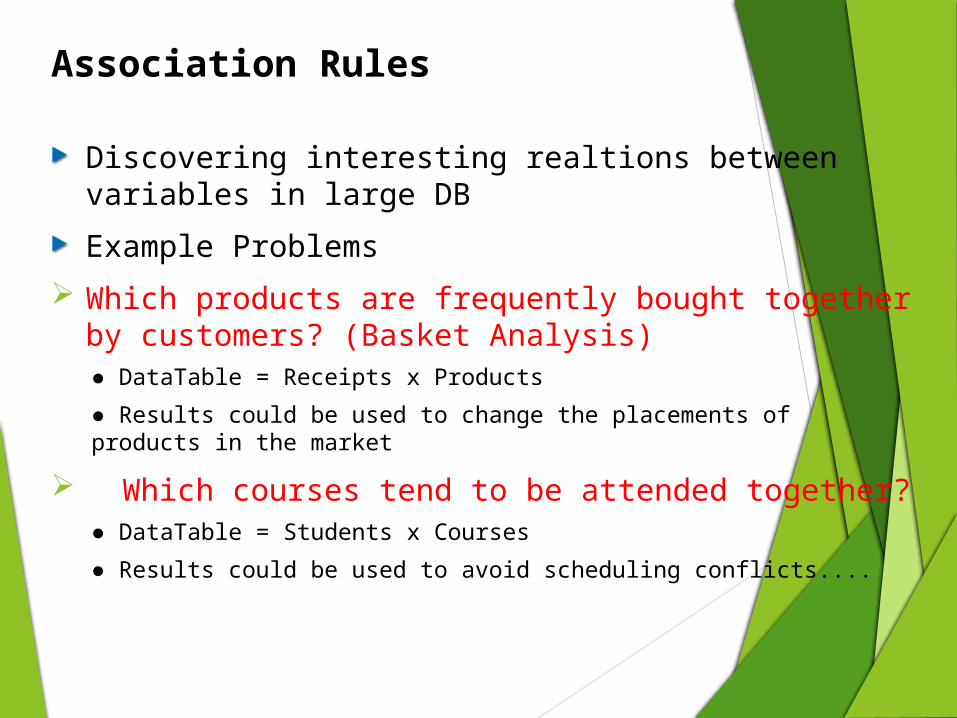
Discovering interesting realtions between variables in large DBExample Problems
Which products are frequently bought together by customers? (Basket Analysis) ● DataTable = Receipts x Products ● Results could be used to change the placements of products in the market
Which courses tend to be attended together? ● DataTable = Students x Courses ● Results could be used to avoid scheduling conflicts....
27
Association Rules
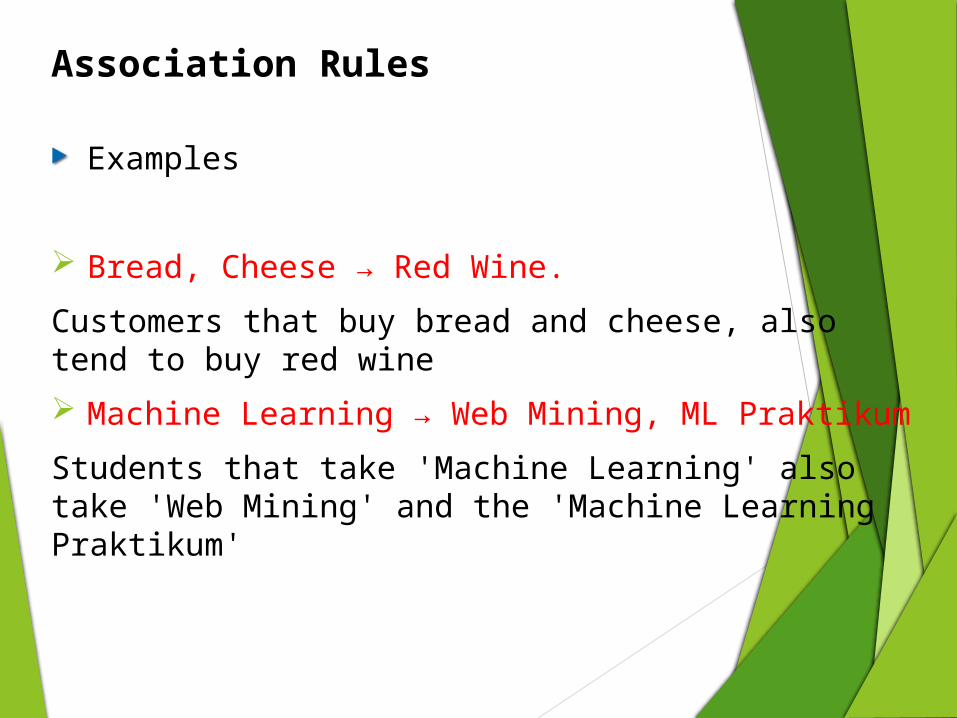
Examples
Bread, Cheese → Red Wine. Customers that buy bread and cheese, also tend to buy red wine Machine Learning → Web Mining, ML PraktikumStudents that take 'Machine Learning' also take 'Web Mining' and the 'Machine Learning Praktikum'
28
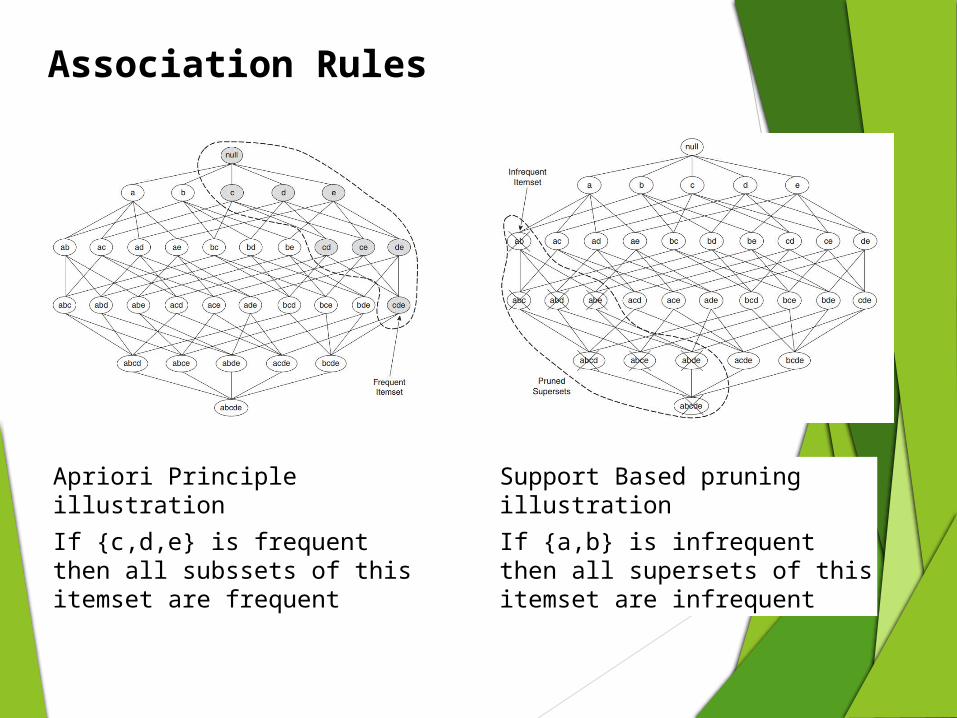
Apriori Principle illustrationIf {c,d,e} is frequent then all subssets of this itemset are frequent
Support Based pruning illustrationIf {a,b} is infrequent then all supersets of this itemset are infrequent
Association Rules
29
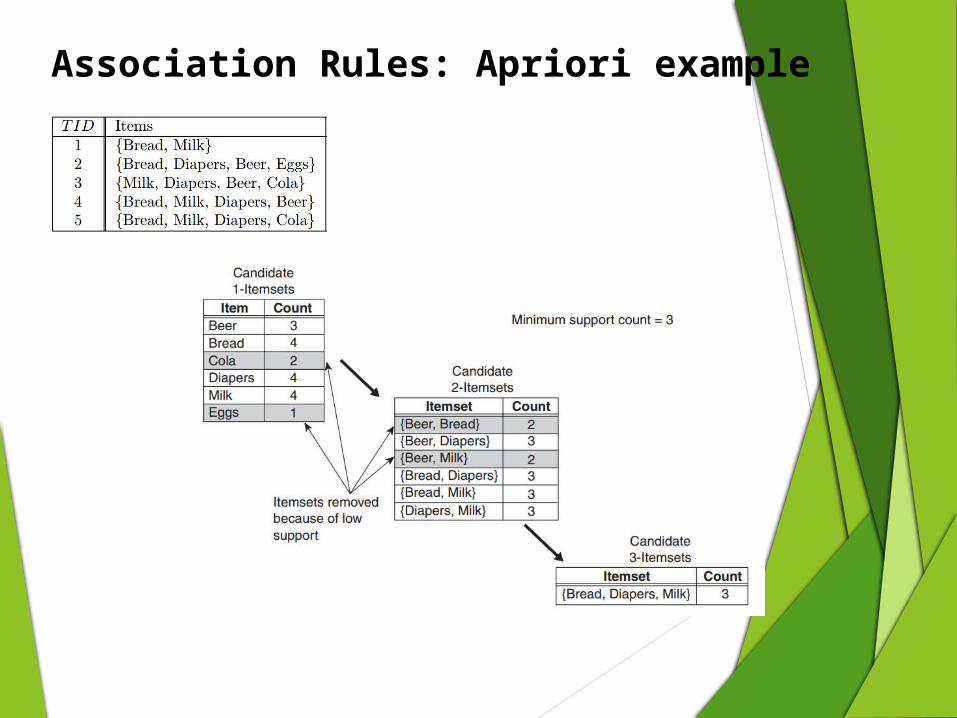
Association Rules: Apriori example
30
Cluster analysis
Task of grouping a set of objects in such a way that objects in the same group (called a cluster) are more similar (in some sense or another) to each other than to those in other groups (clusters).Examples
Biology: What is the taxonomy of the species?Education: What are student groups that need special attention?Business: What are the customer segments?
31
Clustering workflow
32
Cluster analysis
Methodologies
K-Means ClusteringHierarchical ClusteringAnd many more!!
33
K-means clustering
k-means clustering aims to partition n observations into k clusters in which each observation belongs to the cluster with the nearest mean, serving as a prototype of the clusterUnsupervised learning algorithmDefine k centroids, one for each clusterTake each point in the data set and associate it to the nearest centroidRecalculate the centroidsRepeat until the centroid doesnt move
34
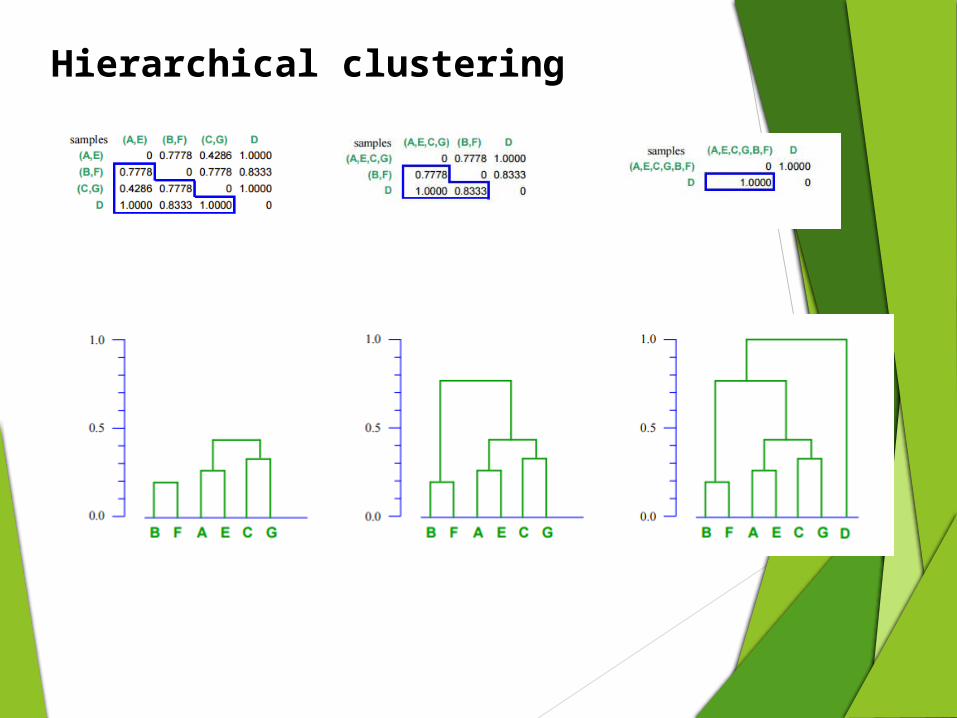
Hierarchical clustering
Groups data over a variety of scales by creating a cluster tree or dendrogram.Find the similarity or dissimilarity between every pair of objects in the data set.Group the objects into a binary, hierarchical cluster tree.Determine where to cut the hierarchical tree into clusters
35
Hierarchical clustering
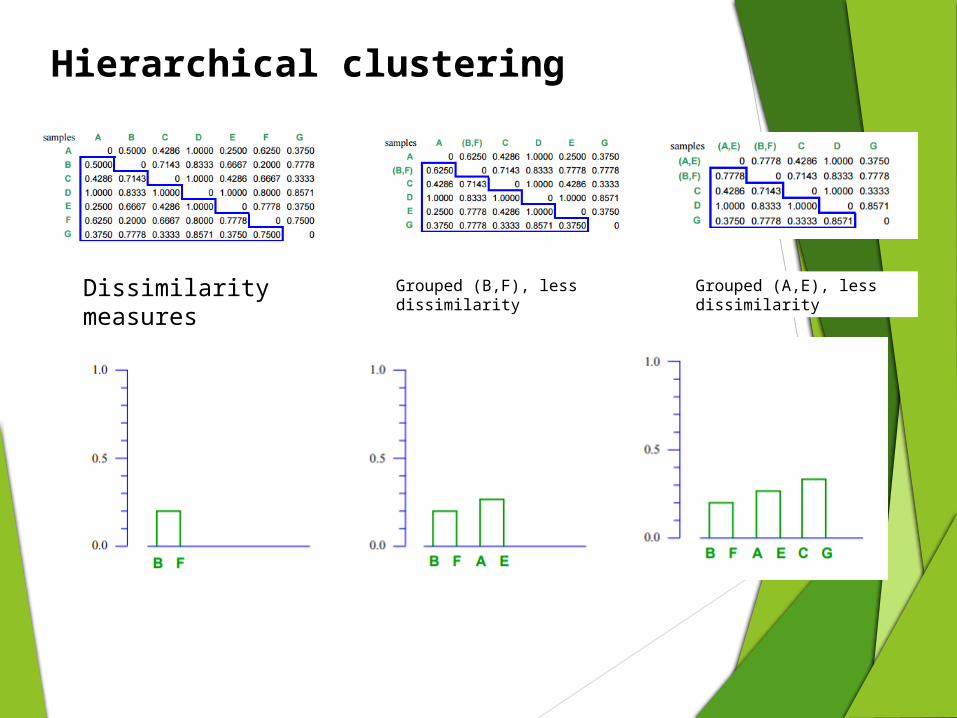
Dissimilarity measures
Grouped (B,F), less dissimilarity
Grouped (A,E), less dissimilarity
36
Hierarchical clustering
37
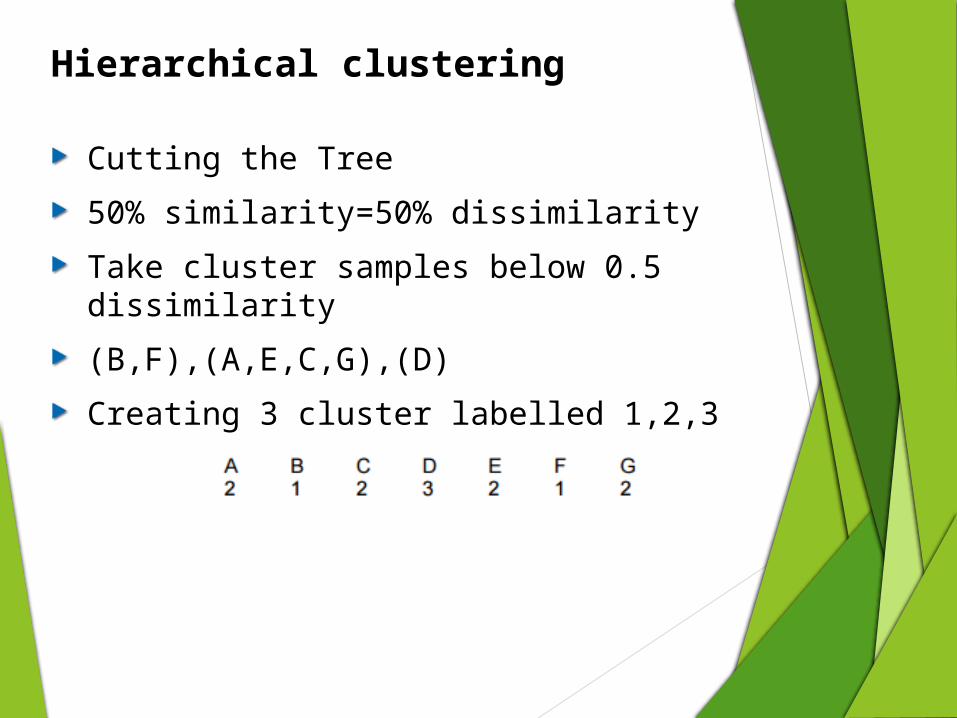
Hierarchical clustering
Cutting the Tree50% similarity=50% dissimilarityTake cluster samples below 0.5 dissimilarity(B,F),(A,E,C,G),(D)Creating 3 cluster labelled 1,2,3
38
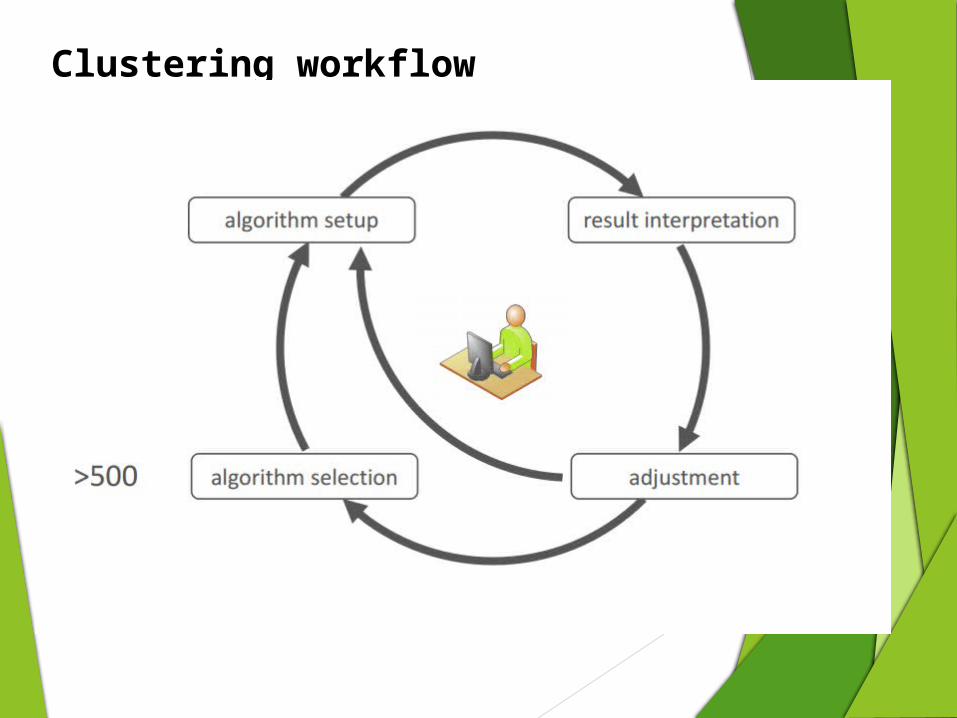
Clustering workflow
Which algorithm fits my data?Which parameters fit my data?How good is the obtained result?How to improve result quality?
39
Predictive Analytics
Make predictions about unknown future events based on past happenings
Why now? Growing volumes and types of data, and more
interest in using data to produce valuable insights. Faster, cheaper computers. Easier-to-use software. Tougher economic conditions and a need for
competitive differentiation.
40
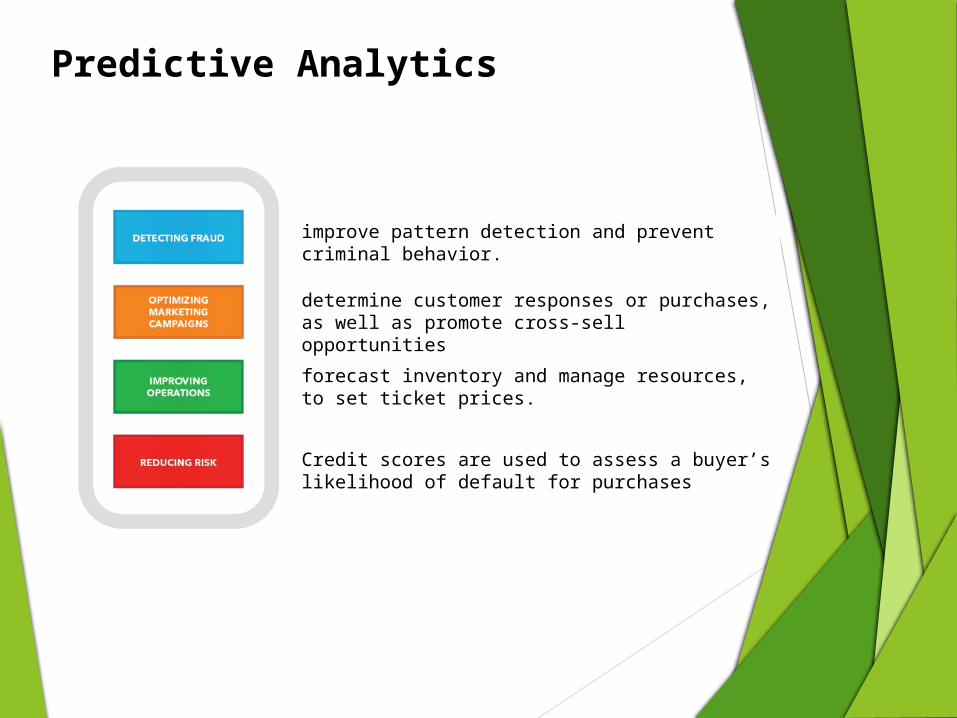
Predictive Analytics
improve pattern detection and prevent criminal behavior.
determine customer responses or purchases, as well as promote cross-sell opportunities
forecast inventory and manage resources, to set ticket prices.
Credit scores are used to assess a buyer’s likelihood of default for purchases
41
Data Visualization
Data visualization is the process of converting raw data into easily understood pictures of information that enable fast and effective decisions.Visualization plays the key role in the efficient communication of information (especially with large amounts of information).Visualization is used as a "check" to verify / falsify results of automatic data analysis.
42
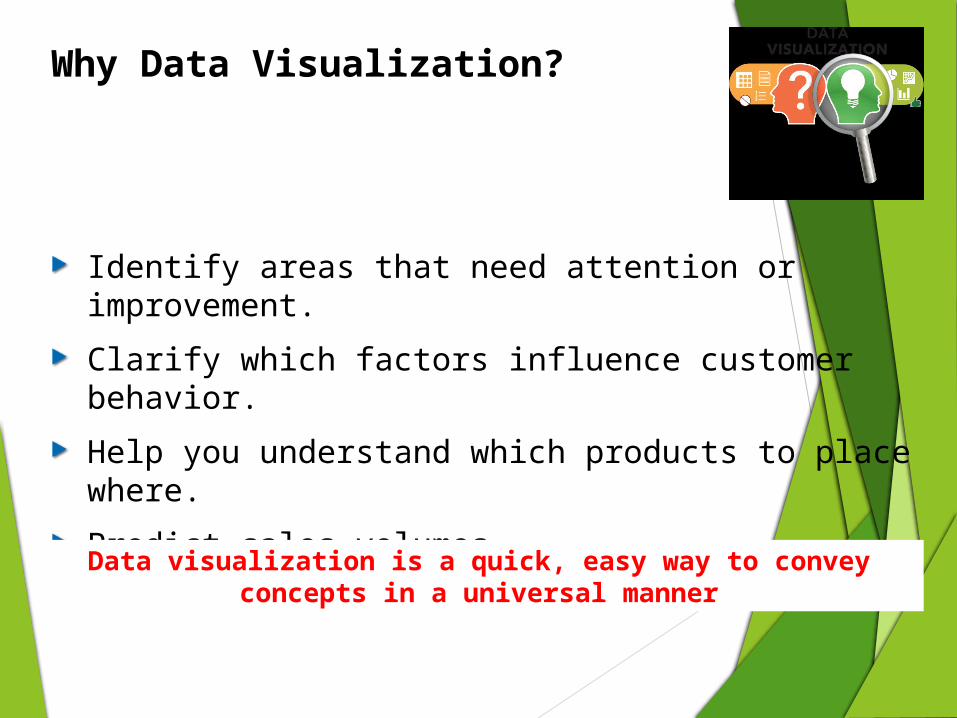
Why Data Visualization?
Identify areas that need attention or improvement.Clarify which factors influence customer behavior.Help you understand which products to place where.Predict sales volumes.
Data visualization is a quick, easy way to convey concepts in a universal manner
43
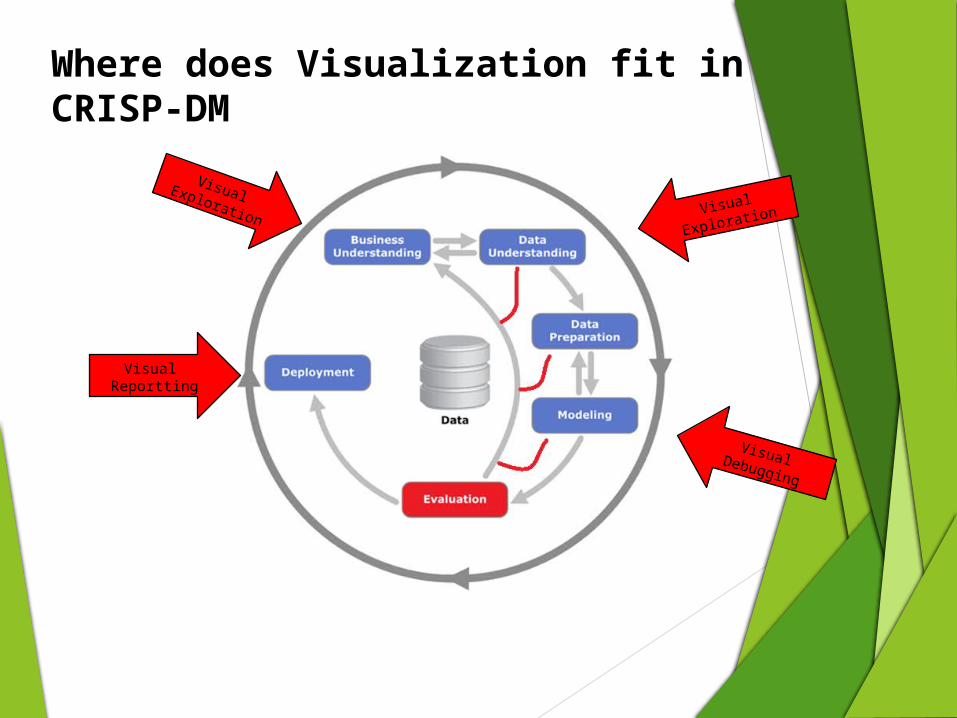
Where does Visualization fit in CRISP-DM
VisualExploration
Visual Reportting
VisualExploration
VisualDebugging
44
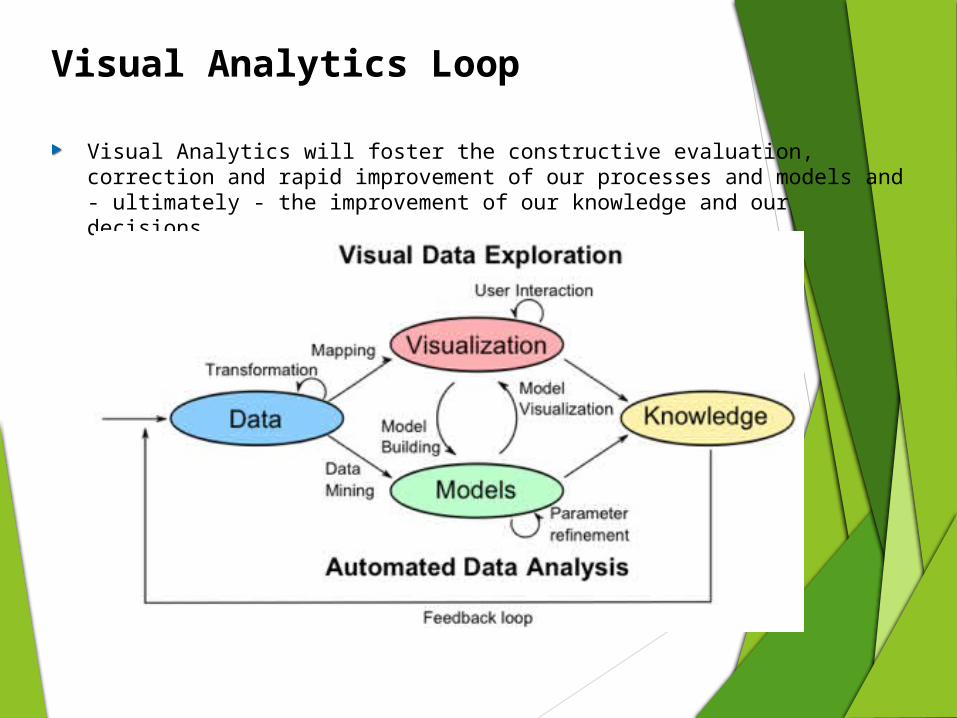
Visual Analytics Loop
Visual Analytics will foster the constructive evaluation, correction and rapid improvement of our processes and models and - ultimately - the improvement of our knowledge and our decisions
45
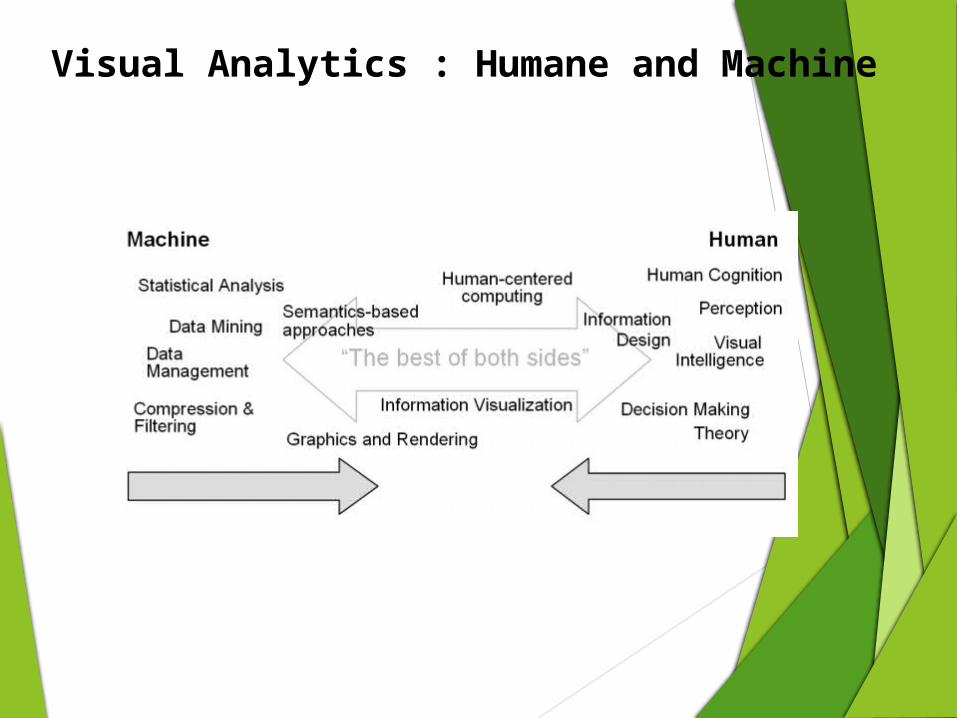
Visual Analytics : Humane and Machine
46
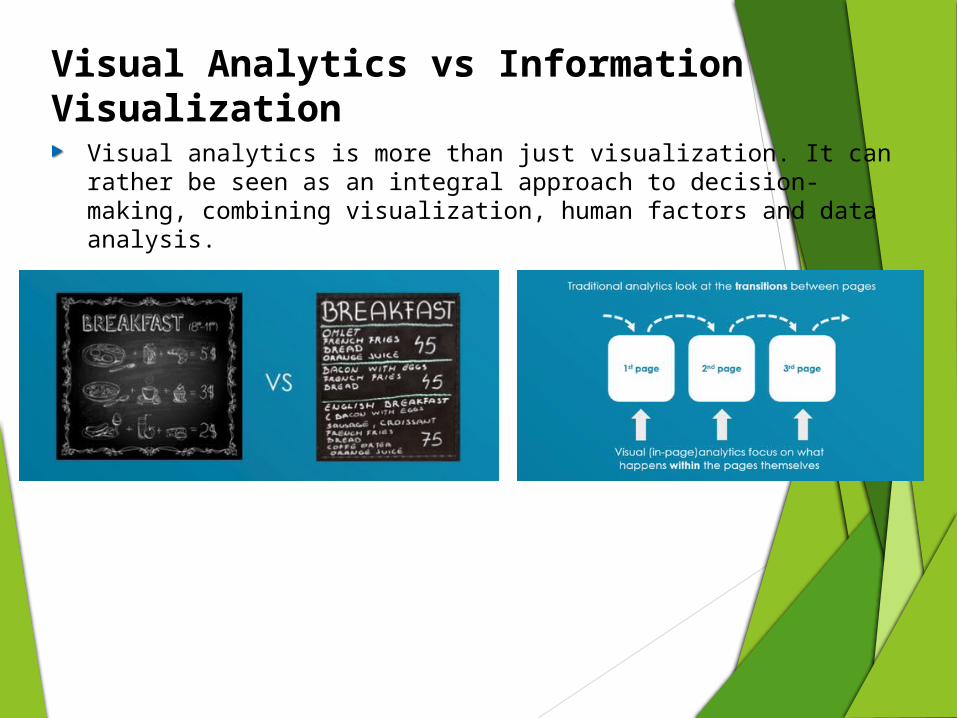
Visual Analytics vs Information Visualization
Visual analytics is more than just visualization. It can rather be seen as an integral approach to decision-making, combining visualization, human factors and data analysis.
47
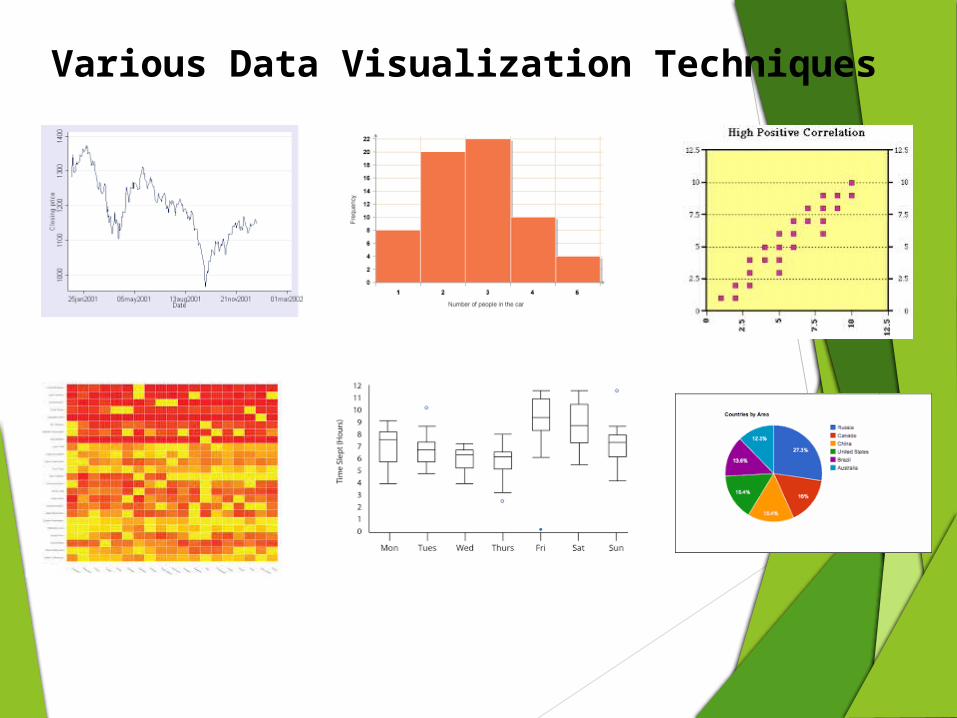
Various Data Visualization Techniques
48